Article

Spatiotemporal Variations and Key Driving Factors of Dust Storms in China’s Source Regions from 2000 to 2024

1
State Key Laboratory of Advanced Environmental Technology, Guangzhou Institute of Geochemistry, Chinese Academy of Sciences, Guangzhou 510640, China
2
University of Chinese Academy of Sciences, Beijing 100049, China
3
CMA Earth System Modeling and Prediction Centre (CEMC), Beijing 100081, China
4
State Key Laboratory of Severe Weather, Chinese Academy of Meteorological Sciences, Beijing 100081, China
5
Jinan Meteorological Bureau, Jinan 250102, China
6
Key Laboratory for Aerosol-Cloud-Precipitation of China Meteorological Administration, Collaborative Innovation Center on Forecast and Evaluation of Meteorological Disasters, Nanjing University of Information Science and Technology, Nanjing 210044, China
*
Author to whom correspondence should be addressed.
Atmosphere 2025, 16(5), 589; https://doi.org/10.3390/atmos16050589
Submission received: 17 April 2025 / Revised: 13 May 2025 / Accepted: 13 May 2025 / Published: 14 May 2025
(This article belongs to the Special Issue Atmospheric Pollution Dynamics in China)

Abstract

:
The Taklimakan Desert (TD), located in the Tarim Basin, and the Gobi Desert (GD), spanning northern China and southern Mongolia, are the two major dust source regions in East Asia, with substantial influence on China’s atmospheric environment and ecosystem. Using dust storm day (DSD) observations from national meteorological stations between 2000 and 2024, along with meteorological variables and the Normalized Difference Vegetation Index (NDVI), this study examines the spatiotemporal trends of dust storms and their key driving factors in both source regions. The TD and GD regions exhibit high levels of dust storm activity in China, with a distinct decreasing gradient from the source areas to downstream regions observed across all seasons. Trend analysis of DSD reveals distinct temporal patterns: the TD region experienced a moderate decline (−0.11 d/a) followed by a fluctuating increase (0.04 d/a), while the GD region exhibited a sharp drop (−0.32 d/a) and a subsequent marked resurgence (0.09 d/a). Seasonally, dust storm events in the TD region were frequent in both spring and summer, whereas in the GD region they were concentrated almost entirely in spring. In both source regions, spring dust storm events were closely linked to wind speed and the frequency of strong wind days. However, in summer, precipitation played a more suppressive role in the GD region, while wind remained the primary driver in the TD region. Between 2001 and 2013, both regions experienced a reduction in barren land area, aligning with a decline in dust storm events. In contrast, barren land in the GD region expanded from 2013 to 2023, accompanied by a significant increase in dust storm events. Notably, in the GD region, spring and summer NDVI values were negatively correlated with DSD, indicating stronger vegetation control over dust emission. In contrast, this relationship was weaker in the TD region, underscoring distinct ecological–meteorological interactions between the two desert systems.

1. Introduction

A dust storm is a meteorological phenomenon characterized by airborne dust reducing horizontal visibility below 1 km [1]. These events occur when strong winds interact with loose, erodible surface materials. When wind speeds exceed a critical threshold, dust particles are entrained into the atmosphere through processes such as saltation and the disintegration of soil aggregates, triggering the onset of a dust storm [2]. Dust storms are predominantly observed in arid and semi-arid regions, where low soil moisture, sparse vegetation cover, and loosely bound surface materials render the land highly susceptible to wind erosion. Such regions are recognized as global sources of atmospheric dust aerosols [3,4]. Major dust source regions emit approximately 5000 Tg of dust into the atmosphere annually [5], with the East Asian dust sources alone contributing around 600 Tg per year. It is estimated that approximately 30% of Asian dust is redeposited locally, while 50% is transported downstream by westerly jets and frontal systems, with some particles reaching as far as the west coast of North America through trans-Pacific transport [6,7]. Atmospheric dust aerosols exert complex influences on regional climate, biogeochemical cycles, and human health by modifying the surface energy balance, interacting with clouds and radiation, and affecting respiratory and cardiovascular health outcomes [8,9,10]. Furthermore, during atmospheric transport, dust particles undergo dry and wet deposition into the ocean, where the associated trace elements and nutrients can regulate marine ecological processes, thereby playing a role in the global material and energy cycles [11].
In East Asia, the Taklimakan Desert in northwestern China and the Gobi Desert along the China–Mongolia border are the two most active dust source regions. Their harsh surface and meteorological conditions, including extremely low vegetation cover, limited precipitation, high wind speeds, and large diurnal temperature ranges, create favorable conditions for frequent wind erosion [12]. Under the influence of prevailing westerly circulation, dust particles from these regions can be uplifted to altitudes of 3–5 km, enabling long-range transport across northern and eastern China [13]. Spatially, dust storms in China exhibit a distinct west to east gradient [14]. The highest occurrences are concentrated along the margins of the Taklimakan Desert, the southern Junggar Basin, the Hexi Corridor, and the Alxa Plateau, where the annual average number of DSD exceeds 10 d [15]. Other regions with relatively high dust storm frequency include the North China Plain and the Qaidam Basin [16]. In addition to spatial heterogeneity, dust storm events in China exhibit strong seasonal variation, with spring accounting for over 50% of annual events. Nevertheless, severe dust storms have also occurred in summer and autumn [17,18]. Long-term meteorological records reveal distinct decadal variability: dust storm frequency peaked during the 1950s–1970s, followed by a substantial decline in the 1980s [19]. Since 2001, the frequency of dust storms in East Asia has generally shown a downward interannual trend, while a noticeable resurgence has been observed since the 2010s [20,21]. In March 2021, northern China was struck by its most intense dust storm in the last ten years, with certain areas enduring dust storms for over five consecutive days [22]. Against this backdrop, the adverse environmental impacts of dust storms, particularly in terms of air pollution, pose threats to ecosystem stability and socioeconomic activities in China.
The frequency and intensity of dust storms result from a complex interplay between surface characteristics and atmospheric conditions [23]. Surface parameters such as soil moisture, vegetation cover, and land use define surface erodibility, while meteorological drivers, including wind speed, precipitation, and temperature, control both the emission and transport of dust particles [24,25]. Previous studies have demonstrated that higher vegetation cover and increased soil moisture in arid regions can significantly suppress dust emissions [26]. Conversely, stronger winds and more frequent high-wind events substantially increase the likelihood of dust storm occurrence [27]. Moreover, the frequency of dust storms is closely linked to meteorological variables such as precipitation [28]. Furthermore, recent research suggests that surface warming and land surface drying have played important roles in the reemergence of dust storms, although strong wind events remain the dominant immediate trigger [29,30].
However, previous studies on the spatiotemporal evolution and influencing factors of dust storms in China have largely focused on the 20th century, making it difficult to capture the new characteristics of dust storm events in recent years. This could limit our understanding of how dust source regions respond to ongoing climate variability. Against the backdrop of shifting dust storm frequency, there is an urgent need to identify the key drivers governing their occurrence. To address these knowledge gaps, this study draws on continuous meteorological records from 2000 to 2024 to investigate the spatiotemporal dynamics of dust storms across China, with a particular focus on the two major dust source regions. The study period of 2000 to 2024 was primarily chosen to capture critical transitions in dust storm activity in East Asia. These patterns reflect the combined impacts of climate variability, ecological restoration, and land surface changes, offering valuable insights into dust storm dynamics and their driving factors. In addition, this period ensures the availability of consistent and high-quality satellite datasets, particularly MODIS NDVI and land cover, enabling the reliable assessment of vegetation and land use changes. Thus, the selected timeframe balances scientific relevance with data integrity, providing a robust foundation for this study. We examine dust storm trends at interannual and seasonal scales and identify the key meteorological and surface factors driving these patterns. By updating the regional dust storm climatology and pinpointing dominant influencing factors, this work contributes to a deeper understanding of the evolving dust aerosol regime in East Asia and supports efforts in climate adaptation, environmental governance, and air quality management.

2. Data and Methods

This study utilized monthly records of dust storm days (DSD) and meteorological observations from January 2000 to December 2024. The meteorological dataset included three principal variables—relative humidity, 10 m wind speed, and precipitation—all of which are standard surface meteorological parameters measured according to international observation guidelines. All data were obtained from the National Meteorological Information Center (NMIC) of the China Meteorological Administration (https://data.cma.cn, accessed on 15 March 2025), covering observations from 712 stations across China. These datasets have undergone rigorous quality control and correction procedures conducted by the NMIC to ensure data accuracy and reliability. Dust storm events were classified in accordance with national meteorological observation standards, defined as atmospheric phenomena characterized by horizontal visibility reductions below 1 km resulting from suspended dust particle concentrations. Each day with at least one recorded dust storm event was counted as a dust storm day (DSD), with the unit expressed in days (d). Stations that recorded no visibility reductions below 1 km due to dust throughout the entire study period were excluded from the analysis. These stations were located in the densely populated southern part of China, where dust storms are extremely rare as a result of their distance from the main dust source regions. Given that this study focused on dust storm variations and meteorological drivers in source and downstream transport regions, these stations were not considered in the analysis. The final analysis included 216 stations that reported at least one dust storm event during the study period. Regional DSD averages (annual and seasonal) were computed exclusively for these active dust storm monitoring stations. Seasonal definitions followed standard climatological classifications: spring (March–May), summer (June–August), autumn (September–November), and winter (December–February of the following year). The temporal trends of DSD were quantified using ordinary least squares (OLS) linear regression, while the relationships between meteorological factors and DSD were assessed through OLS regression and Pearson correlation coefficients, thereby identifying the key drivers of dust storm variability. The statistical significance (p-value) was estimated by applying the Wald test (with the t-distribution of the test statistic) to the slope coefficient derived from OLS linear regression. In this study, a strong wind day was defined as a natural day with a daily mean wind speed ≥ 5.5 m·s−1. The number of strong wind days was subsequently calculated based on this criterion.
To evaluate the impact of land surface modifications on DSD variability, we utilized the MCD12C1 land cover dataset (2001–2023) from the Moderate Resolution Imaging Spectroradiometer (MODIS) [31]. This dataset offers the longest continuous global land cover time series at 0.05° resolution, based on the 17-class IGBP classification scheme. It enabled the robust detection of land use/land cover (LULC) transitions relevant to aeolian processes, including desert–grassland ecotones, forest–agriculture conversions, and bare soil expansion. We also utilized the MODIS MOD13C2 monthly NDVI dataset (2000–2024) [32]. Temporal NDVI analysis enabled the evaluation of vegetation-mediated dust modulation, particularly in arid regions (NDVI < 0.3) where vegetation–climate feedbacks strongly influence aeolian processes [33]. These two datasets allowed us to capture both the broader land cover changes (via MCD12C1) and the vegetation dynamics (via MOD13C2). By integrating MODIS land cover and NDVI datasets, this study assessed how changes in surface conditions influenced DSD variability. This combined analysis enhances the understanding of the relationship between dust storm frequency and environmental driving factors. All satellite data was obtained via the NASA Data Pool (https://lpdaac.usgs.gov/tools/data-pool/, accessed on 15 March 2025).

3. Results and Discussion

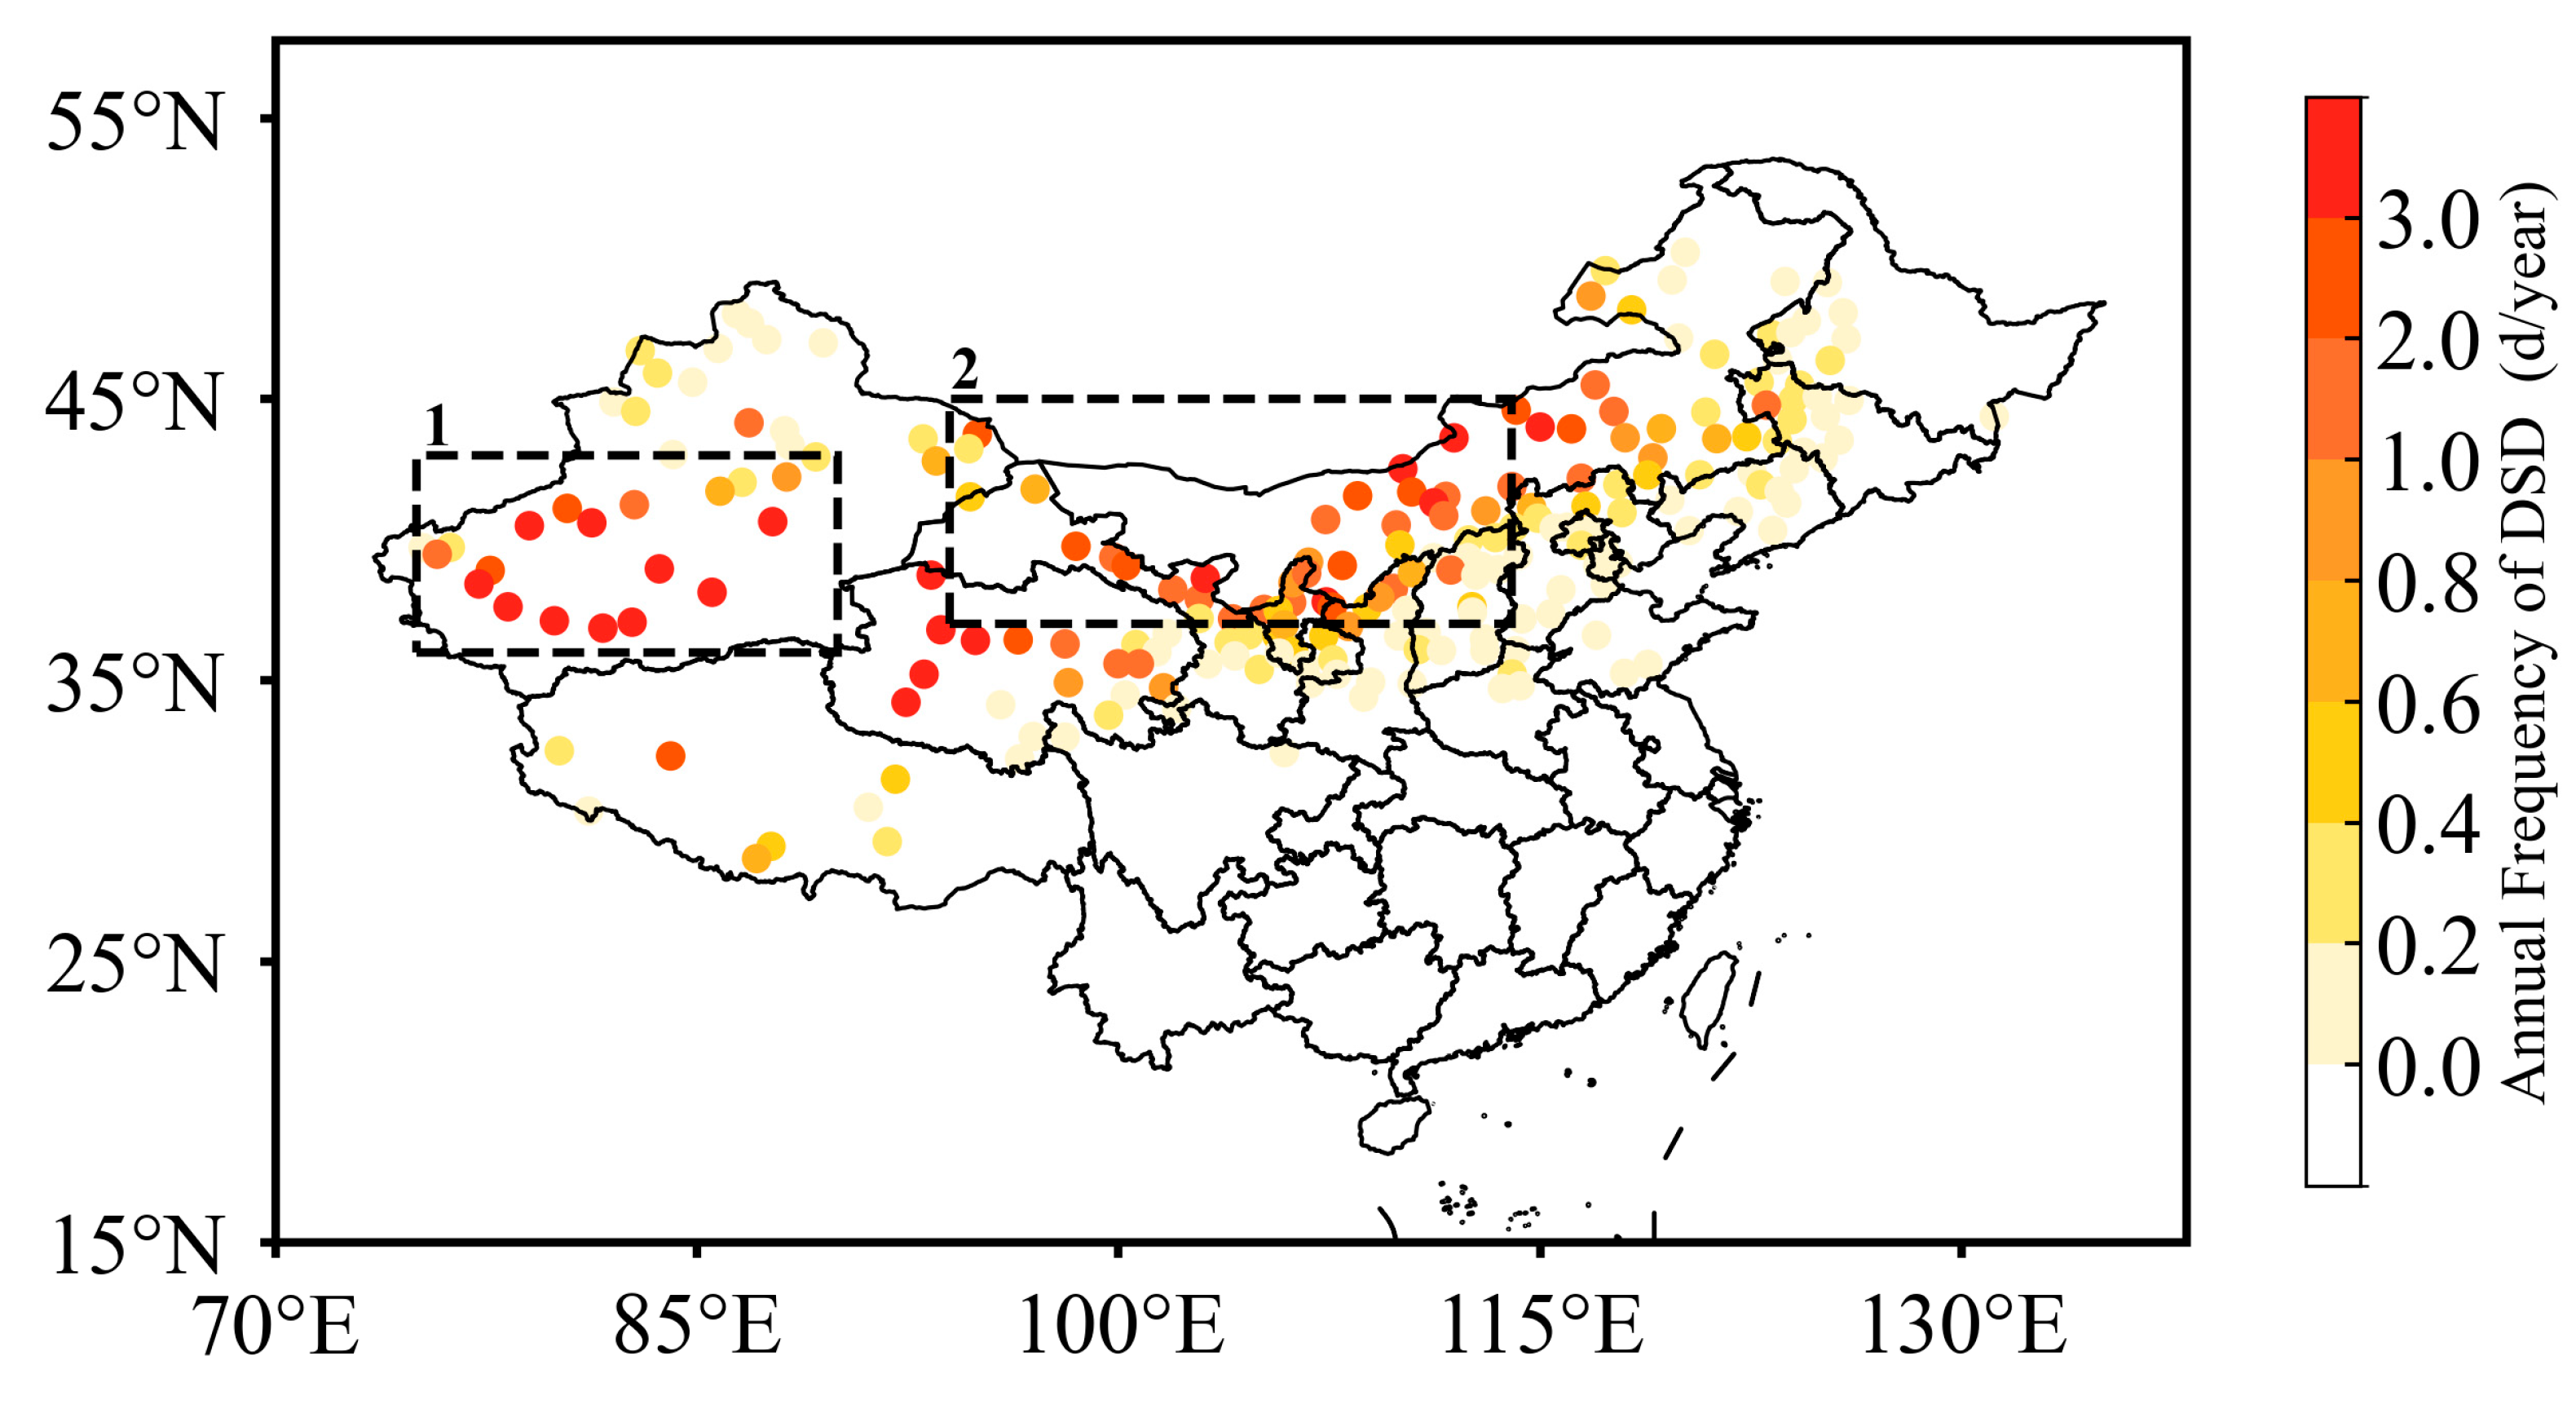
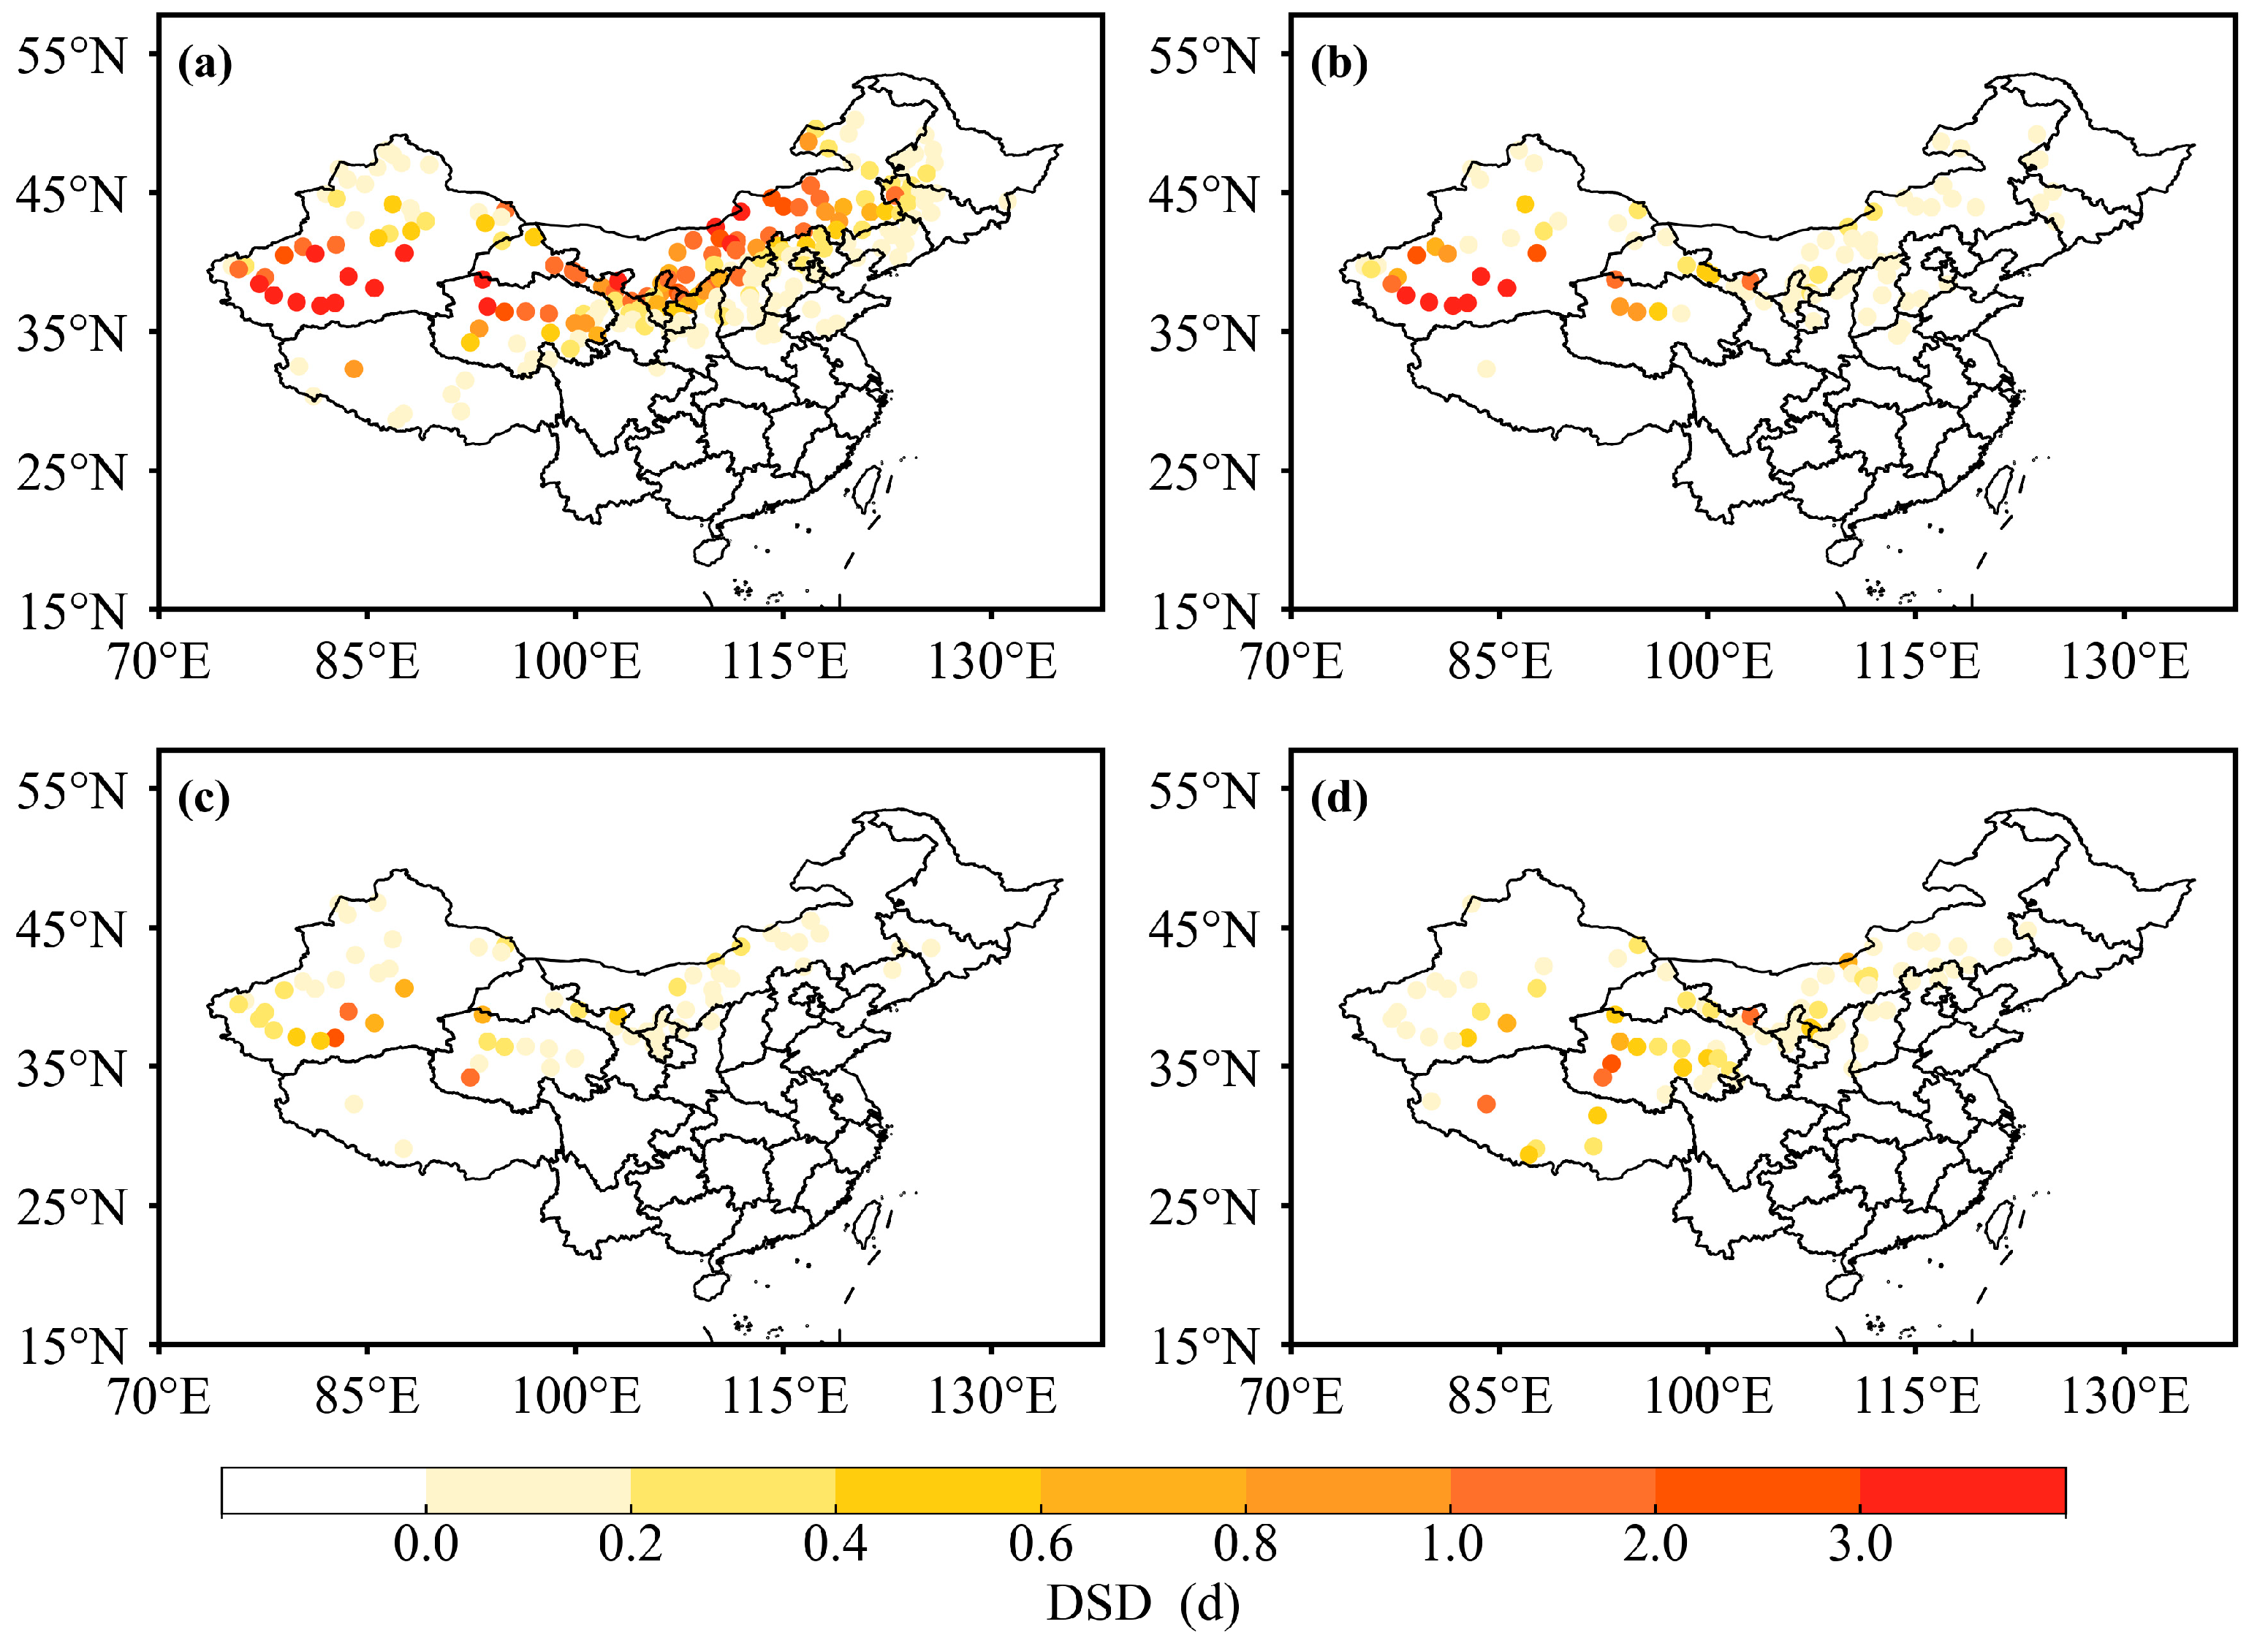
3.1. Spatiotemporal Variations in Dust Storms over TD and GD Source Regions

3.1.1. Spatial Distribution of DSD

The spatial distribution of annual frequency of DSD in China during 2000 to 2024 shows a distinct decreasing gradient from northwest to southeast (Figure 1). Most areas in northern China are significantly affected by dust storm events, especially in the western and northern regions located in arid and semi-arid climate zones, where the frequency of dust storms is much higher than in central and eastern China. In these regions, most of the meteorological stations in northwestern China experienced more than 2.0 DSD per year, reflecting the high frequency of dust storm activities. In addition, DSD values were also observed in Northern China Plain. Despite their considerable distance from primary dust source regions, these areas experience substantial dust transport from adjacent regions. Some stations in the northeastern regions are also influenced by dust transport, but their DSD values are lower than those in the northwest and northern China, indicating relatively moderate dust storm impacts in these regions.
In general, the high-value DSD areas are concentrated in the dust source regions and their adjacent downstream areas. Based on the spatial distribution of the annual DSD, this study identifies two major key source regions: the Taklimakan Desert source region (TD, 36° N–43° N, 75° E–90° E) and the Gobi Desert source region (GD, 37° N–45° N, 94° E–114° E). The TD source region is a desert located within the Tarim Basin, enclosed by the Tianshan, Kunlun, Altun, and Pamir Mountain ranges. In contrast, the GD source region is a plateau desert situated along the China–Mongolia border, bounded by the Altai Mountains, the Hexi Corridor, and the Mongolian grasslands. The southern region of Xinjiang, situated within the TD region, experiences the most severe dust storm events in China. The annual average number of DSD reaches 24.8 d, 16.5 d, and 12.6 d at the Minfeng, Tazhong, and Qiemu stations, respectively, forming the highest-intensity dust storm center. In the GD source region, stations in Minqin, Lenghu, and Mandula also experience annual average number of DSD reaching 7.1 d, 6.8 d, and 5.2 d, making it the second-highest dust storm center. Both the GD and TD source regions are located in China’s typical arid and semi-arid climate zones, characterized by intense wind erosion, low precipitation, and low vegetation cover, leading to frequent and severe dust storm impacts. Therefore, investigating the spatiotemporal variations in dust storms in the TD and GD source regions is essential for understanding regional dust dynamics and their broader environmental impacts.
Beyond the annual patterns, the spatial distribution of dust storm days (DSD) also varies seasonally, with notable differences in frequency and affected areas. Figure 2 illustrates the spatial distribution of seasonal mean DSD in China during 2000–2024. Spring exhibits the highest frequency of dust storms among all seasons. The highest values are concentrated in the eastern portion of Northwest China, the central–western sector of the northern dust source region, and parts of Northeast China. In both source and downstream regions, many stations record more than 1.0 days per spring, highlighting this season as the peak period for dust storm occurrence.
Compared to spring, dust storms are much less frequent in summer. High frequencies are largely confined to the northern parts of the Northwest China source region and the central–western desert areas. A distinct contrast emerges between the two main source regions. In the northeastern source region, most stations record fewer than 0.4 DSD in summer due to prevailing monsoonal suppression. By contrast, areas surrounding the core desert regions in the central and southern parts of Northwest China exhibit relatively higher values, with some stations reaching up to 0.8 DSD.
In autumn, dust storm activity weakens considerably, both in terms of spatial extent and intensity. Most stations across the northern and northwestern regions register fewer than 0.2 DSD. Only localized areas in the central part of the Northwest China source region show values exceeding 0.8 DSD.
Dust storms remain relatively infrequent during winter, though certain stations report slightly higher frequencies than in autumn. These are mainly located in northern portions of the northern source region, southeastern parts of Northwest China, and parts of the western plateau areas. Some stations in these zones record more than 0.8 DSD, indicating that dust storm activity can persist under cold and arid winter conditions.
The DSD distribution exhibits a persistent seasonal pattern, with high frequencies in source regions and a gradual decline toward downstream transport areas in China. In each season, the two major source regions are consistently identified as centers of dust storm events. Therefore, the spatial distribution of DSD serves as a reliable basis for delineating these two source regions. Accounting for their distinct spatial heterogeneity, we systematically analyze temporal variations in each source region and identify the key factors influencing their changes.

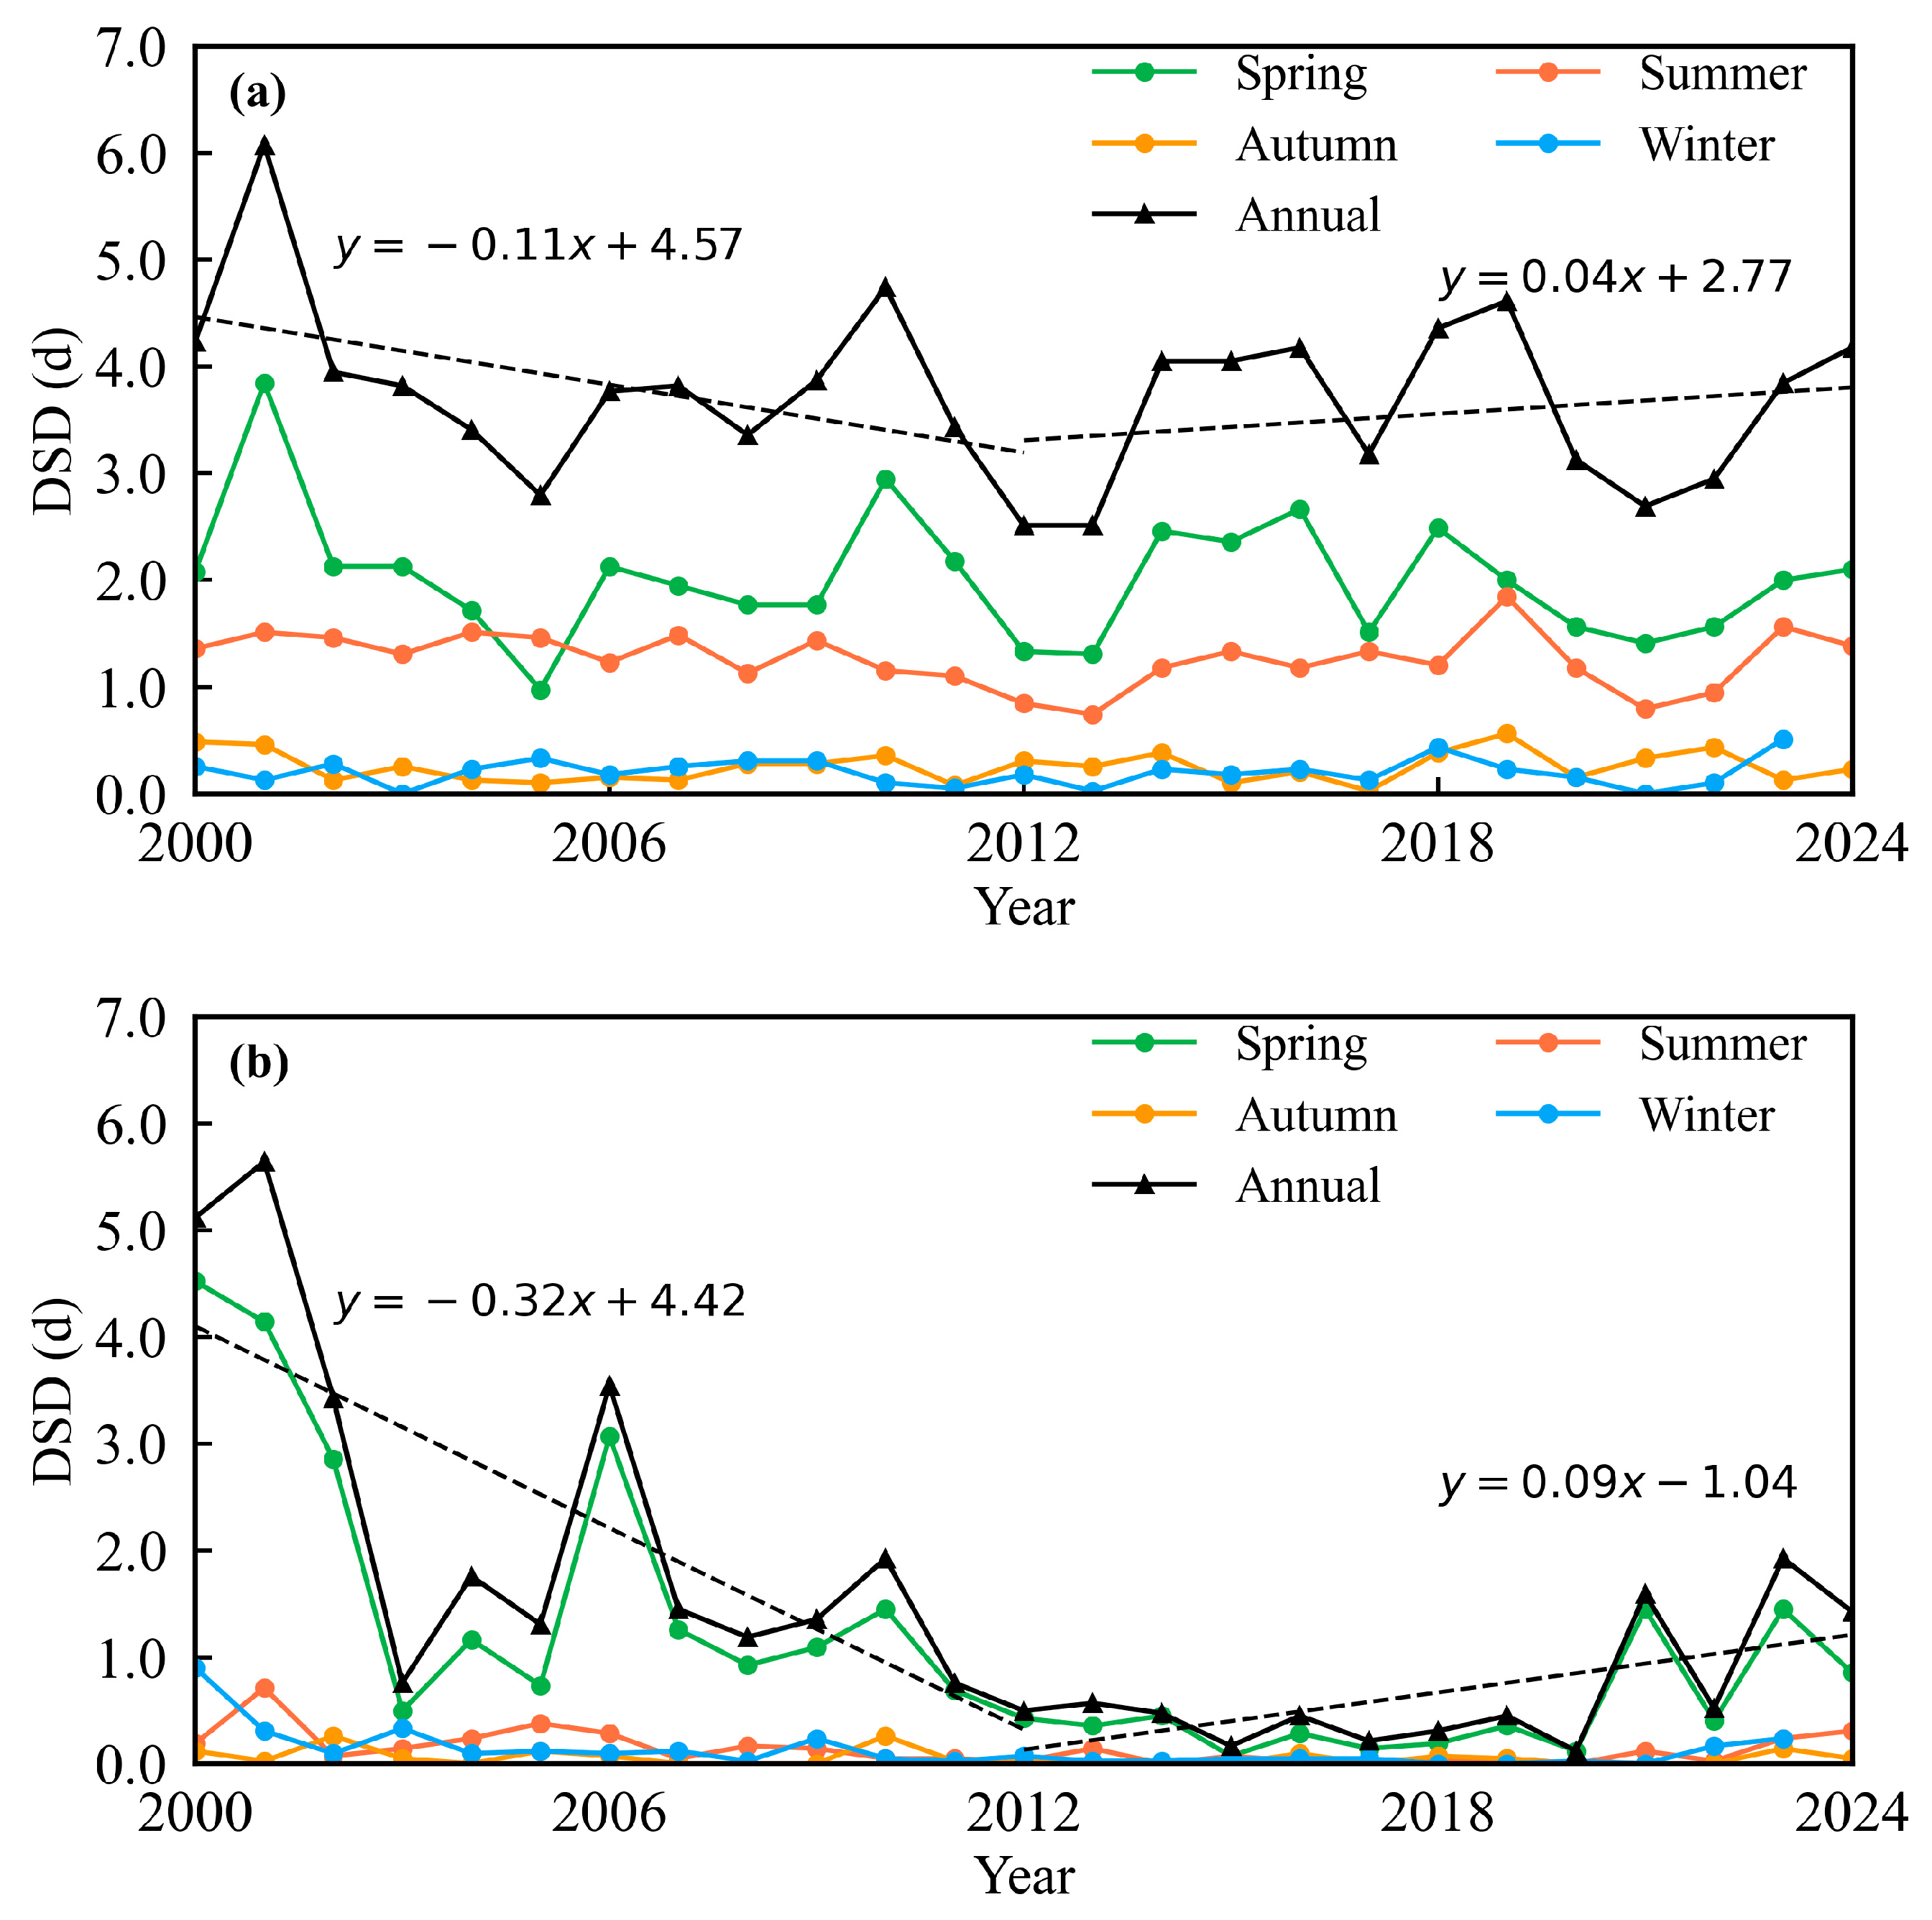
3.1.2. Interannual Variations in Annual and Seasonal DSD

Since the beginning of the 21st century, annual DSD in both the TD and GD source regions has shown a rapid decline followed by a subsequent increase (Figure 3). In 2001, the annual DSD peaked at 6.1 d in the TD region and 5.6 d in the GD region. Following this peak, dust storm frequency declined, with the lowest values observed in 2012 for the TD region (2.5 d) and in 2015 for the GD region (0.2 d), after which an increasing trend emerged. Despite this shared temporal trend, the interannual variations differ markedly between the two source regions. Since 2013 represented both a relative minimum in DSD for both source regions and the approximate midpoint of our study period, we partitioned the dataset into pre-2013 and post-2013 phases to analyze temporal trends separately. Between 2000 and 2012, DSD in the TD region decreased at a rate of −0.11 d/a, substantially slower than the −0.32 d/a observed in the GD region. From 2013 to 2024, the TD region’s DSD showed a fluctuating increase at 0.04 d/a, compared to a more pronounced recovery at 0.09 d/a in the GD region. Consequently, the TD region has maintained relatively high levels of dust storm events, with annual DSD values consistently exceeding 2.0 d, whereas the GD region has experienced a sharp decline since 2006, with annual DSD remaining below 2.0 d. Although a notable increase in dust storm frequency has been observed in the GD region in recent years, its overall dust storm activity remains significantly lower than that of the TD region.
Seasonal analysis shows that dust storm events in both the TD and GD source regions are predominantly concentrated in spring, with interannual variation in spring DSD largely driving the overall annual trend. A marked seasonal disparity is observed between the two regions. In the TD region, spring DSD accounts for up to 60% of the annual total, while in the GD region, it exceeds 90%, indicating a strong concentration of events in spring. Additionally, the TD region experiences seasonal DSD over 1.0 d in summer, contributing approximately 30% of the annual total, which is significantly higher than that in the GD region. In autumn and winter, both the source regions record fewer than 1.0 d of seasonal DSD, with little interannual variation, reflecting generally low dust storm activities during these seasons.
Overall, dust storm events in both the TD and GD source regions have rebounded over the past decade. In particular, spring and summer not only dominate annual dust storm occurrences but also exhibit the greatest seasonal variability. These seasonal trends underscore the need for further investigation into the distinct driving factors of dust storms in each region.

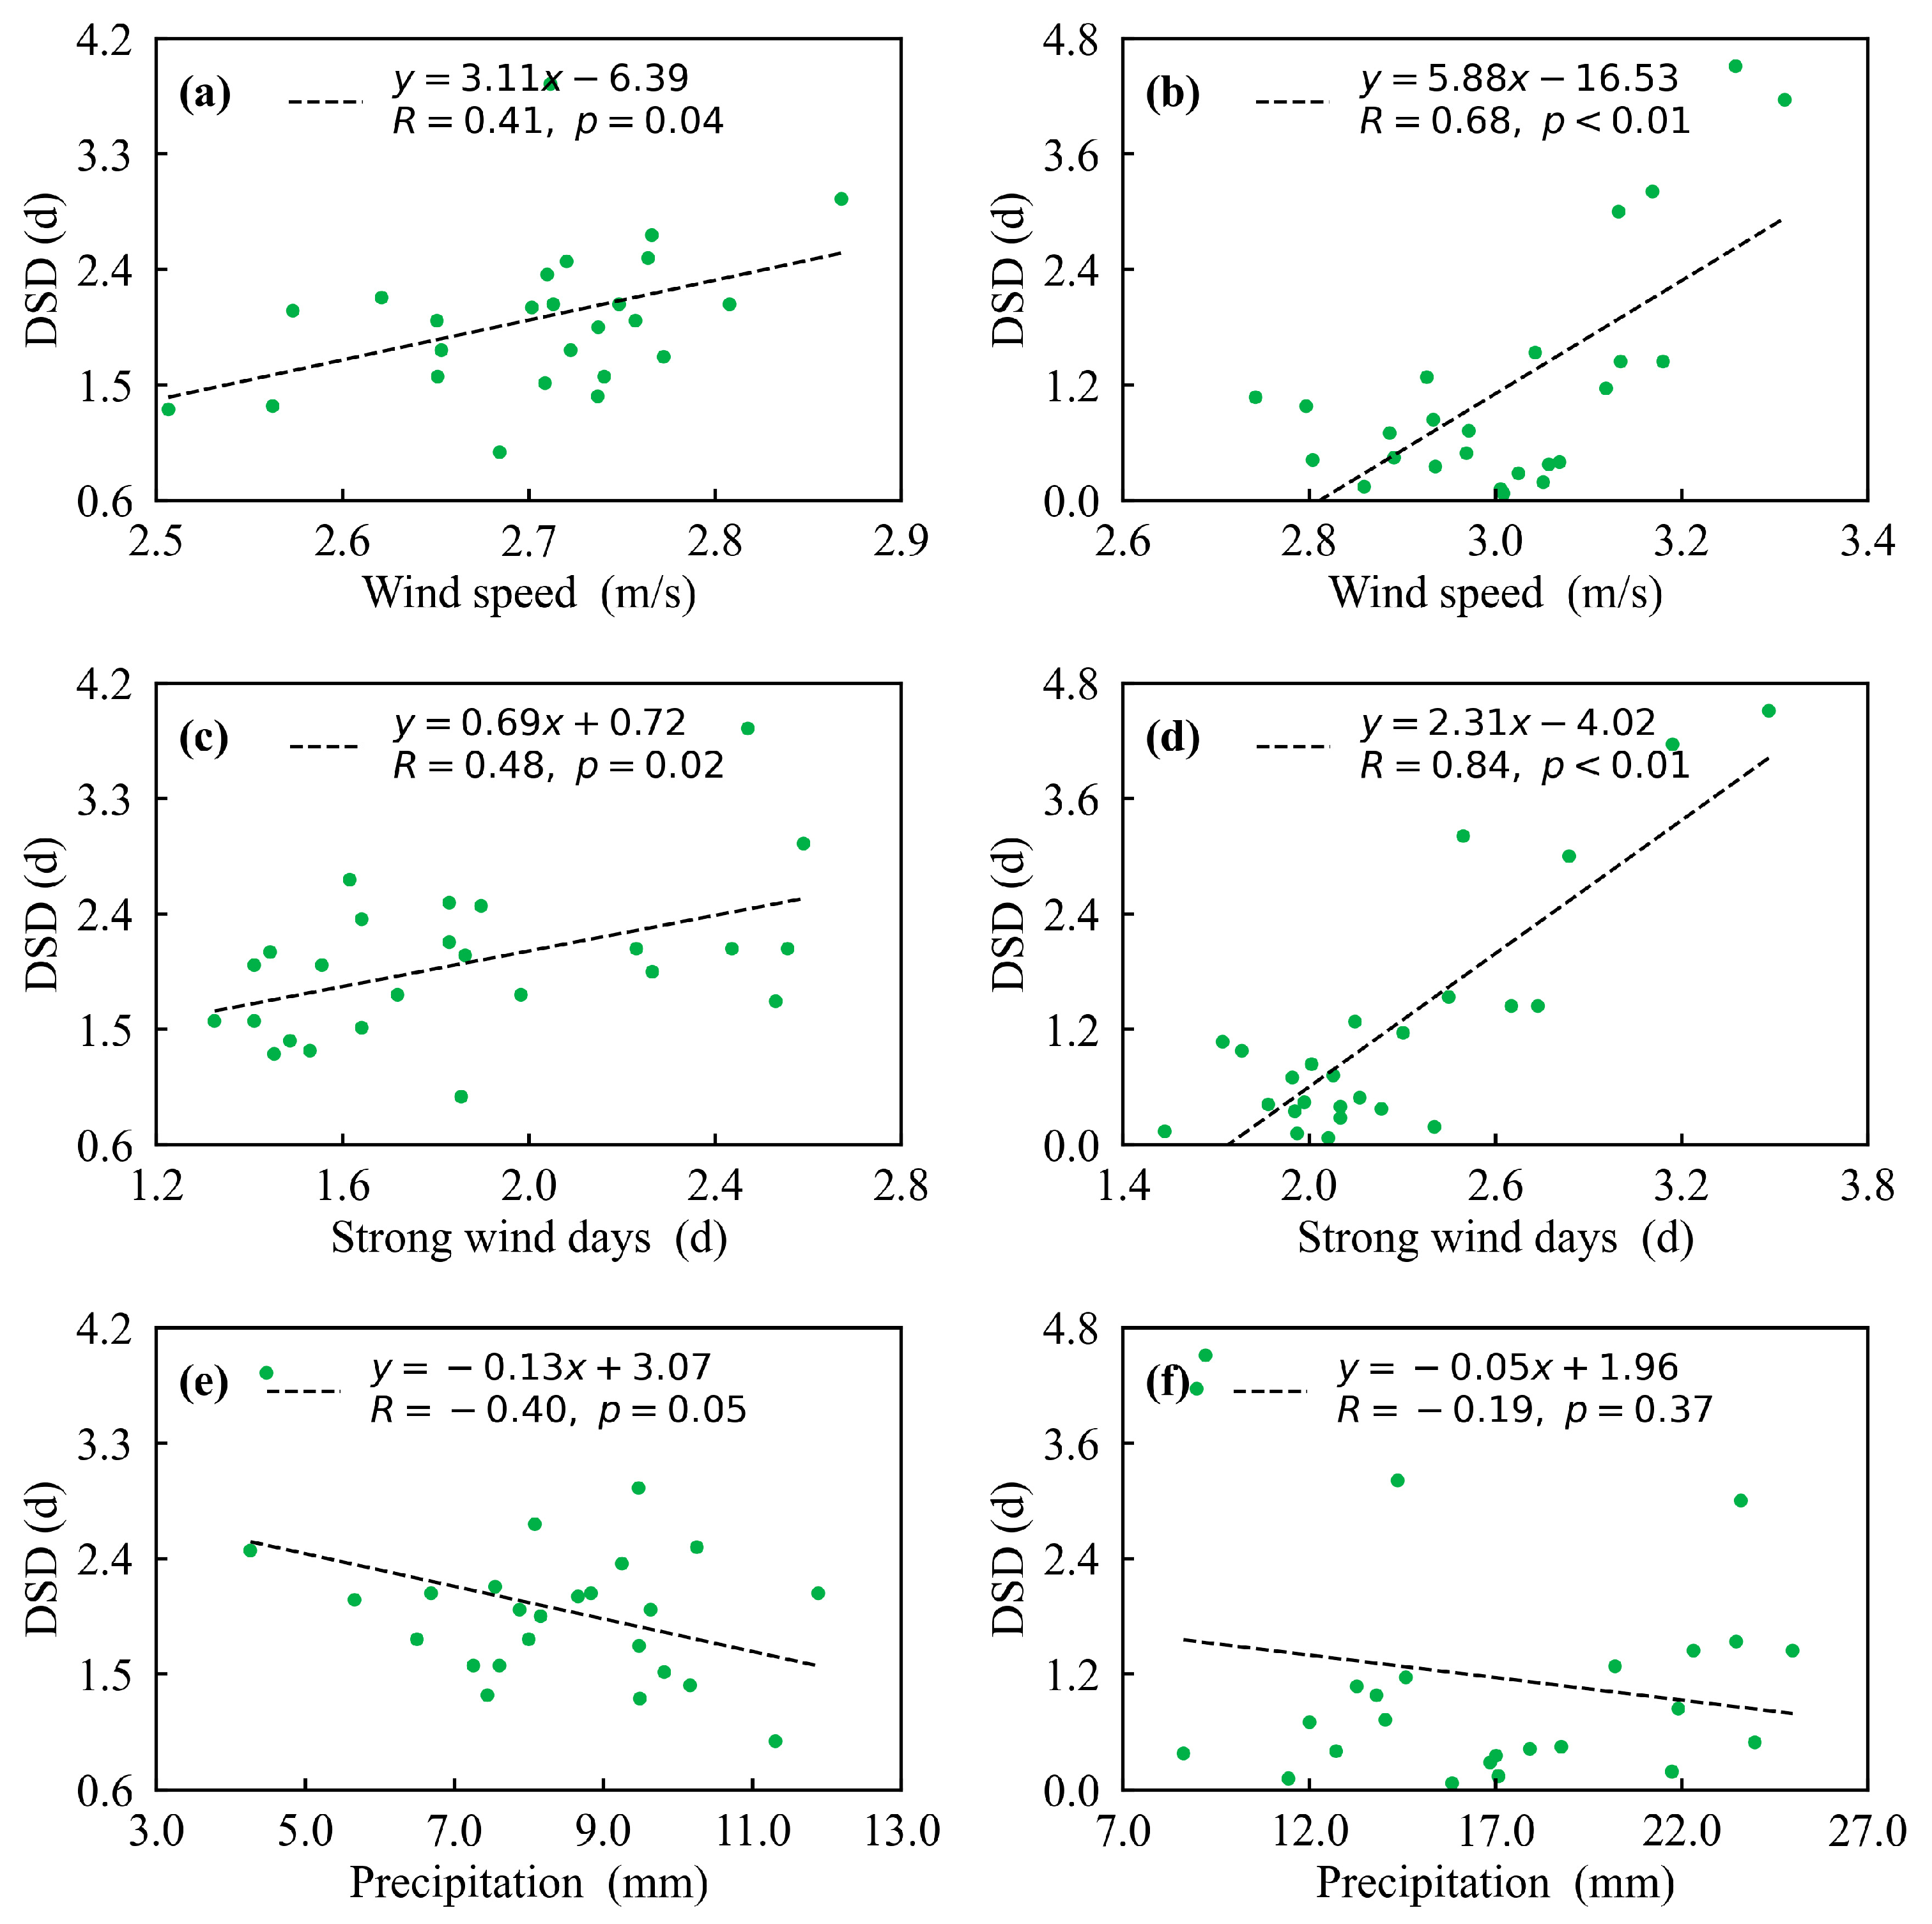
3.2. Meteorological Driving Factors for Dust Storm Variability

To evaluate the response of dust storm events in the two primary source regions to key meteorological factors, we analyzed the relationship between the DSD and major meteorological variables during spring and summer (2000–2024), the seasons that account for the majority of annual dust storm occurrences (Figure 4 and Figure 5). In spring, both the TD and GD regions exhibit positive correlations between wind speed and the value of DSD (Figure 4a,b and Figure 5a,b), with correlation coefficients of 0.41 and 0.68, respectively. Similarly, strong wind days also show significant positive correlations with DSD (Figure 4c,d and Figure 5c,d), with coefficients of 0.48 in the TD region and 0.84 in the GD region. These results highlight that wind speed and strong wind frequency are key meteorological drivers of springtime dust storm activity, with a more pronounced wind–dust relationship in the GD region.
In contrast, during summer, the two regions exhibit different responses to wind conditions. In the GD region, DSD shows a weak correlation with both wind speed and strong wind days, suggesting that dust storm events in this region may be regulated by other meteorological or surface factors during this season. Conversely, the TD region retains significant positive correlations with both wind indicators, particularly between strong wind days and DSD (r = 0.42), indicating that wind remains the dominant driver of dust storm in this region during summer.
Strong wind directly impacts the entrainment, transport, and dispersion of loose surface particles. Dust emission occurs when surface wind speed exceeds a critical threshold, initiating processes such as saltation and aerodynamic lifting that entrain particles into the atmosphere. This process becomes particularly pronounced during arid seasons, when low soil moisture reduces interparticle cohesion, making the surface more vulnerable to wind-driven erosion [34]. Therefore, wind is widely recognized as the primary meteorological factor regulating dust storms across source regions. Nevertheless, its influence varies seasonally. The divergent summer responses of the TD and GD regions to wind conditions imply that other meteorological variables or land surface characteristics may exert a more substantial influence in specific areas during this period. These findings reinforce the dominant role of wind-related factors in regulating dust storm events across both source regions, particularly during spring. However, the pronounced seasonal divergence observed in summer, with the GD region becoming largely unresponsive to wind, implies the involvement of other meteorological or surface factors in dust modulation. Given this weakened wind–dust linkage in the GD region during summer, we further examined the potential role of precipitation in influencing dust storm frequency.
To further investigate non-wind factors influencing dust storm frequency, particularly in view of the diminished wind influence in the GD region during summer, we examined the relationship between precipitation and DSD (Figure 4e,f and Figure 5e,f). In both spring and summer, precipitation shows a negative correlation with DSD. During spring, the TD region exhibits a moderately strong inverse correlation (r = −0.40), suggesting that increased precipitation effectively suppresses dust activity. By contrast, the GD region shows a weaker and statistically non-significant relationship, indicating that precipitation plays a limited role in regulating dust storms in this season. In summer, however, this spatial pattern is reversed: the GD region displays a statistically negative correlation (r = −0.35), highlighting the enhanced role of precipitation in mitigating dust activity. Meanwhile, the TD region continues to show a weak and non-significant correlation, suggesting that precipitation has little influence on dust storm variability in this region. In terms of values, the GD region receives more precipitation than the TD region in the two seasons, with a particularly marked increase during summer. Precipitation enhances surface moisture and fosters vegetation growth, thereby improving soil structural integrity and decreasing the vulnerability of surface materials to wind erosion [35]. On the other hand, precipitation contributes to lowering dust aerosol concentrations by promoting wet deposition, which serves as a particularly important factor affecting dust loading in downstream regions [36]. As a result, both the frequency and intensity of dust storms are reduced. These results highlight the spatiotemporal heterogeneity in the mitigating effects of precipitation: dust storm events in the TD region respond more strongly to spring precipitation, whereas in the GD region, summer precipitation exerts a greater influence on dust storm activities.
In general, seasonal variations in dust storm activity across East Asia are closely linked to synoptic-scale atmospheric circulation patterns. In spring, the frequent passage of mid-latitude cyclones, particularly the Mongolian cyclone, plays a critical role in dust emission and long-range transport. These synoptic systems enhance surface wind speeds over dust source regions, creating favorable conditions for dust uplift and subsequent transboundary movement [37]. In contrast, during summer, the intensification of the East Asian summer monsoon leads to increased precipitation and elevated soil moisture, which significantly suppress dust emission processes [38]. Understanding these seasonal circulation controls is essential for interpreting the temporal variability of dust storms and their environmental impacts in East Asia.

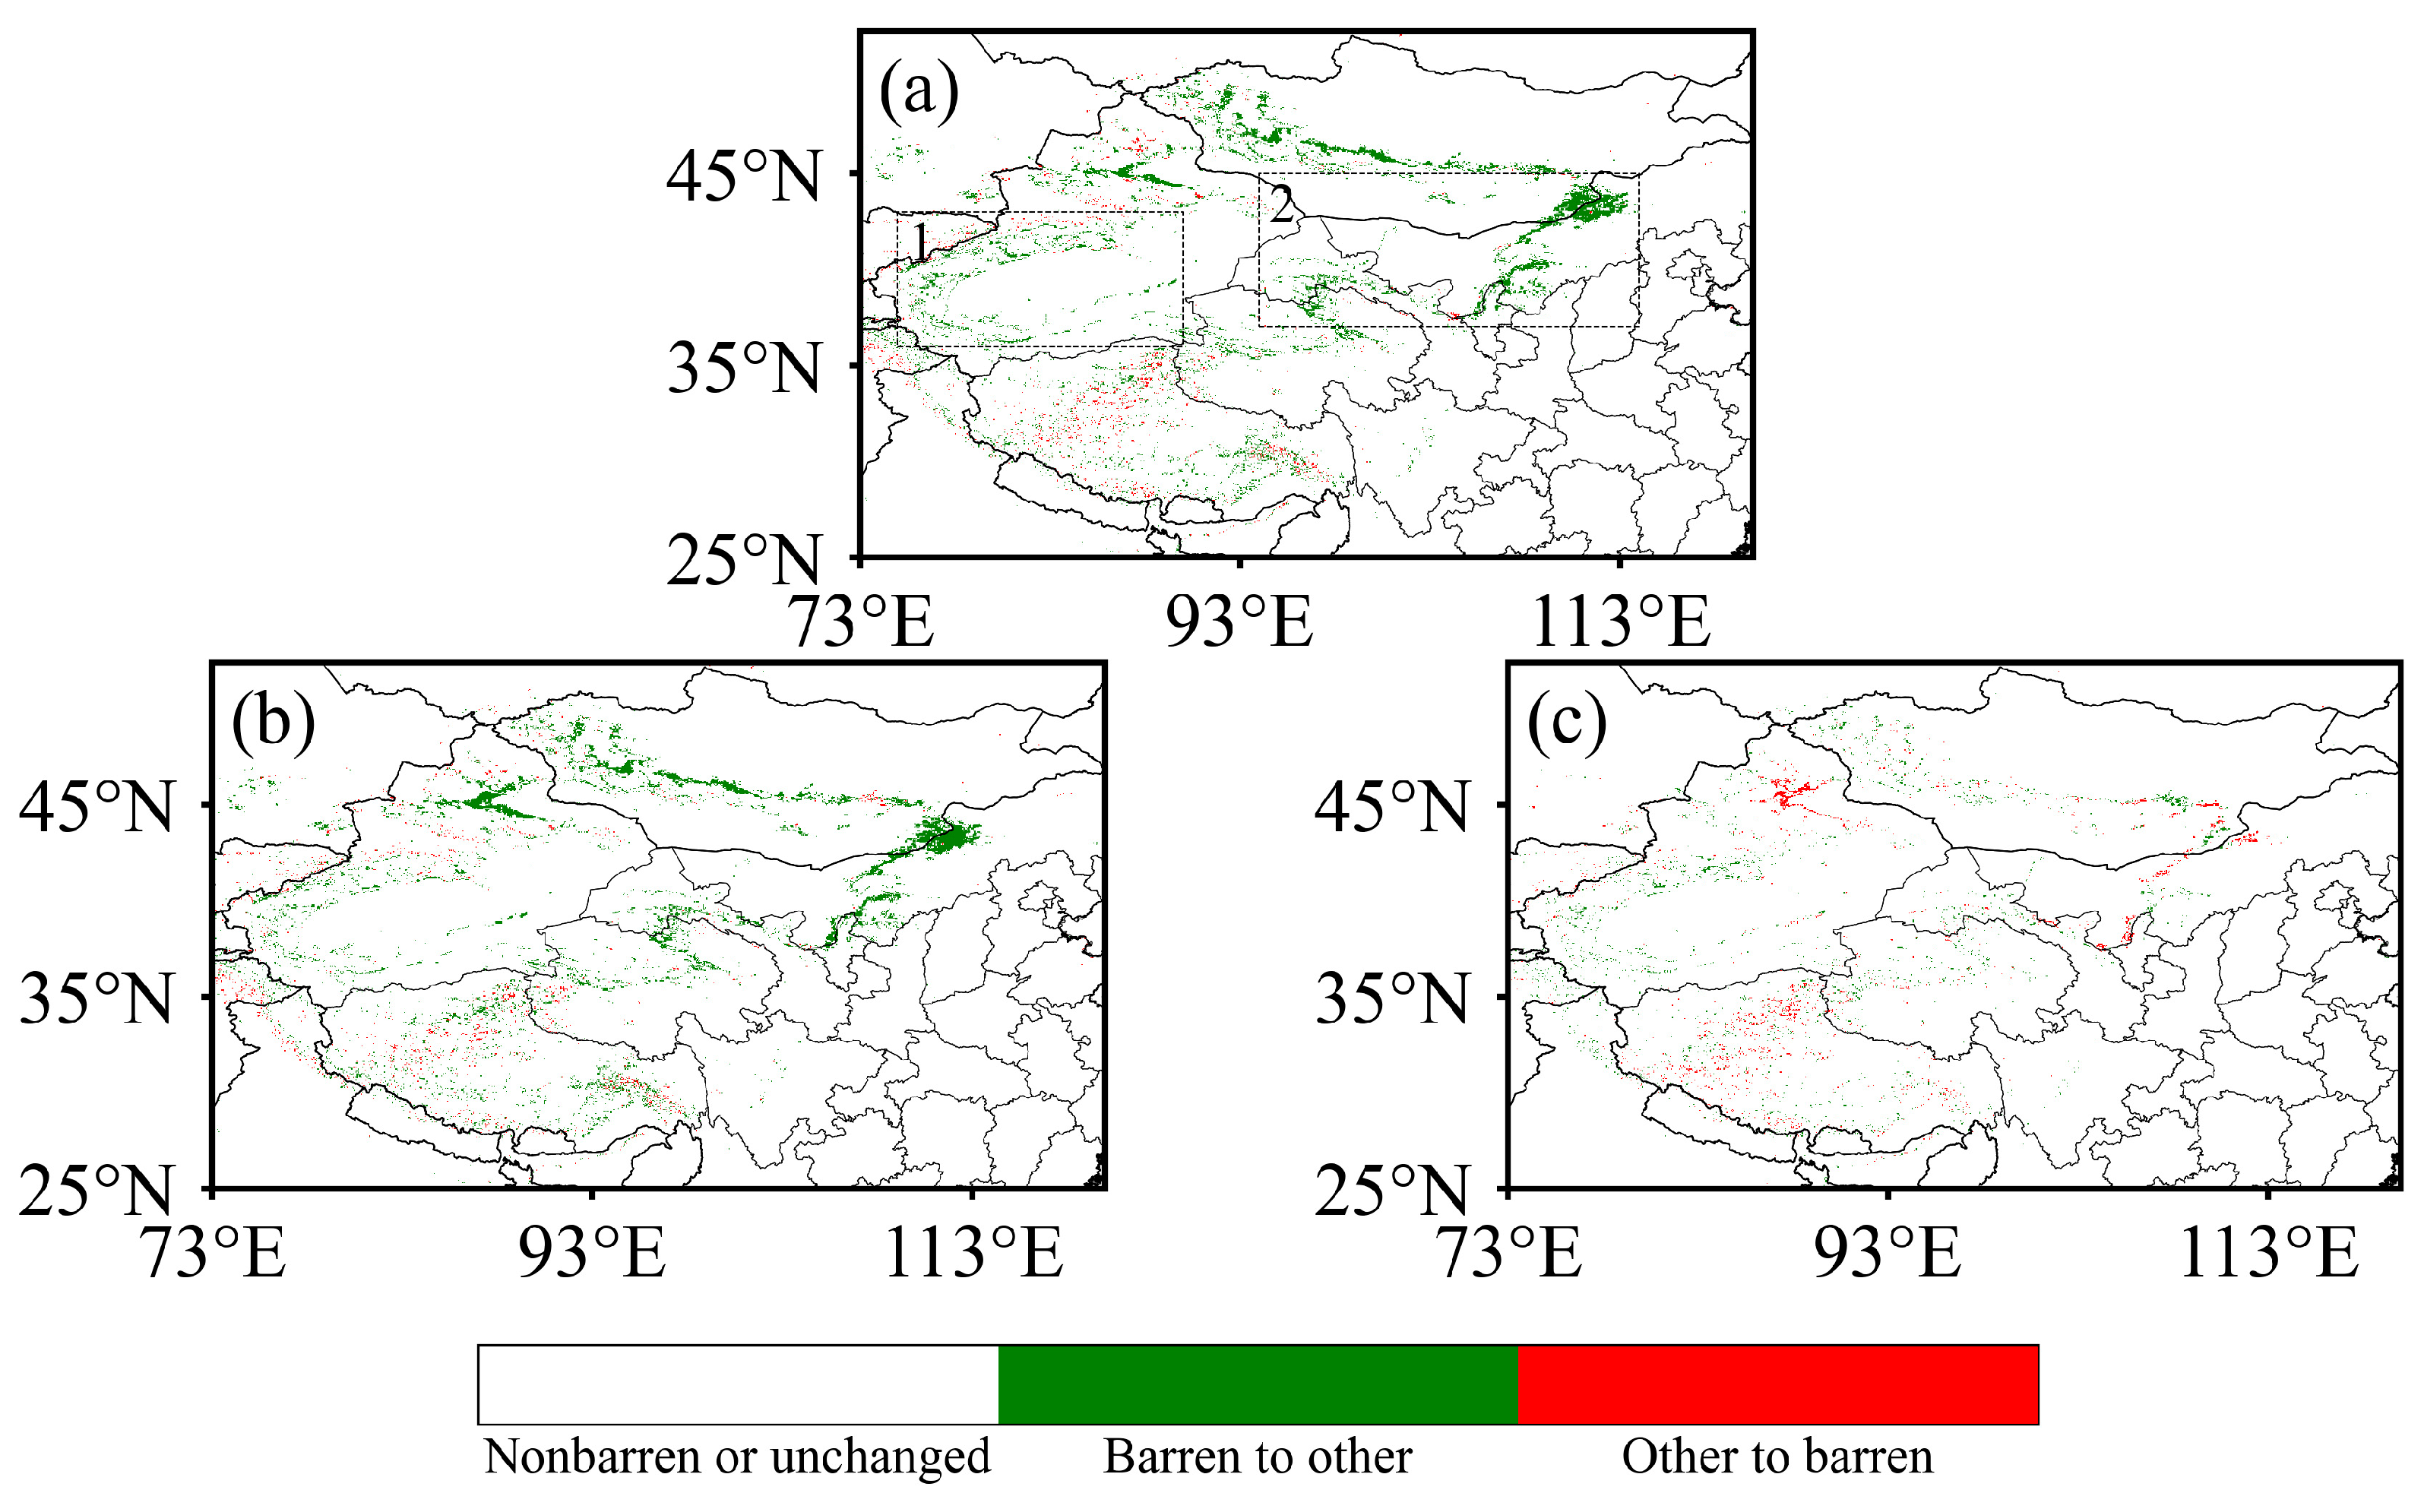
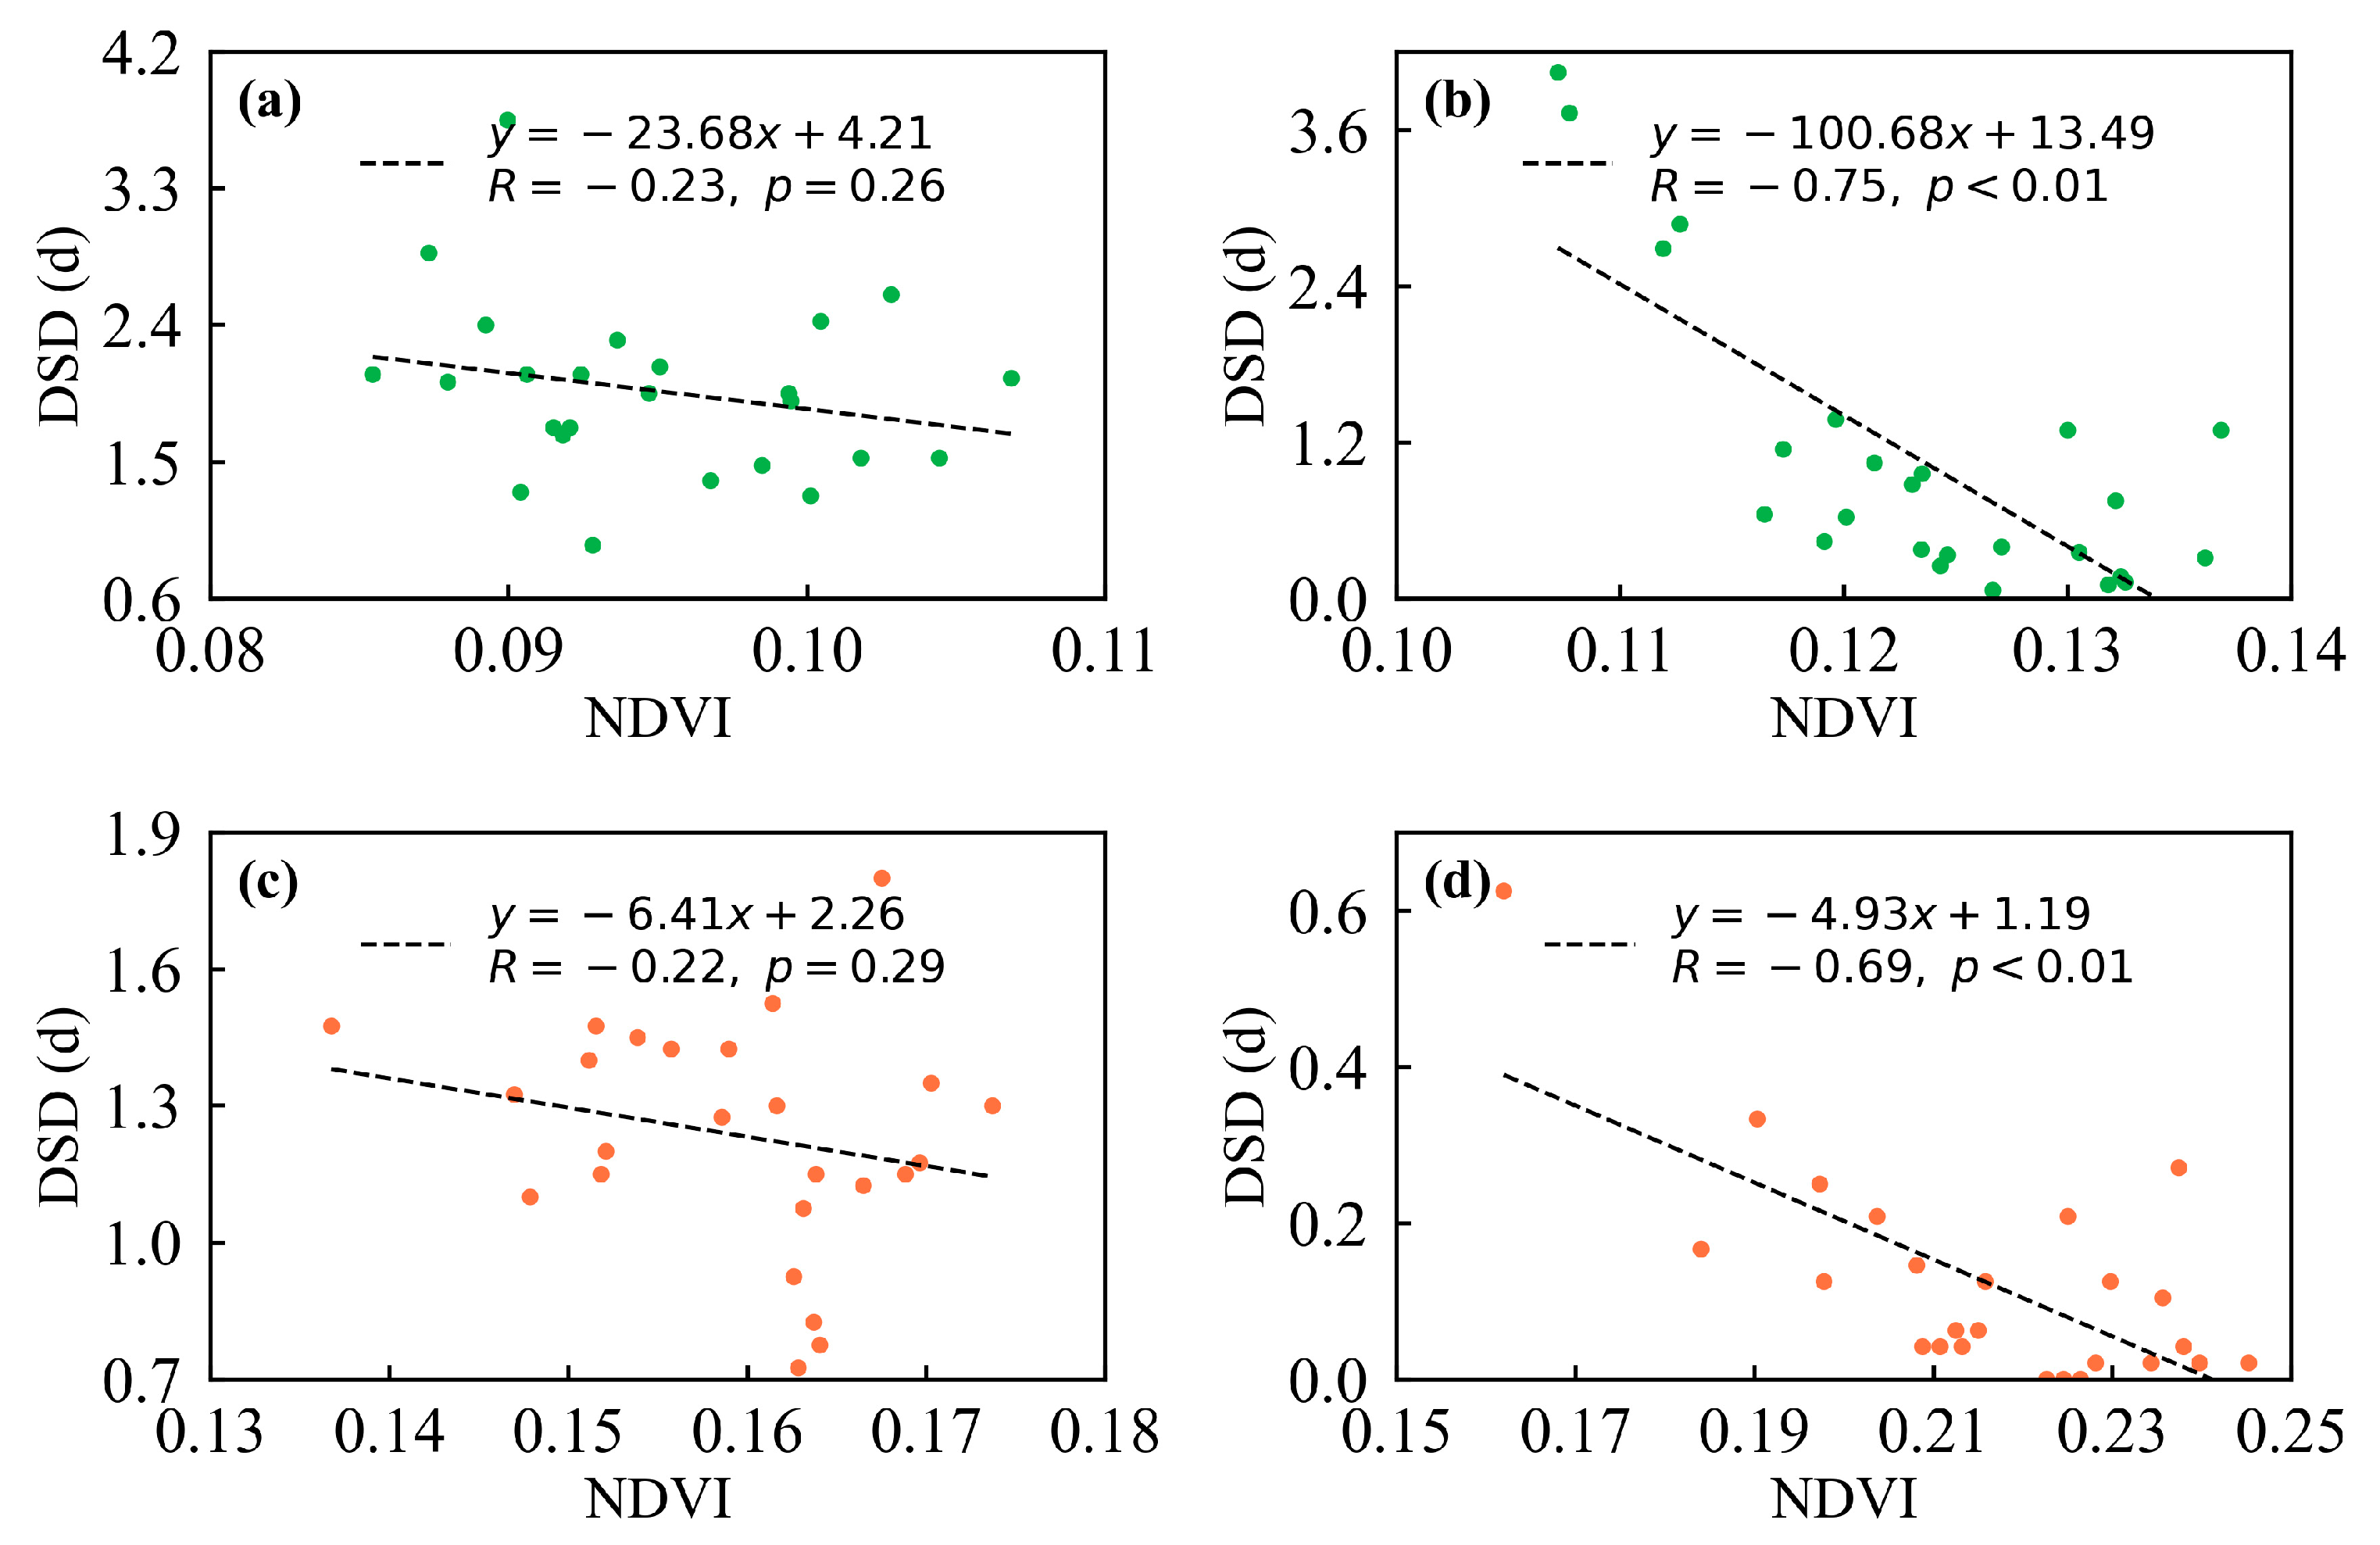
3.3. Surface Driving Factors for Dust Storm Variability

The widespread distribution of barren or sparsely vegetated areas (hereafter referred to as “barren land”) in the TD and GD source regions is characterized by low vegetation cover and a high susceptibility to wind erosion. These surface conditions make barren lands critical sources for dust storm initiation [39]. Therefore, it is essential to closely examine changes in surface conditions within both source regions.
While this study investigates dust storm variability during 2000–2024, the analysis of land surface changes is limited by the temporal coverage of the MODIS MCD12C1 dataset (2001–2023)—the earliest and latest years currently available. Consequently, land cover changes were evaluated specifically for this 23-year period. From 2001 to 2023, barren land area exhibited a widespread decline across most of the source regions, including the western and southern part of the TD, eastern part of the GD, and southern–central Mongolia, except for localized conversions to barren land in the central–northern TD and southern GD (Figure 6a). In terms of temporal variation, the period from 2001 to 2013 saw the most pronounced reduction in barren land, primarily concentrated in Northwest China and southern–central Mongolia, while new barren areas emerged mainly in the central–northern TD and central Mongolia (Figure 6b). From 2013 to 2023, however, the extent of barren land reduction decreased significantly, with the most notable changes occurring along the margins of the TD and in central Mongolia (Figure 6c). Conversely, barren land increased locally in the northern TD and south–central GD. According to quantitative analyses (Table 1), the total area of barren land in the TD and GD source regions decreased by 45,745 km2 and 96,342 km2, respectively, from 2001 to 2023. The areas of increase were substantially smaller than the reductions, indicating an overall contraction in barren land extent. This trend was especially evident during 2001–2013, when the reduction far exceeded the expansion, marking a major period of land cover recovery that corresponded with a continuous decline in DSD. In contrast, the period from 2013 to 2023 was characterized by a notable increase in barren land, particularly in the GD region, where expansion (13,004 km2) exceeded reduction (12,141 km2). This shift in land cover dynamics marks a reversal in the previous recovery trend. The re-expansion in barren land may be a key factor contributing to the renewed increase in dust storm activity.
Vegetation degradation or reduced coverage results in increased soil exposure, thereby diminishing the land surface’s resistance to aeolian erosion [40]. Therefore, quantifying the impact of vegetation cover on dust storm frequency across both source regions is critical. During 2000–2024, the NDVI in the GD region shows strong negative correlations with spring (R = −0.75) and summer (R = −0.69) DSD, demonstrating that vegetation growth effectively suppresses dust storm activity (Figure 7). This can be attributed to the generally higher vegetation cover in the GD region, which increases surface roughness and reduces near-surface wind velocity, thus limiting the mobilization of dust particles. In contrast, the TD region, characterized by extensive barren landscapes, exhibits persistently low NDVI values. The limited presence of vegetation in this hyper-arid environment restricts its ability to regulate dust emission, resulting in a weak and statistically insignificant relationship between NDVI and dust storm frequency.

4. Conclusions

Since the start of the 21st century, dust storm events in China have shown pronounced spatial heterogeneity, with the highest frequency observed in the arid and semi-arid regions of Northwest China. Based on spatial patterns, two major dust source regions were identified: the Taklimakan Desert (TD) and the Gobi Desert (GD). Between 2000 and 2024, both regions exhibited a “decline-then-rise” pattern in dust storm days (DSD), with 2013 marking a turning point. The GD region experienced more pronounced changes, with a steeper decline and a stronger resurgence compared to the TD. Seasonally, dust storms predominantly occurred in spring and summer, with summer DSD in the TD notably higher than in the GD. Meteorological drivers varied by season and region: in spring, wind speed and strong wind days were primary contributors in both regions, while in summer, wind remained dominant in the TD but less influential in the GD, where precipitation exerted stronger control. Surface conditions also played a key role. From 2001 to 2023, barren land area generally declined across both source regions, corresponding to reduced DSD; however, since 2013, a notable re-expansion of barren land has been observed, particularly in the GD region. This reversal in land cover trends has likely contributed to the resurgence of dust storm activity in recent years. Vegetation dynamics, as indicated by NDVI, also showed a strong negative correlation with DSD in the GD region, underscoring vegetation’s suppressive effect, while dust storm variability in the TD region remained primarily controlled by wind dynamics and source availability.
In summary, this study elucidates region-specific drivers of dust storm variability and highlights the complex coupling between regional atmospheric dynamics and land surface processes. These findings provide valuable insights into the underlying mechanisms of dust storm formation and support the development of early warning systems. To advance our understanding, future work should integrate ground-based observations, remote sensing, and numerical modeling to comprehensively identify the dominant factors controlling the emission and transport of dust storms. Such integrative efforts will not only refine our process-level knowledge of dust storms, but also enhance the capabilities of impact assessments.

Author Contributions

Conceptualization, C.T. and T.Z.; methodology, C.T. and C.L.; software, C.T. and X.L.; formal analysis, C.T. and T.L.; writing—original draft preparation, C.T.; writing—review and editing, T.L. and T.Z.; supervision, M.T. All authors have read and agreed to the published version of the manuscript.

Funding

This research was supported by the National Natural Science Foundation of China (42277088), National Key Research and Development Program of China (2022YFC3701204), National Natural Science Foundation of China (42275196, 42105164), NSFC Young Scholars (42405171), and The Open Grants of the China Meteorological Administration Aerosol-Cloud and Precipitation Key Laboratory (KDW2413).

Institutional Review Board Statement

Not applicable.

Informed Consent Statement

Not applicable.

Data Availability Statement

Data are available from the corresponding author.

Acknowledgments

The authors gratefully acknowledge the NASA Land Processes Distributed Active Archive Center (LP DAAC) for providing the MODIS data products used in this study.

Conflicts of Interest

The authors declare no conflicts of interest.

References

  1. Shepherd, G.; Terradellas, E.; Baklanov, A.; Kang, U.; Sprigg, W.; Nickovic, S.; Darvishi Boloorani, A.; Al-Dousari, A.; Basart, S.; Benedetti, A. Global Assessment of Sand and Dust Storms; United Nations Environment Programme (UNEP): Nairobi, Kenya, 2016. [Google Scholar]
  2. Shao, Y. A model for mineral dust emission. J. Geophys. Res. Atmos. 2001, 106, 20239–20254. [Google Scholar] [CrossRef]
  3. Gherboudj, I.; Beegum, S.N.; Ghedira, H. Identifying natural dust source regions over the Middle-East and North-Africa: Estimation of dust emission potential. Earth-Sci. Rev. 2017, 165, 342–355. [Google Scholar] [CrossRef]
  4. Kok, J.F.; Storelvmo, T.; Karydis, V.A.; Adebiyi, A.A.; Mahowald, N.M.; Evan, A.T.; He, C.; Leung, D.M. Mineral dust aerosol impacts on global climate and climate change. Nat. Rev. Earth Environ. 2023, 4, 71–86. [Google Scholar] [CrossRef]
  5. Kok, J.F.; Adebiyi, A.A.; Albani, S.; Balkanski, Y.; Checa-Garcia, R.; Chin, M.; Colarco, P.R.; Hamilton, D.S.; Huang, Y.; Ito, A. Contribution of the world’s main dust source regions to the global cycle of desert dust. Atmos. Chem. Phys. 2021, 21, 8169–8193. [Google Scholar] [CrossRef]
  6. An, L.; Che, H.; Xue, M.; Zhang, T.; Wang, H.; Wang, Y.; Zhou, C.; Zhao, H.; Gui, K.; Zheng, Y. Temporal and spatial variations in sand and dust storm events in East Asia from 2007 to 2016: Relationships with surface conditions and climate change. Sci. Total Environ. 2018, 633, 452–462. [Google Scholar] [CrossRef]
  7. Chen, S.; Huang, J.; Kang, L.; Wang, H.; Ma, X.; He, Y.; Yuan, T.; Yang, B.; Huang, Z.; Zhang, G. Emission, transport, and radiative effects of mineral dust from the Taklimakan and Gobi deserts: Comparison of measurements and model results. Atmos. Chem. Phys. 2017, 17, 2401–2421. [Google Scholar] [CrossRef]
  8. Abdelkader, M.; Metzger, S.; Steil, B.; Klingmüller, K.; Tost, H.; Pozzer, A.; Stenchikov, G.; Barrie, L.; Lelieveld, J. Sensitivity of transatlantic dust transport to chemical aging and related atmospheric processes. Atmos. Chem. Phys. 2017, 17, 3799–3821. [Google Scholar] [CrossRef]
  9. Fussell, J.C.; Kelly, F.J. Mechanisms underlying the health effects of desert sand dust. Environ. Int. 2021, 157, 106790. [Google Scholar] [CrossRef]
  10. Kok, J.F.; Ward, D.S.; Mahowald, N.M.; Evan, A.T. Global and regional importance of the direct dust-climate feedback. Nat. Commun. 2018, 9, 241. [Google Scholar] [CrossRef]
  11. Mahowald, N.M.; Baker, A.R.; Bergametti, G.; Brooks, N.; Duce, R.A.; Jickells, T.D.; Kubilay, N.; Prospero, J.M.; Tegen, I. Atmospheric global dust cycle and iron inputs to the ocean. Glob. Biogeochem. Cycles 2005, 19, GB4025. [Google Scholar] [CrossRef]
  12. Chen, S.; Huang, J.; Li, J.; Jia, R.; Jiang, N.; Kang, L.; Ma, X.; Xie, T. Comparison of dust emissions, transport, and deposition between the Taklimakan Desert and Gobi Desert from 2007 to 2011. Sci. China Earth Sci. 2017, 60, 1338–1355. [Google Scholar] [CrossRef]
  13. Huang, J.; Minnis, P.; Chen, B.; Huang, Z.; Liu, Z.; Zhao, Q.; Yi, Y.; Ayers, J.K. Long-range transport and vertical structure of Asian dust from CALIPSO and surface measurements during PACDEX. J. Geophys. Res. Atmos. 2008, 113, D23212. [Google Scholar] [CrossRef]
  14. Qian, W.; Tang, X.; Quan, L. Regional characteristics of dust storms in China. Atmos. Environ. 2004, 38, 4895–4907. [Google Scholar] [CrossRef]
  15. Liu, Y.; Wang, G.; Hu, Z.; Shi, P.; Lyu, Y.; Zhang, G.; Gu, Y.; Liu, Y.; Hong, C.; Guo, L. Dust storm susceptibility on different land surface types in arid and semiarid regions of northern China. Atmos. Res. 2020, 243, 105031. [Google Scholar] [CrossRef]
  16. Guan, Q.; Sun, X.; Yang, J.; Pan, B.; Zhao, S.; Wang, L. Dust storms in northern China: Long-term spatiotemporal characteristics and climate controls. J. Clim. 2017, 30, 6683–6700. [Google Scholar] [CrossRef]
  17. Zhang, B.; Tsunekawa, A.; Tsubo, M. Contributions of sandy lands and stony deserts to long-distance dust emission in China and Mongolia during 2000–2006. Glob. Planet. Change 2008, 60, 487–504. [Google Scholar] [CrossRef]
  18. Liu, X.; Yin, Z.Y.; Zhang, X.; Yang, X. Analyses of the spring dust storm frequency of northern China in relation to antecedent and concurrent wind, precipitation, vegetation, and soil moisture conditions. J. Geophys. Res. Atmos. 2004, 109, D16. [Google Scholar] [CrossRef]
  19. Guo, L.; Fan, B.; Zhang, F.; Jin, Z.; Lin, H. The clustering of severe dust storm occurrence in China from 1958 to 2007. J. Geophys. Res. Atmos. 2018, 123, 8035–8046. [Google Scholar] [CrossRef]
  20. Gui, K.; Yao, W.; Che, H.; An, L.; Zheng, Y.; Li, L.; Zhao, H.; Zhang, L.; Zhong, J.; Wang, Y. Two mega sand and dust storm events over northern China in March 2021: Transport processes, historical ranking and meteorological drivers. Atmos. Chem. Phys. Discuss. 2021, 1, 36. [Google Scholar]
  21. Wang, Y.; Yu, H.; Li, L.; Li, J.; Sun, J.; Shi, J.; Li, J. Long-term trend of dust event duration over Northwest China. Sci. Total Environ. 2024, 951, 175819. [Google Scholar] [CrossRef]
  22. Gui, K.; Yao, W.; Che, H.; An, L.; Zheng, Y.; Li, L.; Zhao, H.; Zhang, L.; Zhong, J.; Wang, Y. Record-breaking dust loading during two mega dust storm events over northern China in March 2021: Aerosol optical and radiative properties and meteorological drivers. Atmos. Chem. Phys. 2022, 22, 7905–7932. [Google Scholar] [CrossRef]
  23. Duniway, M.C.; Pfennigwerth, A.A.; Fick, S.E.; Nauman, T.W.; Belnap, J.; Barger, N.N. Wind erosion and dust from US drylands: A review of causes, consequences, and solutions in a changing world. Ecosphere 2019, 10, e02650. [Google Scholar] [CrossRef]
  24. Liu, L.; Wang, Z.; Che, H.; Wang, D.; Gui, K.; Liu, B.; Ma, K.; Zhang, X. Climate factors influencing springtime dust activities over Northern East Asia in 2021 and 2023. Atmos. Res. 2024, 303, 107342. [Google Scholar] [CrossRef]
  25. Kim, H.; Choi, M. Impact of soil moisture on dust outbreaks in East Asia: Using satellite and assimilation data. Geophys. Res. Lett. 2015, 42, 2789–2796. [Google Scholar] [CrossRef]
  26. Zou, X.K.; Zhai, P.M. Relationship between vegetation coverage and spring dust storms over northern China. J. Geophys. Res. Atmos. 2004, 109, D03104. [Google Scholar] [CrossRef]
  27. Guan, Q.; Yang, J.; Zhao, S.; Pan, B.; Liu, C.; Zhang, D.; Wu, T. Climatological analysis of dust storms in the area surrounding the Tengger Desert during 1960–2007. Clim. Dyn. 2015, 45, 903–913. [Google Scholar] [CrossRef]
  28. Zhou, W.; Wang, H.; Ge, Q. Contributions of climatic factors and vegetation cover to the temporal shift in Asian dust events. npj Clim. Atmos. Sci. 2024, 7, 328. [Google Scholar] [CrossRef]
  29. Liu, Y.; Xu, R.; Ziegler, A.D.; Zeng, Z. Stronger winds increase the sand-dust storm risk in northern China. Environ. Sci. Atmos. 2022, 2, 1259–1262. [Google Scholar] [CrossRef]
  30. Zhou, Y.; Wu, T.; Zhou, Y.; Zhang, J.; Zhang, F.; Su, X.; Jie, W.; Zhao, H.; Zhang, Y.; Wang, J. Can global warming bring more dust? Clim. Dyn. 2023, 61, 2693–2715. [Google Scholar] [CrossRef]
  31. Sulla-Menashe, D.; Friedl, M.A. User guide to collection 6 MODIS land cover (MCD12Q1 and MCD12C1) product. USGS Rest. Va Usa 2018, 1, 18. [Google Scholar]
  32. Didan, K.; Munoz, A.B.; Solano, R.; Huete, A. MODIS vegetation index user’s guide (MOD13 series). Univ. Ariz. Veg. Index Phenol. Lab 2015, 35, 2–33. [Google Scholar]
  33. Tan, M. Exploring the relationship between vegetation and dust-storm intensity (DSI) in China. J. Geogr. Sci. 2016, 26, 387–396. [Google Scholar] [CrossRef]
  34. Kong, K.; Nandintsetseg, B.; Shinoda, M.; Ishizuka, M.; Kurosaki, Y.; Bat-Oyun, T.; Gantsetseg, B. Seasonal variations in threshold wind speed for saltation depending on soil temperature and vegetation: A case study in the Gobi Desert. Aeolian Res. 2021, 52, 100716. [Google Scholar] [CrossRef]
  35. Yang, Q.; Fan, J.; Luo, Z. Response of soil moisture and vegetation growth to precipitation under different land uses in the Northern Loess Plateau, China. Catena 2024, 236, 107728. [Google Scholar] [CrossRef]
  36. Guo, J.; Xu, H.; Liu, L.; Chen, D.; Peng, Y.; Yim, S.H.L.; Yang, Y.; Li, J.; Zhao, C.; Zhai, P. The trend reversal of dust aerosol over East Asia and the North Pacific Ocean attributed to large-scale meteorology, deposition, and soil moisture. J. Geophys. Res. Atmos. 2019, 124, 10450–10466. [Google Scholar] [CrossRef]
  37. Takemi, T.; Seino, N. Dust storms and cyclone tracks over the arid regions in east Asia in spring. J. Geophys. Res. Atmos. 2005, 110, D18S11. [Google Scholar] [CrossRef]
  38. Wu, C.; Lin, Z.; Shao, Y.; Liu, X.; Li, Y. Drivers of recent decline in dust activity over East Asia. Nat. Commun. 2022, 13, 7105. [Google Scholar] [CrossRef]
  39. Zucca, C.; Fleiner, R.; Bonaiuti, E.; Kang, U. Land degradation drivers of anthropogenic sand and dust storms. Catena 2022, 219, 106575. [Google Scholar] [CrossRef]
  40. Ravi, S.; D’Odorico, P.; Breshears, D.D.; Field, J.P.; Goudie, A.S.; Huxman, T.E.; Li, J.; Okin, G.S.; Swap, R.J.; Thomas, A.D. Aeolian processes and the biosphere. Rev. Geophys. 2011, 49, RG3001. [Google Scholar] [CrossRef]
Figure 1. Spatial distribution of annual frequency of DSD in China during 2000–2024. Black boxes with numbers 1 and 2 denote TD and GD source regions, respectively.
Atmosphere 16 00589 g001
Figure 2. Spatial distribution of seasonal mean DSD in China during 2000 to 2024 for (a) spring, (b) summer, (c) autumn, and (d) winter.
Atmosphere 16 00589 g002
Figure 3. Interannual variation and trend of DSD in (a) TD and (b) GD source regions from 2000 to 2024. The dashed lines indicate linear trends.
Atmosphere 16 00589 g003
Figure 4. Correlation between spring DSD and meteorological factors in TD (left column) and GD (right column) regions from 2000 to 2024. The green dots represent interannual data points from each year. Panels (a,b) show correlations with wind speed; panels (c,d) with strong wind days; and panels (e,f) with precipitation.
Atmosphere 16 00589 g004
Figure 5. Correlation between summer DSD and meteorological factors in TD (left column) and GD (right column) regions from 2000 to 2024. The orange dots represent interannual data points from each year. Panels (a,b) show correlations with wind speed; panels (c,d) with strong wind days; and panels (e,f) with precipitation.
Atmosphere 16 00589 g005
Figure 6. Spatial distribution of changes in barren land within different land use types during 2001–2023: (a) 2001–2023, (b) 2001–2013, and (c) 2013–2023. Black boxes with numbers 1 and 2 denote TD and GD source regions, respectively.
Atmosphere 16 00589 g006
Figure 7. Correlation between spring (a,b) and summer (c,d) DSD and NDVI in TD region (left column) and GD region (right column) from 2000–2024. The dots represent interannual data points from each year.
Atmosphere 16 00589 g007
Table 1. Changes in barren land area (km2) in TD and GD regions across three time periods.
Changes2001–20232001–20132013–2023
TD RegionGD RegionTD RegionGD RegionTD RegionGD Region
Nonbarren or unchanged1,014,9331,525,9551,029,5381,526,6671,044,0661,600,454
Barren to other45,74596,34231,14096,41818,66912,141
Other to barren6121330261212514406413,004
Disclaimer/Publisher’s Note: The statements, opinions and data contained in all publications are solely those of the individual author(s) and contributor(s) and not of MDPI and/or the editor(s). MDPI and/or the editor(s) disclaim responsibility for any injury to people or property resulting from any ideas, methods, instructions or products referred to in the content.

