Article

Analysis of the Integrated Signal Design for Near-Space Communication, Navigation, and TT&C Based on K/Ka Frequency Bands

1
Xi’an Institute of Electromechanical Information Technology, Xi’an 710065, China
2
Science and Technology on Electromechanical Dynamic Control Laboratory, Xi’an 710065, China
3
School of Astronautics, Northwestern Polytechnical University, Xi’an 710072, China
4
National Graduate College for Engineers, Tsinghua University, Beijing 100084, China
*
Author to whom correspondence should be addressed.
Atmosphere 2025, 16(5), 586; https://doi.org/10.3390/atmos16050586
Submission received: 5 March 2025 / Revised: 24 April 2025 / Accepted: 9 May 2025 / Published: 13 May 2025
(This article belongs to the Section Atmospheric Techniques, Instruments, and Modeling)

Abstract

:
With its unique environment and strategic value, the near space (NS) has become the focus of global scientific and technological, military, and commercial fields. Aiming at the problem of communication interruption when the aircraft re-enters the atmosphere, to ensure the needs of communication, navigation, and telemetry, tracking, and command (TT&C), this paper proposes an overall integration of communication, navigation, and TT&C (ICNT) signals scheme based on the K/Ka frequency band. Firstly, the K/Ka frequency band is selected according to the ITU frequency division, high-speed communication requirements, advantages of space-based over-the-horizon relay, overcoming the blackout problem, and the development trend of high frequencies. Secondly, the influence of the physical characteristics of the NS on ICNT is analyzed through simulation. The results show that when the K/Ka signal is transmitted in the NS, the path loss changes significantly with the elevation angle. The bottom layer loss at an elevation angle of 90° is between 143.5 and 150.5 dB, and the top layer loss is between 157.5 and 164.4 dB; the maximum attenuation of the bottom layer and the top layer at an elevation angle of 0° is close to 180 dB and 187 dB, respectively. In terms of rainfall attenuation, when a 30 GHz signal passes through a 100 km rain area under moderate rain conditions, the horizontal and vertical polarization losses reach 225 dB and 185 dB, respectively, and the rainfall attenuation increases with the increase in frequency. For gas absorption, the loss of water vapor is higher than that of oxygen molecules; when a 30 GHz signal is transmitted for 100 km, the loss of water vapor is 17 dB, while that of oxygen is 2 dB. The loss of clouds and fog is relatively small, less than 1 dB. Increasing the frequency and the antenna elevation angle can reduce the atmospheric scintillation. In addition, factors such as the plasma sheath and multipath also affect the signal propagation. In terms of modulation technology, the constant envelope signal shows an advantage in spectral efficiency; the new integrated signal obtained by integrating communication, navigation, and TT&C signals into a single K/Ka frequency point has excellent characteristics in the simulation of power spectral density (PSD) and autocorrelation function (ACF), verifying the feasibility of the scheme. The proposed ICNT scheme is expected to provide an innovative solution example for the communication, navigation, and TT&C requirements of NS vehicles during the re-entry phase.

1. Introduction

The near space (NS), also known as the sub-orbit, is located in the airspace range from 20 km to 100 km [1]. Generally, the flight altitude of aviation aircraft is below 20 km, while the flight altitude of satellites is usually above 100 km. Therefore, it is difficult for aircraft and satellites to stay in the NS for a long time, and it is in an “awkward” altitude range where “aircraft can’t reach it and satellites can’t come down to it”. Due to its special spatial position, it is of great significance both in scientific research and practical applications. Precisely because of this, the development and utilization of the NS has attracted extensive attention from scientists around the world. Correspondingly, a NS vehicle refers to a sub-orbital vehicle that can only fly or is capable of flying in the NS for a long time and continuously, or a hypersonic cruise vehicle flying in the near space, such as airships, high-altitude floating balloons, high-altitude long-endurance unmanned aerial vehicles (UAV), long-distance remotely controlled gliding vehicles, and space shuttles (including reusable ones), etc. They have great development potential in emergency support, scientific investigation, space exploration, agriculture, and other aspects, and possess advantages that aviation and aerospace vehicles do not have [2,3,4]. With the gradual rise of manned spacecraft, especially commercial aerospace, in the foreseeable future, NS vehicles may play a greater role in human exploration of space and the universe. However, spacecraft all face the problem of communication interruption with ground stations when re-entering the atmosphere. In order to meet the communication, navigation and tracking, telemetry and command (TT&C) requirements of spacecraft during re-entry into the atmosphere, we are compelled to consider an integrated communication, navigation, and TT&C (ICNT) signal that can adapt to the NS, so as to alleviate this problem from the perspective of signal design. To this end, scholars in relevant fields within the industry have successively put forward reference suggestions or solutions.
At the national level, the National Aeronautics and Space Administration (NASA) of the United States (2019, 2020, 2024) has mentioned the development that will cover aspects such as broadband Ka band, optical radio frequency (RF) hybrid antennas, and user-initiated services (UIS) [5,6,7]. It hopes to leverage the commercial satellite communication services in low Earth orbit (LEO) to expand and potentially replace the tracking and data relay satellite service (TDRSS), and plans to gradually discontinue the use of TDRSS. The State Council Information Office (SCIO) of the People’s Republic of China released a white paper titled “Full text: China’s Space Program: A 2021 Perspective”. In addition to introducing the main achievements of China’s space industry development since 2016, it also mentioned that in the next five years, China will continue to improve its space infrastructure, promote the integrated development of satellite technologies such as remote sensing, communication, and navigation and positioning, advocate good and efficient governance of outer space, expand the cause of human progress, and make positive contributions to world peace and development [8]. The European Union and its member states attach great importance to the strategic value of NS. They have issued plans such as the “Horizon” program and the European space program, providing financial and policy support for the research of high-speed aircraft, NS platforms, etc., so as to help the sustainable development of Europe’s space capabilities and related infrastructure by promoting technological innovation in the industrial and scientific communities [9,10]. As a pioneer in space projects and programs for exploring space beyond the Earth, Russia plays a crucial role in the development of satellite technology and the conduct of international cooperation. Russia remains committed to maintaining a position in the field of human spaceflight and sustaining its key programs [11]. The Indian space program has two objectives: to conduct space discovery and exploration through space missions, and to promote research and education related to space science within the country, with a focus on the fields of remote sensing, astronomy and astrophysics, atmospheric science, and space science in a broad sense [12]. The Japan Aerospace Exploration Agency (JAXA) is an important participant in international space activities. Although Japan lagged far behind the United States, the Soviet Union, and France in launching its first artificial satellite and sending its first astronaut into space, in recent years, through the “Hayabusa” and “Hayabusa2” spacecraft, Japan has become a world leader in the field of asteroid exploration. Its subsequent focus of space exploration is the Martian moon exploration mission (MMX) [13]. The above-mentioned space research plans of various countries will provide a historical opportunity for the development of ICNT and promote the development of communication, navigation, TT&C technologies, and related services.
In both the academic and industrial communities, E. Baghdadyet et al. (1965) discussed the basic considerations for the signal design of the NS communication and tracking system. They considered that meeting the requirements of precise tracking is a prerequisite for realizing an integrated space system, through the application of the characterization and design of precise tracking signals, and illustrated the design constraints of the signals [14], providing reference principles for the subsequent ICNT of NS. Yang (2006) adopted the strategy of applying the K-band to measurement and navigation and proposed a precise navigation and velocity measurement method for GRACE formation-flying satellites that integrates on-board K-band range measurement data, velocimeter data, and international GPS service (IGS) precise ephemeris data to simultaneously estimate the positions and velocities of the formation-flying satellites [15]. Dou et al. (2007), based on the research on regional satellite navigation systems and NS applications, pointed out that the NS is the space-based application field of satellite navigation systems, and satellite navigation systems are the spatiotemporal information foundation for NS applications, and put forward the ideas for NS applications and related key technologies [16]. Due to the difference in flight altitude between the NS platform and the navigation satellite, the NS pseudolite signals have a very serious near-far effect (NFE), and measures must be taken to solve it. To this end, Yang et al. (2009) designed the NS pseudolite signals by using the mature pulse emission method and proposed a design method for the pseudolite signals in the NS regional navigation augmentation system to avoid the occurrence of the NFE [17]. K. P. McCarthy et al. (2010), according to NASA’s Ka-band architecture solution for enhancing its space communication capabilities, described the driving factors and concepts of this solution, and analyzed the corresponding constraints and the requirements for future scalability [18]. Li et al. (2013), aiming at the navigation requirements, proposed a navigation signal design scheme. When the transmission power is 20 dBW and the beam half-angle is 60°, the signal reception power can reach −167.3 dBW. This research provides a reference for the navigation signal design of NS vehicles [19]. Yang et al. (2014) proposed a regional navigation and positioning system based on NS vehicles, expounded the characteristics of NS vehicles, and based on this basis, established the architecture of the regional navigation system based on NS vehicles, but did not mention how to solve the communication and TT&C problems faced by the NS [20]. In view of the fact that when the vehicle cruises at hypersonic speed in the NS, a plasma sheath is generated, which seriously affects the transmission performance of communication signals. Christ P. Tzelepis (2016) recommended methodologies and enabling technologies based on NASA’s fundamental architectural concept for its future space communications and navigation (SCaN) framework and space relay capability requirements for 2025–2040, which could provide design references for current and future ICNT architectures [21]. Ling et al. (2016) used the finite-difference time-domain (FDTD) method to analyze the transmission characteristics of the terahertz band in a non-uniform plasma sheath, then studied the influence of the steepness of the electron density distribution and the changes in the peak point on its transmission performance [22], providing theoretical support for the signal transmission of ICNT in the NS. T. J. Martin-Mur (2017) proposed using an optical communication system for deep space navigation and was committed to making the system meet the navigation requirements of the mission, so that it could serve only as a backup for emergency communication and navigation. This provides a reference example for the multi-source fusion mode of ICNT [23]. B. Wu et al. (2017) explored the integrated design architecture of TT&C and communication from the aspect of network coverage. They designed a three-layer architecture of the space–air–ground integrated TT&C and communication network with comprehensive coverage and flexible networking. However, the navigation service was not taken into consideration. Nevertheless, it can still provide a reference for the information transmission of ICNT [24]. Wang et al. (2019), from the perspective between the navigation payload and the signal design, analyzed the degradation effect of the constant envelope signal in the nonlinear power amplifier. This research provides a theoretical basis for the compatibility design of NS navigation signals in hardware implementation [25]. Jon Hamkins (2020) pointed out that to achieve the goal of increasing future space applications by an order of magnitude, higher RF bands and optical communication technologies are required to avoid spectrum congestion, and better channel coding and modulation methods are needed to make full use of the limited power and spectrum resources. This is in line with the connotation of the signal design technology of ICNT [26]. Modenini et al. (2023) introduced a tutorial on the TT&C for spacecraft and satellite missions. They also provided supplementary information about emerging TT&C technologies and the standardized framework, which offers fundamental research support for the signal design of future ICNT [27]. Liu et al. (2024) explored the role of NS communication in the space–air–ground–sea integrated network (SAGSIN), pointed out that the NS platform can provide low-latency and wide-coverage signal relay services for navigation and communication, and also proposed the design direction of navigation and communication signals based on the reconfigurable multiple-input multiple-output (MIMO) technology [28], but this design did not incorporate TT&C services. Xu et al. (2023, 2025) proposed a modulation method based on two-dimensional orthogonal time-frequency space (OTFS) and non-coherent orthogonal time-frequency space modulation. This type of modulation is expected to solve the multipath problem of NS by transforming the fading problem encountered in the time-frequency domain into time-invariant fading in the delay-Doppler (DD) domain [29,30].
Although the above studies have proposed numerous alternative reference schemes, at present, there is no complete design architecture and corresponding solution for the ICNT signals in the NS within the K/Ka frequency bands and even higher frequency bands. Based on the background of the integrated service requirements for ICNT in the NS, and taking into account the particularity of the NS atmospheric environment, it is necessary to analyze the physical characteristics of the NS atmosphere, and based on these to propose a service signal that simultaneously meets the requirements of communication, navigation, and TT&C services, as well as the modulation scheme it carries. This is aimed at improving service efficiency, simplifying the design complexity of the receiver, enhancing the spectrum utilization of the signal, cutting costs, and addressing the current communication, navigation, and TT&C task requirements for hypersonic vehicles entering the atmosphere. The structure of this paper is arranged as follows. In Section 2, the basic considerations for the integrated frequency selection of communication, navigation, and TT&C in the NS will be introduced. Section 3 will focus on analyzing the characteristics of the NS atmospheric environment and conduct a simulation analysis of the influencing factors that affect the integration of NS communication, navigation, and TT&C. On the basis of Section 3, in Section 4, in response to the requirements of the integrated channels for ICNT in the NS and providing the simulation analysis of the spectral utilization rate of typical signals and the performance of typical integrated signals, then we present our general considerations and reference solutions for the integrated modulation technology. The last section presents our research conclusions and points out the future research directions.

2. NS Communication, Navigation, and TT&C Integrated Frequency Selection

Currently, the atmospheric propagation characteristics of low-frequency bands like L and S have been extensively studied in satellite communication, navigation, and TT&C [31,32]. However, there is no complete research data on the signal design of high-frequency bands suitable for NS communication, navigation, and TT&C systems [33,34,35,36]. Since the integrated system of communication, navigation, and TT&C for NS vehicles is the core of the information support for vehicles re-entering the atmosphere and high-altitude vehicles performing tasks, the selection of frequency bands will affect the equation of the entire technical solution; it is a key issue that requires comprehensive consideration, has far-reaching influence, and is of strategic significance. Therefore, selecting a reasonable and feasible frequency band is the prerequisite and foundation for carrying out the integrated signal design. In this subsection, frequency bands suitable for the NS in the future are selected from multiple aspects to provide theoretical support for the integrated signal design of communication, navigation, and TT&C. Next, according to the actual requirements of the integrated signal design of communication, navigation, and TT&C for NS vehicles, we will demonstrate the issue of frequency band selection for the integrated signals of communication, navigation, and TT&C of NS vehicles from five aspects: the standards (as shown in Table 1) of the international telecommunication union (ITU) [37,38,39,40,41,42,43,44], high-speed communication, over-the-horizon relaying, plasma sheaths and blackouts, and the maturity of equipment development at the current stage.
(1)
ITU spectrum division
At the world radiocommunication conference 1997 (WRC-97), it was recommended that the frequency bands of 47.2–47.5 GHz (downlink) and 47.9–48.2 GHz (uplink) be exclusively allocated for the services of NS platforms, but considering the strong rain attenuation in the 47–48 GHz frequency band, and the fact that the related devices and equipment at that time were still under development and were expensive, the WRC-2000 conference in 2000 added the frequency bands of 27.5–28.35 GHz (downlink) and 31.0–31.3 GHz (uplink) for the use of NS communication services [45]. From this regulation of the international telecommunication union (ITU), it can be found that the frequency bands allocated for the use of the NS mainly concentrate in the K (18 GHz–27 GHz), Ka (27 GHz–40 GHz), and Q/V (40 GHz–75 GHz band, with part of the lower frequency band overlapping with the Ka band) bands, that is, the millimeter-wave band. However, considering the factor of rain attenuation, the Q/V band is not the best choice at present. Therefore, the K/Ka frequency bands can be selected as the operating frequency bands for the integrated platform of communication, navigation, and TT&C of NS vehicles to carry out services. The frequency spectrum resources in this frequency band are abundant, which can enable large-capacity or broadband multimedia communication. They are also convenient for compatibility with 5G and 6G mobile communications, and can form a communication network that coordinates with the ground cellular network [46,47]. Figure 1 shows the application scenarios of various frequency bands within the frequency range from 1 GHz to 40 GHz. It is not difficult to observe the advantages of the spectral resources in the K/Ka frequency bands.
(2)
High-speed Communication
Regarding NS vehicles, especially low-dynamic vehicles, one of their main uses is to achieve persistent regional information acquisition and anti-interference capabilities. Therefore, they must have strong high-speed communication capabilities, which requires the communication, navigation, and TT&C systems of the NS platform to adopt higher frequency bands and yield wider bandwidths [48]. Taking the 27.5–28.35 GHz (downlink) band divided by the ITU as an example, it has a total bandwidth of 0.85 GHz [49]. If the transmission bandwidth B is selected according to the requirement of 1.3Rc (Rc is the transmission channel symbol rate), for binary phase shift keying (BPSK) modulation, the symbol rate that can be transmitted is 650 Mbps, and for quadrature phase shift keying (QPSK) modulation, it can reach 1.3 Gbps. In addition, high-frequency bands also help to reduce the bit error rate (BER) of communication; due to the increase in the carrier frequency f0, the relative bandwidth B/f0 decreases. Thus, within the same B, the linearity of the phase-frequency characteristic and the uniformity of the amplitude-frequency characteristic of the radio frequency front-end in the high-frequency band are improved, which is beneficial to reducing the BER of communication. From the perspective of future practical applications, since the L, S, and C frequency bands are already quite crowded and the spectrum resources are facing exhaustion, it is not advisable to use low-frequency bands such as L, S, and C anymore. Undoubtedly, the K/Ka bands are the best choice.
(3)
Over-the-horizon relay
When the NS platform is beyond the radio line-of-sight (LOS) range of the ground TT&C station, especially when the reusable space shuttle re-enters the atmosphere, the plasma sheath and blackout effect will occur. Therefore, the communication and TT&C must adopt the relay mode. General relays are divided into three types: ground relay, air relay, and satellite relay. However, for the NS platform, due to its altitude, ground relay and satellite relay are of little significance. In particular, the S-band of the relay satellite only supports low-speed communication below 1 Mbps [50], so it is not suitable for the communication needs of the NS platform. The C-band of communication satellites and the L-band of navigation satellites are narrow and very crowded, and are also not suitable for the requirements of high-speed communication and precise navigation. Therefore, to improve the reliability and convenience of the NS platform TT&C system, it is necessary to select the air-based relay mode. At present, systems such as the tracking and data relay satellite system (TDRSS) based on the Ka band, the NASA deep space network (DSN), and the European space agency (ESA) DSN provide design references for the integration of future communication, navigation, and TT&C integrated services based on K/Ka [51,52,53]. Moreover, the K/Ka dual-band over-the-horizon TT&C system can realize over-the-horizon communication, navigation, and TT&C services separately. This mode has the advantages of a large coverage area that ground relays do not have and high flexibility that satellite relays do not have.
(4)
Plasma sheath and black barrier problem
When a high-dynamic NS vehicle flies in the NS at a speed of 5 to 25 Mach, the plasma sheath effect and the blackout phenomenon will occur, which may lead to the interruption of radio signals. To address this, there are two technical approaches: one is to start from the integrated technology of communication, navigation, and TT&C itself, such as increasing the transmission power and raising the operating frequency. Theoretically, when the aperture of the space–ground system, the system noise temperature, and the transmission power remain unchanged, for the K/Ka frequency band with a frequency f1 ranging from 18 to 40 GHz, compared with the L band with a frequency f2 of 1 to 2 GHz, the frequency is increased by N = f1/f2 = 40/1 = 40 times, then the received level is increased by 20lgN. It can be obtained that the maximum gain can be increased by 32 dB; this largely compensates for the reduction in the signal-to-noise ratio (SNR) caused by rain attenuation and space transmission loss. Similarly, according to the calculation equation of the half-power beamwidth (angle) [54],
θ = 70.5 ° × ( λ / D )
where λ is the operating wavelength of the antenna, and D is the aperture of the antenna.
According to Equation (1), it can be known that by narrowing the beam, the power density of the signal can be increased, which is beneficial to improving the anti-interference ability of the signal. In addition, when the beam width is narrowed, it can not only greatly save the power on the satellite and reduce the volume of the equipment, but also reduce the mutual interference between ground TT&C stations. The second approach is to change the electrical characteristics of the plasma medium, such as improving the aerodynamic shape of the vehicle, adding substances to reduce the electron density, etc. [55]. Usually, changing the aerodynamic shape of the vehicle is costly and will affect the original design of the space payload. Moreover, many of these methods are still in the theoretical research stage, with complex technology and great implementation difficulty. Therefore, only the first technical approach will be discussed below.
  • Increasing the power of the transmitter can offset the attenuation of radio waves by the plasma to a certain extent, but increasing the power of the transmitter is limited by various factors such as devices, and it can only be used as an auxiliary means when it is effectively coordinated with the frequency selection.
  • By increasing the operating frequency, in the radio attenuation measurement experiment (RAM) in the United States, three antennas with frequencies of 220 MHz, 5700 MHz, and 9200 MHz were installed on the warhead at the same time, respectively. The recorded altitudes at which the radio signals were interrupted were 80 km, 54 km, and 40 km, and the altitude at which the signals recovered from the interruption was between 22 km and 23 km [56]. China and Russia have also conducted similar experiments, and the common conclusion is that increasing the frequency of radio waves has an obvious effect on reducing the altitude at which the blackout occurs.
Therefore, through the above two points of analysis, the perspective of the design of the integrated communication, navigation, and TT&C system itself can be seen. Currently, increasing the operating frequency band is the only positive and effective measure to resist the plasma sheath and the blackout phenomenon. According to relevant information, it has been clearly demonstrated that the higher the frequency band, the better the effect of overcoming the blackout [57]. Therefore, from the perspective of overcoming the blackout, it is very advantageous to use the K/Ka high-frequency band, it has the advantages of high bandwidth, good beam directivity, few interference sources, and stable propagation, and is suitable for applications requiring high-speed and large-capacity data transmission.
(5)
Maturity of equipment development
At present, the K/Ka band TT&C equipment is very mature, and its price is comparable to that of devices in other frequency bands; there are not too many difficulties in system design and equipment development. The new generation of geostationary communication satellites in the United States, Japan, Canada, China, and other countries basically use the K/Ka band for communication and transmission [58,59]. The typical representatives of TT&C systems operating in the Ka band include TDRSS, NASA DSN, and ESA DSN [60,61,62]. In addition, the Q/V band has been rarely used, mainly due to problems such as immature technology and the need to develop key devices from the bottom up [63].
Combined with the current development trend, most countries encourage the application of higher frequency bands such as K/Ka for TT&C to meet the TT&C mission requirements of complex systems such as large-scale constellations in the future [64]. Combining the analysis of parts (1) to (5) in this subsection and the research references, the K/Ka frequency bands have great potential advantages compared with the traditional L/S/C frequency bands, as shown in Table 2; considering all the above factors, the K/Ka band is suitable for NS communication, navigation, and TT&C, but the Q/V band can be used as a backup/emergency band. Therefore, this paper focuses on the K/Ka band to analyze the impact of NS physical characteristics on its communication, navigation, and TT&C integration.

3. Influence of Physical Properties of NS on Communication, Navigation, and TT&C Integration

3.1. Theoretical Loss of Signal Propagation in NS

NS vehicles have time-varying free-space propagation loss, the estimation of free-space loss can be calculated according to the Friis Equation, and the calculation equation converted into the dB form is as follows [65],
L p = 32.45 + 20 lg d ( km ) + 20 lg f ( MHz ) ( dB )
where the unit of d is km, and the unit of f is MHz.
For the NS, the loss of the K/Ka band signals (18 GHz–40 GHz) is shown in Figure 1. When the elevation angle is 90°, as the frequency increases, the loss also increases, the range of the path loss is roughly between 143 dB and 165 dB.
Since the distance between the NS vehicle and the receiving end changes in real time, the magnitude of the transmission loss also changes accordingly. The linear distance between the NS vehicle and the ground is approximately 20–100 km. Assuming that the communication elevation angle is between 0 and 90°, without considering the influence of the Earth’s curved surface, the calculation of the inclined path of the signal propagation is as follows [66],
D = H n s H 0 sin θ ( θ 5 ° ) 2 ( H n s H 0 ) sin 2 θ + 2 ( H n s H 0 ) Re + sin θ ( θ < 5 ° ) ( km )
where Hns is the height (km) of the NS vehicle in the NS; H0 is the height of the ground station above mean sea level (km); θ is the elevation angle (°); Re = 8500 (km), which is the effective radius of the Earth.
According to Equation (2), the propagation distance range between the NS vehicle and the receiving end can be obtained, which is approximately 20 km to 1303.841 km. Figure 2 shows the simulation results of the attenuation estimation values at different elevation angles when the NS vehicle is located at the bottom and top layers of the NS, respectively.
According to Figure 2a, from the simulation results, it can be found that at the elevation angle of θ = 90°, for the path at the bottom layer, the loss ranges from 143.5 dB to 150.5 dB; for the path at the top layer, the loss ranges from 157.5 dB to 164.4 dB. In addition, according to the simulation results of Figure 2b,c, as the elevation angle decreases, the path loss becomes greater. When the elevation angle is θ = 0°, the maximum attenuations of the bottom layer and the top layer are close to 180 dB and 187 dB, respectively, and the attenuation difference between the two is almost 7 dB.

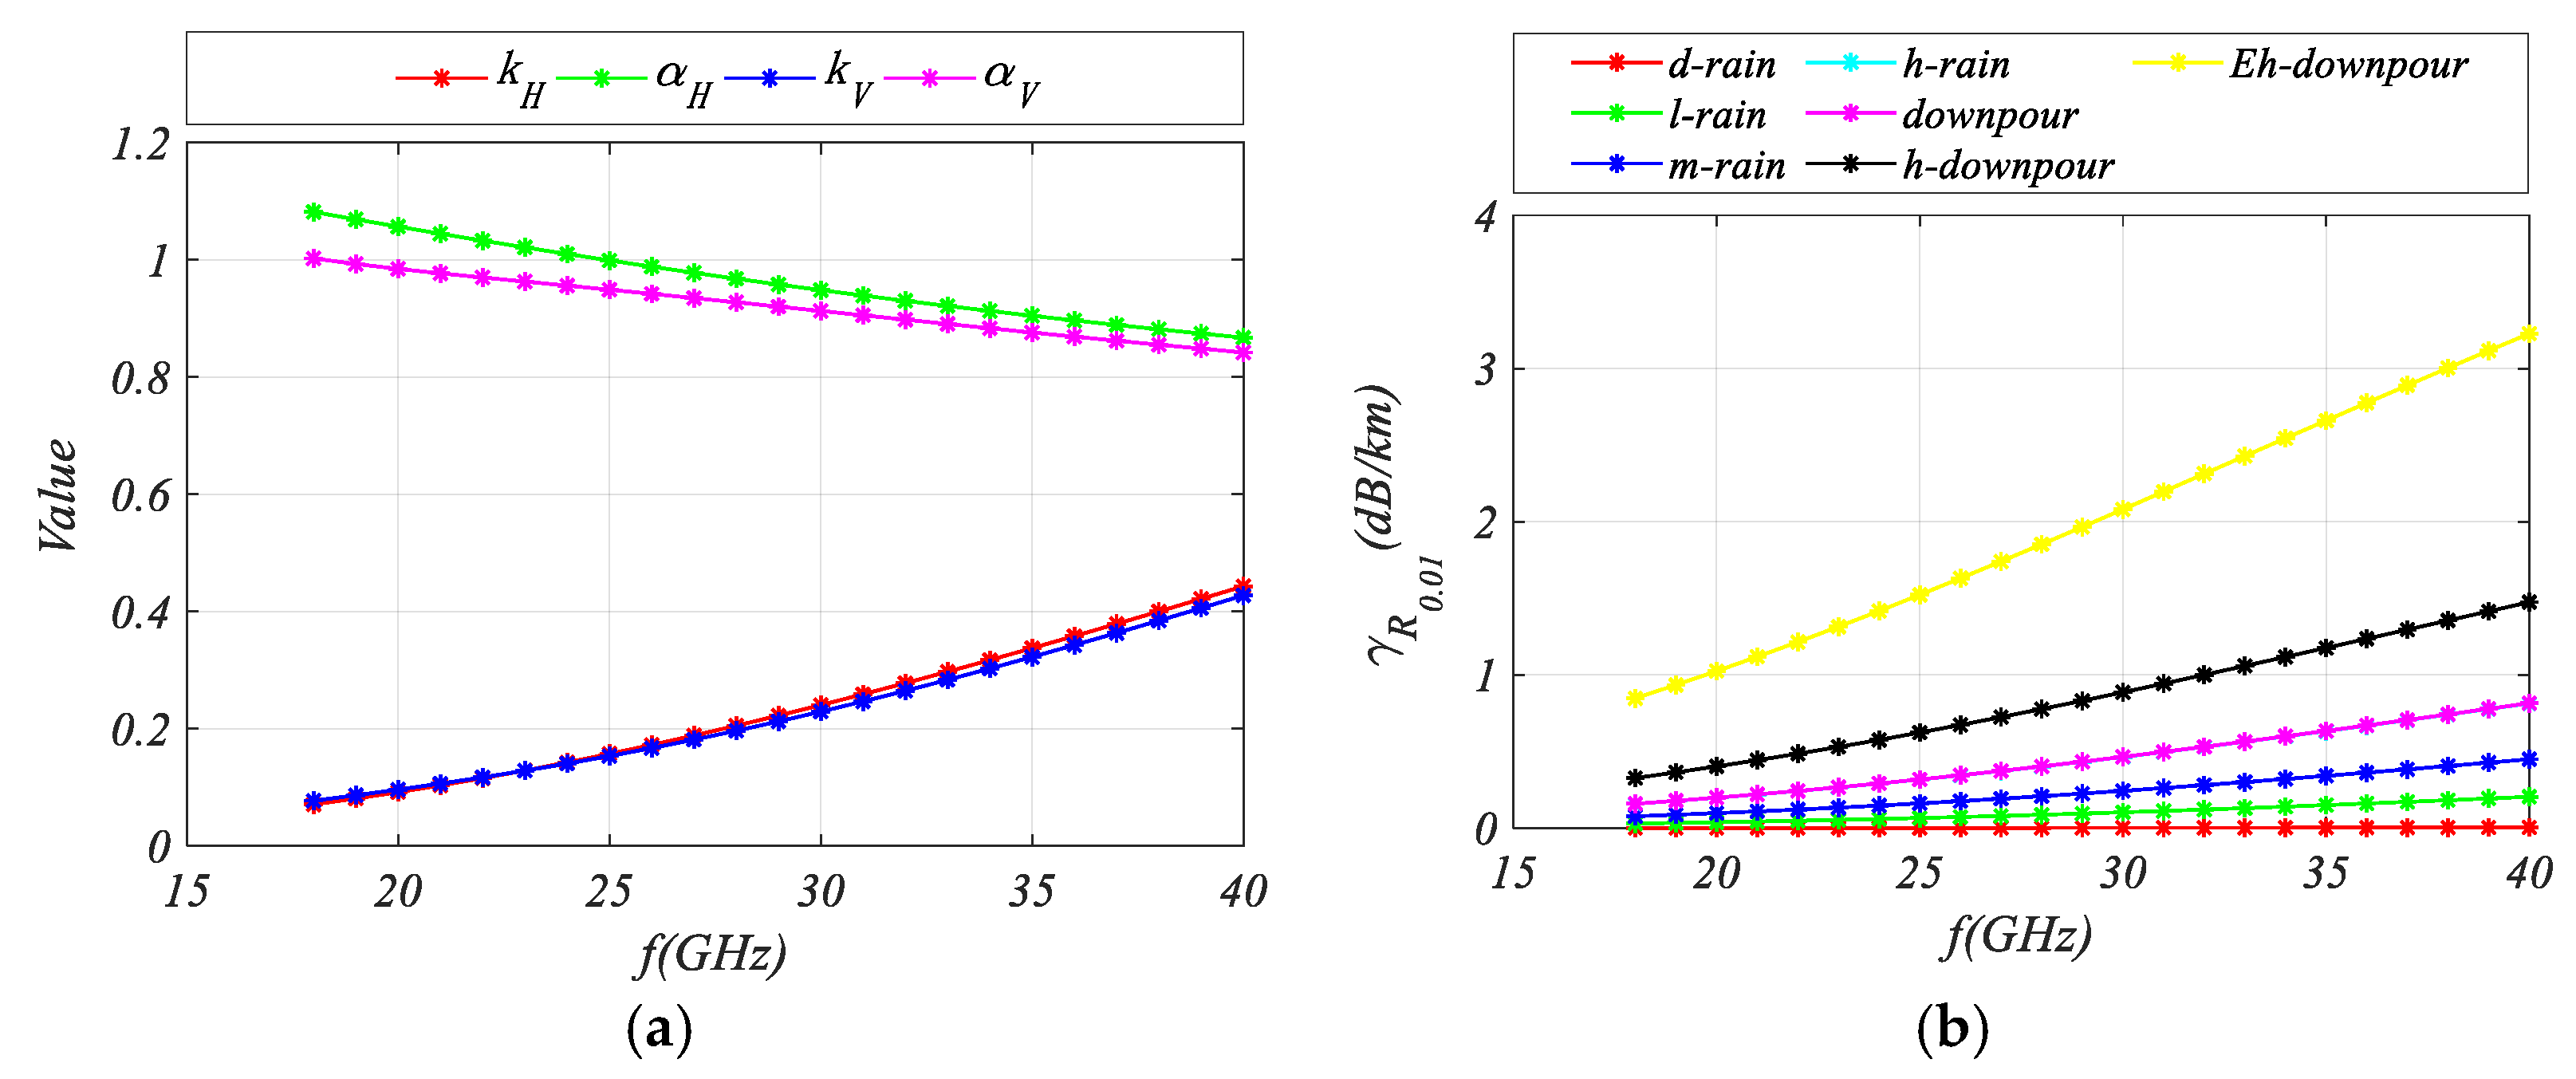
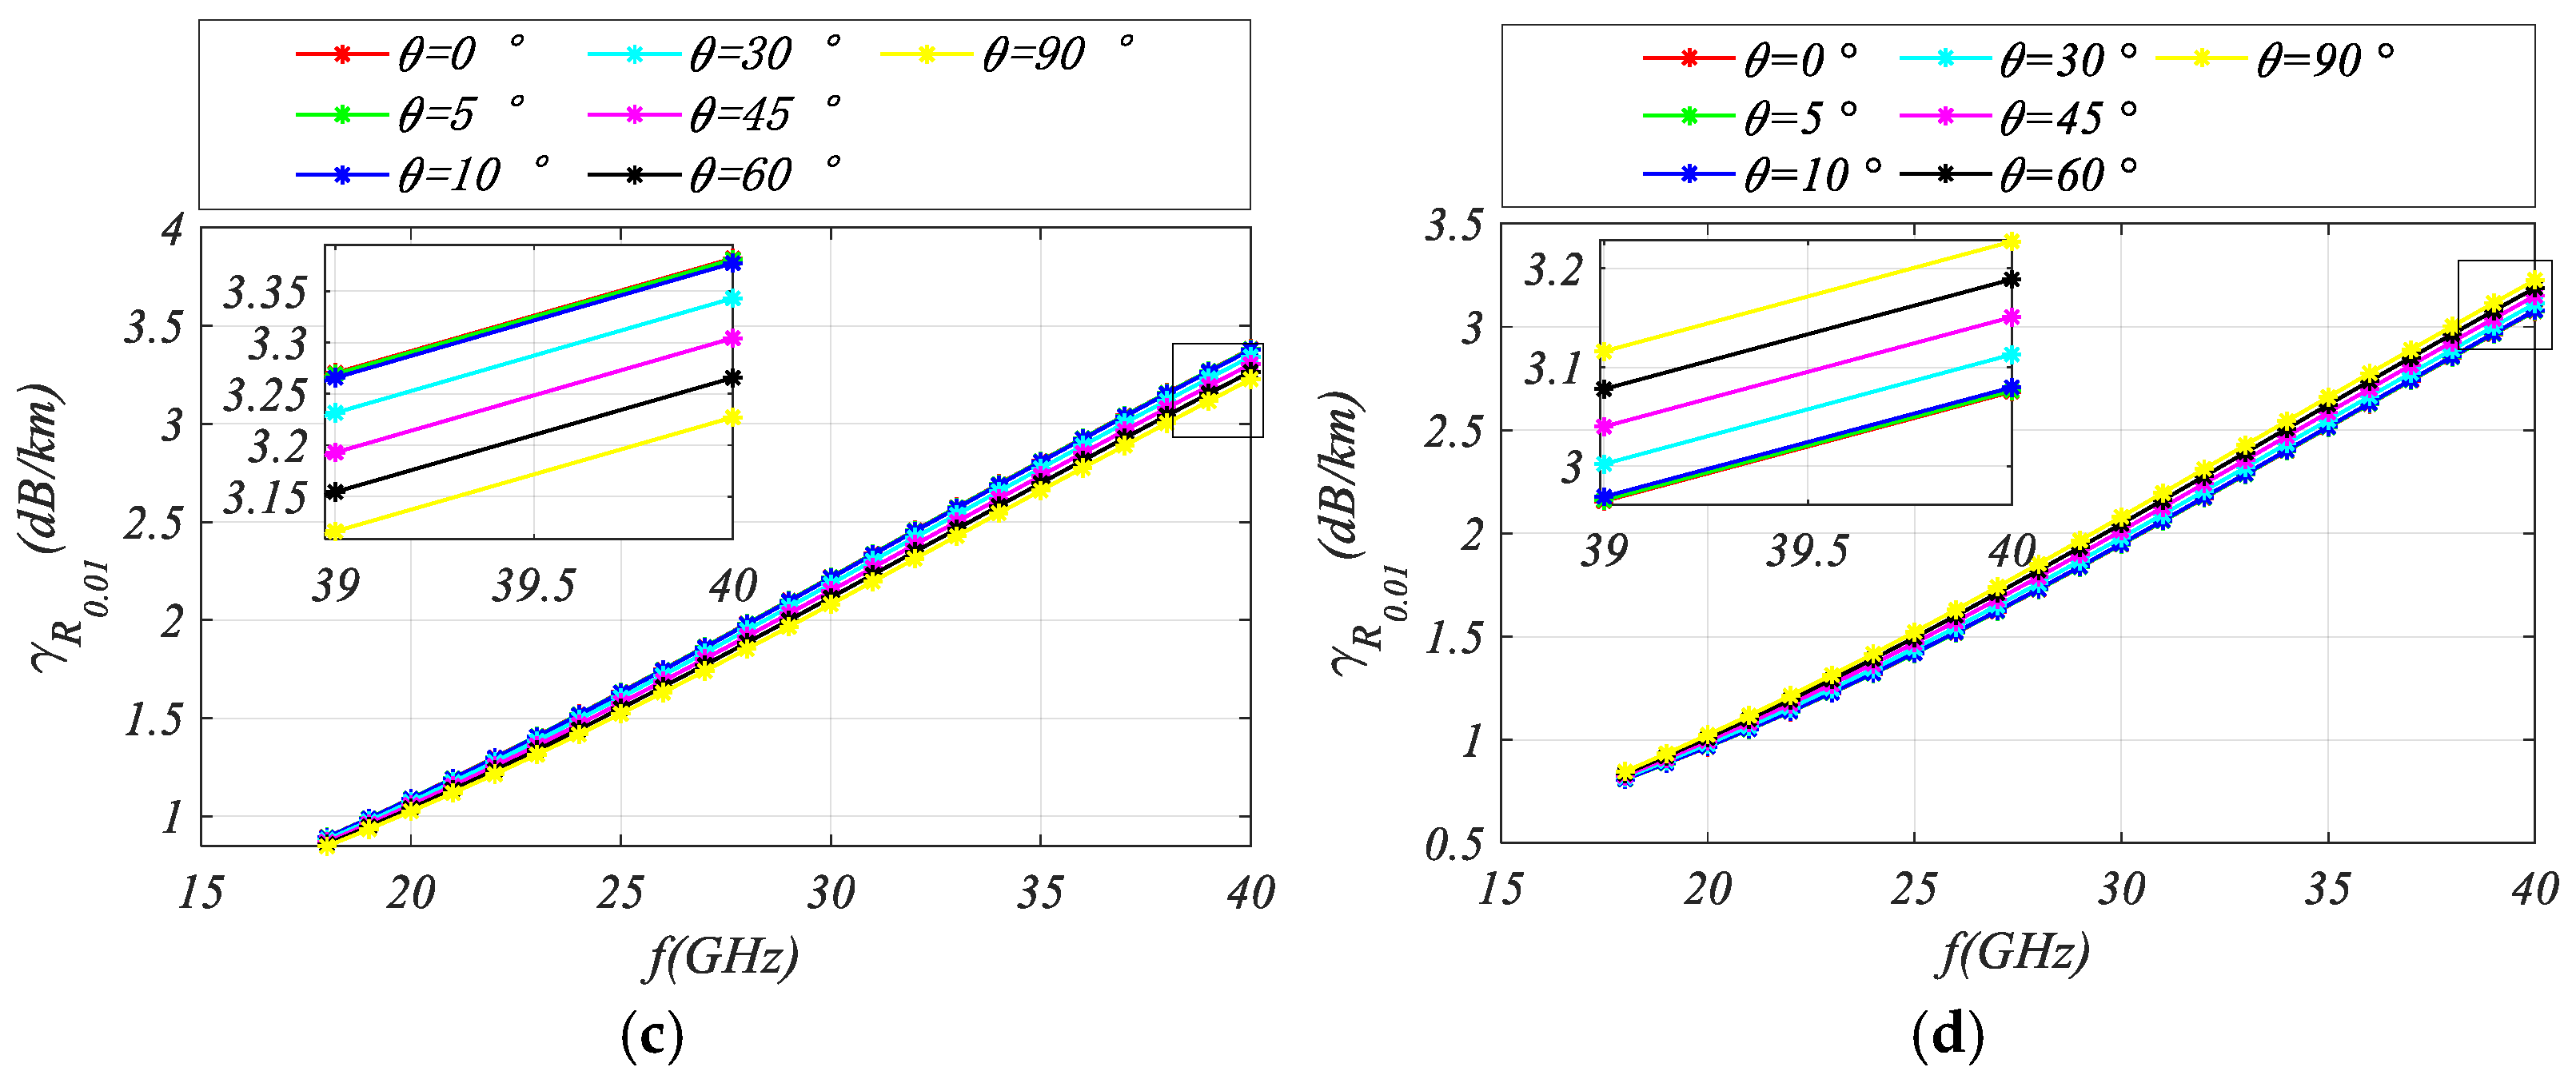
3.2. NS Rainfall Attenuation

For wireless communication systems operating in frequency bands above 10 GHz, rainfall will be the most significant factor affecting their performance. In practical situations, rainfall is generally uneven in both time and space, and the inhomogeneity and randomness of rainfall make it extremely difficult and complex to accurately calculate rain attenuation. Currently, several relatively mature calculation methods internationally include the ITU-R, Lin, SAM, and Crane models, etc. [67,68,69,70,71], where the ITU-R rainfall attenuation prediction model is widely used internationally due to its characteristics such as easy to use, requiring fewer input parameters, and having relatively high calculation accuracy. For all path geometries in linear polarization and circular polarization, the ITU-R recommends that the average annual rainfall (mm/h) at a specific location for the space-to-ground path at 0.01% of the annual time is calculated as follows [71],
γ R = k ( R 0.01 ) α
where k = [kHaH + kVaV + (kHkV) cos2q cos(2e)]/(2k), e is the polarization dip angle relative to the horizontal direction; when e = 45° is circular polarization, when e = 0° is horizontal polarization, and when e = 90° is vertical polarization, the specific parameters of horizontal polarization coefficient kH and aH and vertical polarization coefficient kV and aV can be determined according to the table [71], where R0.01 represents 0.01% of the average annual rainfall (mm/h) in that location.
According to the statistical results given in the specific model of rain attenuation used in the prediction method specified in the ITU-R P.838-3 recommendation, for the K/Ka frequency band, the corresponding results of kH, aH, kV, and aV are shown in Figure 3a. In addition, since rainfall usually occurs in the troposphere, that is, the airspace from the Earth’s surface to an altitude of 18 km above the ground, so the signal propagation to the NS must pass through the troposphere. For circular polarization, when e = 45°, k has no relation with the elevation angle θ. Therefore, simulations are carried out here according to the definitions of light drizzle (rainfall < 0.1 mm/24 h = 0.0042 mm/h), light rain (rainfall = 0.1 mm/24 h = 0.0042 mm/h to 9.9 mm/24 h = 0.4125 mm/h), moderate rain (rainfall = 10 mm/24 h = 0.4167 mm/h to 24.9 mm/24 h = 1.0375 mm/h), heavy rain (rainfall = 25 mm/24 h = 1.0417 mm/h to 49.9 mm/24 h = 2.0792 mm/h), rainstorm (rainfall > 50 mm/24 h = 2.0833 mm/h), severe rainstorm (rainfall > 100 mm/24 h = 4.1667 mm/h), and extremely severe rainstorm (rainfall > 250 mm/24 h = 10.4167 mm/h) [72]. The relationship between R0.01 and the K/Ka frequency band under different rainfall levels is shown in Figure 3b. For horizontal polarization and vertical polarization, k has a close relationship with the elevation angle. Therefore, simulations are carried out here under the condition of moderate rain, Figure 3c,d show the simulation results of the relationship between R0.01 and the K/Ka frequency band under the conditions of moderate rain and different elevation angles.
According to Equation (4) and combined with the simulation results in Figure 3, it can be seen that the magnitude of raindrop loss depends on the signal frequency and the elevation angle of the beam, because different values of the antenna elevation angle determine the length of the oblique path when the radio wave passes through the rainy area; the larger the elevation angle is, the shorter the length of the oblique path passing through the rainy area will be, and the smaller the rainfall attenuation will be. Conversely, the smaller the elevation angle is, the greater the rainfall attenuation will be. If the NS vehicle operates at a low elevation angle of 5°, most of the propagation path will be in the rain clouds; for example, under the condition of moderate rain at a frequency of 30 GHz, the losses caused by passing through a 100 km rainy area can reach 225 dB and 185 dB under horizontal and vertical polarization conditions, respectively.

3.3. Atmospheric Loss in NS

The airspace range of the NS includes the troposphere, stratosphere, and part of the ionosphere. When radio waves pass through the troposphere, the signals are most affected. They will be absorbed and scattered by oxygen molecules, water vapor molecules, as well as clouds, fog, rain, and snow in them, thus causing losses to the signals. This kind of loss is closely related to the radio wave frequency, the elevation angle of the beam, the weather conditions, the geographical location, etc. For communication systems with frequencies below 1 GHz, the influence of the troposphere can be almost ignored. However, for the occasions where high-frequency communication is adopted in the NS, it should be given due attention [73]. Specifically, the impacts of tropospheric atmospheric loss on NS vehicles include cloud and fog attenuation, gas absorption, atmospheric scintillation, atmospheric refraction and depolarization, etc. Previous studies have shown that unless there are instantaneous heavy rain and snow conditions, there is no need to consider the impact of depolarization on signal propagation [74].

3.3.1. Gas Absorption in NS

For centimeter waves and millimeter waves, gas absorption generally refers to the absorption of electromagnetic energy by oxygen molecules and water vapor molecules. According to the research results of C. J. Gibbons and the ITU-R P676 report, the absorption oblique path losses generated by oxygen molecules and water vapor molecules can be calculated as the product of their respective ground attenuation rates and the equivalent path length through the troposphere, and the total path loss is the sum of the losses caused by oxygen molecules and water vapor, that is as follows [75,76],
γ = γ o + γ w
For the attenuation rate of oxygen molecules at frequencies below 57 GHz, it can be approximately calculated according to the following equation [75,76],
γ o = 7.19 × 10 3 + 6.09 f 2 + 0.227 + 4.81 ( f 57 ) 2 + 1.50 f 2 × 10 3 ( dB / km )
For water vapor molecules, their attenuation rate is not only related to the frequency but also closely related to the water vapor density ρw. For the frequency bands below 350 GHz, the attenuation rate of water vapor can be determined by the following equation [75,76],
γ w = 0.067 + 3 ( f 22.7 ) 2 + 7.3 + 9 ( f 183.3 ) 2 + 6 + 8.9 ( f 325.4 ) 2 + 10 × f 2 ρ w 10 4         ( ρ w > 12 g / m 3 ) 0.05 + 0.021 ρ w + 3.6 ( f 22.7 ) 2 + 8.5 + 10.6 ( f 183.3 ) 2 + 9 + 8.9 ( f 325.4 ) 2 + 26.3       × f 2 ρ w 10 4 ( ρ w < 12 g / m 3 )
Under the conditions of the conventional water vapor density of 7.5 g/m3, the atmospheric pressure of 1013 hPa, the temperature of 15 °C, and dry air given in the ITU-R P676 recommendation, the curves of the attenuation coefficients of oxygen molecules and water vapor changing with frequency are shown in Figure 4.
According to Figure 4, if an NS vehicle uses the K/Ka band, for the loss caused by oxygen molecules, if typical frequency points of 20 GHz and 30 GHz are selected for business operations, the attenuation coefficient of oxygen molecules at 20 GHz is approximately 0.01 dB/km, the loss for a transmission distance of 100 km is 1 dB. At 30 GHz, the attenuation coefficient is approximately 0.02 dB/km, and the loss for a transmission distance of 100 km is 2 dB, the attenuations are both very small. For the loss caused by water vapor, the attenuation coefficient at 20 GHz is approximately 0.13 dB/km, so the loss for a transmission distance of 100 km is 13 dB, but there is a relatively large absorption at 22.3 GHz, with an attenuation coefficient of approximately 0.25 dB/km, and the loss for a transmission distance of 100 km is 25 dB. At 30 GHz, the attenuation coefficient is approximately 0.17 dB/km, and the loss for a transmission distance of 100 km is 17 dB. Overall, the attenuation increases with the increase in frequency, and the attenuation coefficients of both water vapor and oxygen molecules show a gradually increasing trend.
To evaluate the characteristics of 1 min rain rate and rain attenuation for signals in the K/Ka frequency bands, we assume that the rain rate is a random variable conforming to a normal distribution, with a mean value of 10 mm/h and a standard deviation of 5 mm/h. Figure 5 shows the simulation curves of the 1 min rain rate and rain attenuation calculated with frequency as the independent variable.
As can be seen from Figure 5, for the K/Ka frequency band, rain attenuation is closely related to frequency, and rain attenuation increases as the frequency rises. As shown by the rain attenuation–frequency curve on the right vertical axis of Figure 5, the rain attenuation shows an upward trend. This is because high-frequency signals are more susceptible to the scattering and absorption effects of raindrops, resulting in greater attenuation. In addition, rain attenuation is also related to the rain rate. The higher the rain rate, the greater the number of raindrops, the stronger the scattering and absorption effects on the signal, and the greater the rain attenuation. Therefore, when there are large fluctuations in the rain rate, the rain attenuation curve will correspondingly fluctuate. It can also be seen from Figure 5 that a higher rain rate usually leads to greater rain attenuation. Therefore, when designing high-frequency navigation and telemetry, tracking, and command (TT&C) links, it is necessary to fully consider the impact of rain attenuation and adopt appropriate compensation measures, such as increasing the transmission power, using rain attenuation-resistant coding, etc. In areas with frequent rainfall or high rainfall intensity, the problem of rain attenuation faced by integrated systems is more serious, and more accurate link budget and reliability assessment are required.

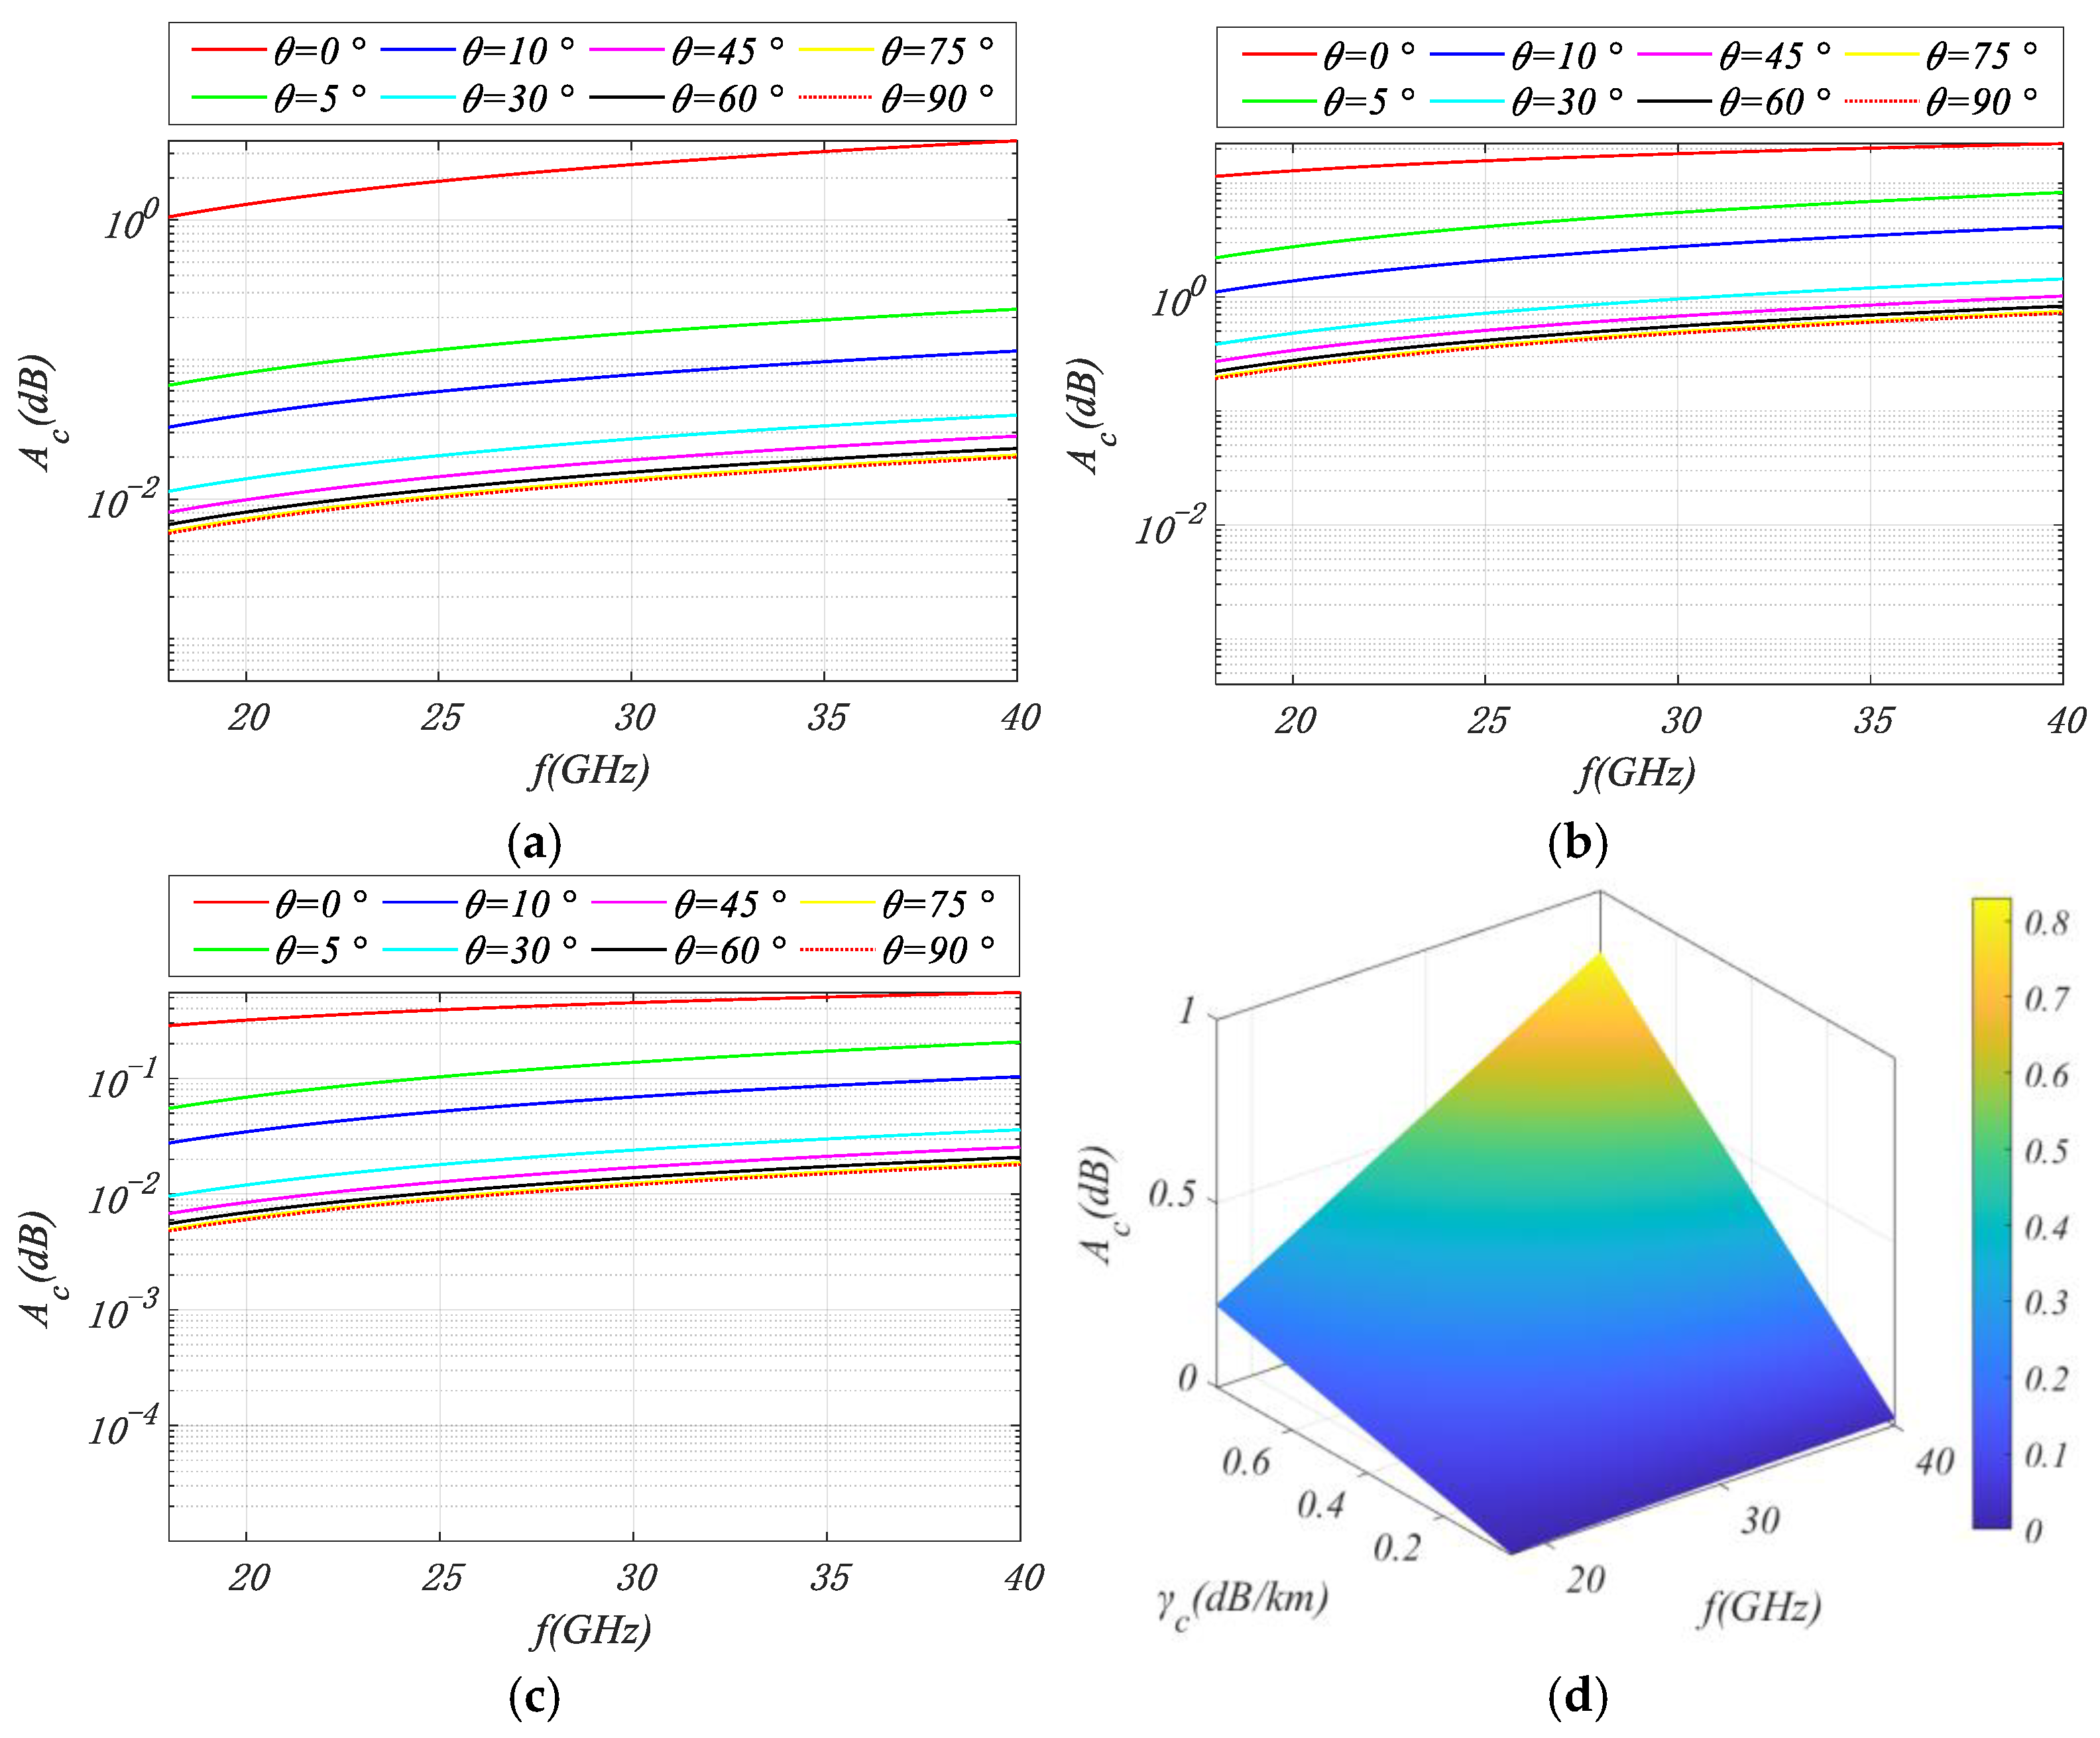
3.3.2. Cloud Attenuation in NS

According to the Rayleigh scattering approximation, the water particles in clouds or fog are very small. Below 200 GHz, the attenuation rates of clouds and fog can be expressed as follows [77],
γ c = k 1 M ( dB / km )
where k1 is the coefficient of loss rate ((dB/km)/(g/m3)), its value is related to temperature and communication frequency, and the value range is between 0.02 and 0.8 when the signal frequency is 10–40 GHz and the temperature is −8° to 20°. M is the liquid water content (g/m3), typical values of M are 0.05 g/m3 and 0.5 g/m3 for medium fog with 300 m visibility and fog with 50 m visibility. Then, the corresponding oblique path loss can be expressed as follows [77],
A C = γ c H f o g H 0 sin θ ( θ 5 ° ) γ c 2 ( H f o g H 0 ) sin 2 θ + 2 ( H f o g H 0 ) Re + sin θ     ( θ < 5 ° ) ( dB )
where Hfog is the height of cloud (km); the meanings of other parameters are the same as in Equation (2). Figure 6 shows the simulation results of cloud attenuation in NS under different conditions.
As can be seen from Figure 6, with the increase in frequency, the loss of clouds and fog gradually increases, but with the decrease in the antenna elevation angle, the loss also gradually increases. In addition, relatively speaking, under the condition of moderate fog, the loss of clouds and fog at a low temperature of −8 °C is significantly greater than that at a normal temperature of 20 °C. Taking the elevation angle of 60° as an example, the loss ranges of clouds and fog in the two situations are 0.00 dB–0.002 dB and 0.222–0.831 dB, respectively.

3.3.3. NS Atmospheric Flicker

The irregular fluctuations of the atmospheric refractive index will cause fluctuations in the amplitude of the received signal; this phenomenon is called atmospheric scintillation. The duration of the fading caused by atmospheric scintillation is about several tens of seconds; from the perspective of communication, the channel corresponding to such a long duration experiences flat fading.
Research shows that the standard deviation caused by the amplitude can be approximately expressed as a function of the antenna elevation angle, frequency, temperature, and water vapor pressure. For the situation where the elevation angle is greater than 4° [78],
A ( p ) = [ 0.061 ( log 10 p ) 3 + 0.072 ( log 10 p ) 2 1.71 10 p + 3.0 ] Γ
where, Γ = Γ r e f f 7 12 g ( X ) sin ( θ ) 1.2 ; Γ r e f = 3.6 × 10 3 + 1.03 × 10 4 N w e t ; N w e t = 3.73 × 10 5 e w ( 273 + t ) 2 , Nwet is related to ambient temperature and humidity, ew is water vapor pressure (mb), t is temperature; g ( X ) = 3.86 ( X 2 + 1 ) 11 12 sin ( 11 6 arctan 1 X ) 7.08 X 5 6 , X = 1.22 η D g f L , η is the antenna efficiency, Dg is the antenna interface diameter, f is the frequency (GHz), L is the effective path length of atmospheric turbulence, L = 2000 sin 2 θ + 2.35 × 10 4 + sin θ , the unit m.
For the case where the elevation angle is less than 4° [78],
A ( p ) = 10 log 10 K w v + 9 log 10 f   59.5 log 10 ( 1 + θ ) 10 log 10 p ( average   year ) 10 log 10 K w + 9 log 10 f 55 log 10 ( 1 + θ )   10 log 10 p ( The   worst   month   in   an   average   year ) ( dB )
where, K w = p L 1.5 × 10 C 0 + C L a t 10 , the variable pL (%) represents the percentage of time in a certain month when the refractive slope at 100 m above the ground is lower than −100 N units/km; C L a t = 0   ( ϕ 53 ° ) 53 + ϕ ( 53 ° < ϕ 60 ° ) 7 ( ϕ > 60 ° ) , ϕ represents the latitude of either the south latitude or the north latitude; C 0 = 76 ( h 0 700 m ) 70 ( h 0 > 700 m ) 76 + 6 r       ( else ) , where h0 is the height of the Earth station antenna relative to the average sea level, and r refers to the part of the path that passes through the water or the adjacent coastal area. v = 1.8 5.6 log 10 ( 1.1 ± cos 2 ϕ 0.7 ) , when |ϕ| ≤ 45°, select the “+” sign, when |ϕ| > 45°, select the “−” sign.
Aiming at the characteristics of the communication, navigation, and TT&C environment requirements of NS vehicles, taking the temperature value of 15 °C, the water vapor pressure of 10 mb, and the antenna aperture of 3 m as examples, when it is operating at 18 GHz and 40 GHz, the simulation results are shown in Figure 7.
As can be seen from Figure 7, with the increase in the communication frequency, when the elevation angle is less than 4°, the attenuation of atmospheric scintillation at different latitudes gradually decreases, approximately from the range of 96.4–99.5 dB to the range of 89.0–92.1 dB, and the average value in the worst month is between 92.8 and 95.9 dB. When the elevation angle is greater than 4°, with the increase in the antenna elevation angle, the atmospheric attenuation gradually decreases, approximately from 6.1 to 11.6 dB when the elevation angle is 5° to 0.3 to 0.6 dB when the elevation angle is 90°. It can be seen that atmospheric scintillation has a relatively large impact on the signal, and the lower the elevation angle, the stronger the atmospheric scintillation. In addition, according to Equation (10), the standard deviation of atmospheric scintillation is directly proportional to the water vapor pressure, the antenna aperture, and the antenna efficiency, and inversely proportional to the temperature, but its value is generally not very large and can be ignored.

3.3.4. Influence of NS Plasma Sheath on Electromagnetic Wave

The channel environment of NS vehicles is complex and changeable; to determine the type of the channel and design the communication, navigation, and TT&C system, it is necessary to have a qualitative understanding of the basic characteristics of the plasma sheath. When electromagnetic waves penetrate the plasma sheath, they will cause the attenuation and phase shift of the electromagnetic waves. If the plasma sheath (electron density, collision frequency, sheath thickness, etc.) is changing, the effects of attenuation and phase shift will change with time. From the perspective of signal processing, the plasma modulates the amplitude and angle of the electromagnetic signal. Therefore, the impact of the plasma sheath on the electromagnetic waves passing through it is mainly manifested in two main aspects: attenuation and phase shift.
The forms of attenuation mainly include the reflection loss of electromagnetic waves passing through the plasma sheath, absorption loss, and distortion in refraction. Moreover, the plasma sheath will also increase the antenna noise temperature. When electromagnetic waves propagate in a stable plasma sheath, the sheath will cause a fixed phase shift of the electromagnetic waves. The attenuation coefficient k and the phase shift coefficient μ are shown as follows [79],
κ = ω 2 c ω p 2 ω 2 + v 2 1 + ( 1 ω p 2 ω 2 + v 2 ) 2 + ( v ω ω p 2 ω 2 + v 2 ) 2
μ = ω 2 c 1 ω p 2 ω 2 + v 2 + ( 1 ω p 2 ω 2 + v 2 ) 2 + ( v ω ω p 2 ω 2 + v 2 ) 2
where c is the speed of light; v is the flight speed of the aircraft; ω = 2p f is the carrier angular frequency; ωp = 2p fp is the angular frequency of the plasma, which depends only on the electron density and is calculated as follows [79],
ω p = 2 π f p n e e 2 ε 0 m e 9000 n e
where e = 1.60 × 10⁻¹⁹ C is the electron charge; me = 1.67 × 10⁻²⁷ is the electronic mass; ε0 = 8.85 × 10⁻¹² F/m is the dielectric constant in the vacuum; ne is the electron density, the plasma can be divided into multiple thin layers along the direction of electric field propagation (z direction) according to the stratified method, the density of ne in the space non-uniform plasma can be obtained by Gaussian distribution or Epstein distribution, as follows [79,80,81]:
(1)
Gaussian distribution
n e = N max e [ σ 01 ( z z 0 ) 2 ] ( z 1 z z 0 ) N max e [ σ 02 ( z z 0 ) 2 ] ( z 0 z z 2 )
(2)
Epstein distribution
n e = N max 1 + e [ λ 01 ( z z 0 ) ] 1 ( z 1 z z 0 ) N max 1 + e [ λ 02 ( z z 0 ) ] 1 ( z 0 z z 2 )
In Equations (15) and (16), Nmax is the maximum electron density of the plasma; σ01 and σ02 are Gaussian distribution constants; λ01 and λ02 are Epstein distribution constants. z is the vertical distance from the measuring position to the surface of the aircraft; z0 is the piecewise point of Gaussian function and Epstein function. z2z1 is the thickness of the plasma. Figure 8 shows the simulation results of the attenuation coefficient, phase shift coefficient of the plasma sheath, and the electron density distribution model of the spatially inhomogeneous plasma, where the flight speed of the aircraft is 3 Mach.
From the simulation results in Figure 8a, it can be seen that as the signal frequency increases, the attenuation coefficient k and the phase shift coefficient m also gradually increase, and the influence of the attenuation coefficient of the plasma sheath is greater than that of the phase shift coefficient, playing a dominant role. From the electron density distribution of the spatially inhomogeneous plasma in Figure 8b, as the vertical distance from the measurement position to the surface of the vehicle increases, both the Gaussian distribution and the Epstein distribution, the electron density gradually increases to a maximum value and then gradually decreases. For the NS, under the surfaces of vehicles in the lower and middle altitudes of 20–48 km, using the Epstein distribution for the electron density of the plasma sheath is closer to the real situation, while for the surfaces of vehicles at altitudes above 48–100 km, using the Gaussian distribution is more appropriate [82].

3.3.5. NS Multipath and Doppler

In the NS, the presence of multiple scatterers such as hills, buildings, and the ionosphere will cause the transmitted radio waves to propagate along multiple different paths. Therefore, the signal received at the receiving end is the superposition of multiple attenuated signals of the transmitted signal. The NS multipath channel model usually includes the direct component, the ground reflection component, and the remaining multipath components. Considering that in the actual channel, the reflection paths formed by the atmospheric ionosphere and those formed by mountains, hills, and building share different time delays, they are distinguishable. Therefore, we improve the model proposed in Reference [83] and propose a four-path channel model suitable for the NS,
r ( t ) = A 0 [ 1 + A 1 δ ( t τ 1 ) + A 2 lim N n = 1 N a n δ ( t τ 2 ) + A 3 lim N n = 1 N a n δ ( t τ 3 )
where A0 is the fading coefficient of the direct path, A1 is the normalization coefficient of the ground reflection path relative to the direct path, and A2 is the normalization coefficient of the reflection path of mountains, hills, and building. A3 is the normalization coefficient after removing A0, A1, and A2. an is the fading coefficient of different scatters. The typical value of A1 ranges from 0.25 to 0.75, A2 ranges from 0.084 to 0.01, A3 range from 0.084 to 0.01. Since the third and fourth components of Equation (17) are relatively small in energy, they can be equivalent to a random noise in analysis and are statistically independent from the first two components.
In addition, since the Doppler shift determines important characteristics of the fading channel such as the average fading rate, the average level crossing rate, and the average fading duration, this characteristic must be reflected in the communication, navigation, and TT&C channel of high-speed NS vehicles, especially when the vehicle is operating at a high speed, the frequency shift is relatively large. The Doppler shift is mainly caused by the high-speed flight of the vehicle, so the impact caused by the Doppler shift cannot be ignored. At this time, the frequency of the signal received by the mobile terminal is fc + fd, where the calculation equation for the Doppler shift fd is as follows [84],
f d ( t ) = v f c c cos β ( t )
where fc is the signal transmission frequency; β is the angle between the reference station and the aircraft; fd(t) is the Doppler shift.
Since the speed of the spacecraft is near 5–25 Mach, and the K/Ka to be evaluated is between 18 GHz and 40 GHz, so the Doppler variation range is about 102–1133.33 KHz. Assuming the speed of the hypervelocity aircraft reaches 25 Mach and the carrier frequency is 30 GHz, then the maximum Doppler shift is fc_max ± 850 KHz. In combination with Equations (16) and (17), Figure 9 simulates the bit error rate (BER) of four multipath channels with different delay and multipath number under the conditions of Doppler shift of 100 Hz, carrier frequency of 25 GHz, symbol number of 1 × 10⁵, and sampling rate of 0.1 MHz, using BPSK modulation, BER with different delay, and relative power is set for the four-path model; among them, we also provide the BER of the direct signal path, aiming to provide a basis for comparative evaluation of signal propagation in two or more paths. The relevant simulation parameters are shown in Table 3 and Table 4.
From the simulation results in Figure 9, it can be seen that for Figure 9a, as the number of multipaths increases, the channel deteriorates, and the frequency selectivity of the channel increases, which in turn leads to a significant increase in the BER of the communication, navigation, and TT&C system. That is, under the same signal-to-noise ratio (SNR) condition, the BER caused by the signal path with a larger number of multipaths will increase. In other words, under the same BER condition, if we need to demodulate the original signal, the signal path with a larger number of multipaths requires a higher SNR. For Figure 9b, under the same number of multipaths, the longer the time delay of the signal and the lower the relative power, the worse the quality of the signal path.

3.3.6. NS Noise

For very high-frequency signals such as those in the K/Ka bands, the influence of galactic noise can be neglected. We assumed that the main sources of propagation noise in space include the interference from other space radio systems and the equipment itself. This noise is assumed to be additive white Gaussian noise (AWGN), and its power spectral density (PSD) and autocorrelation function (ACF) are as follows [85],
G ω ( ω ) = N 0 2
R ω ( τ ) = 1 2 π + G ω ( ω ) e i ω τ d ω = N 0 2 δ ( τ )
where N0 is a constant and δ (t) is the Dirac shock function.
Strictly speaking, the white noise defined by Equation (19) is an idealized model, and there is no white noise in practice. However, the noise spectrum is much larger than the bandwidth of the system studied, and its power spectrum is close to a constant in the bandwidth of the system, so it can be regarded as white noise. Now assume that the mean value of noise caused by interference of other radio systems and equipment in space is μx1 and μx2, respectively, and the variance is σx1 and σx2, obey the normal distribution of x1~N1 (μx1, σ 2 x 1 ) and x1~N2 (μx2, σ 2 x 2 ), respectively. Then, according to the regeneration of the normal distribution, the sum of two independent normally distributed random variables still obey the normal distribution, that is, the final probability distribution function is as follows,
p ( x ) = 1 2 π ( σ x 1 2 + σ x 2 2 ) e [ x ( μ x 1 + μ x 2 ) ] 2 2 ( σ 1 2 + σ 2 2 ) ( < x < )
where x = x1 + x2.
It can be seen that x = x1 + x2~ (μx1 + μx2, σ 2 x 1 + σ 2 x 2 ). Figure 10 presents the ACF, PSD, and corresponding noise sequence distribution and fitting curve of x1, x2, and x NS noise sequences generated randomly and all with lengths of 10,000.
From the simulation results in Figure 10a, it can be seen that when the chip offset is 0, the ACF of the AWGN is the power of the noise, and the correlation is the highest at this time. However, the correlation at other chip offset positions is very small and tends to 0 as the offset increases. In addition, by combining the PSD, data set distribution, and fitting results in Figure 10a,b, it is not difficult to observe that the PSD of the AWGN obeys a uniform distribution, while its amplitude distribution follows a Gaussian distribution, which is in line with the definition of AWGN. Moreover, for the noise random variables of a single Gaussian distribution, their linear combination still follows a Gaussian distribution.

4. Integrated Signal Design of Communication, Navigation, and TT&C for the Requirements of the NS

(1)
Requirements for Modulation Technology Put Forward by the Integrated Channel of NS Communication, Navigation, and TT&C
Modulation is carried out to match the characteristics of the transmitted signal with those of the channel. Therefore, the selection of the modulation method is determined by the channel characteristics of the system. In the ICNT system of the NS, to effectively utilize the power of the space vehicle, the power amplifier of the transmitted signal usually adopts a high-power nonlinear amplifier (HPA). In this way, due to the nonlinearity of the integrated channel of ICNT in the NS and the amplitude modulation/phase modulation (AM/PM) effect, it is required that the instantaneous amplitude fluctuation of the modulated signal waveform should be as small as possible; therefore, a modulation method with a constant envelope or quasi-constant envelope structure should be adopted. Relevant research results show that the performance gain obtained by using an HPA and (quasi-) constant envelope modulation is higher than that obtained by using a linear power amplifier and a non-constant envelope modulated signal [86]. Therefore, combined with the actual requirements of communication, navigation, and TT&C services, it is necessary to design an integrated constant envelope signal modulation technology.
On the other hand, the communication and TT&C tasks in the NS require the real-time transmission of a large amount of data and image information to the ground. This requires the communication system on the vehicle to have an increasingly higher transmission rate, which in turn leads to an increasingly crowded radio frequency spectrum. Information theory research shows [87] that when using a constant envelope signal and there are constraints on its PSD, the capacity of the system will decrease. Therefore, it is difficult for traditional modulation systems such as amplitude shift keying (ASK) and frequency shift keying (FSK) to meet the business requirements. It is necessary to adopt a constant envelope signal to meet the growing demand for high data rates, such as binary phase shift keying (BPSK), continuous phase frequency shift keying (CPFSK), continuous phase modulation (CPM), and other signals. Figure 11 presents the comparison results of the PSDs of ASK, FSK, BPSK, and CPM modulated signals, and based on this, the spectrum utilization efficiency (SUE) of the four signals is statistically compared. Where the symbol rate Rs is 1000 Hz, the number of symbols N is 1000, the number of samples per symbol is 20, and the modulation index h of CPM is 0.5 (the main lobe bandwidth is 1.5 Rs), and the pulse length L is 1; FSK is binary with two different frequencies, and the frequency interval Δf = Rs. For the convenience of comparison, we only display the PSD of a single frequency. In addition, we assume that all are binary modulations, and 1 bit is transmitted per symbol, so the data rate is equal to the symbol rate, that is, Rb = Rs.
From the simulation results in Figure 11, it can be seen that under the same conditions, the bandwidth of the BPSK is B = 2Rs, so the spectrum utilization efficiency (SUE) is SUE = Rb/B = 0.5. Its side-lobe attenuation is slow, and it is suitable for scenarios with low bandwidth requirements. Similarly, for ASK, its spectral characteristics are similar to those of BPSK because both are linear modulations, with the same bandwidth B = 2Rs, and SUE = Rb/B = 0.5. Its side-lobes also decay slowly, and it is also suitable for scenarios with low bandwidth requirements. For binary FSK, the frequency interval between the two frequencies of binary FSK affects the bandwidth. When the frequency interval Δf = Rs, the bandwidth B = 2Δf + 2Rs, and SUE = Rb/B = 0.25. It can be seen that it occupies a relatively large amount of spectrum resources. In contrast, the bandwidth of CPM is more compact than that of BPSK, with a bandwidth of B = 1.5Rs and SUE = Rb/B = 0.6667. Its phase continuity makes the side-lobe attenuation faster, and it is suitable for applications with limited bandwidth and high power–efficiency requirements.
(2)
General Considerations of the Modulation Technology for the Integration of NS Communication, Navigation, and TT&C
In the ICNT system of the NS, when selecting a modulation method, in addition to adapting to the ICNT channel of NS, various factors need to be comprehensively considered, for example, good anti-interference performance, high spectral efficiency, low inter-spectrum interference, etc. At the same time, the difficulty of implementing the modulation and demodulation equipment should also be taken into account. Therefore, for the ICNT system, it is of great importance to select an appropriate modulation method that can be applied to both the communication and navigation systems as well as the TT&C system, so as to give due consideration to the utilization rate of the NS signal bandwidth. Integrating navigation signals such as BPSK, binary offset carrier (BOC), multiplexed binary offset carrier (MBOC), binary coded symbols (BCS), multiplexed binary coded symbols (MBCS), and communication signals such as CPFSK, CPM, orthogonal frequency division multiplexing (OFDM) to obtain a hybrid modulated signal is indeed a reference solution. Where the navigation signals serve both navigation and TT&C tasks, the communication signals are responsible for communication and high-speed data transmission. This solution has also been preliminarily verified in references [88,89,90,91,92]. Figure 12 shows the simulation results of the PSD and ACF curves for a typical single signal and an integrated signal.
From the simulation results in Figure 12, it can be seen that for the PSD curves, the integrated signal combines the functions of single signals. For example, if the CPM signal is used for communication and TT&C, and the BOC (1,1) signal is used for navigation, then the CMP-BOC (1,1) signal can simultaneously carry out communication, TT&C, and navigation services. The same is true for other signals such as CMP-OFDM, OFDM-BOC (1,1), and BPSK-BOC (1,1). From the perspective of the ACF curves, the integrated signal can also improve the autocorrelation characteristics of the signal to a certain extent. For instance, it can reduce the number of side-lobes, which is beneficial for improving the ranging accuracy and tracking accuracy of the signal.
According to the research conclusions of (1) and (2), it can be seen that the design method of using integrated signals is indeed a solution for the integrated signal design of NS communication, navigation, and TT&C. It is expected to enhance the spectral utilization rate of the signal, reduce the power consumption, volume, and cost of the system, and meet the current requirements of communication, navigation, and TT&C tasks for hypersonic aircraft entering the atmosphere.

5. Conclusions and Future Works

5.1. Conclusions

This paper analyzes the communication, navigation, and TT&C service challenges faced by NS vehicles when entering the atmosphere. Based on the analysis of the current ICNT service requirements of NS, through the analysis of the frequency spectrum division by the ITU, high-speed communication in the NS, over-the-horizon relay in the NS, plasma and black barrier problems, as well as the maturity of the development of existing equipment, it is concluded that the K/Ka frequency band is currently a more suitable frequency band for the ICNT service requirements of NS. Based on the K/Ka frequency band, we have analyzed the impacts of key physical characteristics such as transmission loss, rain attenuation, and atmospheric loss in the NS on the signal transmission in the K/Ka frequency band. We explored the advantages of constant envelope signals in terms of spectral utilization rate, and proposed an overall design scheme for the ICNT based on the K/Ka frequency bands. The potential value of the scheme was verified through typical basic integrated signals. Finally, we drew the following research conclusions:
(1)
The K/Ka frequency bands have huge potential advantages compared with the traditional L/S/C frequency bands. The K/Ka frequency bands are suitable for the ICNT in the NS.
(2)
The loss of K/Ka frequency band signals increases with the increase in frequency, and the path loss becomes greater as the elevation angle decreases.
(3)
The magnitude of rainfall loss depends on the signal frequency and the elevation angle of the beam. The larger the elevation angle, the smaller the rainfall attenuation. Conversely, the smaller the elevation angle, the greater the rainfall attenuation.
(4)
For K/Ka frequency band signals, the 1 min rainfall rate and rainfall attenuation are closely related to the frequency. The rainfall attenuation increases with the increase in frequency, and a higher rainfall rate usually leads to greater rainfall attenuation.
(5)
In the atmospheric loss of the near space,
  • For the K/Ka band signals, except for a relatively large absorption at 22.3 GHz due to the loss of oxygen molecules, the attenuation coefficients of both water vapor and oxygen molecules show a gradually increasing trend.
  • With the increase in frequency, the cloud and fog loss of K/Ka band signals is gradually increasing, and with the decrease in the antenna elevation angle, the loss is also gradually increasing.
  • The atmospheric attenuation of the K/Ka band gradually decreases with the increase in the antenna elevation angle. The lower the elevation angle, the stronger the atmospheric scintillation.
  • Factors such as the plasma sheath, multipath, Doppler effect, and noise will also have a certain degree of impact on the propagation of the signal.
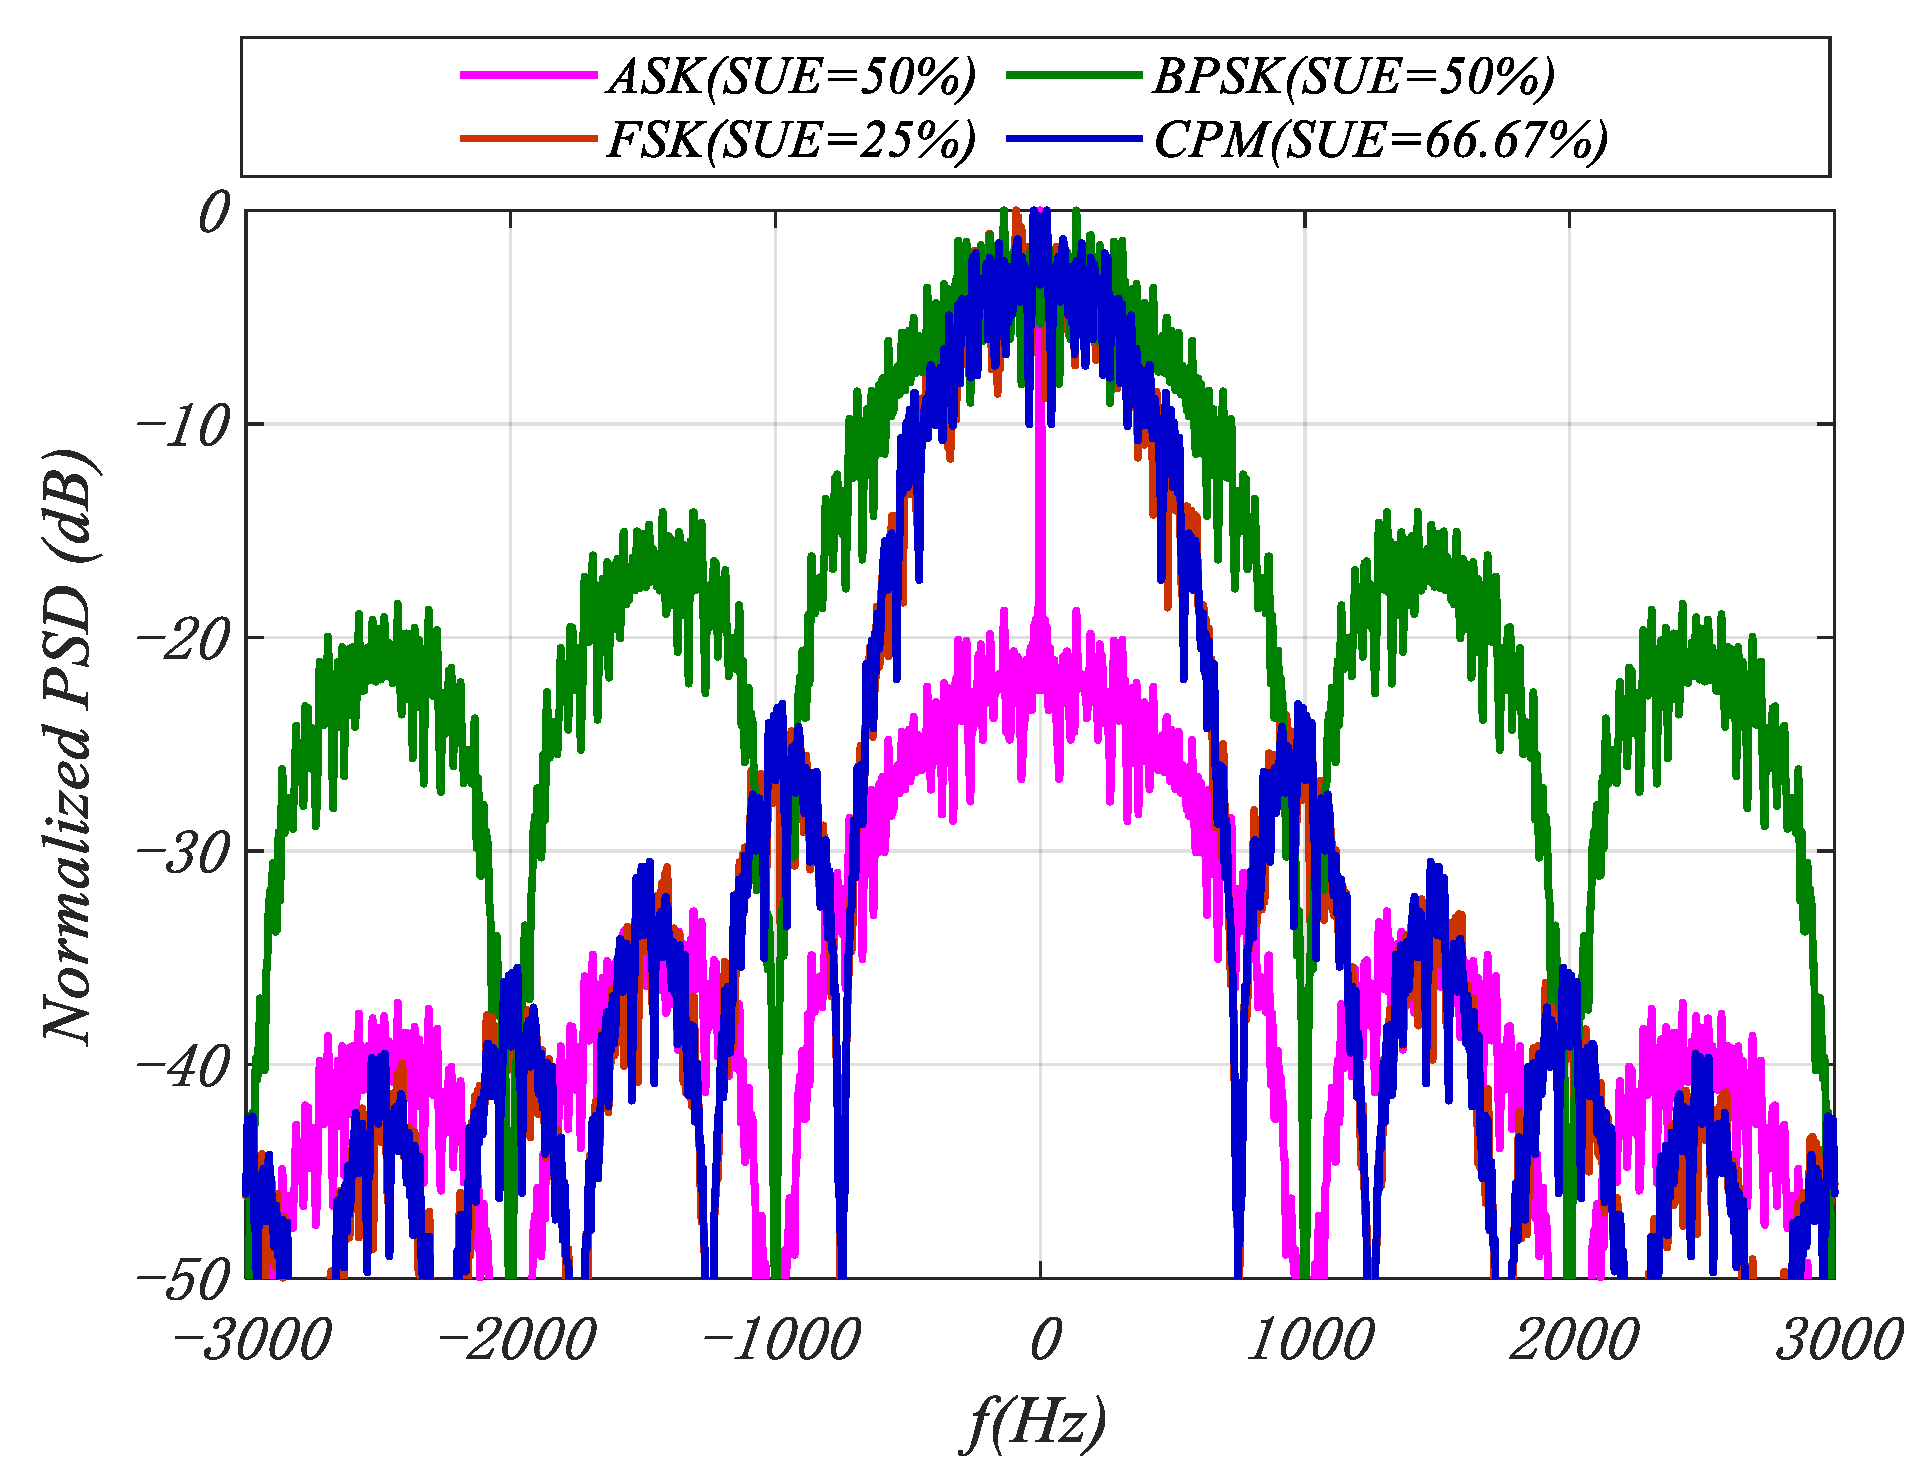
  • Adopting constant envelope modulation can improve the frequency band utilization rate of the system to a certain extent. And the design scheme of integrating communication signals, navigation signals, and TT&C signals into the frequency points of a single K/Ka signal can enhance the overall performance of the system.

5.2. Future Work

Based on the conclusions of this study, the field of NS ICNT in the future is expected to achieve breakthroughs and development in the following key directions:
(1)
In-depth research and extended application of frequency bands. Although the advantages of the K/Ka frequency bands in the current ICNT in the NS have been clarified, in the future, it is still necessary to conduct in-depth research on their long-term stability and reliability in complex environments. For example, during the peak period of solar activity, the impact mechanism of ionospheric disturbances on K/Ka frequency band signals is not yet fully clear, and further exploration and the formulation of countermeasures are required. In addition, with the progress of technology, the possibility of using the K/Ka frequency bands in coordination with other emerging frequency bands such as the terahertz frequency band can be explored to expand the communication bandwidth and application scenarios in NS and meet the growing demand for high-speed and large-capacity data transmission.
(2)
Innovation in signal loss mitigation technologies. Given the characteristics of the signal loss of the K/Ka frequency bands that change with factors such as frequency and elevation angle, efforts should be made in the follow-up to develop targeted anti-loss technologies. On the one hand, at the hardware level, by optimizing the antenna design, improving the antenna gain and pointing accuracy, the path loss and the influence of atmospheric scintillation can be reduced. On the other hand, in terms of signal processing algorithms, develop adaptive coding and modulation technologies, and dynamically adjust the coding and modulation methods according to the real-time signal loss situation to ensure the reliable transmission of signals.
(3)
Enhancement of adaptability to extreme environments. Rainfall attenuation has a significant impact on K/Ka frequency band signals. In the future, it is necessary to strengthen the research on signal transmission in extreme rainfall environments. By establishing a more accurate rainfall attenuation model and combining meteorological forecast data, early warning and compensation for rainfall attenuation can be achieved. At the same time, study comprehensive technical solutions to ensure stable signal transmission in extreme environments where complex interference factors such as the plasma sheath, multipath, Doppler effect, and noise coexist. For example, develop new signal processing algorithms to resist multipath interference and synchronization technologies that can effectively suppress the influence of Doppler frequency shift.
In addition, the solution of the NS modulation signal based on hybrid modulation is a viable design solution for near-space ICNT, which is expected to meet the existing communication, navigation, and telemetry mission requirements for hypersonic vehicles entering the atmosphere. However, carrying out specific integrated signal design based on the K/Ka frequency band and the integrated signal design around higher frequency band signals such as the Q/V frequency band will also be key research directions in the future.

Author Contributions

Conceptualization, L.Y.; methodology, L.Y.; software, S.C.; validation, S.C. and L.Y.; formal analysis, L.Y., S.C. and Z.G.; investigation, Z.G., D.P., B.C., X.W., K.S. and Y.Y.; resources, S.C.; data curation, L.Y.; writing—original draft preparation, L.Y.; writing—review and editing, L.Y.; visualization, L.Y.; project administration, S.C.; funding acquisition, L.Y. All authors have read and agreed to the published version of the manuscript.

Funding

This research was funded by the China Project Management Center (Grant Nos. 80903010202, Funder. S.C.), Science and Technology on Electromechanical Dynamic Control Laboratory fund (Grant Nos. 9140A17060115BQ42242, 6142601190210, Funder. S.C.).

Institutional Review Board Statement

Not applicable.

Informed Consent Statement

Not applicable.

Data Availability Statement

Data is contained within the article.

Conflicts of Interest

The authors declare no conflicts of interest.

References

  1. Pielke, R.A. Atmosphere; Encyclopedia Britannica: Chicago, IL, USA, 2025; Available online: https://www.britannica.com/science/atmosphere (accessed on 27 February 2025).
  2. Hu, Y.; Guo, J.; Meng, W.; Liu, G.; Xue, W. Longitudinal Control for Balloon-Borne Launched Solar Powered UAVs in Near-Space. J. Syst. Sci. Complex. 2022, 35, 802–819. [Google Scholar] [CrossRef]
  3. Du, S. Key Basic Scientific Problems on Near-Space Vehicles; Springer: Singapore, 2023; ISBN 978-981-19-8907-0. [Google Scholar]
  4. Wang, W.Q.; Jiang, D. Navigation and Remote Sensing Using Near-Space Satellite Platforms; Wiley: Hoboken, NJ, USA, 2017; ISBN 9781119126485. [Google Scholar]
  5. James, N. Space Communications and Navigation: Planning Activities for NASAs Future SATCOM Direction; NASA Technical Reports Server: Hampton, VA, USA, 2020. Available online: https://ntrs.nasa.gov/api/citations/20200001533/downloads/20200001533.pdf (accessed on 24 April 2025).
  6. Elizabeth Hook-Rogers. SCAN Space Communications and Navigation: Science & Exploration, Enabled. Together; National Aeronautics and Space Administration: Washington, DC, USA, 2024. Available online: https://explorers.larc.nasa.gov/2023ESE/pdf_files/5_SCaN%20Overview_Hook-Rogers.pdf (accessed on 24 April 2025).
  7. Liebrecht, P.; Cornwell, D.; Israel, D.; Heckler, G. The Decade of Light: Innovations in Space Communications and Navigation Technologies. J. Space Oper. Commun. 2019, 16. Available online: https://docslib.org/doc/1189132/the-decade-of-light-innovations-in-space-communications-and-navigation-technologies (accessed on 11 May 2025).
  8. The State Council Information Office of the People’s Republic of China. Full Text: China’s Space Program: A 2021 Perspective. Available online: http://english.scio.gov.cn/whitepapers/2022-01/28/content_78016877.htm (accessed on 24 April 2025).
  9. ESA. About Horizon 2020 Satellite Navigation Programme (HSNAV). 2020. Available online: https://h2020nav.esa.int/page/about-h2020 (accessed on 24 April 2025).
  10. EU. EU Space Programme (2021–2027)—European Union Agency for the Space Programme. 2023. Available online: https://eur-lex.europa.eu/legal-content/EN/TXT/?uri=LEGISSUM:4526706 (accessed on 24 April 2025).
  11. Alyssa, L. Challenges and Priorities: Russia’s Space Program After 2024 Report. 22 July 2024. Available online: https://spaceinsider.tech/2024/07/22/challenges-and-priorities-russias-space-program-after-2024-report/ (accessed on 24 April 2025).
  12. Remya, P.R. Indian Space Program: Phases and Achievements. 17 January 2025. Available online: https://www.clearias.com/indian-space-program/ (accessed on 24 April 2025).
  13. Japan Aerospace Exploration Agency. Japan’s Space Program. 26 July 2019. Available online: https://www.nippon.com/en/japan-data/h00501/japan%E2%80%99s-space-program.html (accessed on 24 April 2025).
  14. Baghdady, E.; Kruse, K. Signal Design for Space Communication and Tracking Systems. IEEE Trans. Commun. Technol. 1965, 13, 484–498. [Google Scholar] [CrossRef]
  15. Yang, L.; Dong, X.; Xu, D. Precise navigation for GRACE formation flying. In Proceedings of the 2006 1st International Symposium on Systems and Control in Aerospace and Astronautics, Harbin, China, 19–21 January 2006; pp. 6–797. [Google Scholar]
  16. Dou, C.; Zhang, J. The Assumption of Regional Satellite Navigation System Near Space Applications. Radio Eng. 2007, 37, 31–32+36. [Google Scholar]
  17. Yang, L.; Zhou, J.; Hu, Y. Signal Design and Verification of the Near Space Regional Navigation Augmentation System. Telem. Track. Command. 2009, 30, 32–39. [Google Scholar]
  18. McCarthy, K.; Stocklin, F.; Geldzahler, B.; Friedman, D.E.; Celeste, P.B. NASA’s Evolution to Ka-Band Space Communications for Near-Earth Spacecraft. In Proceedings of the SpaceOps 2010 Conference, Huntsville, AL, USA, 25–30 April 2010; pp. 1–13. [Google Scholar]
  19. Li, P.; Chen, Z.; Gu, Y.; Si, Y. Spacecrafts Navigation Signal Research Based on GNSS Constellation. In Proceedings of the China Satellite Navigation Conference (CSNC) 2013 Proceedings. Lecture Notes in Electrical Engineering, Wuhan, China, 15–17 May 2013; pp. 35–48. [Google Scholar]
  20. Yang, J. Analysis of Key Technologies of the Regional Navigation System Based on Near Space Vehicles. Telecommun. Eng. 2014, 54, 385–391. [Google Scholar]
  21. Tzelepis, C.; Carreno, A. Concepts for NASA’s Communication and Navigation Architecture in Near Earth and Deep Space Domains; Strategies for Affordable and Scalable implementation of Next Generation Relay Systems with Improved Mission Experience and Reduced Burden. In Proceedings of the International Communications Satellite Systems Conferences (ICSSC), American Institute of Aeronautics and Astronautics (AIAA), ICSSE 22nd Ka and Broadband Communications Conference, AIAA 34th International Communications Satellite Systems Conference, Cleveland, OH, USA, 18–20 October 2016. [Google Scholar]
  22. Ling, Y.; Chen, C.; Jiang, J. Research on Propagation Properties of Near Space Vehicle Communication Signals. Comput. Simul. 2016, 33, 127–131+137. [Google Scholar]
  23. Martin-Mur, T.J.; Zhai, C.; Jacobs, C.; Turyshev, S.G.; Shao, M.; Peng, M. Using optical communications links for deep-space navigation. In Proceedings of the 2017 IEEE International Conference on Space Optical Systems and Applications (ICSOS), Naha, Japan, 14–16 November 2017; pp. 176–182. [Google Scholar] [CrossRef]
  24. Wu, B.; Xu, Z. Research on integrated space-air-ground TT&C and communication network based on space tracking ship. In Proceedings of the 2017 16th International Conference on Optical Communications and Networks (ICOCN), Wuzhen, China, 7–10 August 2017; pp. 1–3. [Google Scholar] [CrossRef]
  25. Wang, Y.; Yan, T.; Wang, G.; Bian, L.; Meng, Y. Analysis of Interaction Between Navigation Payload and Constant Envelope Design of Navigation Signal. In Proceedings of the China Satellite Navigation Conference (CSNC) 2019 Proceedings, Beijing, China, 22–25 May 2019; pp. 421–431. [Google Scholar]
  26. Hamkins, J.; Antsos, D.; Border, J.; Davis, G.; Deutsch, L.; Lazio, J.; Velazco, J. Communications and Navigation Technologies. In A White Paper in Response to the Planetary Science and Astrobiology Decadal Survey 2023–2032; The American Astronomical Society: Washington, DC, USA, 2020. [Google Scholar]
  27. Modenini, A.; Ripani, B. A Tutorial on the Tracking, Telemetry, and Command (TT&C) for Space Missions. IEEE Commun. Surv. Tutor. 2023, 25, 1510–1542. [Google Scholar]
  28. Liu, H.; Qin, T.; Gao, Z.; Mao, T.; Ying, K.; Wan, Z.; Qiao, L.; Na, R.; Li, Z.; Hu, Y. Near-Space Communications: The Last Piece of 6G Space-Air-Ground-Sea Integrated Network Puzzle. Space Sci. Technol. 2024, 4, 283. [Google Scholar] [CrossRef]
  29. Xu, C.; Xiang, L.; An, J.; Dong, C.; Sugiura, S.; Maunder, R.G.; Yang, L.L.; Haozo, L. OTFS-Aided RIS-Assisted SAGIN Systems Outperform Their OFDM Counterparts in Doubly Selective High-Doppler Scenarios. IEEE Internet Things J. 2023, 10, 682–703. [Google Scholar] [CrossRef]
  30. Xu, C.; Xiang, L.; Sugiura, S.; Maunder, R.G.; Yang, L.L.; Niyato, D.; Li, G.Y.; Schober, R.; Hanzo, L. Noncoherent Orthogonal Time Frequency Space Modulation. IEEE Trans. Wirel. Commun. 2024, 23, 10072–10090. [Google Scholar] [CrossRef]
  31. Schmitz-Peiffer, A.; Stopfkuchen, L.; Floch, J.; Felnach, D. Architecture for a Future C-band/L-band GnSS mission Part 1: C-band Services, Space-and Ground Segment, Overall Performance. Inside GNSS 2009, 47–56. Available online: https://docslib.org/doc/7004963/architecture-for-a-future-c-band-l-band-gnss-mission-part-2-signal-considerations-and-related-user-terminal-aspects (accessed on 11 May 2025).
  32. Schmitz-Peiffer, A.; Stopfkuchen, L.; Floch, J.; Felnach, D. Architecture for a Future C-Band/L-band GNSS Mission Part 2: Signal Considerations and Related User Terminal Aspects. Inside GNSS 2009, 52–63. Available online: https://insidegnss.com/architecture-for-a-future-c-band-l-band-gnss-mission-part-2/ (accessed on 11 May 2025).
  33. Pech, P.; Huang, P.; Bousquet, M.; Robert, M.; Duverdier, A. Simulation of an adaptive strategy designed for low bit rate emergency satellite communications links in Ku/Ka/Q/V bands. In Proceedings of the 2009 International Workshop on Satellite and Space Communications, Siena, Italy, 9–11 September 2009; pp. 337–340. [Google Scholar]
  34. Biscarini, M.; Montopoli, M.; Marzano, F.S. Evaluation of High-Frequency Channels for Deep-Space Data Transmission Using Radiometeorological Model Forecast. IEEE Trans. Antennas Propag. 2017, 65, 1311–1320. [Google Scholar] [CrossRef]
  35. Arslan, C.H. Detection and Estimation of Rainfall Through Data Analysis of Geostationary Ku-Band Satellite Signals. Ph.D. Thesis, The Pennsylvania State University, University Park, PA, USA, 2017. [Google Scholar]
  36. Lawal, Y.B.; Owolawi, P.A.; Tu, C.; Van Wyk, E.; Ojo, J.S. Analysis of Cross-Polarization Discrimination Due to Rain for Earth–Space Satellite Links Operating at Millimetre-Wave Frequencies in Pretoria, South Africa. Atmosphere 2025, 16, 256. [Google Scholar] [CrossRef]
  37. ITU. ITU-R S.1001-2: Use of Systems in the Fixed-Satellite Service in the Event of Natural Disasters and Similar Emergencies for Warning and Relief Operations. 2010. Available online: https://www.itu.int/rec/R-REC-S.1001-2-201001-I/en (accessed on 24 April 2025).
  38. ITU. ITU-R M.IMT-2020: M.2150: Detailed Specifications of the Terrestrial Radio Interfaces of International Mobile Telecommunications-2020 (Imt-2020). 2023. Available online: https://www.itu.int/rec/R-REC-M.2150/en (accessed on 24 April 2025).
  39. ITU. ITU-R P.619: Propagation Data Required for the Evaluation of Interference Between Stations in Space and Those on the Surface of the Earth. 2021. Available online: https://www.itu.int/rec/R-REC-P.619/en (accessed on 24 April 2025).
  40. ITU. ITU-R P.452: Prediction Procedure for the Evaluation of Interference Between Stations on the Surface of the Earth At Frequencies Above About 100 Mhz. 2023. Available online: https://www.itu.int/rec/R-REC-P.452/en (accessed on 24 April 2025).
  41. ITU. ITU-R P.531: Ionospheric Propagation Data and Prediction Methods Required for the Design of Satellite Networks and Systems. 2023. Available online: https://www.itu.int/rec/R-REC-P.531/en (accessed on 24 April 2025).
  42. ITU. Radio Regulations, 2020th ed.; The International Telecommunication Union: Geneva, Switzerland, 2020; Available online: https://www.itu.int/en/publications/ITU-R/Pages/publications.aspx?parent=R-REG-RR-2020&media=electronic (accessed on 24 April 2025).
  43. ITU. The Final Acts of WRC-23. 2023. Available online: https://www.itu.int/hub/publication/r-act-wrc-16-2024/ (accessed on 24 April 2025).
  44. ITU. Radio Regulations, 2024th ed., The International Telecommunication Union: Geneva, Switzerland, 2024. Available online: https://www.itu.int/hub/publication/r-reg-rr-2024/ (accessed on 24 April 2025).
  45. Allison, A.L. The ITU and Managing Satellite Orbital and Spectrum Resources in the 21st Century; Springer International Publishing: Berlin/Heidelberg, Germany, 2014; ISBN 978-3-319-05314-1. [Google Scholar]
  46. Lu, F.; Jiang, Y.; Wang, R.; Wang, H.; Zhao, P.; Wei, H.; Ma, B.; Ma, C. System demonstrations of Ka-band 5-Gbps data transmission for satellite applications. Int. J. Satell. Commun. Netw. 2022, 40, 204–217. [Google Scholar] [CrossRef]
  47. Xiao, Z.; Mao, T.; Han, Z.; Xia, X. Near Space Communications: A New Regime in Space-Air-Ground Integrated Networks. IEEE Wirel. Commun. 2022, 29, 38–45. [Google Scholar] [CrossRef]
  48. Kobayashi, M.M.; Stocklin, F.; Pugh, M.; Kuperman, I.; Bell, D.; El-Nimri, S.; Johnson, B.; Huynh, N.; Kelly, S.; Nessel, J.; et al. NASA’s high-rate Ka-band downlink system for the NISAR mission. Acta Astronaut. 2019, 159, 358–361. [Google Scholar] [CrossRef]
  49. ITU. Itu-R Sf.1601-2: Methodologies for Interference Evaluation from the Downlink of the Fixed Service Using High Altitude Platform Stations to the Uplink of the Fixed-Satellite Service Using the Geostationary Satellites Within the Band 27.5–28.35 Ghz. 2007. Available online: https://www.itu.int/rec/R-REC-SF.1601-2-200702-I/en (accessed on 27 February 2025).
  50. Zhao, W.H.; Zhao, J.; Zhao, S.H.; Li, Y.J.; Li, X. Resources scheduling for data relay satellite with microwave and optical hybrid links based on improved niche genetic algorithm. Optik 2014, 125, 3370–3375. [Google Scholar] [CrossRef]
  51. Zhang, J.F.; Cheng, Y.J. K-/Ka-Band Planar Shared-Aperture Beam-Scanning Array Antenna for Simultaneous Transmitting and Receiving Low Earth Orbit Satellite Communication Terminal. IEEE Trans. Antennas Propag. 2023, 71, 6617–6627. [Google Scholar] [CrossRef]
  52. LaBelle, R.; Rochblatt, D. Ka-band high-rate telemetry system upgrade for the NASA deep space network. Acta Astronaut. 2012, 70, 58–68. [Google Scholar] [CrossRef]
  53. Chelmins, D.T.; Reinhart, R.C.; Mortensen, D.; Welch, B.; Downey, J.; Evans, M. Studying NASA’s Transition to Ka-Band Communications for Low Earth Orbit. Eng. Comput. Sci. 2014, 1–7. Available online: https://ntrs.nasa.gov/api/citations/20140016968/downloads/20140016968.pdf (accessed on 11 May 2025).
  54. Chen, N.; Peng, D.; Ma, L.; Hu, T.; Liu, H.; Li, H. Horizontal Detection Range Estimation of Deep-Sea Acoustic Shadow Area Based on Vertical Phased Emission Array. J. Mar. Sci. Eng. 2025, 13, 9. [Google Scholar] [CrossRef]
  55. Yuan, W. The Design of High Speed Near Space Vehicle TT&C Link and Simulation Platform Implementation. Master’s Thesis, Xidian University, Xi’an, China, 2012. [Google Scholar]
  56. Guo, L.; Guo, L.; Li, J. Influence of a Hypersonic Ablative Plasma Wake-Field on the Performance of a Vivaldi Antenna. IEEE Trans. Plasma Sci. 2024, 52, 1474–1480. [Google Scholar] [CrossRef]
  57. Ning, R.; Bin, X.; Xiao-Fei, L. Development Status and Difficulties of the Technology of Blackout Suppression. Missiles Space Veh. 2018, 1, 122–126. [Google Scholar] [CrossRef]
  58. Chai, M.; Gu, N.; Han, Z.; Tian, W. Overview of global Ka-band in-orbit satellite usage. In Proceedings of the 12th Annual Conference on Satellite Communication, Beijing, China, 3 March 2016; pp. 103–108. [Google Scholar]
  59. Angert, M.P.; Bubnash, B.M.; Cerabona, M.A.; Dauberman, M.G.; Monaghan, C.; Heistand, C.C.; Wilkes, J.C. Frontier Radio-Multi-Lingual-A Next Generation Space Software Defined Radio. In Proceedings of the 2023 IEEE Aerospace Conference, Big Sky, MT, USA, 4–11 March 2023; pp. 1–12. [Google Scholar]
  60. Koosha, B.; Singh, R.; Sanders, C.; Spicer, J.; Ratana, T.; Conrad, R. SpaceLink-ISS Connectivity End-to-End Demonstration (SLICED). In Proceedings of the 2023 IEEE Aerospace Conference, Big Sky, MT, USA, 4–11 March 2023; pp. 1–10. [Google Scholar]
  61. Harmon, K.; Arnold, B.; Levesque, M.; Johnston, M.; Lichten, S.; Lock, P.; Berry, D.; Asmar, S.; Pham, T. Pre-launch lessons learned from NASA’S deep space network support for the artemis I mission to the moon. Acta Astronaut. 2023, 210, 589–595. [Google Scholar] [CrossRef]
  62. Zoccarato, P.; Larese, S.; Naletto, G.; Zampieri, L.; Brotto, F. Deep Space Navigation by Optical Pulsars. J. Guid. Control Dyn. 2023, 46, 1501–1512. [Google Scholar] [CrossRef]
  63. Al Homssi, B.; Chan, C.C.; Wang, K.; Rowe, W.; Allen, B.; Moores, B.; Csurgai-Horváth, L.; Fontán, F.P.; Kandeepan, S.; Al-Hourani, A. Deep Learning Forecasting and Statistical Modeling for Q/V-Band LEO Satellite Channels. IEEE Trans. Mach. Learn. Commun. Netw. 2023, 1, 78–89. [Google Scholar] [CrossRef]
  64. Cuervo, F.; Martellucci, A.; Rivera Castro, J.; Schmidt, M.; Schönhuber, M. The Alphasat Aldo Paraboni scientific and communication experiments at Ka and Q/V bands in Austria. Int. J. Satell. Commun. Netw. Munications Netw. 2019, 37, 437–448. [Google Scholar] [CrossRef]
  65. Ye, L.; Yang, Y.; Chen, B.; Pan, D.; Yang, F.; Cao, S.; Yan, Y.; Sun, F. Chaff Cloud Integrated Communication and TT&C: An Integrated Solution for Single-Station Emergency Communications and TT&C in a Denied Environment. Drones 2024, 8, 207. [Google Scholar] [CrossRef]
  66. ITU. Recommendation Itu-R P.618-12: Propagation Data and Prediction Methods Required for the Design of Earth-Space Telecommunication Systems. Available online: https://www.itu.int/dms_pubrec/itu-r/rec/p/R-REC-P.618-12-201507-S!!PDF-E.pdf (accessed on 27 February 2025).
  67. Samad, M.A.; Choi, D.-Y. Scaling of Rain Attenuation Models: A Survey. Appl. Sci. 2021, 11, 8360. [Google Scholar] [CrossRef]
  68. Musthafa, A.M.; Luini, L.; Riva, C.; Livieratos, S.N.; Roveda, G. A long-term experimental investigation on the impact of rainfall on short 6G D-band links. Radio Sci. 2023, 58, 1–10. [Google Scholar] [CrossRef]
  69. Acharya, R. A simple real-time frequency scaling technique for rain attenuation and its performance. Int. J. Satell. Commun. Netw. 2020, 38, 329–340. [Google Scholar] [CrossRef]
  70. Monga, S.; Taneja, A.; Saluja, N.; Garg, R.; Siag, T. Estimation of Rain Attenuation Over 10 GHz to 80 GHz Radio Band. In Proceedings of the 2022 3rd International Conference on Computing, Analytics and Networks (ICAN), Punjab, India, 18–19 November 2022; IEEE: Piscataway, NJ, USA, 2022; pp. 1–6. [Google Scholar]
  71. ITU. Recommendation ITU-R P.838-3. Specific Attenuation Model for Rain for Use in Prediction Methods. 2005. Available online: https://itu-rpy.readthedocs.io/en/latest/apidoc/itu838.html (accessed on 27 February 2025).
  72. China Meteorological Administration. Rainfall Classification. Available online: https://www.cma.gov.cn/ (accessed on 8 September 2024).
  73. ITU. ITU-R P.679-4. Propagation Data Required for the Design of Broadcasting-Satellite Systems. 2015. Available online: https://www.itu.int/dms_pubrec/itu-r/rec/p/R-REC-P.679-4-201507-I!!PDF-C.pdf (accessed on 27 February 2025).
  74. Wang, X.; Liu, Z.; Xia, G. Effects of Reentry Plasma Fluctuation on Polarization Properties of Electromagnetic Waves. Prog. Electromagn. Res. M 2017, 58, 171–181. [Google Scholar] [CrossRef]
  75. Gibbins, C.J. Erratum: Zenithal attenuation due to molecular oxygen and water vapour, in the frequency range 3–350 GHz. Electron. Lett. 1986, 22, 726. [Google Scholar] [CrossRef]
  76. ITU. ITU-R P.676-13: Attenuation by Atmospheric Gases. 2013. Available online: https://www.itu.int/dms_pubrec/itu-r/rec/p/R-REC-P.676-8-200910-S!!PDF-E.pdf (accessed on 27 February 2025).
  77. ITU. ITU-R P. 840-9: Attenuation Due to Clouds and Fog. 2023. Available online: https://www.itu.int/dms_pubrec/itu-r/rec/p/R-REC-P.840-9-202308-I!!PDF-C.pdf (accessed on 27 February 2025).
  78. ITU. ITU-R P.618-14: Propagation Data and Prediction Methods Required for the Design of Earth-Space Telecommunication Systems. 2015. Available online: https://www.itu.int/dms_pubrec/itu-r/rec/p/R-REC-P.618-14-202308-I!!PDF-C.pdf (accessed on 27 February 2025).
  79. Zhaoying, W.A.N.G.; Lixin, G.U.O.; Jiangting, L.I. Research on phase shift characteristics of electromagnetic wave in plasma. Plasma Sci. Technol. 2021, 23, 075001. [Google Scholar] [CrossRef]
  80. Koskinen, H.E.J.; Kilpua, E.K.J. From Charged Particles to Plasma Physics. In Physics of Earth’s Radiation Belts; Springer: Cham, Switzerland, 2022; pp. 63–83. ISBN 978-3-030-82167-8. [Google Scholar] [CrossRef]
  81. Yao, J.; Yu, Z.; Yuan, C.; Zhou, Z.; Wang, X.; Kudryavtsev, A.A. The Influence of Plasma Distribution on Microwave Reflection in a Plasma-Metal Model. IEEE Trans. Plasma Sci. 2020, 48, 359–363. [Google Scholar] [CrossRef]
  82. Jin, J.; Chen, C.; Cheng, W.; Chen, T.; Zhou, T.; Ling, Y. Properties of Terahertz Wave Propagation in Inhomogeneous Plasma Sheath. J. Syst. Simul. 2015, 27, 3109–3115. [Google Scholar]
  83. Deng, X.; Hu, J.; Yang, W. Near space vehicle channel modeling and simulation. In Proceedings of the Chinese Society of Astronautics Flight Vehicle Measurement and Control Committee 2007 Space Measurement and Control Technology Seminar, Hangzhou, China, 5–9 September 2007; pp. 347–351. [Google Scholar]
  84. Gongshun, L.I.; Zhang, T.; Geng, K.; Wen, F.; Ye, K.; Xu, L.; Zhu, X.; Zhang, X.; Zhong, F.; Zhou, Z. A mathematically-derived unified Equation for Time-Varying Doppler effect, Cosmological red-shift and Cherenkov radiation. Plasma Sci. Technol. 2024, 26, 34001. [Google Scholar] [CrossRef]
  85. Rao, K.; Swamy, M. Spectral Analysis of Signals. In Digital Signal Processing; Springer: Singapore, 2018; ISBN 978-981-10-8081-4. [Google Scholar]
  86. Sankar, A.; Darshan, S.; Devika, K.M.; Varghese, B.; Menon, P.R. SDR based CCSDS Shaped Offset QPSK Modulator for Aerospace Applications. In Proceedings of the 2023 9th International Conference on Smart Computing and Communications (ICSCC), Kerala, India, 17–19 August 2023; pp. 184–189. [Google Scholar]
  87. Kryukov, Y.V.; Pokamestov, D.A.; Rogozhnikov, E.V. Comparison of Theoretical and Real Throughput of PD-NOMA. J. Commun. Technol. Electron. 2023, 68, 88–95. [Google Scholar] [CrossRef]
  88. Xue, L.; Li, X.; Wu, W.; Yang, Y. Design of Tracking, Telemetry, Command (TT&C) and Data Transmission Integrated Signal in TDD Mode. Remote Sens. 2020, 12, 3340. [Google Scholar] [CrossRef]
  89. Xue, L.; Li, X.; Wu, W.; Dong, J. Multifunctional Signal Design for Measurement, Navigation and Communication Based on BOC and BPSK Modulation. Remote Sens. 2022, 14, 1653. [Google Scholar] [CrossRef]
  90. Wang, B.; Tang, Z.; Wei, J. Comparison and analysis of COMPASS B1C Candidate signal. In Proceedings of the 7th China Satellite Navigation Conference-S03 Satellite Navigation Signals, Changsha, China, 18–20 May 2016; pp. 83–93. [Google Scholar]
  91. Li, X.; Zeng, X.; Xue, L. Integrated Communication and Measurement System with BOC-Assisted OFDM. Drones 2023, 7, 14. [Google Scholar] [CrossRef]
  92. Ni, Y.; Zou, L.; Liu, R.; Chen, W.; Qin, Z.; Wang, K. L/C dual-band navigation signal modulation mode and performance evaluation of BeiDou system. Syst. Eng. Electron. 2022, 44, 327775. [Google Scholar]
Figure 1. Application scenarios of various frequency bands within the frequency range from 1 GHz to 40 GHz.
Atmosphere 16 00586 g001
Figure 2. (a) The range of signal transmission loss in the K/Ka frequency band in the NS. (b) The signal transmission loss in the K/Ka frequency band at different elevation angles at the bottom layer of the NS. (c) The signal transmission loss in the K/Ka frequency band at different elevation angles at the top layer of the NS.
Atmosphere 16 00586 g002
Figure 3. The relationship between the rain attenuation coefficient and R0.01 for the K/Ka frequency band in the NS. (a) Rain attenuation coefficient. (b) R0.01 under the condition of circular polarization. (c) R0.01 under the condition of horizontal polarization. (d) R0.01 under the condition of vertical polarization.
Atmosphere 16 00586 g003aAtmosphere 16 00586 g003b
Figure 4. Curves of the attenuation coefficients of oxygen molecules and water vapor varying with frequency.
Atmosphere 16 00586 g004
Figure 5. 1 min rain rate and rain attenuation.
Atmosphere 16 00586 g005
Figure 6. Simulation results of the attenuation of clouds and fog in the NS under different conditions. (a) The loss of clouds and fog when the height of the cloud layer is fixed at 500 m. (b) The loss of clouds and fog under the condition of −8 °C and moderate fog. (c) The loss of clouds and fog under the condition of 20 °C and moderate fog. (d) The loss of clouds and fog when the fixed launch angle is 60° and the loss rate coefficient ranges from 0.2 to 0.8.
Atmosphere 16 00586 g006
Figure 7. Curves of the attenuation of atmospheric scintillation varying with frequency under different elevation angles. (a) The attenuation of atmospheric scintillation at different latitudes when the elevation angle is less than 4° (taking 0.5° as an example). (b) The attenuation of atmospheric scintillation under different elevation angles when the elevation angle is greater than 4°.
Atmosphere 16 00586 g007
Figure 8. Simulation results of the attenuation coefficient, phase shift coefficient of the plasma, and the electron density distribution model of the spatially inhomogeneous plasma. (a) Attenuation coefficient k and phase shift coefficient m. (b) Electron density distribution model of the spatially inhomogeneous plasma.
Atmosphere 16 00586 g008
Figure 9. Influence of multipath and Doppler in the NS on signal services. (a) BER of different path models under different time delays and powers. (b) BER of the four-paths model under different time delays and powers.
Atmosphere 16 00586 g009
Figure 10. ACF, PSD of the noise sequence, and the corresponding distribution of the noise sequence and the fitting curve. (a) ACF and PSD. (b) Distribution of the noise sequence and the fitting curve.
Atmosphere 16 00586 g010
Figure 11. Comparison results of the power spectral density functions and spectrum utilization efficiencies of ASK, FSK, BPSK, and CPM modulated signals.
Atmosphere 16 00586 g011
Figure 12. Simulation comparison results of the PSD and ACF curves for typical single signals and integrated signals. (a) Comparison of the PSD of the CMP-BOC (1,1) signal and its composite components. (b) Comparison of the ACF of the CMP-BOC (1,1) signal and its composite components. (c) Comparison of the PSD of the CMP-OFDM signal and its composite components. (d) Comparison of the ACF of the CMP-OFDM signal and its composite components. (e) Comparison of the PSD of the OFDM-BOC (1,1) signal and its composite components. (f) Comparison of the ACF of the OFDM-BOC (1,1) signal and its composite components. (g) Comparison of the PSD of the BPSK-BOC (1,1) signal and its composite components. (h) Comparison of the ACF of the BPSK-BOC (1,1) signal and its composite components.
Atmosphere 16 00586 g012
Table 1. Relevant documents for spectrum resource management in ITU.
NameTypeApplicable Conditions
ITU-R S.1001-2Standards for satellite communication integration.Fixed satellite service (FSS) and mobile satellite service (MSS).
ITU-R M.IMT-2020Standards for satellite communication integration.5G satellite radio interface standard.
ITU-R P.619Recommendations of ITU-R Series P.It is used for interference assessment, aiming at the interference paths between the space station and the ground station such as propagation in clear sky, scattering by rain and snow, etc.
ITU-R P.452 Recommendations of ITU-R Series P.It provides propagation models between the near-space and the ground to support link design and spectrum efficiency optimization.
ITU-R P.531Recommendations of ITU-R Series P.It is used to analyze the influence of the ionosphere on near-space communication, and to provide the basis of propagation characteristics for the spectrum usage in high-frequency bands such as Ka/V frequency bands.
Radio Regulations, Edition of 2020An international treaty that regulates the use of the global radio frequency (RF) spectrum and satellite orbits.It covers more than 40 different radio communication services, with frequencies ranging from 8.3 kHz to 3000 GHz.
The Final Acts of WRC-23Supplement to the Radio Regulations.It is used for high-altitude platform station (HIBS), Earth station in motion for non-GEO satellite (ESIM), and space weather observation.
Radio Regulations, Edition of 2024An international treaty that regulates the use of the global radio frequency (RF) spectrum and satellite orbits.Updates and supplements to the Radio Regulations, Edition of 2020.
Table 2. Comparative statistics of the advantages and disadvantages between K/Ka bands and traditional L/S/C bands.
Comparison ItemsK/Ka Frequency BandL/S/C Frequency Bands
Frequency band distributionK: 18–27 GH
Ka: 27–40 GHz
L: 1–2 GHz
S: 2–4 GHz
C: 4–8 GHz
Comparison of transmission characteristicsBandwidthExtremely large bandwidth, and supports high-speed data transmission.
Typical values: 500–2000 MHz.
The bandwidth is relatively narrow, and the data rate is limited.
Typical values: 20–100 MHz.
Atmospheric attenuationIt is significantly affected by rain attenuation and the absorption of oxygen/water vapor.
Typical values: 0.3 dB/km (sunny)-10 dB/km (torrential rain).
The attenuation is relatively low.
Typical values: 0.02 dB/km–0.1 dB/km.
Penetration abilityPoor penetrability (it is easily blocked by buildings and vegetation).Strong penetrability (especially in the L frequency band, which is suitable for urban and indoor coverage).
Anti-interference abilityIt has relatively abundant spectrum resources and relatively less interference.The spectrum congestion is severe.
Equipment and costAntenna sizeShort wavelength and a small antenna size
Typical values: 0.3–0.6 m.
The antenna size is relatively large.
Typical values: 1–5 m.
The cost of componentsThe cost of high-frequency devices is high.The cost of mature silicon-based devices is low.
Power efficiencyThere is a large path loss, and a high-power amplifier is required.The path loss is small, and the power efficiency is high.
Typical application scenariosAdvantagesSuitable for high-throughput scenarios, short-distance/space-to-ground links (rain attenuation needs to be compensated), and miniaturized terminals.
Cases: Starlink user terminals, airborne radars, and urban 5G hotspots.
Suitable for long-distance communication, scenarios with high penetrability requirements, and low-cost wide-coverage scenarios.
Cases: Satellite television broadcasting, GPS navigation, military communication.
Disadvantages1. Communication in rainy areas;
2. Long-distance transmission without repeaters.
1. Scenarios with high-capacity requirements;
2. Scenarios with high spectrum reuse.
Table 3. Simulation parameters of different multipath channel models in NS.
The Number of PathsTime Delay (μs)Relative Power of the Direct Path (dB)
direct single path00
double paths300−6
three paths450−12
four paths600−18
Table 4. Simulation parameters of the four-path channel model in NS.
The Number of PathsTime Delay (μs)Relative Power of the Direct Path (dB)
four paths -100
four paths -210−1
four paths -320−2
four paths -430−3
Disclaimer/Publisher’s Note: The statements, opinions and data contained in all publications are solely those of the individual author(s) and contributor(s) and not of MDPI and/or the editor(s). MDPI and/or the editor(s) disclaim responsibility for any injury to people or property resulting from any ideas, methods, instructions or products referred to in the content.

