Article

Spatial Heterogeneity of Drop Size Distribution and Its Implications for the Z-R Relationship in Mexico City

by
Roberta Karinne Mocva-Kurek
1,
Adrián Pedrozo-Acuña
2,* and
Miguel Angel Rico-Ramírez
3
1
Program of Master and Doctorate in Engineering, National Autonomous University of Mexico (UNAM), Mexico City 04510, Mexico
2
Institute of Engineering, National Autonomous University of Mexico (UNAM), Mexico City 04510, Mexico
3
School of Civil, Aerospace and Design Engineering, University of Bristol, Bristol BS8 1TR, UK
*
Author to whom correspondence should be addressed.
Atmosphere 2025, 16(5), 585; https://doi.org/10.3390/atmos16050585
Submission received: 2 April 2025 / Revised: 30 April 2025 / Accepted: 9 May 2025 / Published: 13 May 2025
(This article belongs to the Section Meteorology)

Abstract

:
The evaluation of raindrop size distribution (DSD) is a crucial subject in radar meteorology, as it determines the relationship between radar reflectivity (Z) and rainfall rate (R). The coefficients (a and b) of the Z-R relationship vary significantly due to several factors (e.g., climate and rainfall intensity), rendering the characterization of local DSD essential for improving radar quantitative precipitation estimation. This study used a unique network of 21 disdrometers with high spatio-temporal resolution in Mexico City to investigate changes in the local drop size distribution (DSD) resulting from seasonal fluctuations, rain rates, and topographical regions (flat urban and mountainous). The results indicate that the DSD modeling utilizing the normalized gamma distribution provides an adequate fit in Mexico City, regardless of geographical location and season. Regional variation in DSD’s slope, shape, and parameters was detected in flat urban and mountainous areas, indicating that distinct precipitation mechanisms govern rainfall in each season. Severe rain intensities (R > 20 mm/h) exhibited a more uniform and flatter DSD shape, accompanied by increased dispersion of DSD parameter values among disdrometer locations, particularly for intensities exceeding R > 60 mm/h. The coefficients a and b of the Z-R relationship exhibit significant geographic variability, dependent on the city’s topographic gradient, underscoring the necessity for regionalization of both coefficients within the metropolis.

1. Introduction

The raindrop size distribution (DSD) provides fundamental information in many fields related to hydrology and soil erosion [1,2]. Regarding soil erosion, a comprehensive characterization of DSD facilitates a more accurate measurement of the kinetic energy imparted to the soil and, subsequently, its erosive potential, as it is the main driver of this phenomenon [3]. Research indicates that larger raindrops possess greater kinetic energy, enhancing the soil’s detachment potential and structural disruption (for example, [4,5]).
On the other hand, the DSD defines the relationship between reflectivity factor (Z) and the rain rate (R), which enables quantitative precipitation estimation (QPE) for ground-based or space-borne radar [6,7,8]. Therefore, understanding the DSD variability is of great importance in several areas of hydro-meteorology.
Numerous studies have focused on elucidating the statistical characteristics of DSD worldwide, emphasizing the significance of geographical locations, climate conditions, seasonal variations, types of precipitation, and diurnal cycles [9,10,11,12,13,14,15,16,17]. Research indicates that geographical location significantly affects DSD features [13,18]. The DSD in northern and southern China exhibits considerable variations in precipitation microphysical parameters across different regimes during convective rainfall, although the differences are less pronounced in stratiform events [19]. Seasonal variations have also been observed in the cities of Beijing and Taiwan [12,14,20]. In Mediterranean regions, the orographic environment, seasonal variations, and weather patterns are significant factors influencing the characteristics of DSD [21]. Therefore, there is a dynamic variability in the DSD characteristics across both spatial and temporal dimensions.
However, less attention has been devoted to the spatial variability of the DSD parameters within urban environments, as the majority of research has relied on data from a single disdrometer [17,22]. In contrast, ref. [23] observed a significant variability in DSD features on a kilometer scale using an observation network composed of 16 disdrometers, while refs [18,24] conducted the few studies looking at the spatial variability in DSD characteristics within urban environments using information from 10 and 11 disdrometers in Beijing, respectively. In their study, ref. [24] indicated that the regional variations in DSD spectra in Beijing could be linked to factors such as precipitation type, the urban heat island effects, the aerosol effects, and orography. The study of [18] revealed disparities between urban and suburban areas for identical precipitation types, as well as differences between mountain and plain regions (i.e., urban and suburban) due to the convection/stratiform precipitation types. The observed variations indicated the great need to further examine the impact of topography on the DSD variability in cities with mountainous regions.
Moreover, recent studies have pointed out the need to measure precipitation at high spatial resolutions for accurate rainfall modeling in urban areas, stating that coarse measurement resolutions can lead to significant errors, especially during intense rainstorms [25,26].
Mexico City, one of the largest cities globally, has a population of 22.752 million. The urban expansion and consequent soil impermeabilization, coupled with the intricate topography, render the western region of the city particularly susceptible to extreme weather phenomena, including torrential rainfall and floods [27]. Mexico City’s rainfall regime is marked by a pronounced wet season with significant spatial and temporal variability. Urbanization and natural climatic oscillations both play crucial roles in shaping the city’s precipitation patterns, leading to increased intensity and frequency of rainfall events [28,29]. Studies report an increase in the number of severe storms in recent decades, raising the risk of flooding [30]. Therefore, understanding these urban dynamics of precipitation is essential for effective water resource management and disaster preparedness.
Several years ago, a network of second-generation laser-optical disdrometers was put in various locations throughout Mexico City, offering an excellent chance to examine the spatial variability in DSD. Currently, only a couple of studies have focused on the DSD characteristics in Mexico City due to the lack of DSD measurements [31,32]; however, these studies have been limited to data obtained from very few or a single optical disdrometer, limiting the number of rainy periods and spatial extent.
This paper offers a thorough examination of DSD properties based on continuous observations over one year (June 2018–June 2019) in the metropolitan area of Mexico City with the objective of enhancing our understanding and characterization of the DSD in urban settings to improve radar rainfall retrievals. We examine the DSD properties, their variabilities, and their implication on the Z-R relationship in two categorized topographic regions, on a seasonal scale, and throughout rain classes. As the DSDs gathered across different precipitation regimes offer significant insights into natural DSD variability [33], this paper builds upon the prior preliminary work completed by [31]. It is anticipated that this will enhance our understanding of the microphysical characteristics of precipitation and improve the accuracy of radar QPE.
This paper is organized as follows: Section 2 describes the study area and data used, the DSD adjustment methodology, and the seasonal classification. The spatial characteristics of DSD in Mexico City and their implications in the Z-R relationship are analyzed and discussed in Section 3. Section 4 provides the conclusions.

2. Data and Methodology

2.1. Study Area and Data Set

The study area corresponds to Mexico City, located in a large valley in the central-southern part of Mexico, surrounded by a mountain range with an average elevation of 2500 m above the mean sea level. Precipitation in this area primarily arises from convective clouds formed under the influence of trade winds that introduce unstable air and moist conditions, along with orographic effects, with occasional occurrences during the dry season, particularly from cold-front systems [30,34].
This research collected DSD measurements at different locations in Mexico City during June 2018 and June 2019 using 21 laser-optical disdrometers (Parsivel2, OTT Hydrommet, Kempten, Germany) with a temporal resolution of 1 min (see Figure 1 and Table 1). The main technical characteristics of the disdrometer are shown in Appendix A. The distance between the DSD stations varies from 2.5 to 39.6 km. This network of disdrometers was installed by the National Autonomous University of Mexico [35], and the instruments are evenly distributed within the political boundaries of Mexico City (black solid line in Figure 1). Figure 1 illustrates their geographical locations, together with the topographical variability in the region. The mountainous terrain is situated in the southwestern part of the city, as depicted in the image.
The analysis of the collected data revealed that missing data were absent during the rainy period. Following the methodologies established by [10,36], data pertaining to 1 min N(D) with large diameters (Dmax > 8 mm) were excluded to eliminate the potential influence of hail particles in the dataset. Furthermore, only data exhibiting values across four or more consecutive diameter classes were included to mitigate measurement errors. Finally, N(D) data corresponding to 1 or 2 isolated rain minutes were excluded, as they typically indicated very low rain rates (<1 mm), which may be linked to measurement errors and uncertainties, as demonstrated by [37]. A total number of 543,604 min observations from 21 disdrometers were analyzed in this study.
In urban environments, the distribution of raindrop sizes and rainfall rates demonstrates significant spatial and temporal variability. Accurate rainfall estimation necessitates a high density of spatial measurements and an understanding of local topography [2,17]. Topographic effects have been found to significantly influence raindrop size distribution [38,39,40,41]. Therefore, a categorization of disdrometers based on their location and terrain elevation is conducted due to the complexity of the terrain in Mexico City.
In the first group, 11 disdrometers are analyzed based on their placement in the flat urban region of the city, where terrain elevation is below 2300 m above sea level. The second group, namely, the high mountain region, comprises 10 disdrometers situated at elevations exceeding 2300 m above sea level (see Table 1).

2.2. Raindrop Size Distribution and Normalized Gamma Function

Research has shown that the normalized gamma distribution can be used to describe raindrop spectra in a range of seasonal and atmospheric conditions [11,42,43,44]. The primary significance of these results is that their parameters have different physical interpretations [10] and facilitate the comparison of DSDs with markedly different characteristics, hence enhancing the understanding of cloud microphysics [37].
The three-parameter normalized gamma distribution can be expressed as follows, according to [10,45].
N ( D ) = N w f ( μ ) ( D D o ) μ exp [ ( 3.67 + μ ) D D o ]
where N(D) is the number of particles/drops per unit volume per interval of diameter (m-4), D is the drop diameter (mm), Nw is the normalized intercept parameter (mm−1 m−3), µ is the shape parameter, Do is the median volume diameter (mm), and f(µ) is given by:
f μ = 6 3.67 4 3.67 + μ μ + 4 Γ μ + 4
Initially, the mass-weighted mean diameter (Dm) and Nw are computed for each observed 1 min distribution through the n-order moment approach [10], which asserts that Dm is as physically significant as Do, facilitating its calculation from the observed spectra. According to [10,11,45], the Dm and Nw parameters can be computed by:
D m = 0 N ( D ) D 4 dD 0 N ( D ) D 3 dD
N w = 4 4 π ρ w ( W D m 4 )
where ρw is the water density and W is the liquid water content (gm−3) given by:
W = π ρ w 6 0 N ( D ) D 3 d D
The aforementioned two parameters are first computed without adjustment of the distribution. Nw, which is characterized by two physical quantities (W and Dm), indicates the variation in total drop concentration [46] and serves as the intercept parameter of the exponential distribution corresponding to the same W and Dm [10].
In the sequence, each N(D) data set was normalized using F(Di/Dm) = N(Di)/Nw, where Di is the drop diameter in i diameter class, and N(Di) is the drop concentration. In this case, only the µ parameter determines the best-fitting normalized gamma distribution. The search technique is utilized to determine the best µ, which characterizes the normalized shape of the gamma DSD, as delineated in Equation (16) of [10]:
F μ X = Γ 4 4 4 4 + μ 4 + μ Γ 4 + μ X μ   exp 4 + μ X
where X represents the relationship D/Dm.
Ref. [47] examined the natural variation in µ values, focusing on identifying the optimal µ within the range of −3 to 15, as noted by [11] and similarly by [13]. The initially computed Nw (Equation (4)) is recalibrated utilizing µ as used in Equation (1) for enhanced parameter adjustment. Regarding the Do parameter, ref. [48] suggested the use of Dm as an estimator, as Do signifies the drop diameter divided into two equal segments of the liquid water content, rendering direct measurement exceedingly challenging. In gamma DSD, Do is associated with Dm by:
D 0 D m = 3.67 + μ 4 + μ
This paper uses the three-parameter normalized gamma distribution described in this section, characterized by Nw, Do, and µ, to fit the measured DSDs from the 21 disdrometers.

2.3. Z-R Relationship

Enhancing radar quantitative precipitation estimation (QPE) can be achieved by calibrating the radar reflectivity–rain rate relationship (Z-R relationship) to local meteorological conditions, hence reducing uncertainty in rainfall estimation. The Z-R relationship is frequently represented as a power-law equation as introduced by [49]:
Z = a   R b
the coefficients a and b are related to the wide range of DSDs expected in natural rain at the location of interest.
Using the results from the normalized gamma DSD fitting, values of R (mm/h) and Z (mm6 m−3) are derived from the 3.67th and 6th moments of the DSD and given by [45,50]:
R = 0.6 π × 10 3 ν ( D ) D 3 N ( D ) dD
Z = D 6 N ( D ) dD
where ʋ(D) is the terminal fall velocity of raindrops (m/s). This study utilized the ʋ(D) model proposed by [51].
The coefficients a and b are estimated using linear regression on log-transformed Z-R time series, calculated through least-squares fitting for each disdrometer station. Data with R < 0.5 mm/h are excluded from the Z-R time series as suggested by [52], which indicates that very light rainfall results in significant dispersion of DSD parameters, causing erratic spectral behavior, as small drops are challenging to measure.

2.4. Rain Rates Classification and Seasonal Evaluation

This study aims to assess the impact of various rainfall types on DSD behavior, focusing on the parameters Nw, Do, and µ. The analysis involves classifying 1 min DSD data from the 21 disdrometer stations based on rain rate values (similar to previous researchers, for example, [9,17,53,54,55]).
Six classes are established based on the specified ranges of rain rate values as follows: R < 2, 2 < R < 20, 20 < R < 40, 40 < R < 60, 60 < R < 100, and R ≥ 100 mm/h. The rain rate classes can be categorized as follows: very light, light, moderate, heavy, very heavy, and extremely heavy rain, based on the rainfall classification of ref. [56]. The rain rate for this classification was derived using Equation (9).
The rainfall patterns of Mexico City, marked by different wet and dry seasons [57], are examined for their seasonal impact. Previous research has demonstrated clear differences in DSD between summer and winter precipitation (for instance, ref. [14]). The DSD parameters and Z-R coefficients are classified into two seasons: summer, which includes May to October (the rainy period), and winter, covering November to April. Appendix B (Table A2) contains the specifics of the data set for the six rain rate classifications and seasonal intervals.

3. Results and Discussions

3.1. Gamma Function Validation

This study evaluates between 20,190 and 32,762 min of rainfall from each disdrometer station (complete period), resulting in a cumulative total of 543,604 min of observations (see Appendix B, Table A1 for further details). Most rainy minutes, approximately 85.86%, are recorded during the summer, while just about 14.14% occur in the winter.
Using the 1 min N(D) data series of the 21 disdrometers, Figure 2 presents the average measured DSDs (solid lines) with the fitted DSDs (dotted lines), employing the normalized gamma distribution. Moreover, results for the whole period (June 2018–June 2019) for flat urban region are shown in panel (a), while results for the high mountain region are shown in panel (b). The gamma distribution shows a good agreement in all region.
To enhance comprehension of the results, raindrop diameter classification is categorized as small (<1 mm), medium (1–3 mm), and big (>3 mm), consistent with methodologies employed in other research papers (e.g., refs [44,54,58,59]).
Generally, the forms of the DSD spectrum exhibit resemblance throughout the flat urban and high mountainous regions of Mexico City. The drop concentration has a singular peak with diameter values ranging from 0 to 1 mm in all analyzed periods and regions. This pattern underscores the consistent predominance of smaller droplets. In this peak, the concentration of drops in the upper mountain region exceeds that of the flat urban area.
Other research indicates that this configuration of the DSD spectrum is commonly observed; for instance, ref. [13] concentrated on the global characteristics of DSD. In their comparison of DSD characteristics across various locations in India, ref. [60] found two peaks in all DSDs, with the initial peak falling within the same range as this study.
The most significant differences in the DSD spectrum between flat urban and high mountain regions are identified in drop diameter values >3 mm, increasing to large diameter values across all investigated periods. The slope of the DSD is less steep in summer than in winter (Figure 2b,c), indicating a more even distribution of drop sizes and the occurrence of larger drops. Conversely, a much gentler slope in the DSD form is observed during winter, indicating a predominance of smaller raindrops, hence implying distinct precipitation processes responsible for rainfall. The similarity of the DSD for both the complete and summer seasons indicates that the majority of rainfall in Mexico City occurs during the summer season.
The DSD spectrum of Mexico City reveals two points where the behaviors of the regions are inverted, indicating that the contribution of small drops (diameters between 0 and 1 mm) and large drops (>6 mm) to the drop concentration is comparatively greater in the high mountain region than in the flat urban region, while the reverse is true for medium-sized drops.
The investigation of the DSD spectrum in Beijing, China, indicated that the curve for the mountainous region consistently falls below that of the urban area [18]. Conversely, the Tianshan Mountains in China exhibit an opposing behavior [55].
Table 2 presents the mean and standard values of the normalized gamma DSD parameters for 21 disdrometer stations for the complete period. The parameters of the Nw logarithm (logNw), Do, and µ exhibit values ranging from 3.64 to 3.94 mm−1 m−3, 0.94 to 1.04 mm, and 6.04 to 8.59, respectively, over all disdrometer stations in Mexico City. Based on these findings, the mean local gamma parameters are as follows: logNw = 3.77 mm−1 m−3, Do = 1.0 mm, and µ = 7.89.
The overall mean results align with those reported by ref. [13] for low latitude and mean global (logNw 3.94/3.95 mm−1 m−3 and Do 1.18/1.13 mm, respectively), except for the µ parameter, where results from this study indicate more than double the mean value.
The logNw values are comparable to the traditional reference values given by [49] for exponential DSD (logNw = 3.9 mm−1 m−3). The DSD gamma parameters exhibited variability based on geographical location and precipitation type, as shown in other global studies by [11,43,61]. However, they provide unequivocal proof that the µ parameter exhibits the most significant variations among locations (from −2 to 8.37 from the studies mentioned above), hence affirming the considerable variability in the DSD shape, as µ dictates the spectrum’s narrowness and width [62].
The normalized standard deviation of the mass spectrum (σM) in relation to Dm against µ facilitates the assessment of the DSD shape in comparison to the predicted gamma distribution over several sites [11,62] (Figure 3a). These results illustrate that the scaled gamma functions accurately represent the normalized measured drop size distribution across all disdrometer stations. The gamma function might represent the average form of the DSD in Mexico City.
Regarding the gamma parameters from all stations, Figure 3b illustrates a significant correlation with the mean values of logNw and Do [11,33,61]. The inverse relationship between parameters with negative slopes is clearly identified, wherein the reduction of logNw is due to the positive deviation of Do. This behavior is intimately associated with raindrop formation [46]. The development of raindrops in cold/warm rain depends on the expansion of small particles by collision, aggregation, or coalescence processes, resulting in a low total concentration of drops (logNw) paired with a slightly larger mean drop diameter (Do) or vice versa.
Figure 4 illustrates the spatial distribution of three DSD gamma parameters logNw, Do, and µ modeled for Mexico City based on the interpolation of data from the three distinct analysis periods, the complete period (left panels), summer (middle panels), and winter (right panels). A clear spatial variation in parameters is identified. This aligns with findings by other studies that have similarly documented the regional variability in DSD characteristics [2,23,58,59]. The extent of variance in DSD differs globally; however, disparities are consistently observed. For instance, ref. [59] demonstrated on a smaller scale (0.65–1.7 km) that the values varied greatly, with logNw at 0.92, Dm at 1.39, and µ at 3.5 among stations on Wallops Island, VA, USA.
In all three periods of analysis, the largest logNw values are recorded in the southwestern mountainous area, while the Do values present minimal spatial variation, with the greatest values recorded in the northeastern part of the urban area. This is particularly clear for the results of the complete period.
In the case of the spatial variability in µ, a defined spatial pattern with regard to mountainous or flat urban regions is not identified. The parameter µ, as previously discussed, is closely associated with the shape of the DSD, indicating variations in raindrop concentration (logNw). Ref. [62] identified an exponential growth tendency between the two parameters. Figure 4a indicates a subtle upward trend in µ as the logNw increases, albeit it is not distinctly pronounced.
The spatial characteristics of the Nw-Do relationship consistently maintain the previously established inverse correlation throughout all investigated periods. The values of logNw and Do adhere to the topographic gradient (refer to Figure 1), with logNw diminishing from the mountainous region to the flat urban area. Similarly, Do experiences a modest increase, with the largest values observed in the flat urban area. A question may emerge regarding the rationale behind the flat urban area exhibiting this condition. This behavior may be associated with topographic factors and average annual precipitation (see detail in Figure 1).
Comparing average values of logNw and the Do in the flat urban and mountainous regions of Mexico City, the results show that for the flat urban area logNw (3.7032 mm−1 m−3) is lower than that registered in the mountainous region (3.8465 mm−1 m−3), while Do (1.0275 mm) is slightly larger than in the mountainous region (0.9853 mm). A larger concentration of small drops and a lower concentration of midsize drops in mountainous regions (see Figure 2) may account for the lower mean Do value in these areas compared to the flat urban area.
Topographic influences predominantly govern the spatial distribution of annual precipitation over Mexico City (see greyscale lines in Figure 1). Precipitation in mountainous regions may be twice as abundant as in the flat urban region [63]; however, storms tend to be more severe in the urban area, potentially due to elevated temperatures of urban surfaces (albedo) and other urbanization effects [35,64,65]. The occurrence of the most severe rainfall is influenced by convective activity, as seen in the urban area of Mexico City, where we observed larger drops sizes and reduced drop concentrations.
The relationship between topography and DSD remains unknown, with little research dedicated to this topic. Some researchers have found that the terrain elevation has a big effect on the structure of the rain and, in turn, on the variations in the DSD parameters across space [18,55,66,67].
Ref. [66] identified a greater number of big drops in orographic rain compared to non-orographic rain in the Indian peninsula. Orography enhances precipitation mostly to convective processes on hillslopes that elevate moisture, resulting in numerous short-lived showers on summits. In southern France, ref. [67] noted that the reduced descent time of droplets from clouds over the mountains results in a higher prevalence of small raindrops and diminished characteristic raindrop diameters; hence, the coalescence process is less significant over this region.
When it comes to mountain effects, similar results have been seen in China’s Tianshan Mountain. The summit region (1941.8 m.a.s.l.) has higher values of logNw and a smaller average diameter size (Dm) than the foot region (935 m.a.s.l.) [55]. The minimal altitude variation (only 200 m between urban and mountain zones) in Beijing may have caused the observed contrary behavior [18].
Ref. [52], in their examination of DSD fluctuations, discussed the impact of evaporation on Do values, noting that evaporation reduces the quantity of small drops, thus increasing Do. Furthermore, in addition to the aforementioned effects, evaporation may also be regarded as a contributing element in Mexico City. The flat urban area has larger average Do values, and the lower troposphere in this area is comparatively drier than in the mountainous region, resulting in enhanced convective effects that promote this condition.
These results indicate that the geographic variation in DSD features from the disdrometer network data in Mexico City is significantly influenced by topography, which affects the distribution of rainfall in the city.
The spatial behavior of DSD parameters estimated over the entire period does not exhibit substantial variations compared to those derived during the summer period, as illustrated in Figure 4b,c. During the winter period: (i) the range of values across stations increases; (ii) the Do values are lower than in summer, resulting in an elevation of logNw, particularly in the southern mountainous region; and (iii) the range of µ values shifts to higher values.
The regional variations in the average seasonal DSDs compared to those calculated for the complete period are attributable to distinct rainfall formation processes occurring in each season, together with the prevailing type of precipitation [60]. During the winter period in Mexico City, precipitation primarily results from cold fronts, leading to a lighter and more spatially uniform rainfall intensity compared to the summer, which is characterized by convective rain.
Considering this, the following relationships will be employed to compare DSD behavior in Mexico City with other studies: summer convective precipitation and winter stratiform precipitation. Numerous authors have demonstrated that convective rain has a higher concentration of elevated values of Do and, subsequently, reduced logNw, in comparison to stratiform precipitation [11,53,60,61,68]. Nonetheless, these relationships are not general; contrary behavior is observed in certain regions [9,52], while [13] identified elevated values for both parameters in convective rain compared to stratiform rain.
In convective rain, vigorous updrafts transport small droplets to elevated altitudes, subsequently allowing medium droplets to develop from these smaller ones. The hydrometeor development process and evaporation effects on certain droplets during descent result in reduced precipitation of small droplets during heavy rain (as summarized by [61], leading to an increase in drop diameter [69].
This corroborates that summer rainfall in Mexico City is linked to a higher prevalence of larger droplets with a more uniform and sloping DSD drop size distribution.

3.2. DSD Variability Due to Rain Rates

Recent studies indicate that DSD parameters fluctuate with rain rate, exhibiting greater values for convective rain and lesser values for stratiform rain, whereas the DSD transitions towards bigger diameters as rain rate escalates [24,32,70]. Figure 5 illustrates the average DSD results in Mexico City, derived from six distinct rain rate classifications and the dataset for the complete analysis period.
The analysis reveals that for the initial two categories (R < 2 mm/h and 2 mm/h ≤ R < 20 mm/h), the average drop size distribution (DSD) exhibits a narrow shape, signifying that smaller droplets predominantly contribute to the overall number concentration. In rain rate categories with larger values (20 mm/h ≤ R < 40 mm/h; 40 mm/h ≤ R < 60 mm/h; 60 mm/h ≤ R < 100 mm/h; R ≥ 100 mm/h), the distribution of drop sizes (DSD) exhibits greater homogeneity [71], characterized by a broader spectral width and reduced slope [37,60]. This is attributed to an increase in the number of bigger drops, as indicated by [37].
Furthermore, a maximum drop concentration is evident across all rain rates for diameters less than 1 mm, as demonstrated by the results using the complete dataset (Figure 2a). A gradual and uniform rise in drop concentration is observed for greater diameters across most of the rain rate categories, especially for those representing more severe precipitation values, R ≥ 20 mm/h. This outcome aligns with findings of refs [2,53,60].
Research indicates that a rise in rain rate correlates with a diminished prevalence of small raindrops, as observed in studies of precipitation in tropical regions [9,52,72]. Overall, precipitation in Mexico City indicates that, for all analyzed diameters, there is a rise in drop concentration proportional to the rain rate. This aligns with findings reported by prior studies in various global areas [60,73,74,75]. However, ref. [61] only identified this condition for medium and large raindrops on two islands in the Western Pacific.
Figure 6 illustrates the values of logNw, Do, and µ for the six rain rate categories evaluated at each of the 21 disdrometer stations. The left panel of the figure indicates that across all stations, the mean values of logNw range from 2 to 4.58 mm−1 m−3, exhibiting significant variability for higher rainfall rate categories (R ≥ 20 mm/h) compared to the initial three categories. The results in the central panel depict mean values of Do, ranging from 0.8 to 6.56 mm, exhibiting more variability for rain rates over 40 mm/h. The value of Do increases with an increasing rain rate, as heavy rainfall often has a higher concentration of medium and big drops compared to smaller ones (see Figure 5) [61].
The right panel presents the data for the form parameter µ, with a value range from −1.66 to 9.48. It illustrates a pronounced decrease from low and moderate precipitation to strong rainfall, with negative values observed at specific disdrometer locations. Conversely, as the rain rate class increases, the values of Do increase, whereas µ exhibits an inverse relationship, hence elucidating the observed flatter DSD shape.
The total duration of rainfall in minutes employed for each class and disdrometer station is shown in Appendix B, Table A2.
The DSD parameters (Nw, Do, and µ) across all disdrometer locations showed higher variability as the rainfall rate increases and lower variability for low rainfall intensities. This result indicates that during severe storms with higher rain rates, these parameters shift in response to the confirmed alteration in average DSD form (slope and width), demonstrating a diverse range of drop sizes, in contrast to the prevalence of smaller diameters during light rain events.
Numerous authors have examined the distinctive variations in DSD parameters across various rain rate categories, although they have not reached universal results, particularly for number concentration (Nw) and shape (µ) parameters. Ref. [53] indicated that the absence of homogeneity among studies suggests a consistent shape of DSDs, independent of rain rate, as drop interactions rise as precipitation intensifies.
The findings of the behavior of Do in Mexico City align with most existing studies [2,10,17,37,54,61,74]. Concerning Nw, analogous results were documented by [2,17] in China; however, this parameter exhibits considerable variation globally with increasing rainfall rates [37,61]. The µ parameter exhibits a tendency similar to that identified by [17] and in contrast to the findings of [53].

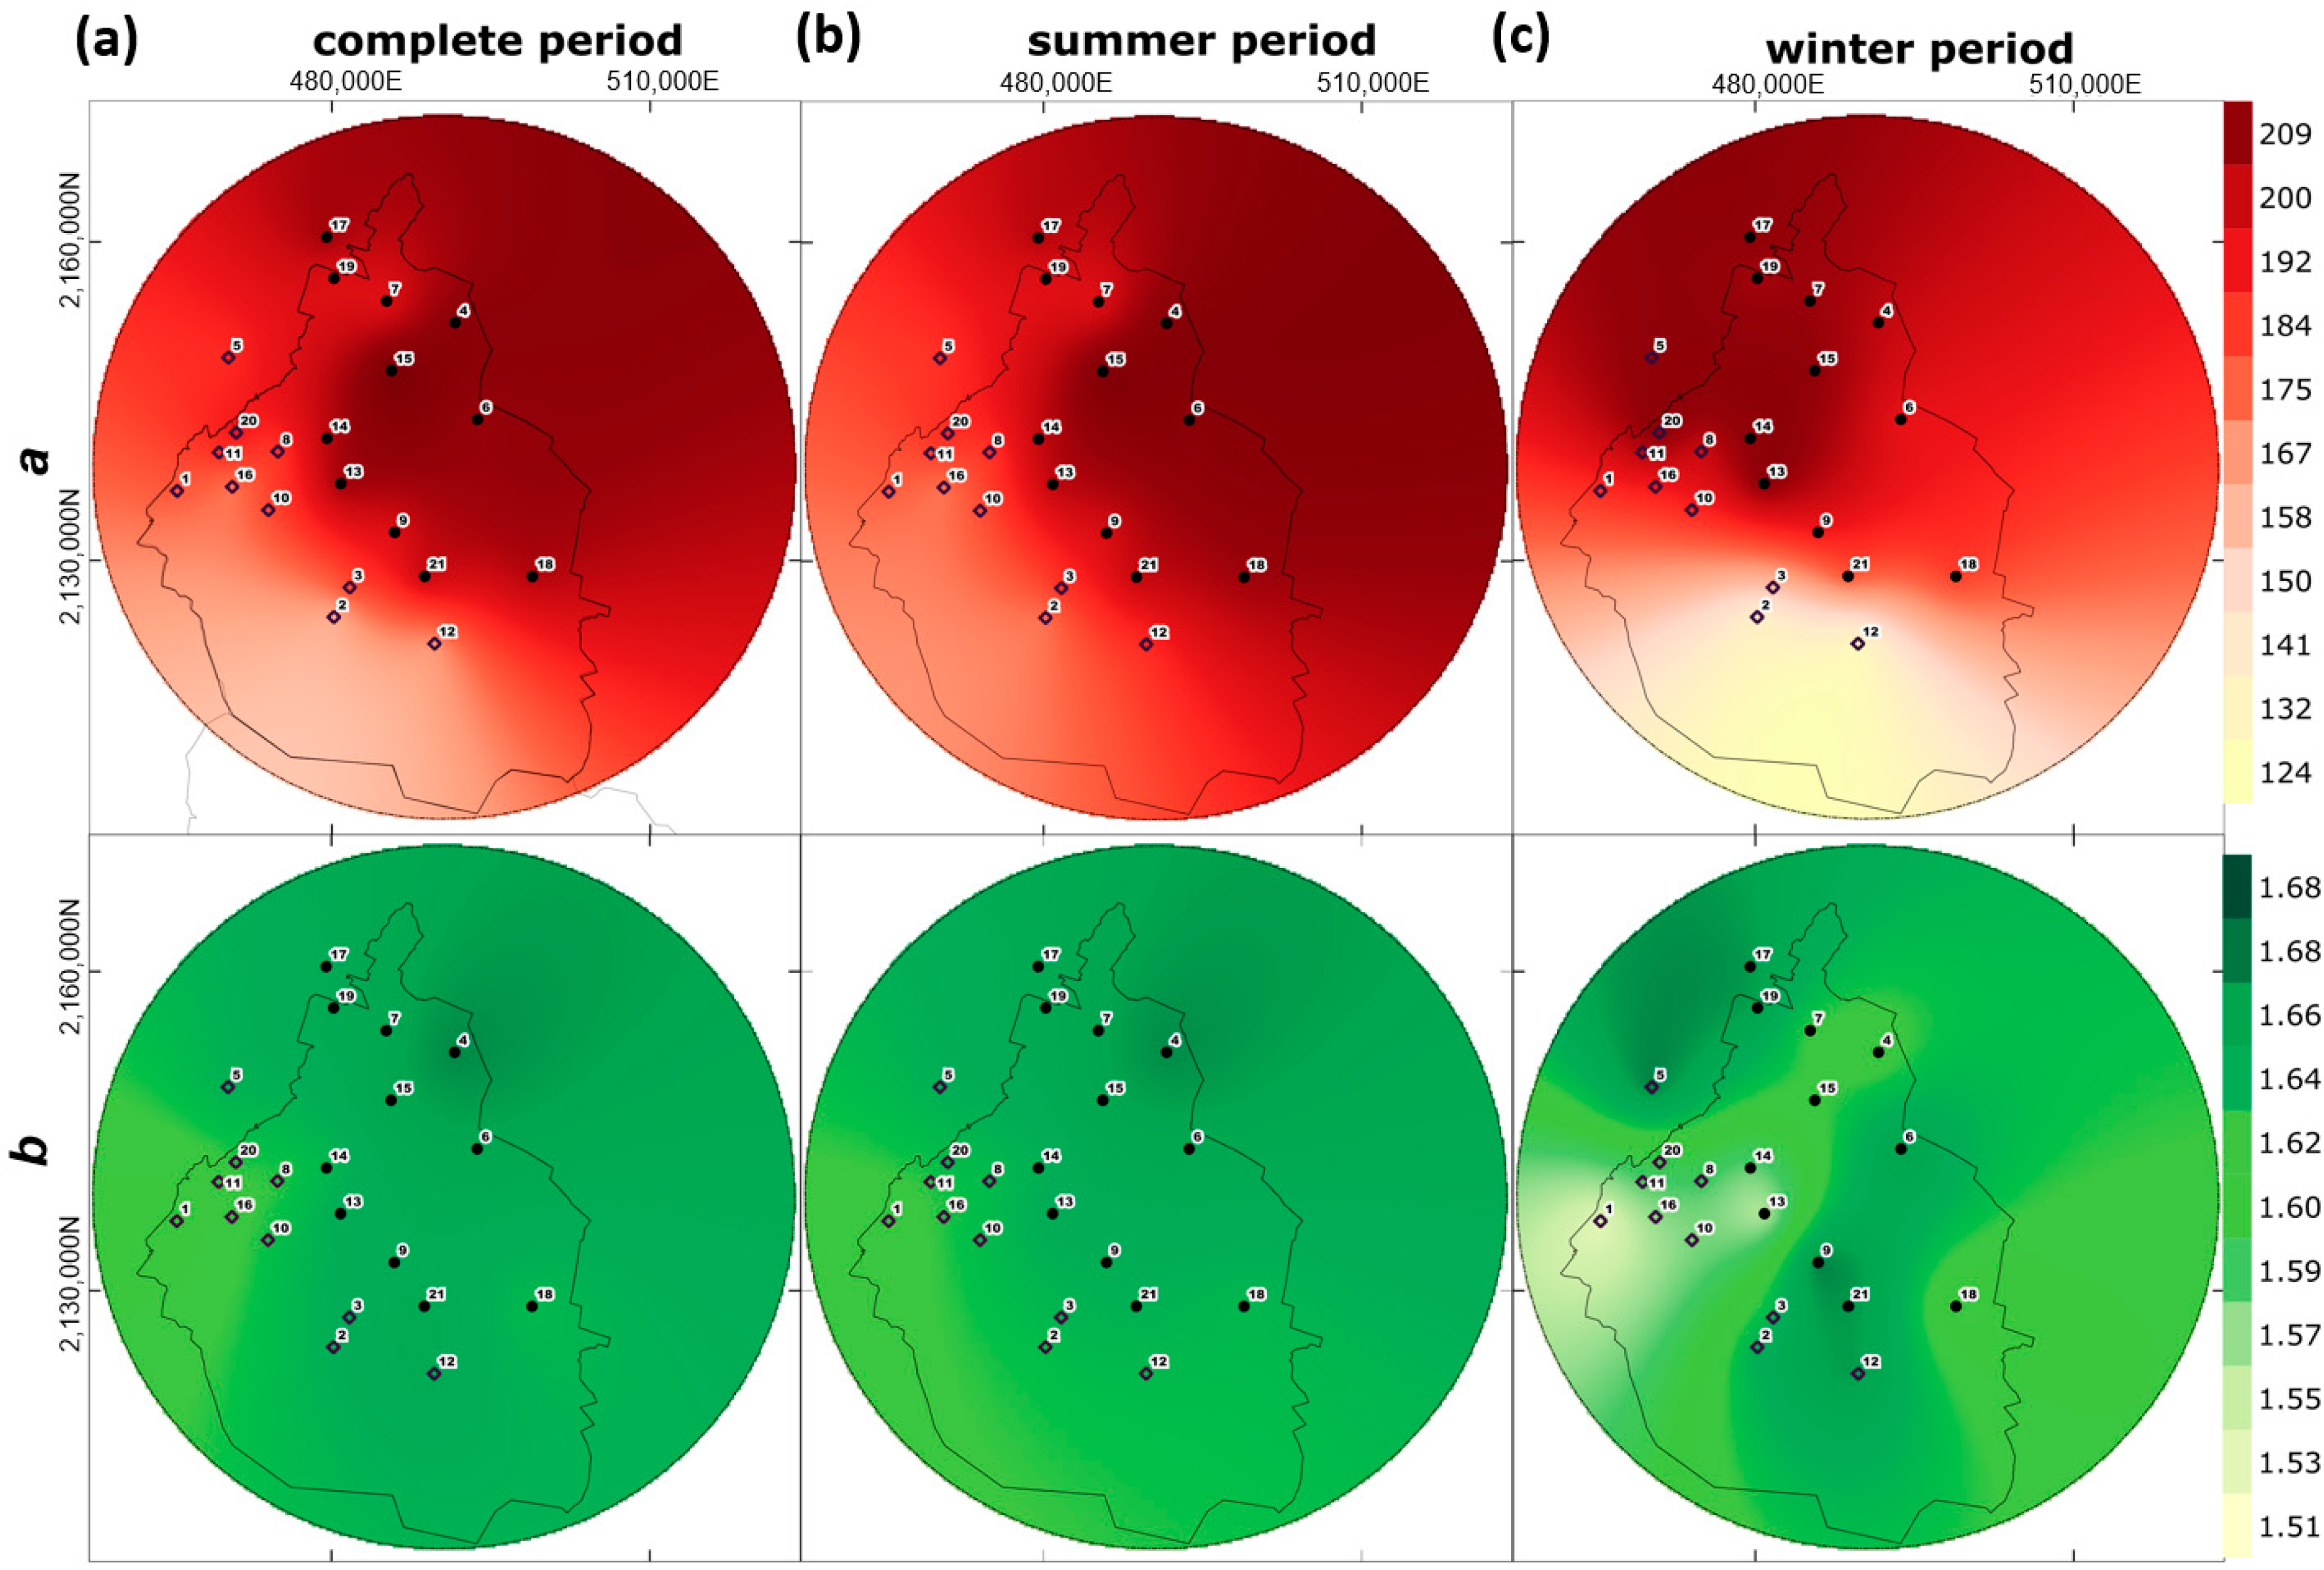
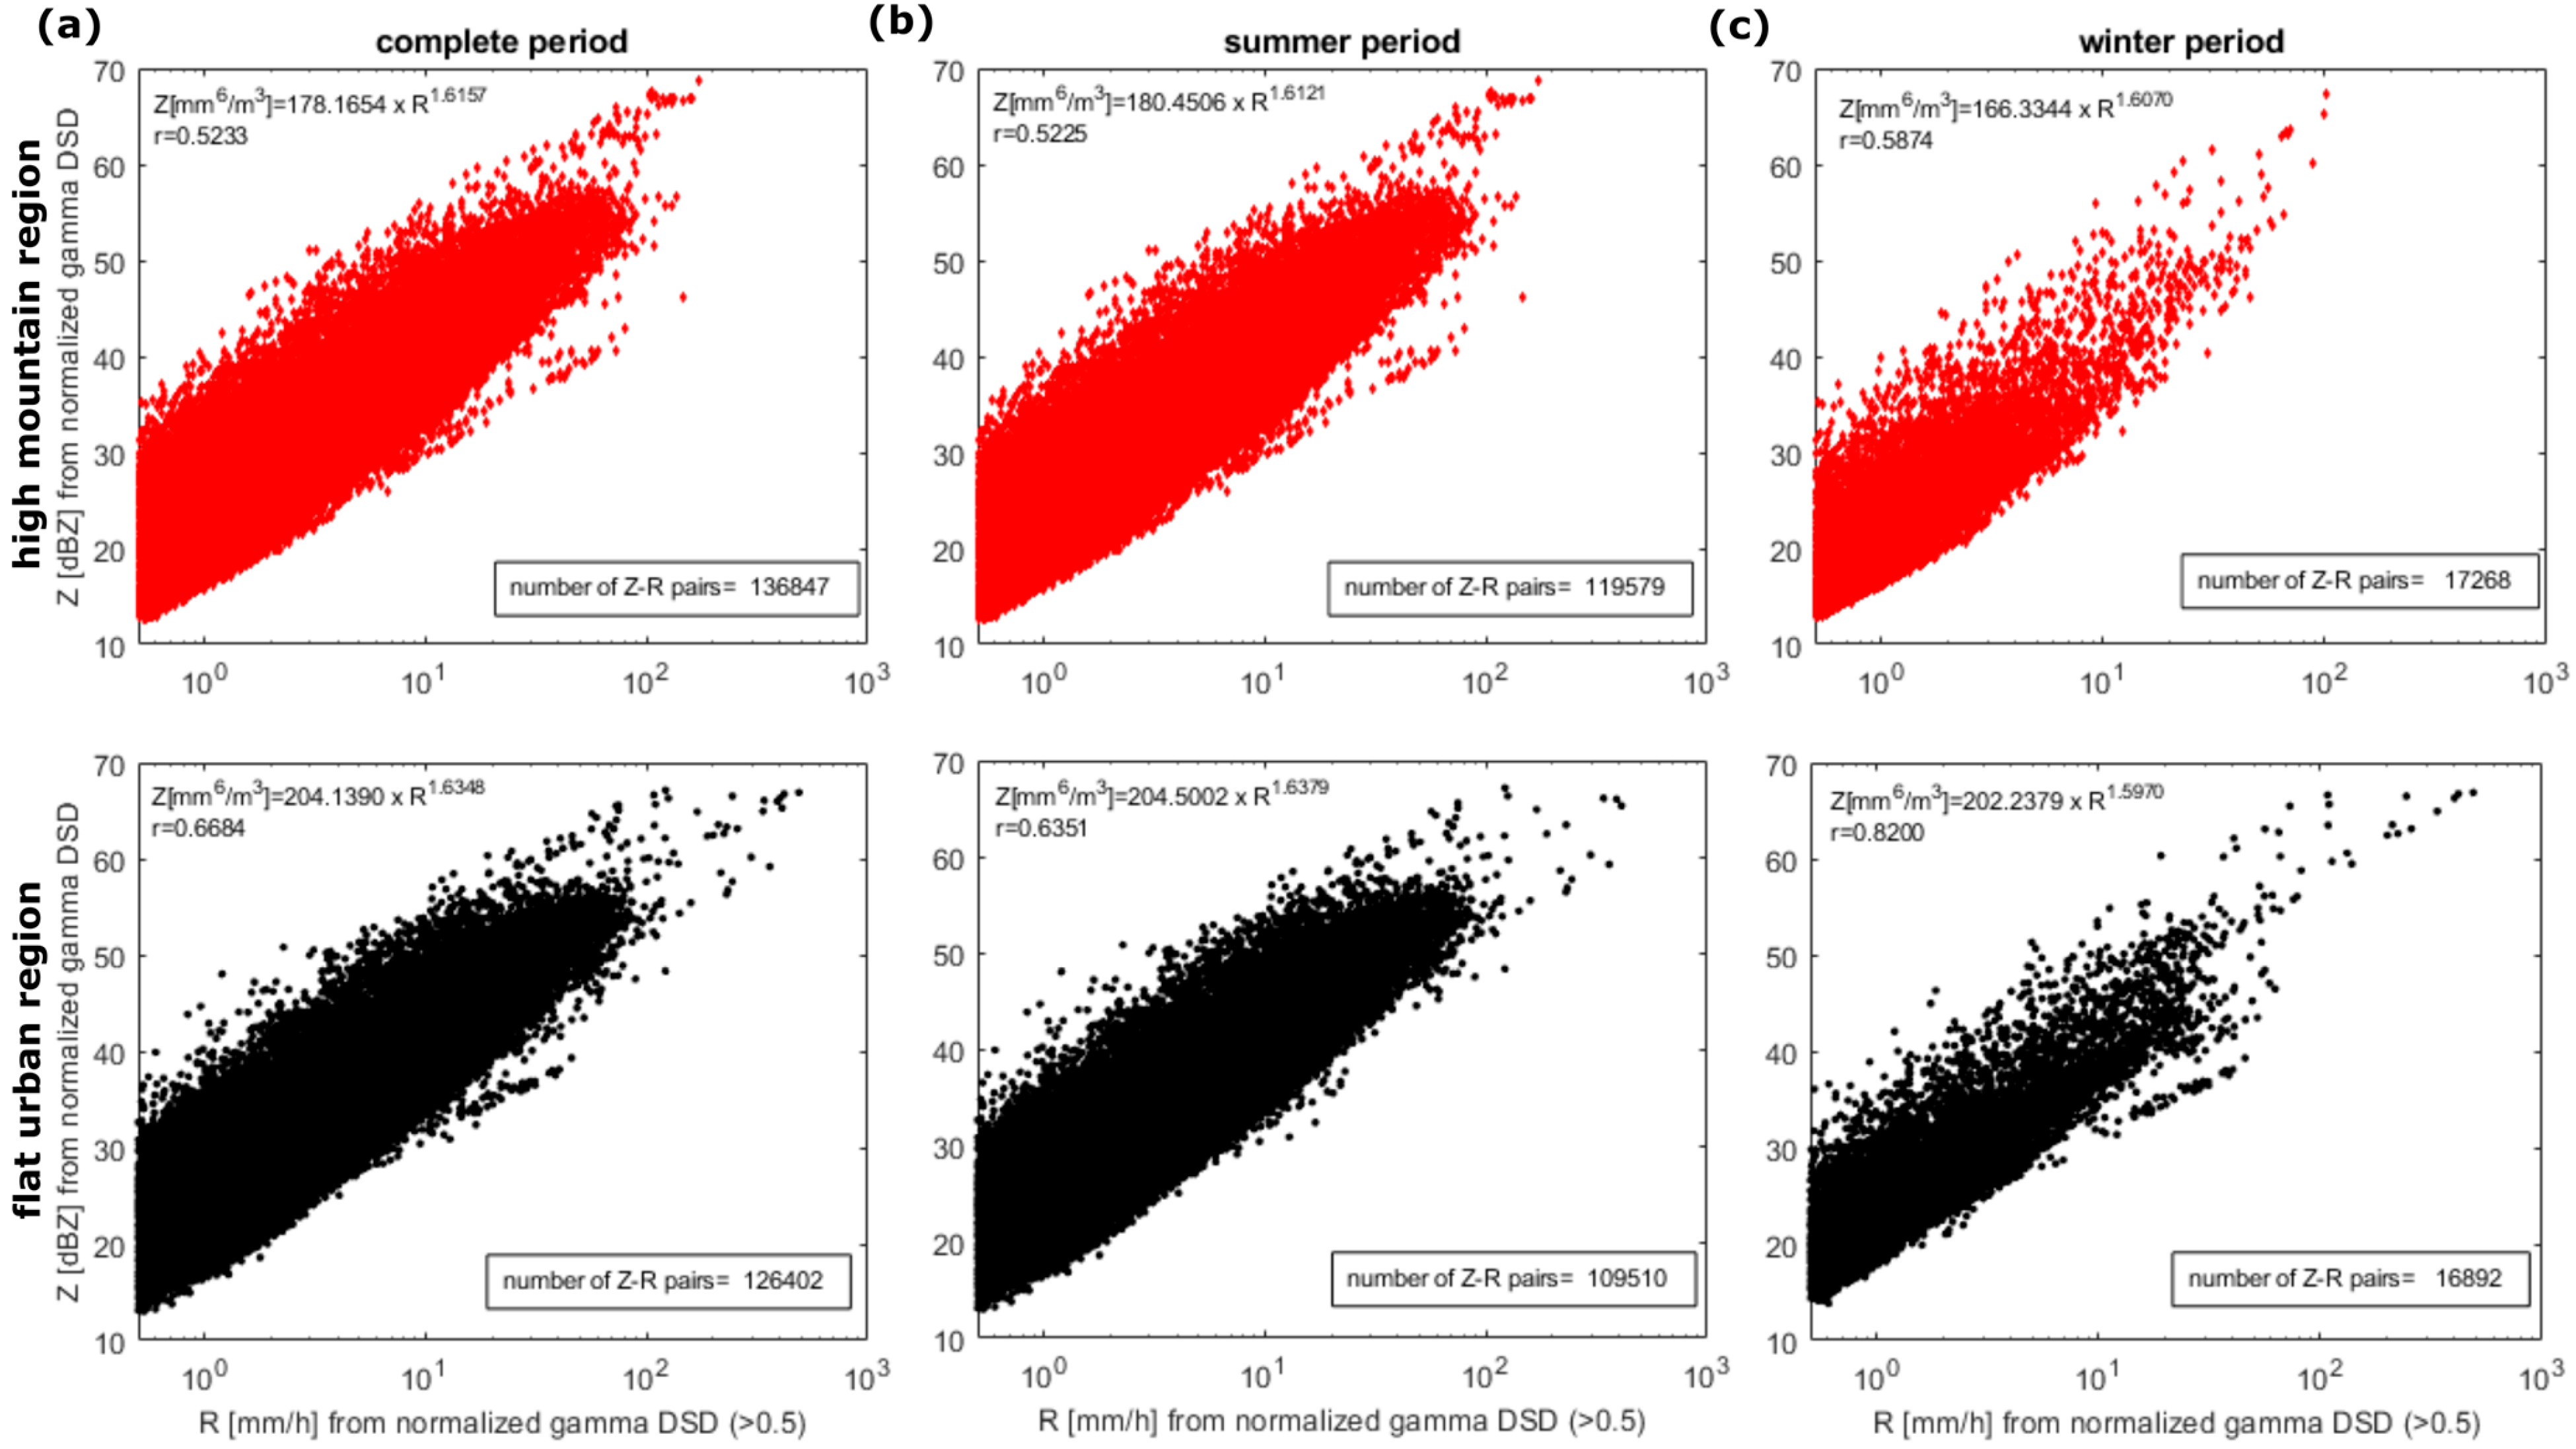
3.3. Z-R Relationship in the Mexico City Environment

The geographic variability in DSD in Mexico City results in differing adjusted Z-R relationships, characterized by different a and b coefficients, across disdrometer stations.
The coefficients a and b for the 21 disdrometer stations during the complete period are listed in Table 2. The values of coefficient a in Mexico City range from 166.72 to 215.77, while the values of b fluctuate between 1.15 and 1.67 among stations.
The Z-R relationship, with coefficients a = 200 and b = 1.6, introduced by [76], is extensively utilized in numerous weather radar networks globally, particularly for stratiform precipitation, referred to here as M1955 for comparison.
Figure 7 presents the scatter plot of coefficients a and b for the 21 disdrometer stations, together with the MP1955 values (represented by *) and their estimations using the complete (panel a), summer (panel b), and winter (panel c) periods.
The coefficient values demonstrate similar behavioral patterns for both the complete and summer periods. All station results approximate the M1955 value; however, a larger number of stations demonstrate a significant reduction in the a value and a marginal increase in the b value. Moreover, it is evident that the values of the coefficient a have a propensity to cluster based on topographic regions (urban and mountainous). This effect is particularly apparent during the summer, when the clustering of the points is more pronounced. Conversely, in winter, there exists a broader spectrum of values in both coefficients, resulting in greater data pair dispersion relative to the M1955 value.
Figure 8 illustrates the spatial variation in coefficients a (top panels) and b (bottom panels). This is assessed using spatial interpolation of point estimates of the coefficients for the complete (left panels), summer (middle panels), and winter (right panels) periods. Coefficient a exhibits distinct regional variability, whereas coefficient b has more spatially homogeneous values throughout Mexico City across all examined periods. The greatest geographical variation in both coefficients occurs in winter, which is characterized by less precipitation, mostly due to different rainfall-generating processes.
Throughout all examined periods, the coefficient a exhibits a trend towards lower values in the southwestern region (mountainous area), whereas larger values are observed in the flat zone (urban area). It is noteworthy that coefficient b exhibits a comparable geographical distribution in both complete and summer seasons; however, an ambiguous spatial distribution of these values is observed during winter.
This feature indicates that the fluctuation of the two coefficients is primarily associated with the joint variance of DSDs. Coefficient a indicates the size of raindrops, whereas coefficient b pertains to microphysical processes [61]. When comparing these results with the behavior of DSD parameters (described in Section 3.1), the coefficient a exhibits a spatial distribution pattern similar to Do (Pearson correlation of maps, r = 0.96) and the inverse of logNw (r = −0.98) throughout all periods (see Figure 4).
Taking into consideration the evidence of coefficient value change due to topography and seasonality, Figure 9 illustrates the Z-R relationship utilizing data from all disdrometer stations throughout each topographic group for complete (a), summer (b), and winter (c) periods.
The Z-R relationship coefficients indicate that the flat urban zone exhibits higher values, particularly for the coefficient a, compared to the high mountainous region. Particularly during the winter season, the coefficient b exhibits an inverse relationship between urban and mountainous regions, but with minimal differences. The summer period, characterized by increased convective activity, exhibits values comparable to those for the complete period. The winter season has lower coefficients than the summer season across all regions.
The Z-R relationship coefficients for the flat urban region are generally similar to those reported by M1955, exhibiting marginally elevated a and b values over all assessed periods. Nonetheless, values recorded in the mountainous region exhibit considerable disparities with M1955 over all examined periods. These results indicate that both coefficients might vary regarding the topographic gradient within Mexico City. This indicates the need for a regionalization of these coefficients within the metropolis.
The coefficient values for the complete and summer periods are comparable to those identified in the preliminary assessment for Mexico City, utilizing data from nine disdrometers [31]. Nonetheless, during winter, they observed elevated coefficient values compared to summer, contrary to the findings presented here; this discrepancy may be attributed to a limited investigation period and the quantity of stations evaluated.
Previous studies have concentrated on examining these characteristics through local or regional calibration, demonstrating clear spatial, altitudinal, and temporal variability [37]. The coefficients a and b can fluctuate significantly throughout various global regions, with a ranging from 16 to 900 and b from 0.7 to 2.9, as documented by [77,78,79].
Refs [72,80] examined various cities in Brazil and identified the following overall coefficients: a = 176.5 and b = 1.29 for Maceió, a = 288.5 and b = 1.5 for Cascavel, and a = 236 and b = 1.5 for Curitiba. Refs [53,61,81] demonstrated significant variability in coefficients for tropical rain, influenced by geographical location, particularly for coefficient a (a = 61.75–368 and b = 1.30–1.61), through their assessments of Taiwan, Palao, Singapore, and Dakar, respectively.
Ref. [68], using [77,79], indicated that the majority of a and b values (75%) often fall within the ranges of 150 to 550 and 1.19 to 1.7, respectively. The coefficients derived in this study for two regions of Mexico City align with those documented in the literature. This is the first study employing a vast network of 21 disdrometers in an urban setting.

4. Conclusions

This study utilized an extensive operational disdrometer network with high spatio-temporal resolution in Mexico City to investigate, for the first time, changes in the local drop size distribution (DSD) attributable to seasonal fluctuations, rainfall rates, and topography regions (flat urban and high mountainous) within the urban environment.
The results indicated that in Mexico City, the DSD modeling employing the normalized gamma distribution provides an adequate fit, regardless of the disdrometer location or season being investigated. Nonetheless, regional heterogeneity in DSD parameters in flat urban and mountainous areas was observed. Additionally, it was noted that during the winter season, the DSD presents a less uniform distribution given by its steeper slope. The findings indicate that the diversity in DSD features is influenced by topographic and climatic conditions, arising from distinct precipitation-generating processes within the metropolis.
An inverse correlation between the parameters Nw and Do was identified, which geographically aligns with the topographic gradient. On average, the storms that descend in Mexico City’s flat urban zone have marginally larger raindrop diameters than those that occur in the mountainous area. This is attributed to the increased convective activity in the summer within the flat urban area. The winter season features higher concentrations of smaller raindrops, resulting from the precipitation due to the incidence of cold fronts.
For severe rain intensities (R > 20 mm/h), a more uniform and flatter DSD shape was registered, along with increased dispersion of DSD parameter values among disdrometer sites, particularly for intensities larger than R > 60 mm/h. An increase in Do values and a reduction in µ with ascending rain rate classes were also noted, attributed to the influence of severe convective activity and significant variation in DSD form, respectively.
The heterogeneity in the features of the DSDs leads to the clear identification of a geographic variability in the coefficients (a and b) of the Z-R relationship in Mexico City. Large coefficient values are observed in the flat urban zone, where coefficient a exhibits an inverse correlation with the spatial distribution of logNw and a direct correlation with Do. The greater geographical variability in coefficients was registered during the winter season, leading to diminished total coefficient values across all regions. Furthermore, across all examined periods, results suggest the necessity for the regionalization of Z-R coefficients inside the city.
Results underscore the significance of investigating local DSD characteristics and their impact on the spatial–temporal variability in the Z-R relationship in Mexico City and elsewhere. This implies that urban settings exhibit considerable variability in the Z-R relationship, which must be acknowledged to enhance radar quantitative precipitation estimations.

Author Contributions

R.K.M.-K., writing—original draft preparation; conceptualization and methodology were carried out by R.K.M.-K., M.A.R.-R. and A.P.-A. All authors have read and agreed to the published version of the manuscript.

Funding

This research received no external funding.

Institutional Review Board Statement

Not applicable.

Informed Consent Statement

Not applicable.

Data Availability Statement

Basic dataset available in a publicly accessible repository available at Zenodo link: https://doi.org/10.5281/zenodo.15122647 (accessed on 2 April 2025).

Acknowledgments

The primary author expresses gratitude to the Secretary of Science, Humanities, Technology, and Innovation (SECIHTI), previously known as the National Council of Science and Technology (CONACYT), for the PhD scholarship that facilitated this research. SECIHTI did not participate in the decision to submit the paper for publication. All authors express gratitude to the technical staff of the Hydrological Observatory of UNAM’s Institute of Engineering (OH-IIUNAM) for their network maintenance and for providing disdrometer data: Jorge Magos, Jorge Blanco, and Juan Sánchez.

Conflicts of Interest

The authors declare no conflicts of interest.

Abbreviations

The following abbreviations are used in this manuscript:
DSDDrop size distribution
QPEQuantitative precipitation estimation
RRain rate
ZRadar reflectivity

Appendix A

Appendix A presents the main technical characteristics of the disdrometer used in this study.
The disdrometer network of the National Autonomous University of Mexico, named Hydrological Observatory of Mexico City (OH-IIUNAM, its Spanish acronym), is composed of OTT Parsivel laser-optical disdrometer type. Figure A1 shows an example of a disdrometer station in Mexico City. For further details on station architecture, see refs [35,82].
This laser-optical disdrometer can simultaneously measure the size and falling velocity of particles by attenuating the signal when a hydrometeor crosses the laser beam of a small cross-sectional surface, with a sampling area of 54 cm2 (18 cm in length and 3 cm in width). The particle size and falling velocity are categorized into 32 bins. The bins exhibit non-uniformity, able to measure particles ranging from 0.062 to 24.5 mm in size, with fall velocities in the range 0.05 to 20.8 m/s. The primary variables exhibit sensitivity to the following value range: raindrop diameter: 0.2–25 mm, rain rate: 0.001–1200 mm/h, and radar reflectivity: −9.999–99.999 dBz [83]. The disdrometer processor computes N(D) and estimates various integral rainfall variables, such as rain rate, kinetic energy of raindrops, radar reflectivity, and precipitation types (e.g., rain, snow, and hail) based on particle diameter and velocity class [84].
Figure A1. Example of the laser-optical disdrometer Parsivel2 (OTT Hydromet) used in this study.
Atmosphere 16 00585 g0a1

Appendix B

Appendix B presents details of the data used in this study.
Table A1. Summary of data evaluated from 21 disdrometer stations.
Data Period: June 2018–June 2019
Station NameRainy MinutesRainfall (mm/h)Reflectivity (dBz)
CompleteSummerWinterMeanMaxMeanMax
Acopilco32,67228,22744451.9690.4319.6956.20
Ajusco31,36526,26251031.5886.5818.4255.25
AMC25,95221,54144111.4965.2418.5354.79
Aragon20,65317,24434091.6890.9418.8354.58
BosqueReal27,50224,22432781.7876.2118.6655.45
CCHOTE22,32119,23130901.7384.6318.9654.54
CCHVALLEJO22,12418,72434001.6772.9919.6753.22
Centenario26,51023,30232081.95128.6219.8756.11
Coapa22,82219,69431281.4884.8017.8154.05
Contreras27,24023,86833722.0478.9220.1854.60
Cuajimalpa30,37926,72236571.88109.6419.3754.85
Cuauhtenco25,24520,35148941.4896.7418.1954.62
IIUNAM25,71222,66330492.09104.1819.4555.63
PREPA824,39321,35330401.9585.4720.0255.44
SACMEX22,49820,34121571.7473.2819.3954.48
SanBartolo29,09925,16239371.9497.0719.7255.21
Tlalnepantla23,39319,62537681.77153.3119.7755.11
Tulyehualco20,19016,88833021.50113.9319.0455.04
UAMAZC22,74619,41333331.86105.6619.9454.65
VHermosa29,87226,28535871.83137.4618.2058.81
Xochimilco21,91617,89840181.7584.0019.0453.54
1/mean 2534,604 1459,018 175,586 11.77 296.20 219.18 255.05 2
%10085.8614.14
1 refers to the summatory of values; 2 refers to the mean value.
Table A2. Summary of rainy minutes for the six rain rate classes for 21 disdrometer stations.
Data Period: June 2018–June 2019
Station Name2 > R2 ≤ R < 2020 ≤ R < 4040 ≤ R < 6060 ≤ R < 100100 ≤ R
Acopilco24,517772134177160
Ajusco25,423558625571219
AMC21,25244951594420
Aragon16,784358421251139
BosqueReal21,800530129982191
CCHOTE18,174380326456231
CCHVALLEJO17,50143512214650
Centenario20,139594634959143
Coapa19,096349617444120
Contreras20,443632137178243
Cuajimalpa23,464651430279191
Cuauhtenco20,549441921041206
IIUNAM20,192495942285468
PREPA818,6845298304712610
SACMEX17,81043942434290
SanBartolo22,234650426551396
Tlalnepantla18,57644782884173
Tulyehualco16,01339461873752
UAMAZC17,737468423867191
VHermosa23,450606326769212
Xochimilco17,2594233347531410
Mean20,052.245052.19272.2959.2417.813.57

References

  1. García-Ruiz, J.M.; Beguería, S.; Lana-Renault, N.; Nadal-Romero, E.; Cerdà, A. Ongoing and Emerging Questions in Water Erosion Studies. Land Degrad. Dev. 2017, 28, 5–21. [Google Scholar] [CrossRef]
  2. Pu, K.; Liu, X.; Wu, Y.; Hu, S.; Liu, L.; Gao, T. A Comparison Study of Raindrop Size Distribution among Five Sites at the Urban Scale during the East Asian Rainy Season. J. Hydrol. 2020, 590, 125500. [Google Scholar] [CrossRef]
  3. Serio, M.A.; Carollo, F.G.; Ferro, V. Raindrop Size Distribution and Terminal Velocity for Rainfall Erosivity Studies. A Review. J. Hydrol. 2019, 576, 210–228. [Google Scholar] [CrossRef]
  4. Ma, R.; Hu, F.; Xu, C.; Liu, J.; Zhao, S. Response of Soil Aggregate Stability and Splash Erosion to Different Breakdown Mechanisms along Natural Vegetation Restoration. Catena 2022, 208, 105775. [Google Scholar] [CrossRef]
  5. Zambon, N.; Johannsen, L.L.; Strauss, P.; Dostal, T.; Zumr, D.; Neumann, M.; Cochrane, T.A.; Klik, A. Rainfall Parameters Affecting Splash Erosion under Natural Conditions. Appl. Sci. 2020, 10, 4103. [Google Scholar] [CrossRef]
  6. Uijlenhoet, R.; Stricker, J.N.M. A Consistent Rainfall Parameterization Based on the Exponential Raindrop Size Distribution. J. Hydrol. 1999, 218, 101–127. [Google Scholar] [CrossRef]
  7. Hou, A.Y.; Kakar, R.K.; Neeck, S.; Azarbarzin, A.A.; Kummerow, C.D.; Kojima, M.; Oki, R.; Nakamura, K.; Iguchi, T. The Global Precipitation Measurement Mission. Bull. Am. Meteorol. Soc. 2014, 95, 701–722. [Google Scholar] [CrossRef]
  8. Adirosi, E.; Roberto, N.; Montopoli, M.; Gorgucci, E.; Baldini, L. Influence of Disdrometer Type on Weather Radar Algorithms from Measured DSD: Application to Italian Climatology. Atmosphere 2018, 9, 360. [Google Scholar] [CrossRef]
  9. Tokay, A.; Short, D.A. Evidence from Tropical Raindrop Spectra of the Origin of Rain from Stratiform versus Convective Clouds. J. Appl. Meteorol. 1996, 35, 355–371. [Google Scholar] [CrossRef]
  10. Testud, J.; Oury, S.; Black, R.A.; Amayenc, P.; Dou, X. The Concept of “Normalized” Distribution to Describe Raindrop Spectra: A Tool for Cloud Physics and Cloud Remote Sensing. J. Appl. Meteorol. 2001, 40, 1118–1140. [Google Scholar] [CrossRef]
  11. Bringi, V.N.; Chandrasekar, V.; Hubbert, J.; Gorgucci, E.; Randeu, W.L.; Schoenhuber, M. Raindrop Size Distribution in Different Climatic Regimes from Disdrometer and Dual-Polarized Radar Analysis. J. Atmos. Sci. 2003, 60, 354–365. [Google Scholar] [CrossRef]
  12. Wen, L.; Zhao, K.; Zhang, G.; Liu, S.; Chen, G. Impacts of Instrument Limitations on Estimated Raindrop Size Distribution, Radar Parameters, and Model Microphysics during Mei-Yu Season in East China. J. Atmos. Ocean. Technol. 2017, 34, 1021–1037. [Google Scholar] [CrossRef]
  13. Dolan, B.; Fuchs, B.; Rutledge, S.A.; Barnes, E.A.; Thompson, E.J. Primary Modes of Global Drop Size Distributions. J. Atmos. Sci. 2018, 75, 1453–1476. [Google Scholar] [CrossRef]
  14. Seela, B.K.; Janapati, J.; Lin, P.L.; Wang, P.K.; Lee, M.T. Raindrop Size Distribution Characteristics of Summer and Winter Season Rainfall Over North Taiwan. J. Geophys. Res. Atmos. 2018, 123, 11602–11624. [Google Scholar] [CrossRef]
  15. Ji, L.; Chen, H.; Li, L.; Chen, B.; Xiao, X.; Chen, M.; Zhang, G. Raindrop Size Distributions and Rain Characteristics Observed by a PARSIVEL Disdrometer in Beijing, Northern China. Remote Sens. 2019, 11, 1479. [Google Scholar] [CrossRef]
  16. Wu, Z.; Zhang, Y.; Zhang, L.; Lei, H.; Xie, Y.; Wen, L.; Yang, J. Characteristics of Summer Season Raindrop Size Distribution in Three Typical Regions of Western Pacific. J. Geophys. Res. Atmos. 2019, 124, 4054–4073. [Google Scholar] [CrossRef]
  17. Ma, Y.; Ni, G.; Chandra, C.V.; Tian, F.; Chen, H. Statistical Characteristics of Raindrop Size Distribution during Rainy Seasons in the Beijing Urban Area and Implications for Radar Rainfall Estimation. Hydrol. Earth Syst. Sci. 2019, 23, 4153–4170. [Google Scholar] [CrossRef]
  18. Zhang, Z.; Li, H.; Li, D.; Qi, Y.; Zhang, Z.; Li, H.; Li, D.; Qi, Y. Spatial Variability of Raindrop Size Distribution at Beijing City Scale and Its Implications for Polarimetric Radar QPE. Remote Sens. 2023, 15, 3964. [Google Scholar] [CrossRef]
  19. Tang, Q.; Xiao, H.; Guo, C.; Feng, L. Characteristics of the Raindrop Size Distributions and Their Retrieved Polarimetric Radar Parameters in Northern and Southern China. Atmos. Res. 2014, 135–136, 59–75. [Google Scholar] [CrossRef]
  20. Wang, D.; Chen, S.; Kong, Y.; Gu, X.; Li, X.; Nan, X.; Yue, S.; Shen, H. Raindrop Size Distribution Characteristics for Typhoons over the Coast in Eastern China. Atmosphere 2024, 15, 951. [Google Scholar] [CrossRef]
  21. Hachani, S.; Boudevillain, B.; Delrieu, G.; Bargaoui, Z. Drop Size Distribution Climatology in Cévennes-Vivarais Region, France. Atmosphere 2017, 8, 233. [Google Scholar] [CrossRef]
  22. Han, J.Y.; Baik, J.J.; Lee, H. Urban Impacts on Precipitation. Asia-Pac. J. Atmos. Sci. 2014, 50, 17–30. [Google Scholar] [CrossRef]
  23. Jaffrain, J.; Studzinski, A.; Berne, A. A Network of Disdrometers to Quantify the Small-Scale Variability of the Raindrop Size Distribution. Water Resour. Res. 2011, 47. [Google Scholar] [CrossRef]
  24. Han, Y.; Guo, J.; Yun, Y.; Li, J.; Guo, X.; Lv, Y.; Wang, D.; Li, L.; Zhang, Y. Regional Variability of Summertime Raindrop Size Distribution from a Network of Disdrometers in Beijing. Atmos. Res. 2021, 257, 105591. [Google Scholar] [CrossRef]
  25. Cristiano, E.; Ten Veldhuis, M.C.; Van De Giesen, N. Spatial and Temporal Variability of Rainfall and Their Effects on Hydrological Response in Urban Areas—A Review. Hydrol. Earth Syst. Sci. 2017, 21, 3859–3878. [Google Scholar] [CrossRef]
  26. Maier, R.; Krebs, G.; Pichler, M.; Muschalla, D.; Gruber, G. Spatial Rainfall Variability in Urban Environments—High-Density Precipitation Measurements on a City-Scale. Water 2020, 12, 1157. [Google Scholar] [CrossRef]
  27. López López, M.R.; Pedrozo-Acuña, A.; Severiano Covarrubias, M.L. Evaluation of ECMWF’s Forecasting System for Probabilistic Urban Flood Prediction: A Case Study in Mexico City. J. Hydroinform. 2022, 24, 38–55. [Google Scholar] [CrossRef]
  28. Jauregui, E.; Romales, E. Urban Effects on Convective Precipitation in Mexico City. Atmos. Environ. 1996, 30, 3383–3389. [Google Scholar] [CrossRef]
  29. Martinez-Lopez, B.; Quintanar, A.I.; Cabos-Narvaez, W.D.; Gay-Garcia, C.; Sein, D.V. Nonlinear Trends and Nonstationary Oscillations as Extracted From Annual Accumulated Precipitation at Mexico City. Earth Space Sci. 2018, 5, 473–485. [Google Scholar] [CrossRef]
  30. Ochoa, C.A.; Quintanar, A.I.; Raga, G.B.; Baumgardner, D. Changes in Intense Precipitation Events in Mexico City. J. Hydrometeorol. 2015, 16, 1804–1820. [Google Scholar] [CrossRef]
  31. Mocva-Kurek, R.K.; Rico-Ramirez, M.A.; Pedrozo-Acuña, A. Estimation of Raindrop Size Distribution in Mexico City by a Network of Disdrometers: Implications for Z-R Relationships. In Proceedings of the 38th IAHR World Congress, Panama City, Panama, 1–6 September 2019; IAHR: Madrid, Spain, 2019. [Google Scholar]
  32. Montero-Martínez, G.; Gómez-Balvás, S.S.; García-García, F. Study of Rain Classification and the Tendency of Gamma DSD Parameterizations in Mexico. Atmos. Res. 2021, 252, 105431. [Google Scholar] [CrossRef]
  33. Schuur, T.J.; Ryzhkov, A.V.; Clabo, D.R. Climatological Analysis of DSDs in Oklahoma as Revealed by 2D-Video Disdrometer and Polarimetric WSR-88D. In Proceedings of the 11th Conference on Mesoscale Processes and the 32nd Conference on Radar Meteorology, Albuquerque, NM, USA, 24–29 October 2005; pp. 571–577. [Google Scholar]
  34. Jauregui, E. Heat Island Development in Mexico City. Atmos. Environ. 1997, 31, 3821–3831. [Google Scholar] [CrossRef]
  35. Pedrozo-Acuña, A.; Agustín Breña-Naranjo, J.; Soriano-Monzalvo, J.C.; Blanco-Figueroa, J.; Magos-Hernández, J.; Alejandro Sánchez-Peralta, J. The Hydrological Observatory of Mexico City (OH-IIUNAM): A Unique Setup for Hydrological Research within Large Urban Environments. In Proceedings of the EGU General Assembly 2020, Online, 4–8 May 2020. [Google Scholar]
  36. Bringi, V.N.; Chandrasekar, V. Radar Rainfall Estimation (Chapter 8). In Polarimetric Doppler Weather Radar: Principles and Applications; Cambridge University: Cambridge, UK, 2001; pp. 534–569. ISBN 9780511541094. [Google Scholar]
  37. Harikumar, R.; Sampath, S.; Sasi Kumar, V. Variation of Rain Drop Size Distribution with Rain Rate at a Few Coastal and High Altitude Stations in Southern Peninsular India. Adv. Space Res. 2010, 45, 576–586. [Google Scholar] [CrossRef]
  38. Nyssen, J.; Vandenreyken, H.; Poesen, J.; Moeyersons, J.; Deckers, J.; Haile, M.; Salles, C.; Govers, G. Rainfall Erosivity and Variability in the Northern Ethiopian Highlands. J. Hydrol. 2005, 311, 172–187. [Google Scholar] [CrossRef]
  39. Kim, H.J.; Jung, W.; Suh, S.H.; Lee, D.I.; You, C.H. The Characteristics of Raindrop Size Distribution at Windward and Leeward Side over Mountain Area. Remote Sens. 2022, 14, 2419. [Google Scholar] [CrossRef]
  40. Han, H.; Zhang, Y.; Tian, J.; Kang, X. Raindrop Size Distribution Measurements at High Altitudes in the Northeastern Tibetan Plateau during Summer. Adv. Atmos. Sci. 2023, 40, 1244–1256. [Google Scholar] [CrossRef]
  41. Mao, W.; Zhang, W.; Kou, M. Statistical Characteristics of Raindrop Size Distribution during Rainy Seasons in Complicated Mountain Terrain. Hydrol. Earth Syst. Sci. 2023, 27, 3895–3910. [Google Scholar] [CrossRef]
  42. Mallet, C.; Barthes, L. Estimation of Gamma Raindrop Size Distribution Parameters: Statistical Fluctuations and Estimation Errors. J. Atmos. Ocean. Technol. 2009, 26, 1572–1584. [Google Scholar] [CrossRef]
  43. Bringi, V.N.; Rico-Ramirez, M.A.; Thurai, M. Rainfall Estimation with an Operational Polarimetric C-Band Radar in the United Kingdom: Comparison with a Gauge Network and Error Analysis. J. Hydrometeorol. 2011, 12, 935–954. [Google Scholar] [CrossRef]
  44. Zhang, A.; Chen, C.; Wu, L. Regional Variability of Raindrop Size Distribution from a Network of Disdrometers over Complex Terrain in Southern China. Remote Sens. 2023, 15, 2678. [Google Scholar] [CrossRef]
  45. Bringi, V.N.; Chandrasekar, V. The Polarimetric Basis for Characterizing Precipitation (Chapter 7). In Polarimetric Doppler Weather Radar: Principles and Applications; Cambridge University: Cambridge, UK, 2001; pp. 378–533. ISBN 9780511541094. [Google Scholar]
  46. Ryzhkov, A.V.; Zrnic, D.S. Microphysical and Dielectric Properties of Hydrometeors. In Radar Polarimetry for Weather Observations; Springer: Cham, Switzerland, 2019; pp. 63–96. [Google Scholar]
  47. Testud, J.; Le Bouar, E.; Obligis, E.; Ali-Mehenni, M. The Rain Profiling Algorithm Applied to Polarimetric Weather Radar. J. Atmos. Ocean. Technol. 2000, 17, 332–356. [Google Scholar] [CrossRef]
  48. Ulbrich, C.W. Natural Variations in the Analytical Form of the Raindrop Size Distribution. J. Clim. Appl. Meteorol. 1983, 22, 1764–1775. [Google Scholar] [CrossRef]
  49. Marshall, J.S.; Palmer, W.M.K. The Distribution of Raindrops with Size. J. Meteorol. 1948, 5, 165–166. [Google Scholar] [CrossRef]
  50. Atlas, D.; Ulbrich, C.W. Path- and Area-Integrated Rainfall Measurement by Microwave Attenuation in the 1–3 cm Band. J. Appl. Meteorol. 1977, 16, 1322–1331. [Google Scholar] [CrossRef]
  51. Atlas, D.; Srivastava, R.C.; Sekhon, R.S. Doppler Radar Characteristics of Precipitation at Vertical Incidence. Rev. Geophys. 1973, 11, 1. [Google Scholar] [CrossRef]
  52. Atlas, D.; Ulbrich, C.W.; Marks, F.D.; Amitai, E.; Williams, C.R. Systematic Variation of Drop Size and Radar-Rainfall Relations. J. Geophys. Res. Atmos. 1999, 104, 6155–6169. [Google Scholar] [CrossRef]
  53. Nzeukou, A.; Sauvageot, H.; Ochou, A.D.; Kebe, C.M.F. Raindrop Size Distribution and Radar Parameters at Cape Verde. J. Appl. Meteorol. 2004, 43, 90–105. [Google Scholar] [CrossRef]
  54. Narayana Rao, T.; Radhakrishna, B.; Nakamura, K.; Prabhakara Rao, N. Differences in Raindrop Size Distribution from Southwest Monsoon to Northeast Monsoon at Gadanki. Q. J. R. Meteorol. Soc. 2009, 135, 1630–1637. [Google Scholar] [CrossRef]
  55. Zeng, Y.; Yang, L.; Zhou, Y.; Tong, Z.; Jiang, Y.; Chen, P. Characteristics of Orographic Raindrop Size Distribution in the Tianshan Mountains, China. Atmos. Res. 2022, 278, 106332. [Google Scholar] [CrossRef]
  56. Rainfall Intensity Classification of the National Center for Hydrology and Meteorology, Royal Government of Bhutan. Available online: https://www.nchm.gov.bt/attachment/ckfinder/userfiles/files/Rainfall%20intensity%20classification.pdf (accessed on 28 April 2025).
  57. Magaña, V.; Amador, J.A.; Medina, S.; Magaña, V.; Amador, J.A.; Medina, S. The Midsummer Drought over Mexico and Central America. J. Clim. 1999, 12, 1577–1588. [Google Scholar] [CrossRef]
  58. Lee, C.K.; Lee, G.W.; Zawadzki, I.; Kim, K.E. A Preliminary Analysis of Spatial Variability of Raindrop Size Distributions during Stratiform Rain Events. J. Appl. Meteorol. Climatol. 2009, 48, 270–283. [Google Scholar] [CrossRef]
  59. Tokay, A.; Bashor, P.G. An Experimental Study of Small-Scale Variability of Raindrop Size Distribution. J. Appl. Meteorol. Climatol. 2010, 49, 2348–2365. [Google Scholar] [CrossRef]
  60. Das, S.; Maitra, A. Characterization of Tropical Precipitation Using Drop Size Distribution and Rain Rate-Radar Reflectivity Relation. Theor. Appl. Climatol. 2018, 132, 275–286. [Google Scholar] [CrossRef]
  61. Seela, B.K.; Janapati, J.; Lin, P.; Reddy, K.K.; Shirooka, R.; Wang, P.K. A Comparison Study of Summer Season Raindrop Size Distribution Between Palau and Taiwan, Two Islands in Western Pacific. J. Geophys. Res. Atmos. 2017, 122, 11787–11805. [Google Scholar] [CrossRef]
  62. Ulbrich, C.W.; Atlas, D. Rainfall Microphysics and Radar Properties: Analysis Methods for Drop Size Spectra. J. Appl. Meteorol. 1998, 37, 912–923. [Google Scholar] [CrossRef]
  63. Méndez Antonio, B.; Magaña, V.; Caetano, E.; da Silveira, R.B.; Domínguez, R. Analysis of Daily Precipitation Based on Weather Radar Information in México City. Atmosfera 2009, 22, 299–313. [Google Scholar]
  64. Magana, V.; Pérez, J.; Méndez, M. Diagnosis and Prognosis of Extreme Precipitation Events in the Mexico City Basin. Geofis. Int. 2003, 42, 247–259. [Google Scholar] [CrossRef]
  65. Vargas, N.; Magaña, V. Climatic Risk in the Mexico City Metropolitan Area Due to Urbanization. Urban Clim. 2020, 33, 100644. [Google Scholar] [CrossRef]
  66. Harikumar, R. Orographic Effect on Tropical Rain Physics in the Asian Monsoon Region. Atmos. Sci. Lett. 2016, 17, 556–563. [Google Scholar] [CrossRef]
  67. Zwiebel, J.; Van Baelen, J.; Anquetin, S.; Pointin, Y.; Boudevillain, B. Impacts of Orography and Rain Intensity on Rainfall Structure. The Case of the HyMeX IOP7a Event. Q. J. R. Meteorol. Soc. 2016, 142, 310–319. [Google Scholar] [CrossRef]
  68. Prat, O.P.; Barros, A.P. Exploring the Transient Behavior of Z-R Relationships: Implications for Radar Rainfall Estimation. J. Appl. Meteorol. Climatol. 2009, 48, 2127–2143. [Google Scholar] [CrossRef]
  69. Das, S.K.; Konwar, M.; Chakravarty, K.; Deshpande, S.M. Raindrop Size Distribution of Different Cloud Types over the Western Ghats Using Simultaneous Measurements from Micro-Rain Radar and Disdrometer. Atmos. Res. 2017, 186, 72–82. [Google Scholar] [CrossRef]
  70. Yuan, L.; Mikelonis, A.M.; Pirhalla, M. Exploring the Statistical Characteristics of Coastal Winter Precipitation Measured Using a Parsivel2 Disdrometer: A Case Study in North Carolina. Atmos. Res. 2024, 307, 107487. [Google Scholar] [CrossRef]
  71. Zawadzki, I.; De Agostinho Antonio, M. Equilibrium Raindrop Size Distributions in Tropical Rain. J. Atmos. Sci. 1988, 45, 3452–3459. [Google Scholar] [CrossRef]
  72. Tenório, R.S.; Moraes, M.C.D.S.; Kwon, B.H. Raindrop Distribution in the Eastern Coast of Northeastern Brazil Using Disdrometer Data. Rev. Bras. Meteorol. 2010, 25, 415–426. [Google Scholar] [CrossRef]
  73. Chen, B.; Hu, Z.; Liu, L.; Zhang, G. Raindrop Size Distribution Measurements at 4,500 m on the Tibetan Plateau During TIPEX-III. J. Geophys. Res. Atmos. 2017, 122, 11092–11106. [Google Scholar] [CrossRef]
  74. Jwa, M.; Jin, H.G.; Lee, J.; Moon, S.; Baik, J.J. Characteristics of Raindrop Size Distribution in Seoul, South Korea According to Rain and Weather Types. Asia Pac. J. Atmos. Sci. 2020, 57, 605–617. [Google Scholar] [CrossRef]
  75. Niu, S.; Jia, X.; Sang, J.; Liu, X.; Lu, C.; Liu, Y. Distributions of Raindrop Sizes and Fall Velocities in a Semiarid Plateau Climate: Convective versus Stratiform Rains. J. Appl. Meteorol. Climatol. 2010, 49, 632–645. [Google Scholar] [CrossRef]
  76. Marshall, J.S.; Hitschfeld, W.; Gunn, K.L.S. Advances in Radar Weather. Adv. Geophys. 1955, 2, 1–56. [Google Scholar] [CrossRef]
  77. Battan, L.J. Radar Observation of the Atmosphere; University of Chicago Press: Chicago, IL, USA, 1973; Volume 99, ISBN 0226039196. [Google Scholar]
  78. Yu, N. Précipitations Méditerranéennes Intenses—Caractérisation Microphysique et Dynamique Dans l’atmosphère et Impacts Au Sol. Ph.D. Thesis, Université de Grenoble, Grenoble, France, 2012. [Google Scholar]
  79. Raghavan, S. Radar Meteorology; Atmospheric and Oceanographic Sciences Library; Springer: Dordrecht, The Netherlands, 2003; Volume 27. [Google Scholar]
  80. Calheiros, R.V.; Oliveira, C.; Beneti, C.; Calvetti, L. Distrometric Drop Size Distribution in South Brazil: Derived Z-R Relationships and Comparisons with Radar Measurements. In Proceedings of the 38th AMS Conference on Radar Meteorology, Chicago, IL, USA, 28 August–1 September 2017; AMS: Chicago, IL, USA, 2017. [Google Scholar]
  81. Yeo, J.X.; Lee, Y.H.; Ong, J.T. Radar Measured Rain Attenuation with Proposed Z-R Relationship at a Tropical Location. AEU—Int. J. Electron. Commun. 2015, 69, 458–461. [Google Scholar] [CrossRef]
  82. Pedrozo-Acuña, A.; Magos-Hernández, J.A.; Sánchez-Peralta, J.A.; Amaro-Loza, A.; Breña-Naranjo, A. Real-Time and Discrete Precipitation Monitoring in Mexico City: Implementation and Application. In Proceedings of the HydroSenSoft, International Symposium on Hydro-Environment Sensors and Software, Madrid, Spain, 1–3 March 2017; IAHR: Madrid, Spain, 2017. [Google Scholar]
  83. OTT, H.G. Operating Instructions Present Weather Sensor OTT Parsivel2; OTT Hydromet: Kempten, Germany, 2016. [Google Scholar]
  84. Tokay, A.; Wolff, D.B.; Petersen, W.A. Evaluation of the New Version of the Laser-Optical Disdrometer, OTT Parsivel2. J. Atmos. Ocean. Technol. 2014, 31, 1276–1288. [Google Scholar] [CrossRef]
Figure 1. Spatial distribution of the 21 OH-IIUNAM disdrometer stations located in the flat urban area (black points) and high mountain region (red diamond), topographical gradient (background), mean annual precipitation isohyets (grayscale lines), and study area (33 km from city center) (black dotted circle) of Mexico City.
Atmosphere 16 00585 g001
Figure 2. Comparison of the average measured DSDs (continuous lines) and modeled DSDs fitted by the normalized gamma distribution (dotted lines) between each period analyzed in the flat urban (a) and high mountain (b) regions of Mexico City.
Atmosphere 16 00585 g002
Figure 3. Average values of σM/Dm (with ±1σ std dev bars) versus average µ (a) and scatter plot of the average value of logNw (with ±1σ std dev bars) and average Do (b) from disdrometer stations. Located in the flat urban (black points) and high mountain regions (red diamonds) of Mexico City. Note: In the right panel (b), MP1948 (dotted line) refers to the traditional reference for logNw value [49].
Atmosphere 16 00585 g003
Figure 4. Spatial distribution of the average values of the parameters: logNw (mm−1 m−3), Do (mm), and µ adjusted for 21 disdrometer station located in the flat urban (black circles) and high mountain regions (black diamonds) across the study area (33 km) for the complete (a), summer (b), and winter (c) periods. Note: The short color scale is used to emphasize the Do variation.
Atmosphere 16 00585 g004
Figure 5. Average measured DSDs by 21 disdrometer stations in six rain rate classes for the complete period.
Atmosphere 16 00585 g005
Figure 6. Average of normalized gamma DSD parameters (logNw left panel; Do middle panel and µ right panel) adjusted for each disdrometer station considering six rain rate categories and the complete period of measurements.
Atmosphere 16 00585 g006
Figure 7. Scatter plot of a and b coefficients for the 21 disdrometer stations, overall adjusted for each topographic region in Mexico City alongside MP1955 values for the complete (a), summer (b), and winter (c) periods.
Atmosphere 16 00585 g007
Figure 8. Spatial distribution of a (top panels) and b (bottom panels) coefficients adjusted for 21 disdrometer stations located in the flat urban (black circles) and high mountain regions (black diamonds) across the study area (33 km) for the complete (a), summer (b), and winter (c) periods.
Atmosphere 16 00585 g008
Figure 9. Z-R scatter plot from the fitted normalized gamma DSD using all disdrometer data of each topographic region (top panels, mountainous and bottom panels, flat urban). The equation in the graphs shows the overall Z-R relationship for the complete (a), summer (b), and winter (c) periods.
Atmosphere 16 00585 g009
Table 1. Geographical coordinates, elevation, and region class of the disdrometer stations.
No.Station NameLatitudeLongitudeElevation (m.a.s.l.) 1Region
1Acopilco19.322−99.3292949.63High mountain
2Ajusco19.215−99.1882849.55High mountain
3AMC19.241−99.1742606.05High mountain
4Aragón19.466−99.082226.61Flat urban
5Bosque Real19.436−99.2832401.89High mountain
6CCH ote19.384−99.062230.26Flat urban Flat
7CCH Vallejo19.484−99.1412232.41Flat urban
8Centenario19.356−99.2392514.88High mountain
9Coapa19.288−99.1342236.39Flat urban
10Contreras19.306−99.2472542.2High mountain
11Cuajimalpa19.355−99.2922728.35High mountain
12Cuauhtenco19.193−99.0982756.71High mountain
13IIUNAM19.329−99.1822271.93Flat urban
14Prepa819.367−99.1952298.72Flat urban
15SACMEX19.425−99.1372227.14Flat urban
16San Bartolo19.326−99.282751.84High mountain
17Tlalnepantla19.539−99.1952249Flat urban
18Tulyeahualco19.25−99.012248.03Flat urban
19UAM Az19.504−99.1892241.24Flat urban
20Vista Hermosa19.372−99.2762623.11High mountain
21Xochimilco19.25−99.1072241.76Flat urban
1 m.a.s.l., meters above mean sea level.
Table 2. Mean values of the normalized gamma DSD parameters, and a and b coefficients for the Z-R relationship adjusted for all 21 disdrometer stations for the complete period.
No. and Station Namelog(<Nw>) (mm−1 m−3)<Do> (mm)<µ>ab
MeanSDMeanSDMeanSD
1—Acopilco3.8583.9540.9940.4488.1975.332177.1981.567
2—Ajusco3.9374.1530.9440.4178.5995.382162.2641.622
3—AMC3.8183.9450.9670.4248.5855.319179.4521.644
4—Aragon3.7223.8290.9920.4466.0424.723211.9671.688
5—BosqueReal3.8224.0780.9790.4527.7235.223187.5691.644
6—CCHOTE3.6493.7251.0340.4828.2635.239208.7571.642
7—CCHVALLEJO3.6863.7661.0310.4288.2855.165195.6841.628
8—Centenario3.7903.9271.0190.4498.1965.226184.6301.586
9—Coapa3.7373.8140.9600.4217.8445.075196.2071.620
10—Contreras3.8093.9251.0260.4637.9825.307180.3721.620
11—Cuajimalpa3.7643.8531.0060.4428.5225.319185.7161.585
12—Cuauhtenco3.9494.1810.9520.4468.3935.423167.3741.651
13—IIUNAM3.7513.9651.0350.4986.6284.796206.7721.657
14—PREPA83.7223.8241.0480.4818.0125.184203.3151.590
15—SACMEX3.7013.8401.0400.4866.8454.825217.3061.653
16—SanBartolo3.8724.0280.9900.4438.1485.374172.9111.611
17—Tlalnepantla3.6533.7241.0480.4628.1985.144207.0211.623
18—Tulyehualco3.7003.8631.0270.4438.2805.237204.4931.588
19—UAMAZC3.7083.7841.0430.4668.0185.169196.5931.640
20—VHermosa3.8464.0670.9760.4517.0575.025191.4561.629
21—Xochimilco3.7073.8001.0450.4897.9605.184200.3391.644
Mean3.772 1.007 7.894
Disclaimer/Publisher’s Note: The statements, opinions and data contained in all publications are solely those of the individual author(s) and contributor(s) and not of MDPI and/or the editor(s). MDPI and/or the editor(s) disclaim responsibility for any injury to people or property resulting from any ideas, methods, instructions or products referred to in the content.

