Article

Track Classification and Characteristics Analysis of Northeast China Cold Vortex During the Warm Season

1
State Key Laboratory of Climate System Prediction and Risk Management/Key Laboratory of Meteorological Disaster, Ministry of Education/Collaborative Innovation Center on Forecast and Evaluation of Meteorological Disasters, Nanjing University of Information Science and Technology, Nanjing 210044, China
2
Changchun Meteorological Administration, Changchun 130062, China
3
CMA Earth System Modeling and Prediction Centre, Beijing 100081, China
*
Author to whom correspondence should be addressed.
Atmosphere 2025, 16(5), 554; https://doi.org/10.3390/atmos16050554
Submission received: 9 April 2025 / Revised: 30 April 2025 / Accepted: 6 May 2025 / Published: 7 May 2025
(This article belongs to the Special Issue Advances in Understanding Extreme Weather Events in the Anthropocene)

Abstract

:
Understanding the characteristics of the Northeast China Cold Vortex (NCCV) during the warm season (May to September) is essential for enhancing the forecast skills in Northeast China. This study employed ERA5 reanalysis data over 2012–2022 and the optimized K-means clustering algorithm to classify NCCV tracks into five types: (A) eastward-moving dissipative, (B) eastward-moving retrogressive, (C) short-range eastward-moving offshore, (D) long-range eastward-moving offshore, and (E) long-range southeastward-moving offshore. The results demonstrated that variations in circulation configurations governed the tracks of the NCCVs, bringing about the diversity in the center intensity, lifespan, movement speed, and rainstorm probability results. Specifically, the blocking high (BH) over the Sea of Okhotsk served as the primary control system, favoring slow-moving, long-lived NCCVs (type A and type B), which were associated with a higher probability of cold vortex (CV) rainstorms. However, fast-moving, the short-lived NCCVs (type C) had a weaker impact on precipitation. A spatiotemporal analysis further revealed obvious inter-monthly variation in NCCV tracks. From May to August, under the influence of the northward-moving subtropical high and the strengthening of the BH, the occurrence of types A and B increased, while the occurrence of other types decreased. This synoptic shift promoted moisture transport into Northeast China, increasing the frequency of CV rainstorms in July and August.

1. Introduction

The Northeast China Cold Vortex (NCCV), a predominant cutoff low system in East Asia [1], is particularly active during the boreal warm season (May to September) [2]. The operational identification criteria for the NCCV are defined as persistent closed geopotential height contours on the 500 hPa isobaric surface within the identification region of 35–60° N and 115–145° E, with a concomitant cold core structure or an associated mid-tropospheric trough, typically maintained for a minimum persistence threshold of 72 h [3], while some studies define the NCCV duration as at least 48 h [4,5] or have expanded the identification region to 35–60° N, 100–150° E [4]. During the warm season, the persistently active NCCV often causes abnormal low temperatures in Northeast China [6], especially when combined with blocking high systems [7]. The precipitation forecasts in Northeast China are closely related to NCCV activity [8]. Shen et al. [9] found that early summer precipitation anomalies are frequently associated with the NCCV, and Liu et al. [10] demonstrated a strong correlation between the Cold Vortex Rainfall Index (NRSI) and early summer rainfall. When the NCCV interacts with the Western Pacific Subtropical High, it often leads to severe flooding in Northeast China [11], with rainstorm concentrated in the southeastern and northeastern quadrants of the cold vortex [12]. Additionally, the NCCV frequently triggers severe convective weather [13], including thunderstorm gales [14,15], short-duration heavy rainfall [16], tornadoes [17], and hail [18]. The obvious “climate effects” of the NCCV also have a substantial effect on precipitation in the Haihe River Basin [19,20], Yangtze–Huaihe region [21,22,23], and South China [24].
Due to notable individual variability, the NCCVs are often classified by various criteria. Jiang et al. [25] classified NCCVs into deep and shallow types based on their structure. Xie et al. [26,27] categorized them into four types according to circulation patterns: Lake Baikal (BKL), Yenisei River Valley (YNS), Ural Mountains (UR), and the Yakutsk–Okhotsk region (YO). Based on genesis locations, Sun et al. [3] classified them into northern, central, and southern vortices. Lian et al. [28] divided them into two categories depending on their formation mechanisms. Sun et al. [29] further classified them by the intensity of induced precipitation. Zhou et al. [30] grouped summer NCCVs into five clusters based on their shapes and Rossby wave trains. Although considerable progress has been made in understanding the characteristics of NCCVs, few studies have focused specifically on their tracks [31]. In contrast, objective classification studies on tropical cyclone tracks were conducted earlier during the same period [32]. Nakamura et al. [33] proposed a K-means clustering algorithm based on the mass moment, applying it to the classification of North Atlantic tropical cyclone tracks with promising results. Then, this algorithm was widely applied to classify the tropical cyclone tracks in the Northwest Pacific [34,35] and South China Sea [36], achieving substantial consensus in the classification results. Recently, Fang et al. [37] applied the K-means clustering algorithm to classify NCCV tracks in June, dividing them into four distinct types and demonstrating the validity of the classification through the circulation configuration and climatic impact. However, Lin et al. [38] classified NCCV tracks that occurred in July and August into three types using the same algorithm. This indicates that the classification results for NCCV tracks can vary significantly depending on the month.
Currently, there is still no consensus on the classification and characteristics of NCCV tracks during the warm season. In this study, an optimized K-means clustering algorithm was proposed by introducing an intensity weight in the feature parameters used to describe NCCV tracks, allowing for the consideration of the impact of the cold vortex intensity during the clustering process. Then, we applied the optimized algorithm to classify NCCV tracks over the whole warm season and analyzed the differences among the types of NCCV tracks based on the center intensity, movement speed, lifespan, circulation configuration, and precipitation characteristics. Meanwhile, the inter-monthly variation in the NCCV tracks during the warm season and impact on CV rainstorms in Northeast China were investigated in this study, providing scientific insights for understanding different types of NCCV tracks and forecast skills.

2. Data and Methods

2.1. Data

The data used in this study included the following: (1) The NCCV events dataset provided by the Key Laboratory of Northeast China Cold Vortex Research and the Liaoning Meteorological Service, spanning from 2012 to 2022, was used to select NCCV processes. To ensure their quality and prevent any omissions, the NCCV processes in the dataset were objectively identified based on operational standards and further screened through manual verification. (2) The reanalysis data ERA5 [39] (0.25° × 0.25° horizontal resolution) achieved from the European Center for Medium-Range Weather Forecasts (ECMWF; https://cds.climate.copernicus.eu/datasets, accessed on 1 November 2023) was used for the objective identification of NCCV tracks and the composite analysis of atmospheric circulation. The meteorological variables used in this study included the geopotential height, temperature, zonal wind, meridional wind, and relative humidity, spanning 37 vertical pressure levels from 1000 hPa to 1 hPa, with a time interval of 6 h. (3) The Hourly CMORPH (Climate Prediction Center Morphing Technique) satellite precipitation estimates data achieved from the Climate Prediction Center (CPC) of the United States (https://doi.org/10.25921/w9va-q159, accessed on 1 November 2023) was used to describe the observed CV rainstorms in Northeast China. This product is a global high-temporal- and high-spatial-resolution precipitation dataset derived from the integration of multiple microwave precipitation data and infrared data, which is considered reliable for monitoring precipitation events. These data cover the region of 60° S to 60° N, 180° E to 180° W, with a temporal resolution of 1 h and horizontal resolution of 0.25° × 0.25°.

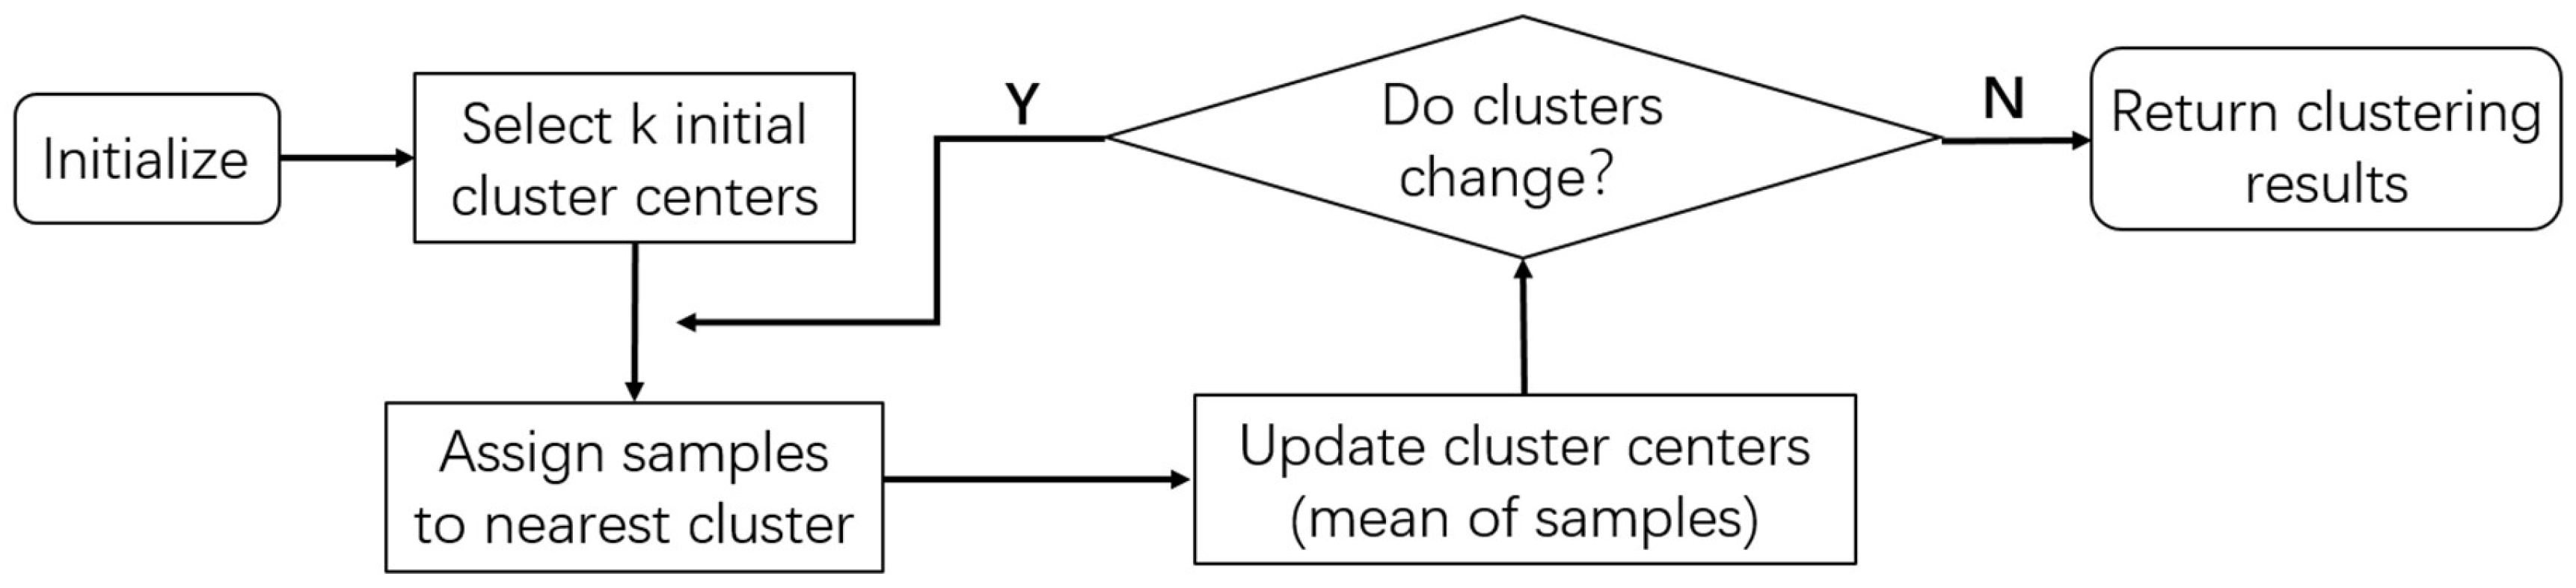
2.2. K-Means Clustering Algorithm

The K-means clustering algorithm clusters samples by measuring their similarity, dividing them into K clusters while ensuring that each sample belongs exclusively to one cluster. This algorithm maximizes inter-cluster distances and minimizes intra-cluster distances. With high computational efficiency and ease of implementation, the K-means clustering algorithm has been widely applied in the classification research of vortex systems through selecting specific feature parameters (i.e., centroid and variances). A conceptual graph of the K-means clustering algorithm is illustrated in Figure 1.

2.2.1. Optimization of Feature Parameters

Since the K-means clustering algorithm based on the mass moment was proposed by Nakamura et al. [33], it has been widely applied to the classification of typhoon and NCCV tracks, achieving numerous research outcomes. Through practical validation, the centroid and zonal, meridional, and diagonal variances can effectively describe the average position, track length, shape, and movement direction of vortex systems. In this study, to better describe the centroid and zonal, meridional, and diagonal variances of the NCCV track, its intensity weight was added into the K-means clustering algorithm in this study, which differed from the approach used in [37,38], which directly calculated the mean latitude and longitude of the NCCV center. Regarding the optimization of feature parameters for NCCVs, the impact of the cold vortex intensity was considered during the clustering process, enabling a more comprehensive and reasonable classification of its tracks. Thus, in the optimized K-means clustering algorithm, the equations used to calculate the centroid coordinates (longitude/latitude) and the three variances are as follows:
X ¯ = 1 n w i x i 1 n w i
Y ¯ = 1 n w i y i 1 n w i
V a r x = i n w ( i ) ( x i X ¯ ) 2 1 n w i
V a r y = i n w ( i ) ( y i Y ¯ ) 2 1 n w i
V a r x y = i n w i x i X ¯ y i Y ¯ 1 n w i
Here, x i and y i are the longitude and latitude of the NCCV track at the   i -th time point, respectively, and n is the number of NCCV location points. The intensity weight w i   is represented by the ratio of the minimum geopotential height of the NCCV center along the entire track to the geopotential height of the NCCV center at the i -th time point h g t m i n / h g t i , with a range generally between 0.8 and 1. In this way, when calculating the NCCV centroid and its variance, the influence of the cold vortex’s center intensity at each time is considered.
Additionally, the original coordinates (longitude/latitude) and ultimate longitude of the NCCV tracks were incorporated as supplementary features to the original five feature parameters. The selective retention of the ultimate longitude—excluding the latitude—was empirically justified by the predominant zonal movement pattern observed in NCCVs, where longitudinal displacement between the original and ultimate positions exhibits obvious variability compared to limited meridional variation. Furthermore, to mitigate parameter magnitude discrepancies (particularly between latitudinal degrees and variance values), standardization was applied to all eight parameters prior to K-means optimization, and the similarity between tracks was measured by these parameters, as shown in the following equation:
d i j = m = 1 8 x i m x j m

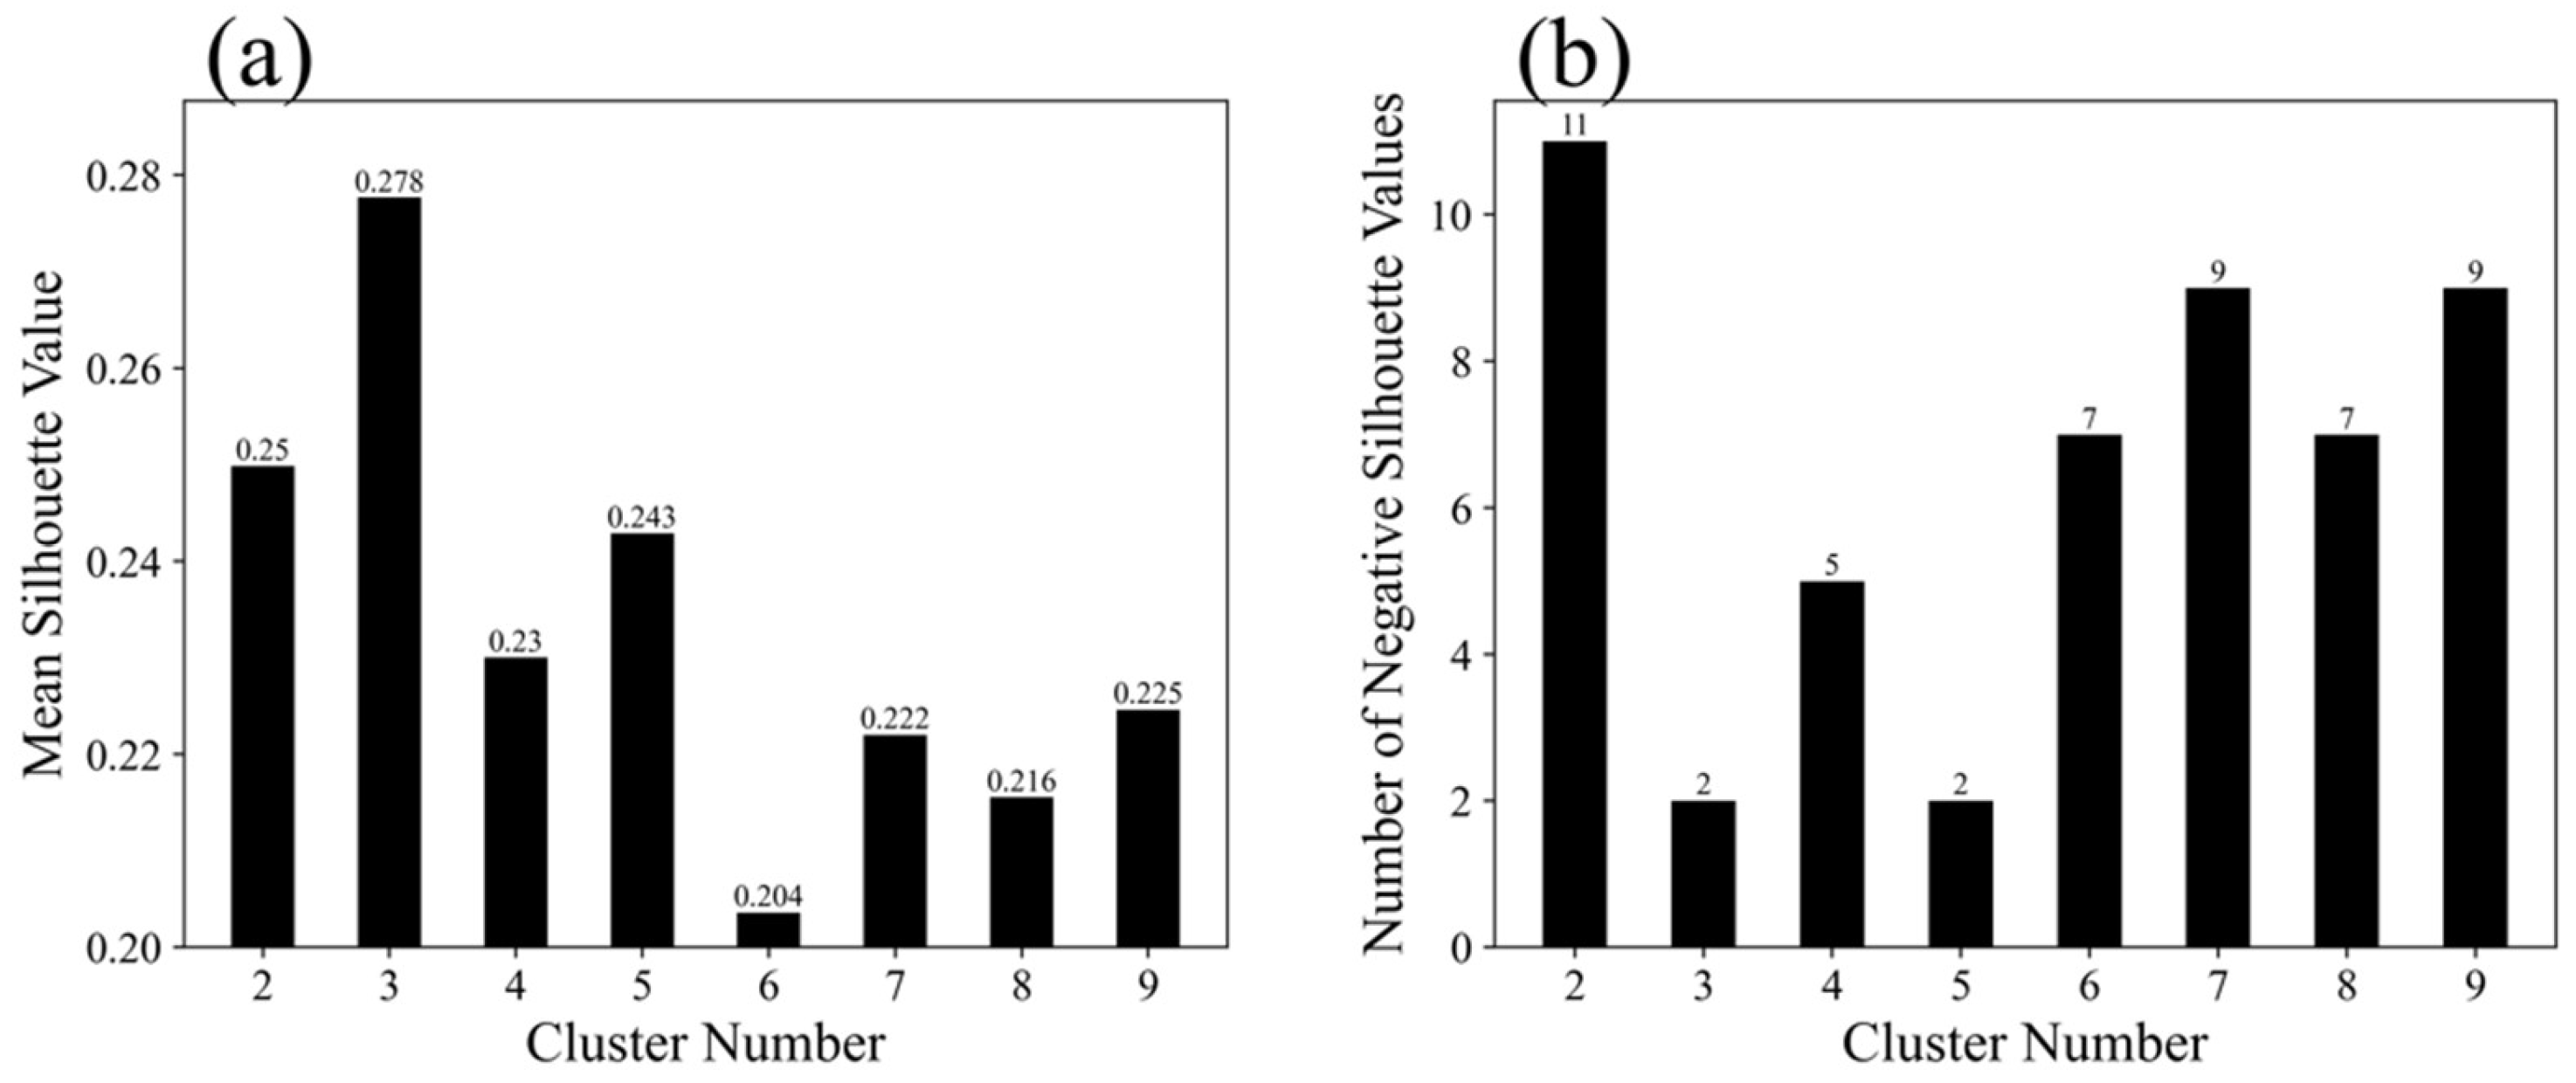
2.2.2. Criteria for the K Value

The K-means clustering method cannot independently determine the optimal cluster number (K value). Therefore, the K value is typically obtained by comparing the difference between the mean silhouette value and the number of negative silhouette values across different clustering results. The silhouette value S i reflects the intra-cluster cohesion and inter-cluster dispersion of sample i, which can be calculated using the following equation:
S i = b i a i m a x a i , b i
In this formula, a i   represents the average intra-cluster distance from sample i to all other samples within the same cluster, while b i represents the minimum average inter-cluster distance from sample i to samples in any other cluster. The S i   values range from −1.0 to 1.0, and values closer to 1.0 indicate better clustering quality for sample i, achieved when a i   is small (tight intra-cluster cohesion) and b i   is large (distinct inter-cluster dispersion). A negative S i suggests that sample i may have been misclassified. A higher mean S i indicates stronger cluster differentiation. Therefore, the optimal number of clusters (K value) is determined by selecting the criterion that maximizes the mean silhouette value while minimizing the number of samples with negative silhouette values.

3. Clustering Results of Warm Season NCCV Tracks

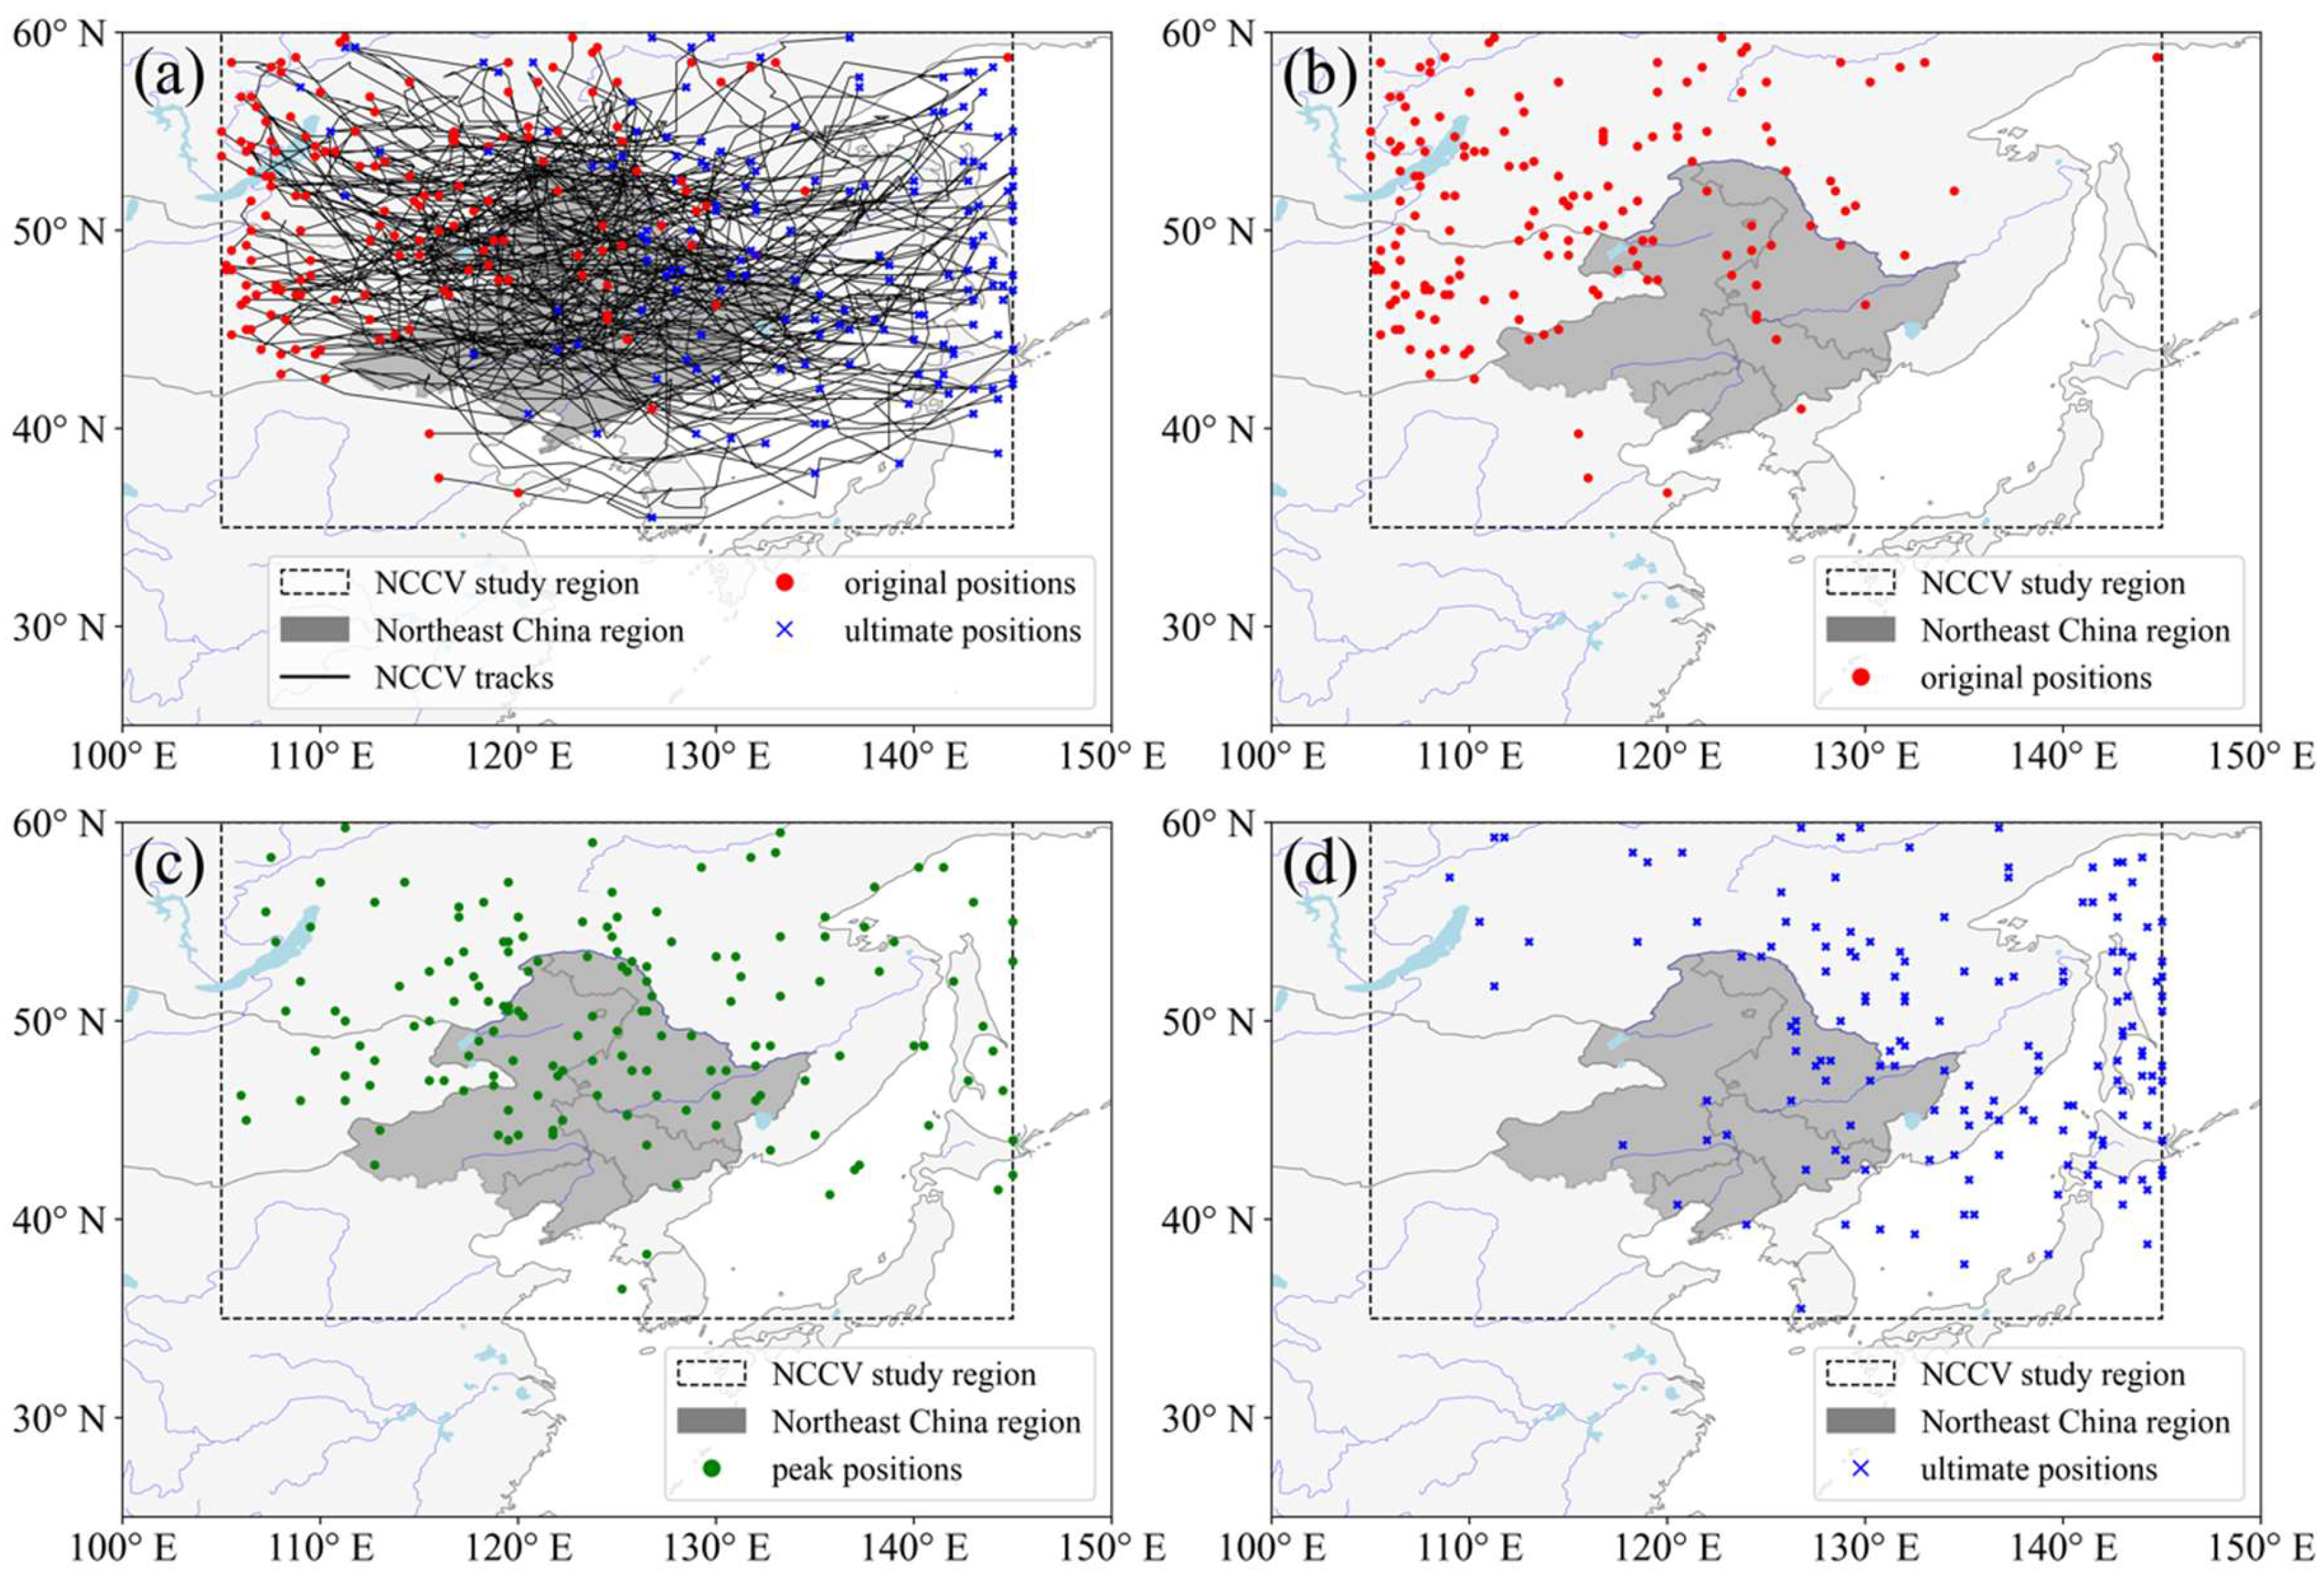
3.1. Identification of NCCV Tracks

The tracks of the NCCVs were derived from the NCCV events dataset and ERA5 reanalysis data, and the identification criteria were as follows. Aiming at the study region (35–60° N, 105–145° E) defined in the NCCV events dataset, the “eight-point method” [40] was applied to locate the NCCV center at 500 hPa, characterized by closed isohypses and corresponding cold centers or cold troughs, so as to obtain its coordinates (longitude/latitude) and intensity. The initial position of the NCCV center was defined as the first identified location within the study region. The peak position referred to the location of the NCCV center with the lowest geopotential height (strongest center intensity). The ultimate position was defined as the last identified location of the NCCV center. The complete track was composed of the center positions at each identified time step throughout the NCCV event.
Figure 2a illustrates the objectively identified 157 NCCV tracks during the warm season (May to September) from 2012 to 2022. These NCCVs predominantly initiated north of 40° N, exhibiting eastward propagation across Northeast China. However, the movement directions and spatial ranges demonstrated considerable stochastic variability. The spatial distribution of the NCCV original positions (Figure 2b), peak positions (Figure 2c), and ultimate positions (Figure 2d) shows distinct signatures. The original positions were primarily located near Lake Baikal and eastern Mongolia, the ultimate positions were dispersed over eastern Siberia and the ocean, and the peak positions were scattered throughout the entire study region. Given the obvious differences in tracks among warm season NCCVs, a further clustering analysis was required to investigate the activity characteristics.

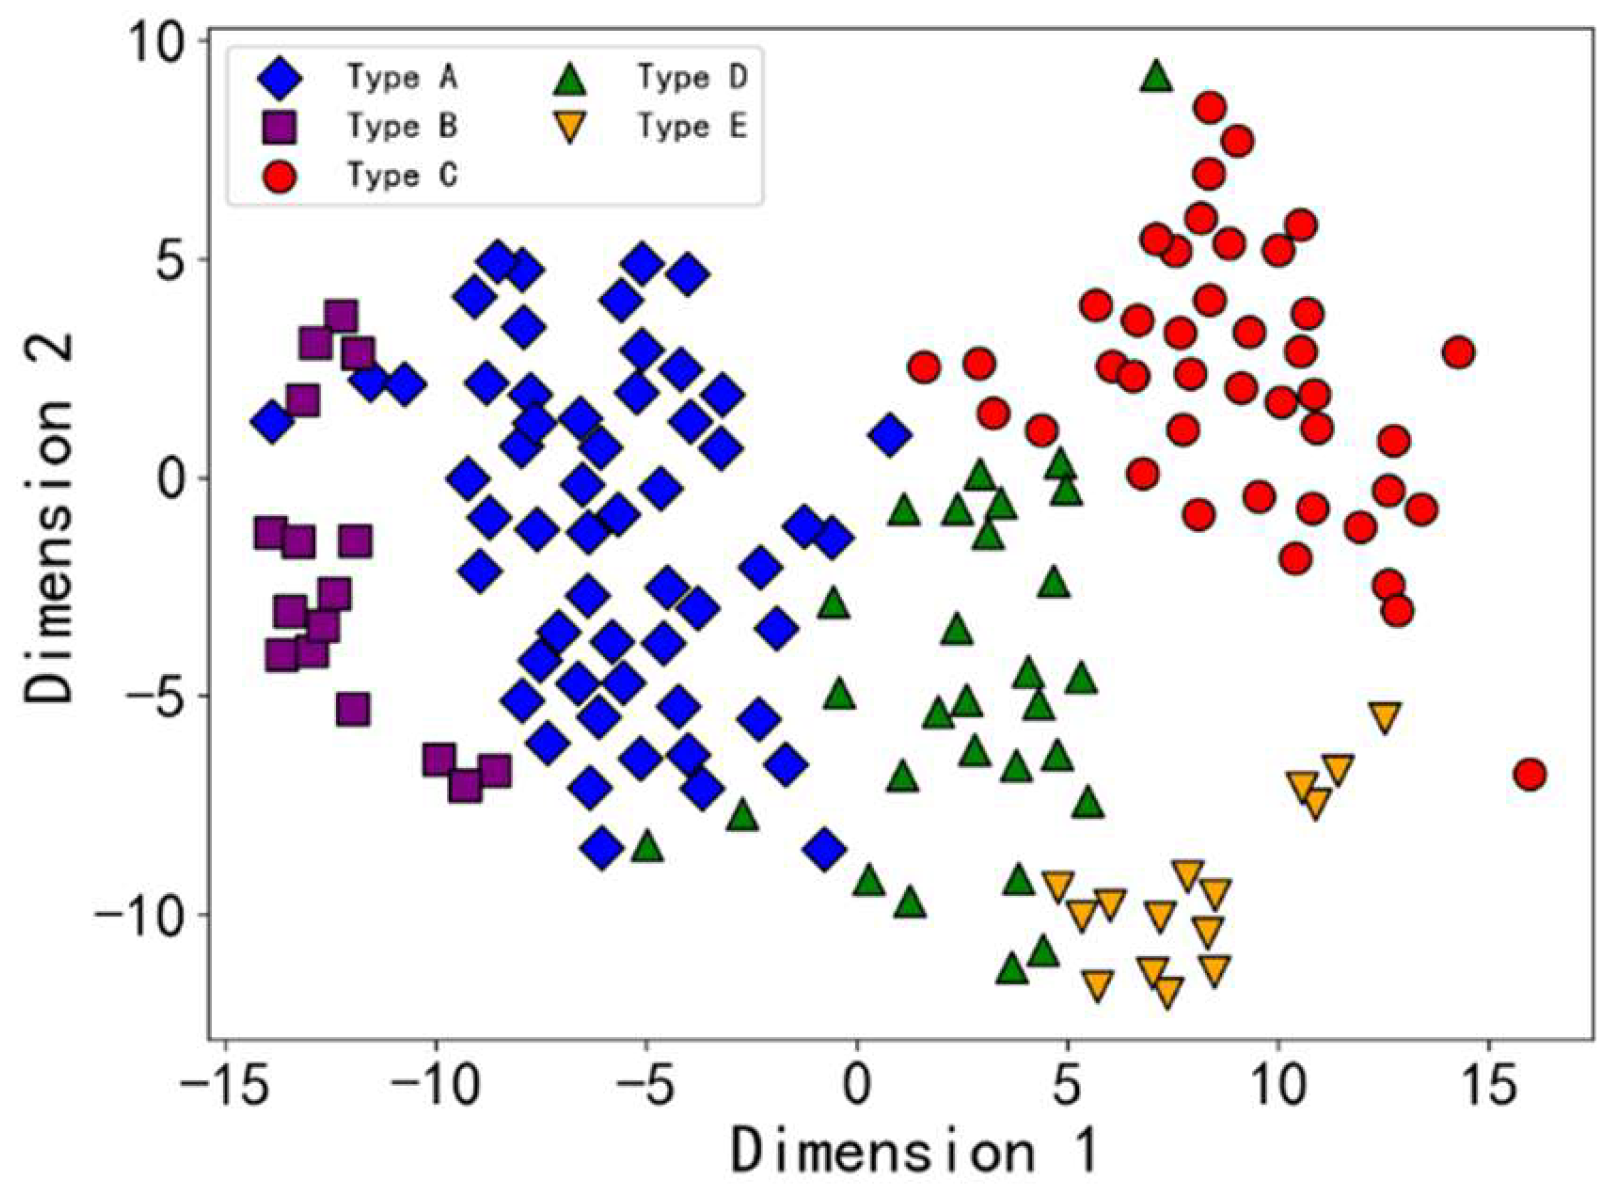
3.2. Five Typical NCCV Tracks

Based on the criterion of maximizing the mean silhouette value while minimizing the number of samples with negative silhouette values, as shown in Figure 3, the optimal number of clusters (K value) was 3, while 5 was considered suboptimal. According to the optimal number, the NCCV tracks were classified into three types: (I) land-based; (II) short-range eastward-moving offshore; (III) long-range moving offshore. The tracks of types (I) and (III) remained relatively disordered. However, when classified into five types (Figure 4), the NCCV tracks clearly exhibited diversity, as type (I) was further divided into (A) eastward-moving dissipative and (B) eastward-moving retrogressive, while type (III) was further divided into (D) long-range eastward-moving offshore and (E) long-range southeastward-moving offshore.
Figure 4a–e illustrates the five typical NCCV tracks, with types A, C, and D occurring more frequently. The dominant type A NCCVs (eastward-moving dissipative; Figure 4a), accounting for 35.7%, occurred near Lake Baikal and eastern Mongolia, moving eastward and ultimately dissipating near the coastline. Often retrogressing westward after moving east, type B (eastward-moving retrogressive; Figure 4b), accounted for 10%. Distinct from types A and B, type C (short-range eastward-moving offshore; Figure 4c) primarily formed in central and eastern Northeast China and moved eastward toward the sea, accounting for approximately 26%. Type D (long-range eastward-moving offshore; Figure 4d), accounting for 18.5%, originated in eastern Mongolia and moved eastward into the sea along a longer track. The long-range southeastward-moving offshore type E (Figure 4e) covered nearly the whole study region. Figure 4f highlights the differences between the five types of NCCV tracks in terms of activity region, track length, shape, and movement direction. The average track of type E (yellow line) had the longest length and a distinct southeastward swerve, while that of type B (purple line) showed the shortest length, an abrupt retreat, and the northernmost location. Although types A (blue line) and C (red line) had similar latitudinal tracks, the longitude ranges differed obviously. Type D (green line) exhibited a relatively straight movement direction, as did types A and C, although it was longer in length. The classification results in this study show a more refined division compared to the four-category classification of June NCCVs by Fang et al. [37]. While the results show some similarities, particularly for types B, C, and E, their category 1 was more precisely subdivided into types A and D, each with distinct characteristics than in our classification. This improvement can be attributed to the optimization of parameters. Furthermore, the reason for the reduction in the number of classifications in July and August [38] will also be discussed in the subsequent section on the inter-monthly variations of NCCV tracks.
T-SNE (t-Distributed Stochastic Neighbor Embedding) [41] is a nonlinear dimensionality reduction algorithm that simplifies the data complexity while preserving local features, thereby quantitatively assessing the clustering performance [37]. This algorithm was applied to reduce the clustered NCCV track data, described by eight feature parameters, into a two-dimensional diagram for visualization (Figure 5). The x- and y-axes do not represent specific physical or temporal parameters but instead correspond to the projections of the original NCCV track data onto two principal components identified by t-SNE. These components capture the most significant variations in the data, with similar NCCV tracks placed closer together and dissimilar tracks positioned farther apart. The clustering results indicated that the data within the five clusters were well-separated and tightly grouped, demonstrating effective clustering. Although a few outliers may not be perfectly classified, they did not affect the overall clustering results.

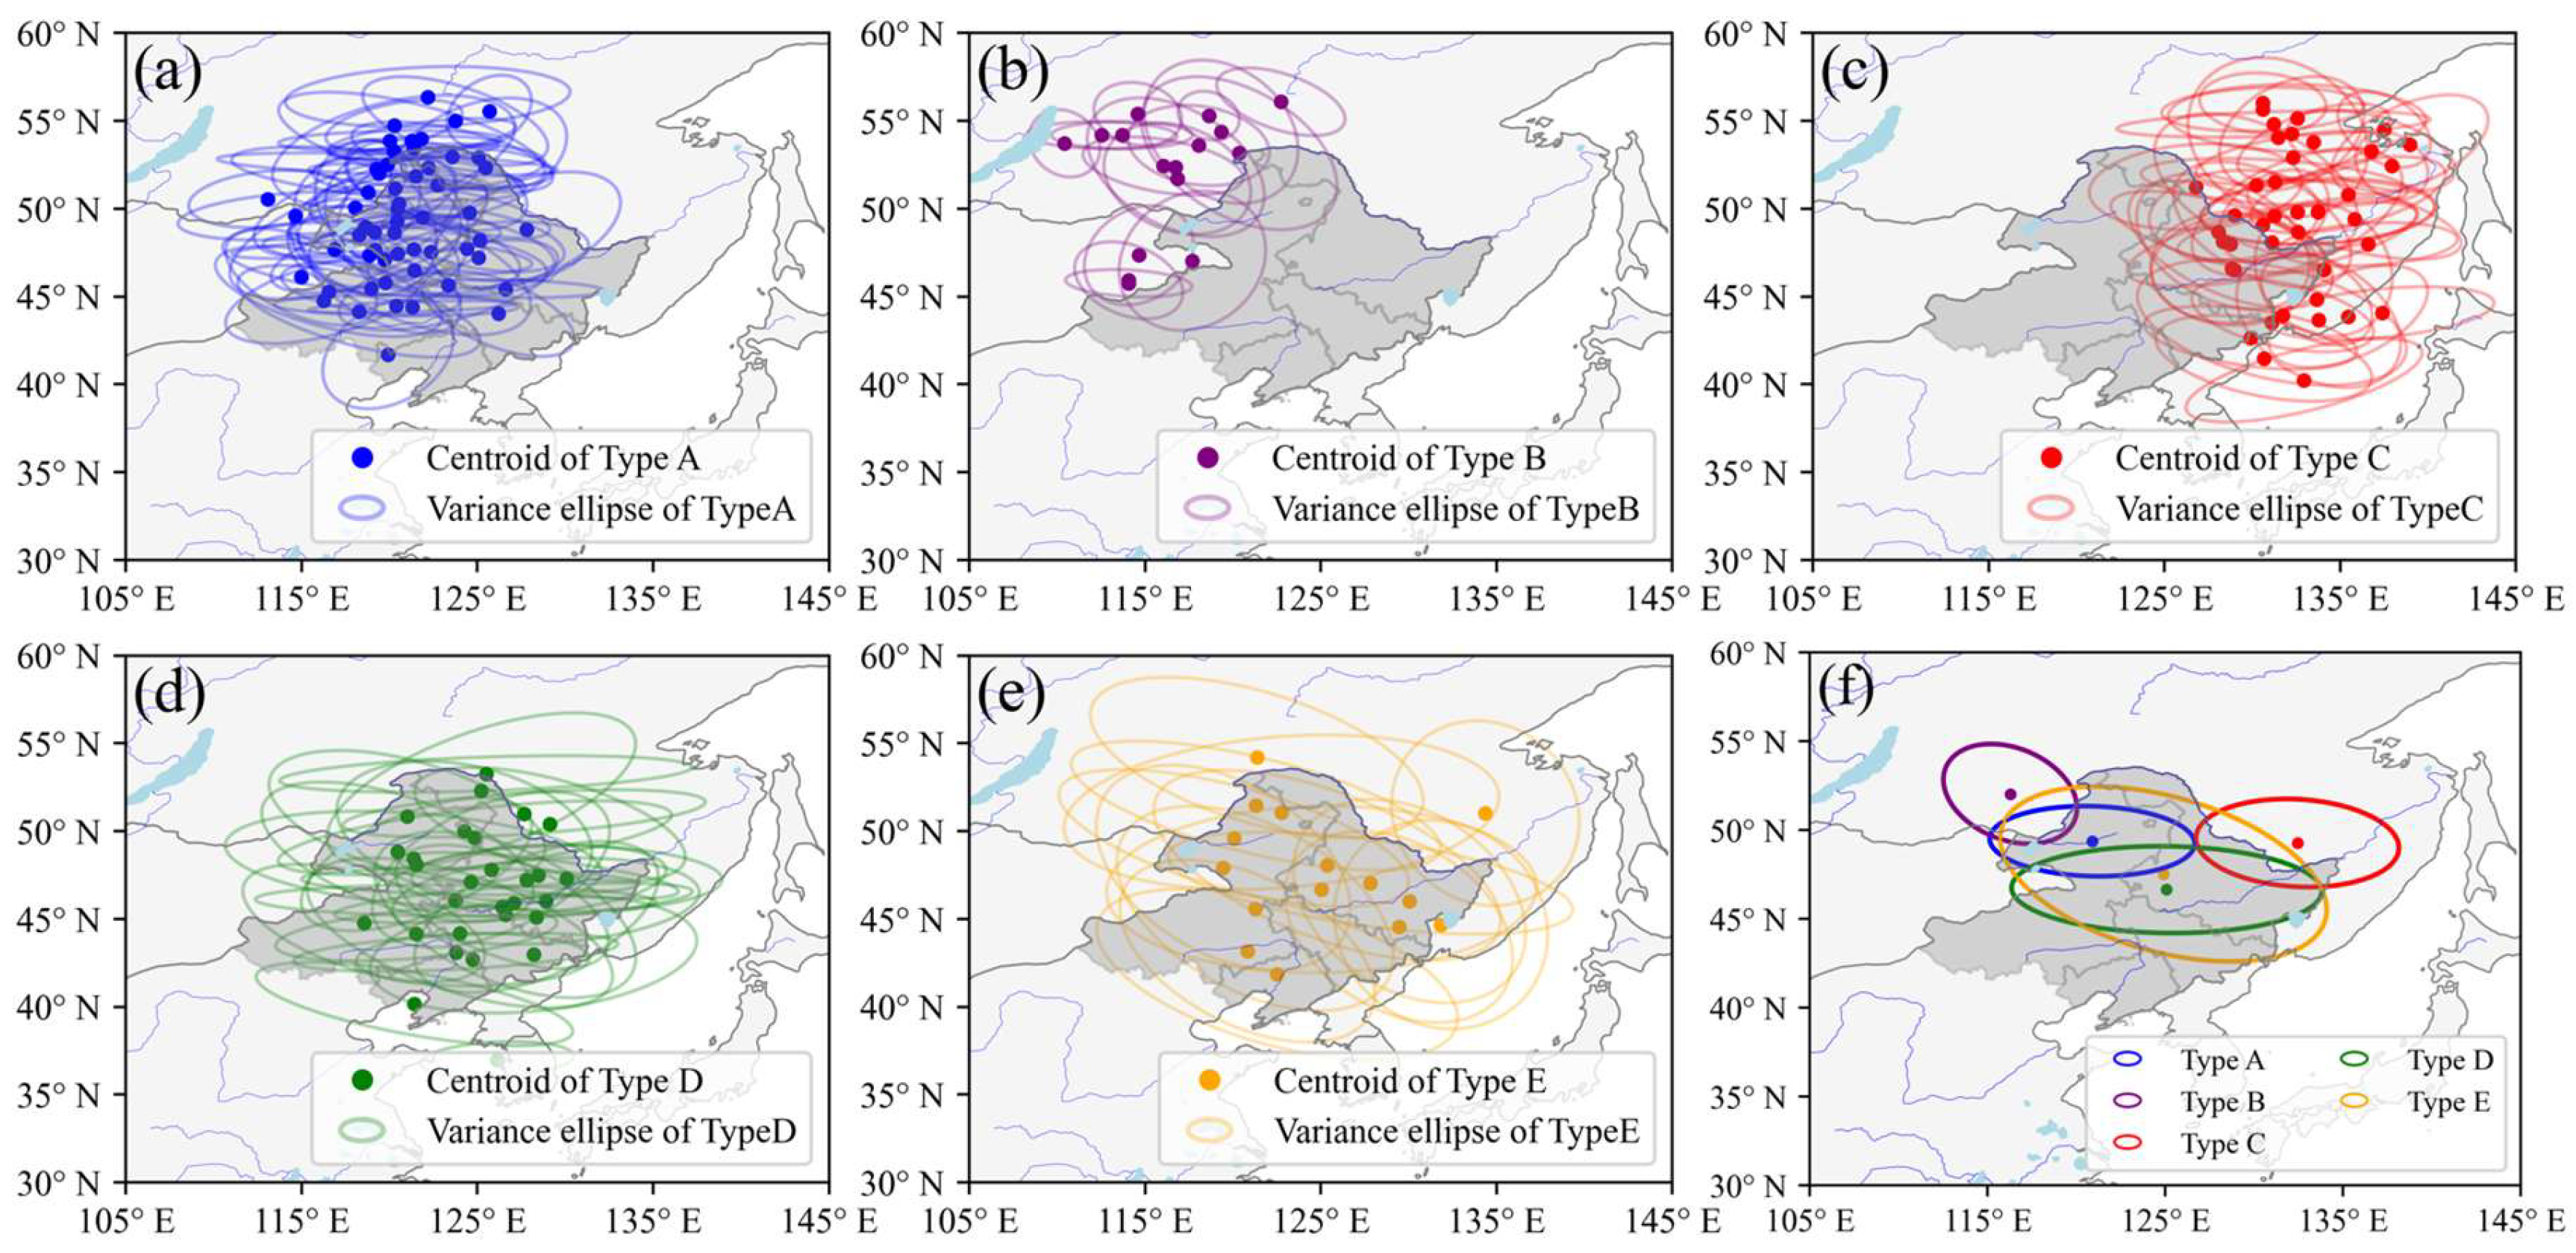
3.3. Centroid and Variance Ellipse Distribution

The centroid and variance ellipse (Figure 6) can effectively capture the key characteristics of the NCCV track, including the average position, track length, shape, activity range, and movement direction. The long axis of the variance ellipse represents the meridional variance, the short axis represents the zonal variance, and the tilt angle reflects the diagonal variance. The centroids of type A (Figure 6a) were primarily located in the central and western parts of Northeast China, with the variance ellipses oriented from west to east. These ellipses were the flattest, exhibiting the strongest directional orientation. Those of type B (Figure 6b) were located in the western part of Northeast China, with smaller and more circular variance ellipses. This suggested that the type B NCCVs exhibited a smaller activity range, and their positions varied more uniformly in both the meridional and zonal directions. For type C (Figure 6c), the centroids were also primarily located on the opposite side compared to type B. The variance ellipses covered the eastern coastal region, oriented primarily from west to east. The centroids of type D (Figure 6d) were mainly located in central Northeast China, with variance ellipses covering the whole Northeast China and oriented from west to east. The average centroid of type E (Figure 6f) was similar to that of type C. However, the average variance ellipse of type E exhibited a larger rotation angle, oriented from northwest to southeast.

4. Activity Characteristics of Five NCCV Types

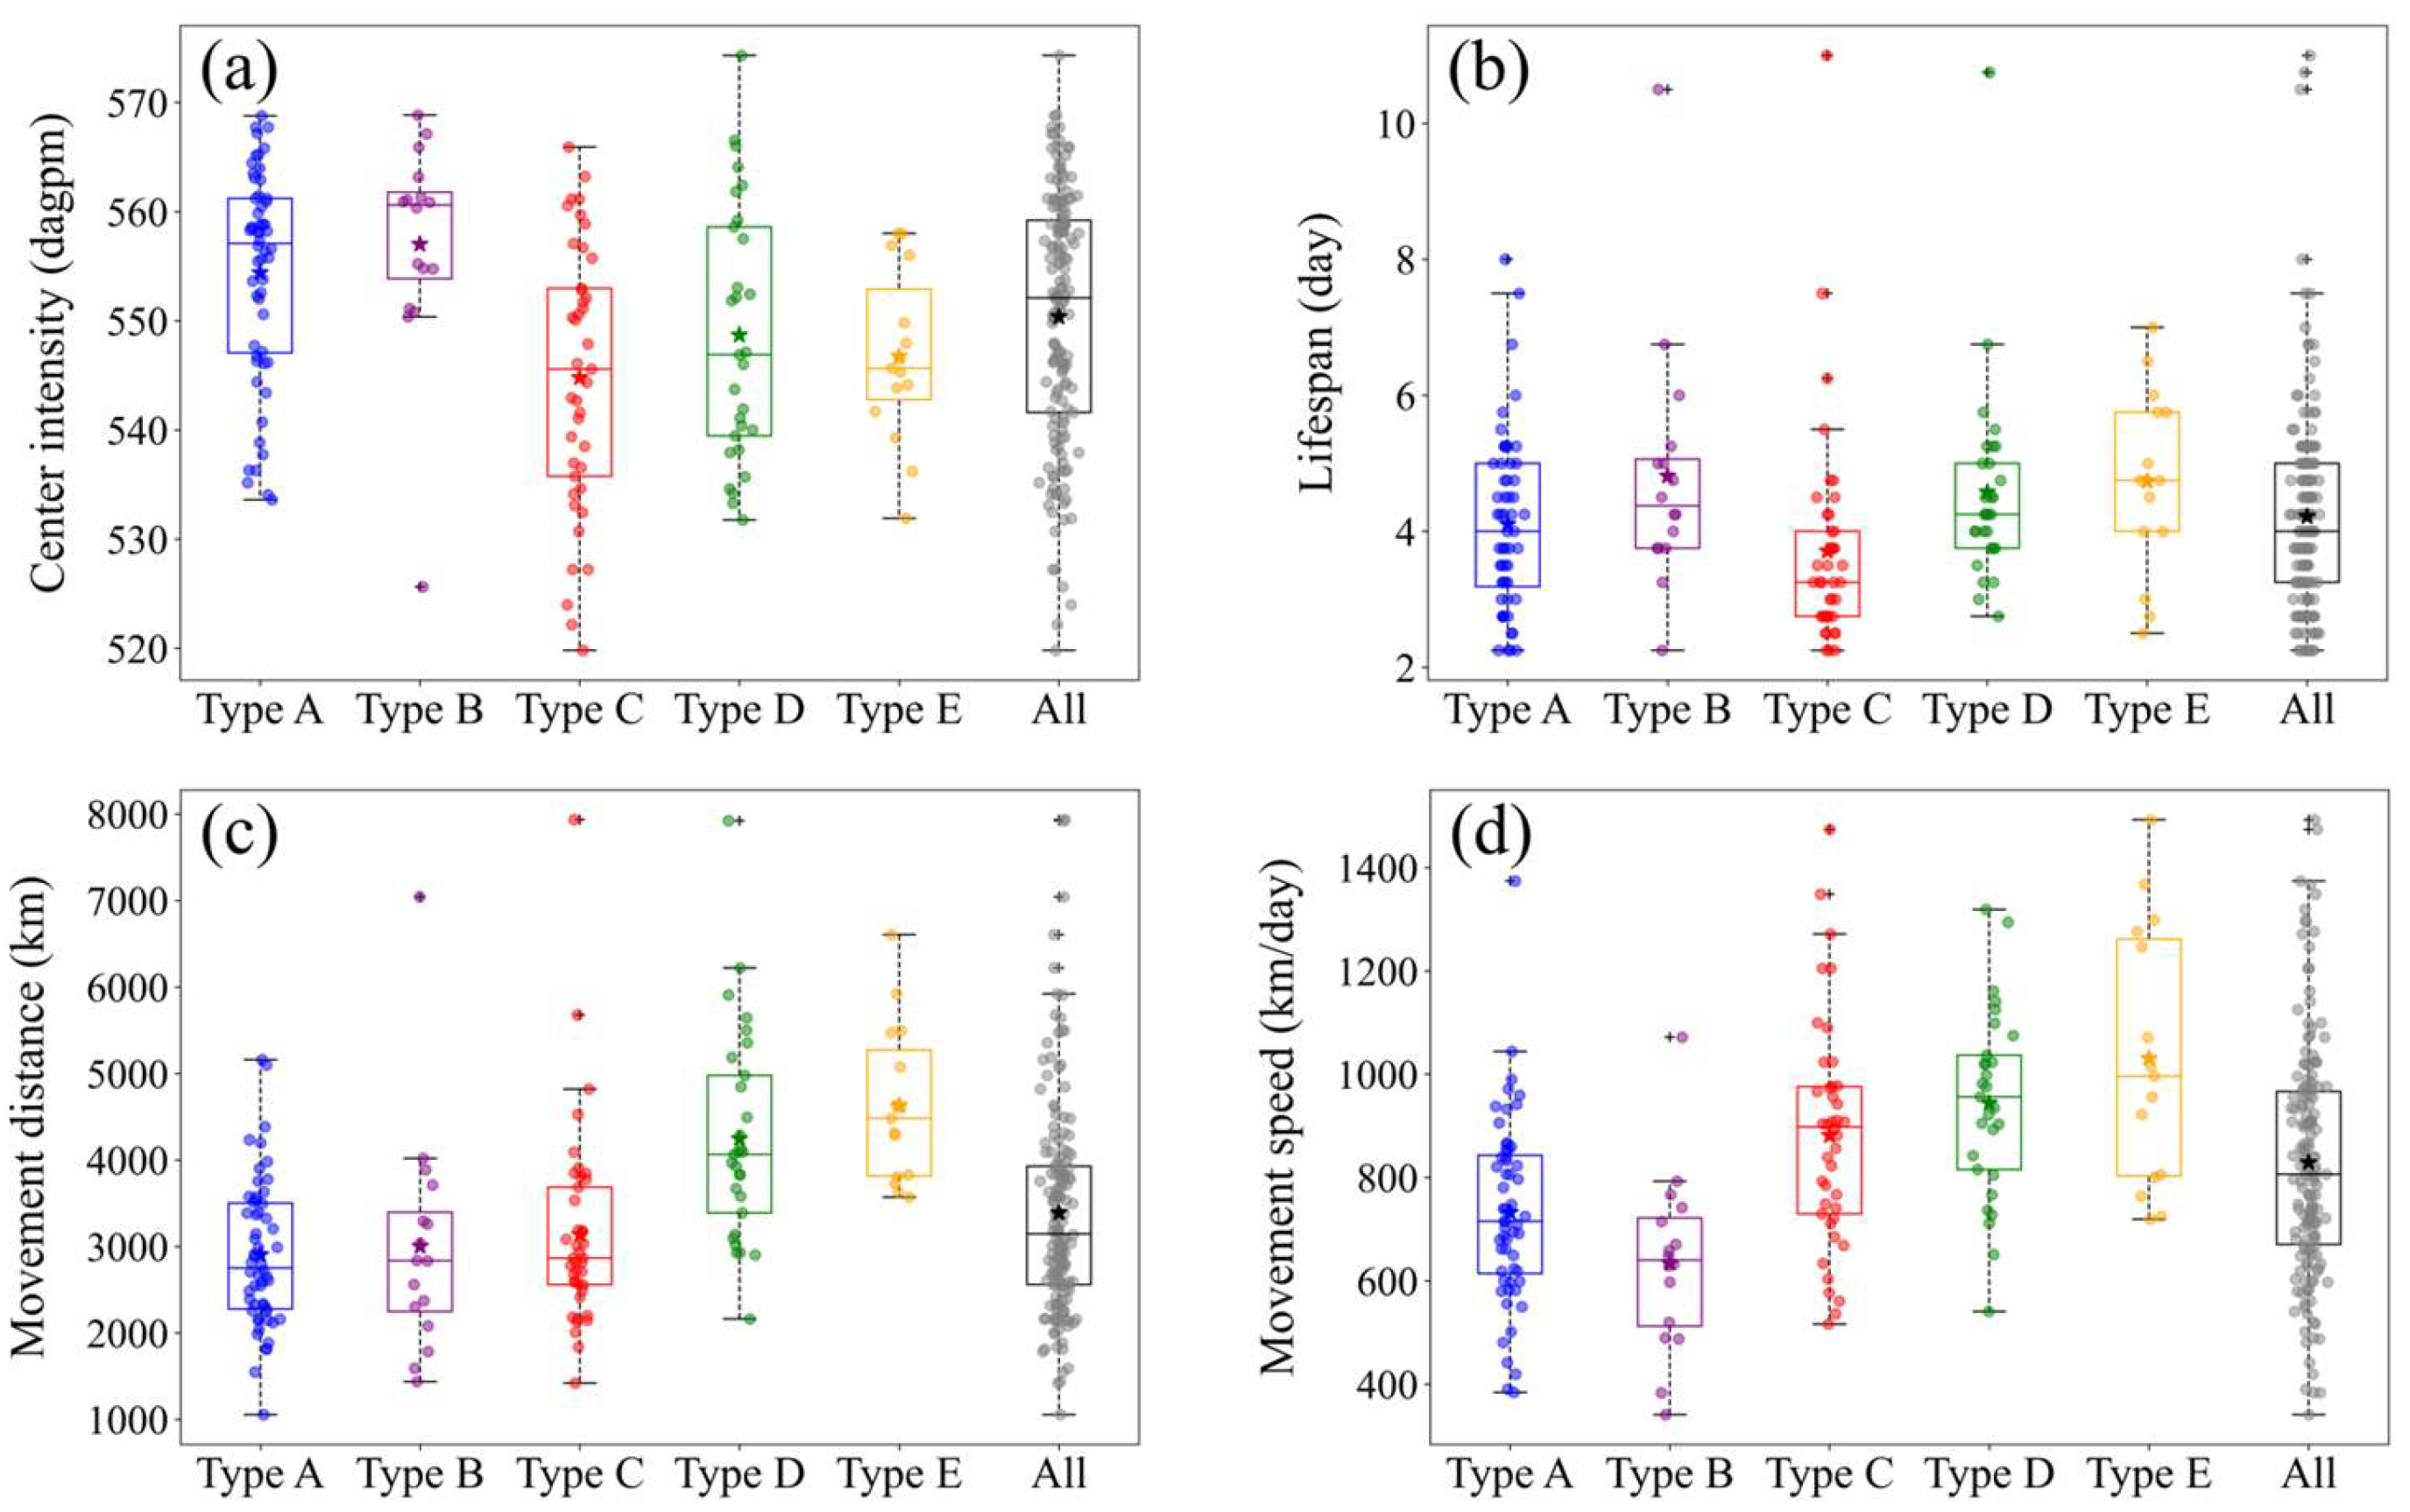
4.1. Center Intensity, Lifespan, Movement Distance and Speed

Figure 7 presents the center intensity, lifespan, movement distance, and movement speed across five types of NCCVs. At 500 hPa, the center intensity (Figure 7a) was represented by the average geopotential height of the NCCV center at each time step along its track. The center intensity for all NCCVs averaged about 550 dagpm, with values ranging from 519 to 574 dagpm. Types A and B NCCVs exhibited weaker center intensity values, particularly type B, which had a median of 560 dagpm. In contrast, type C had a stronger center intensity, with an average value below 545 dagpm. The average lifespan (Figure 7b) for all NCCVs was 4.2 days, ranging from 2 days to 11 days. The type C NCCVs had the shortest lifespan, averaging 3.7 days with a median of 3 days, while the other types had an average lifespan of at least 4 days. Specifically, type A averaged 4 days, type D 4.5 days, and types B and E nearly 5 days. For the movement distance (Figure 7c), the average for all NCCVs was 3400 km, with a range from 1000 km to 8000 km. Types A, B, and C exhibited shorter average movement distances of around 3000 km, while type D moved approximately 4200 km and type E covered the longest distance at 4600 km. In terms of movement speed (Figure 7d), the average for all NCCVs was 800 km/day, with a range of 300 km/day to 1500 km/day. Specifically, type E had the fastest speed, then types D and C, while type B was the slowest.

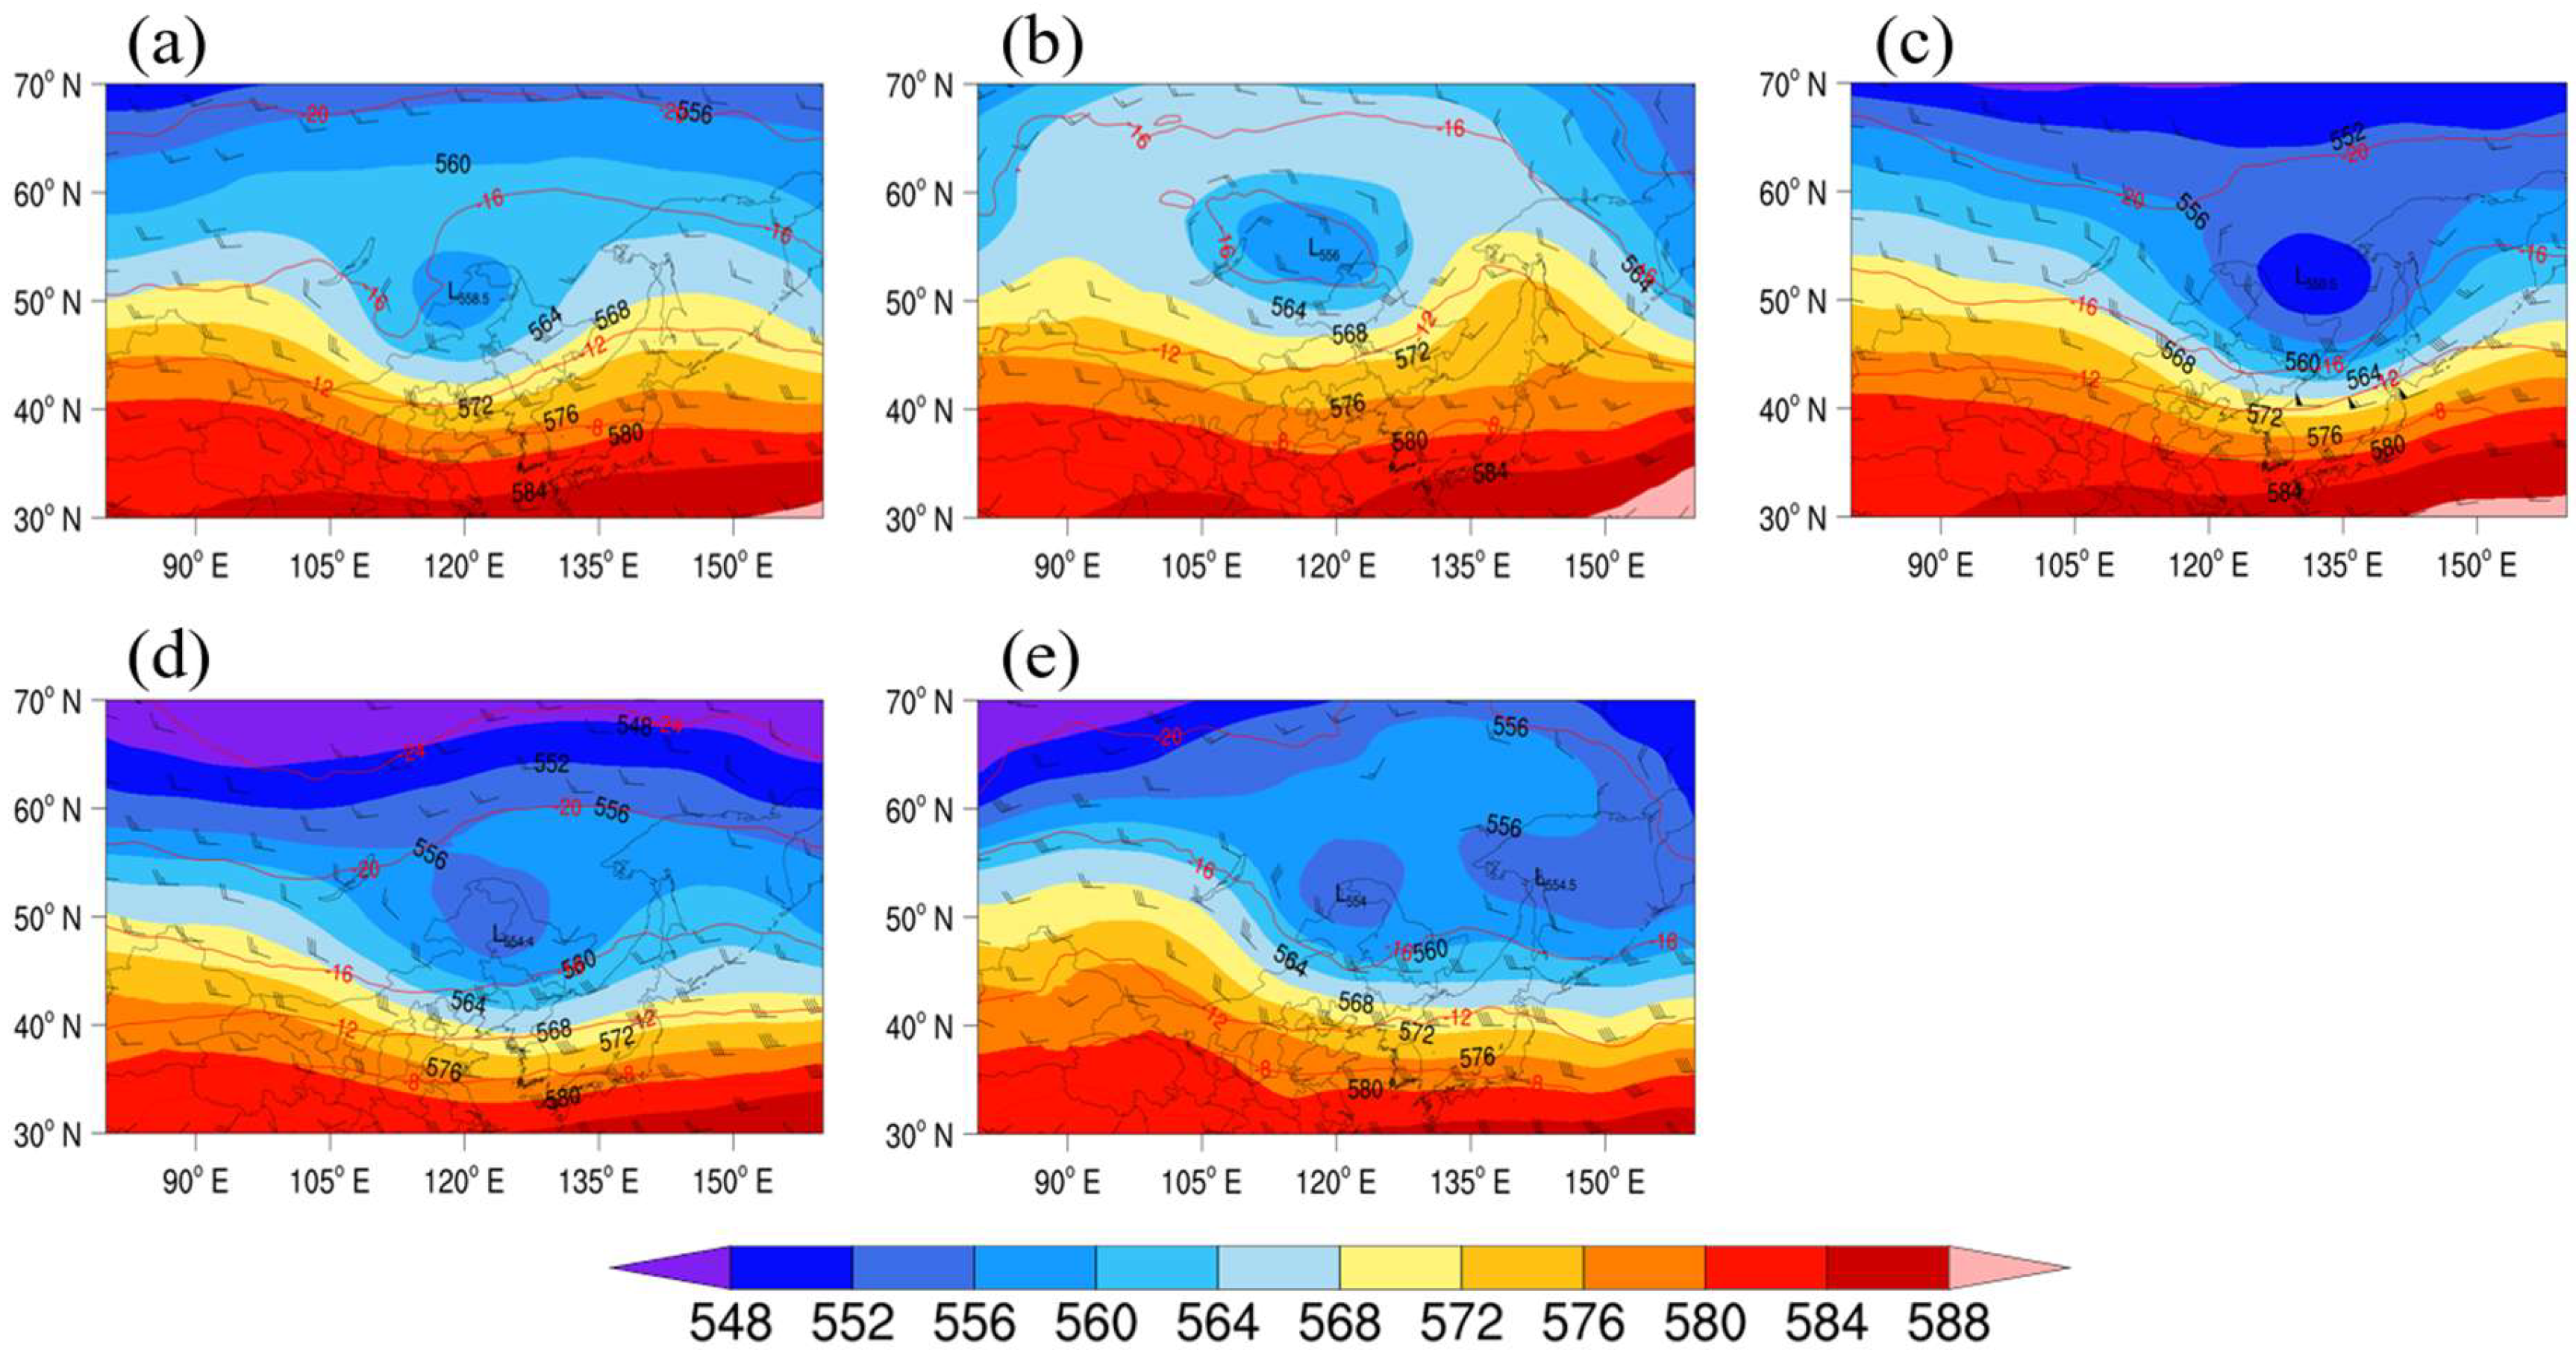
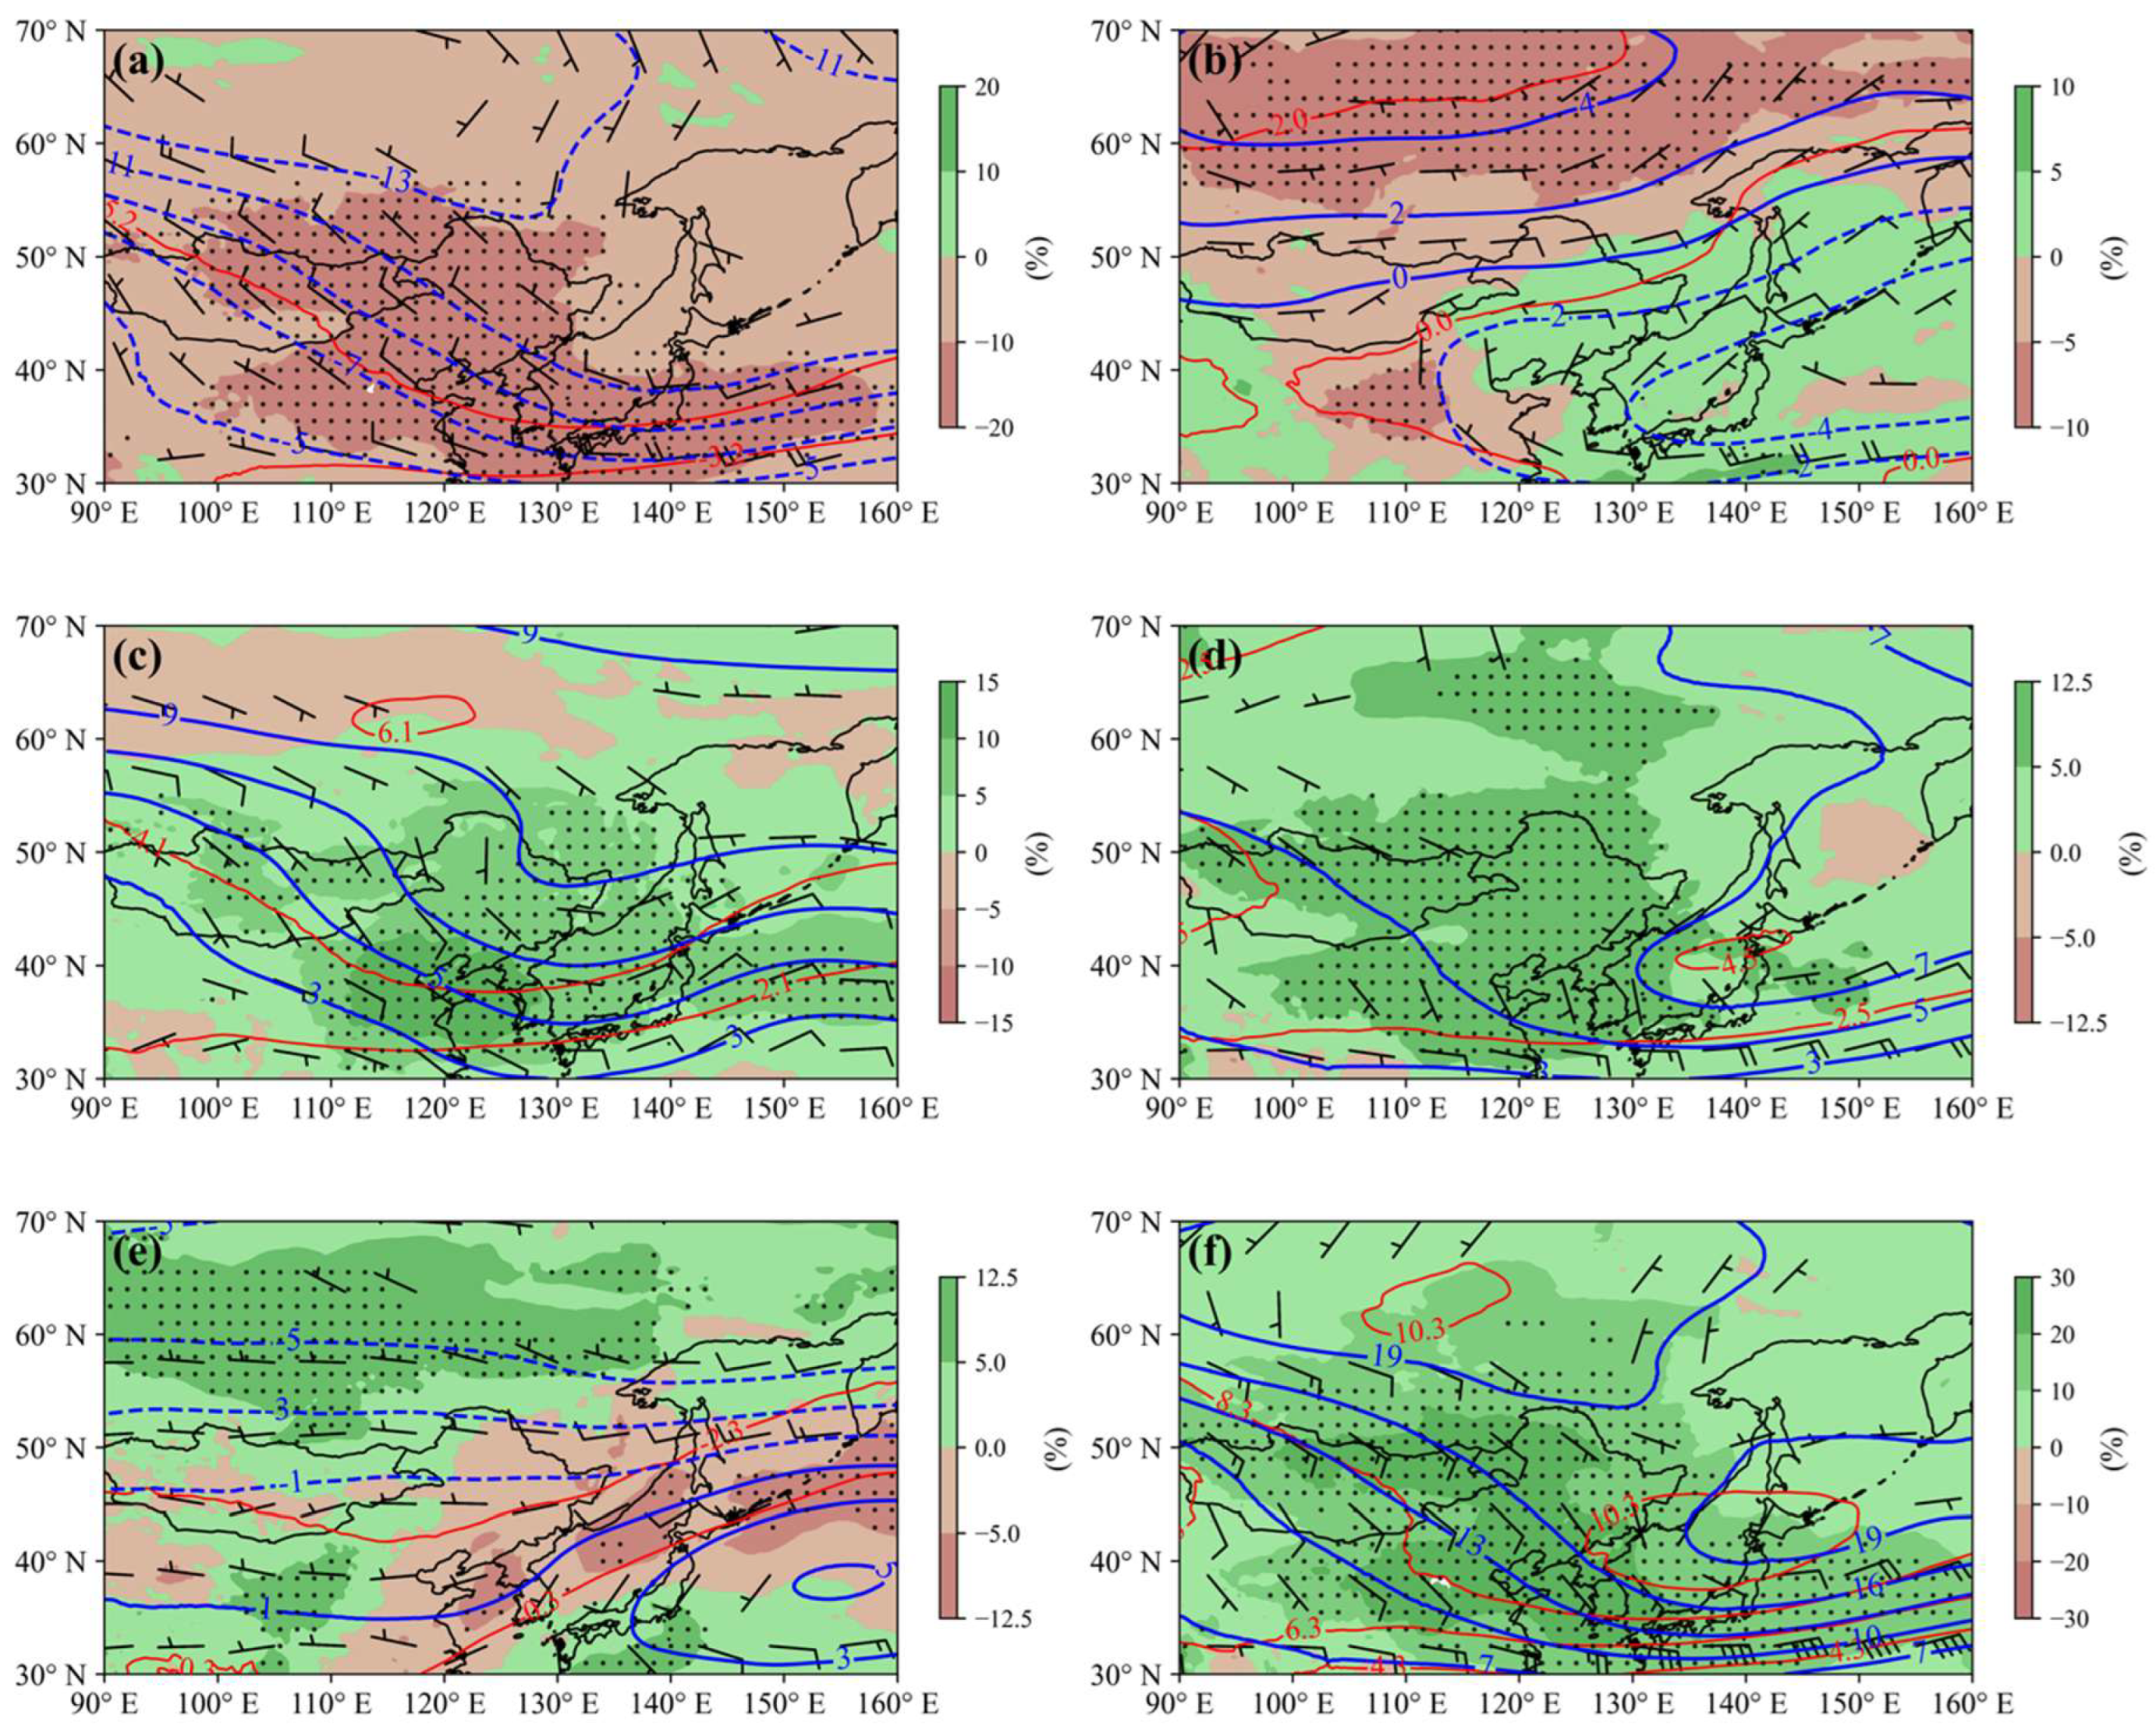
4.2. Circulation Configuration

To explain the potential causes of each NCCV track, Figure 8 presents the composite of the 500 hPa atmospheric circulation at the peak time for five types of NCCVs. For type A NCCVs (Figure 8a), the blocking high (BH) over the Sea of Okhotsk hindered their progression, resulting in a short distance movement, slow speed, and dissipation over Northeast China. For type B (Figure 8b), the BH was stronger and positioned farther northwest than in type A, often causing retrogression after eastward movement (Figure 4b), resulting in the slowest speed and the smallest activity range. The differences in the position and intensity of the BH over the Sea of Okhotsk led to distinct tracks for types A and B. For type C (Figure 8c), the Eastern Siberian region was characterized by an obvious low-pressure system, with the strongest center intensity. Without the BH over the Sea of Okhotsk, the type C NCCVs moved eastward into the ocean at high speed and within a short duration. Influenced by the weak blocking high over Lake Baikal and the Sea of Okhotsk (Figure 8d), type D showed long-distance eastward movement. In contrast, type E (Figure 8e) was associated with the strong BH over Lake Baikal and the low-pressure system over the Sea of Okhotsk, leading to a distinct northwest–southeast direction and the fastest speed. The circulation patterns of these different NCCV track types, particularly their association with BH systems, are largely consistent with the five categories classified by Zhou et al. [30] based on the shape of NCCVs.

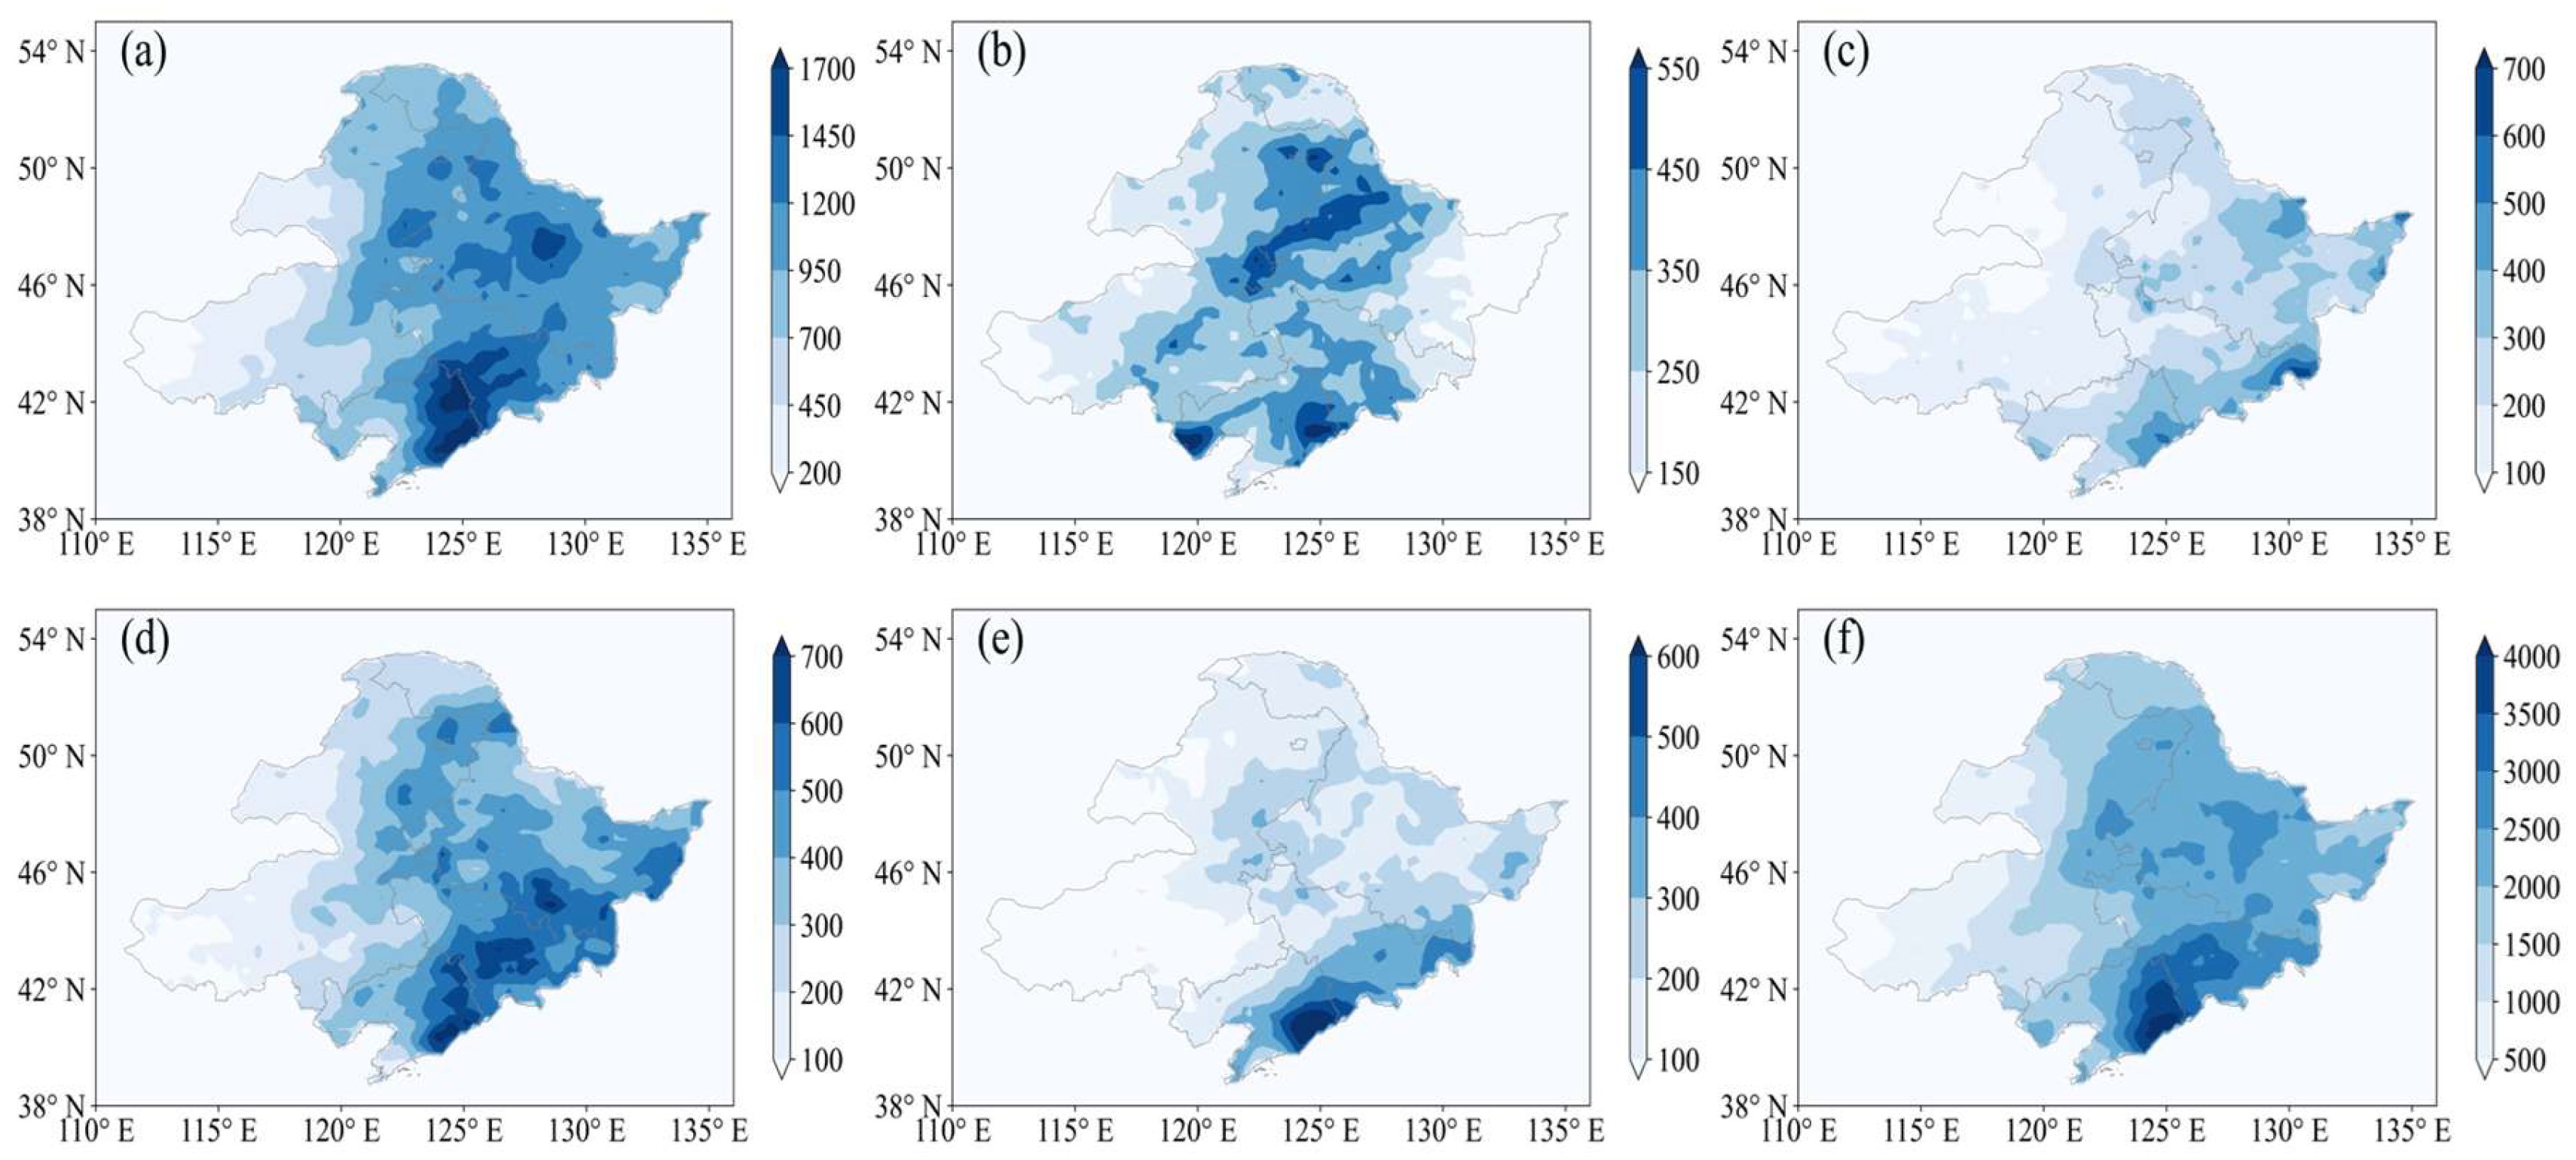
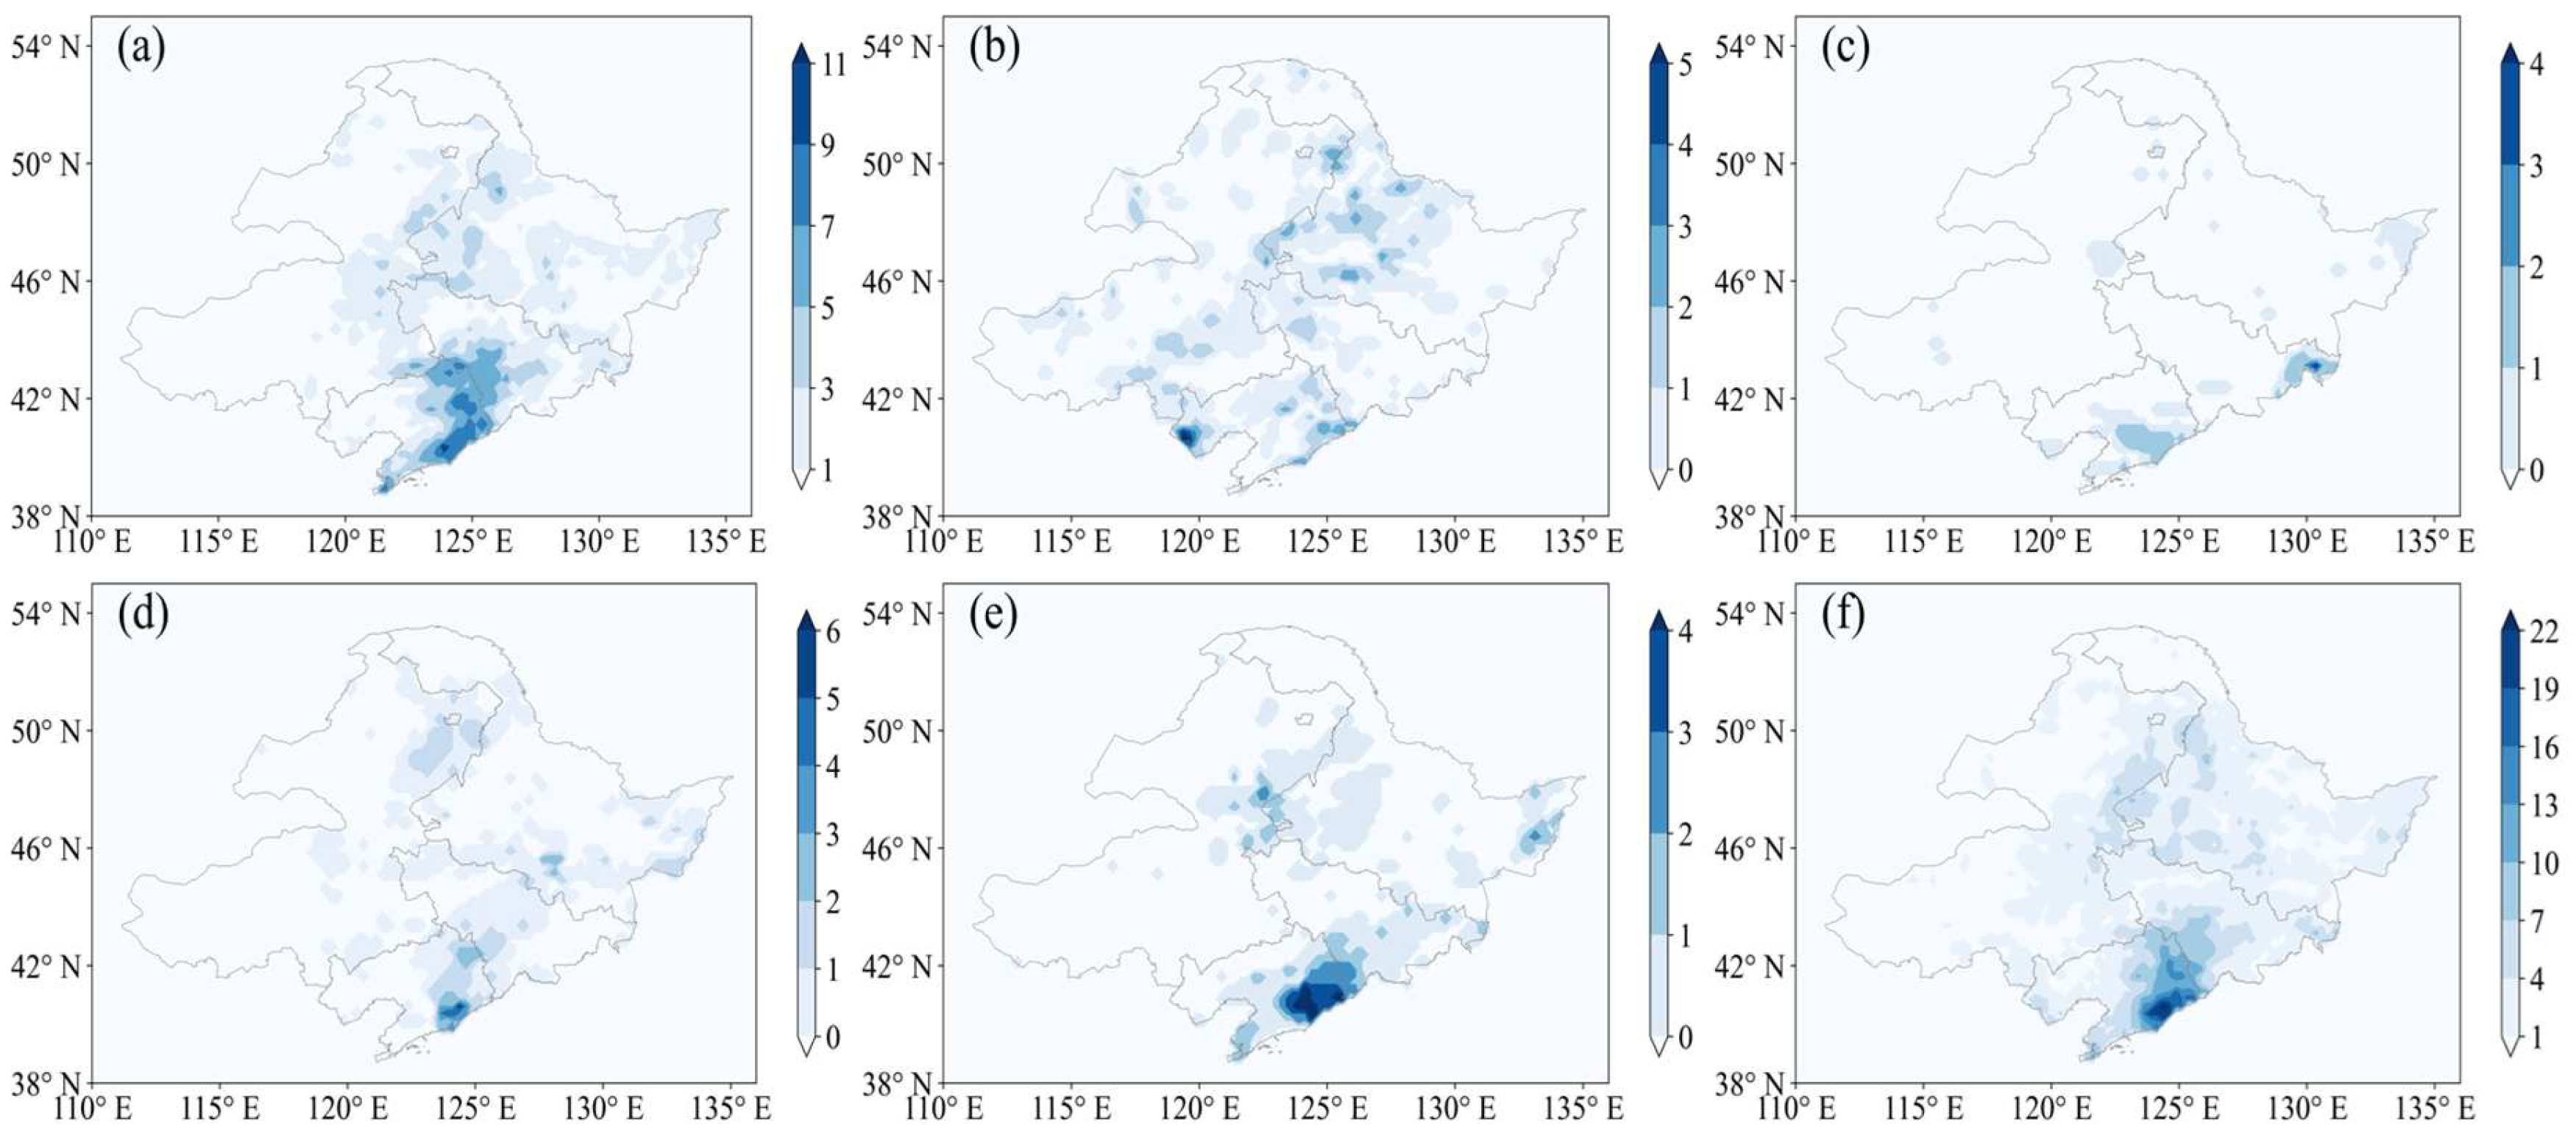
4.3. Precipitation Distribution and Rainstorm Frequency

During the warm season from 2012 to 2022, the NCCVs occurred for 663 days, accounting for 40% of the whole warm season. The distribution of the accumulated precipitation during all NCCV occurrence days (Figure 9f) exhibits a southeast-to-northwest decreasing trend, with the southeastern Liaoning Province marked as the center of heavy precipitation, as previously demonstrated by Huang and Cui [42]. The spatial distributions of the accumulated precipitation in Northeast China, influenced by different NCCV tracks, varied notably, particularly for types A, B, and C. The accumulated precipitation induced by type A NCCVs, which lasted for 230 active days, featured two precipitation centers located in the southeastern Liaoning Province and central Heilongjiang Province. The type B NCCVs (77 days) triggered heavy precipitation in central Northeast China. The type C NCCVs (152 days) rarely caused heavy precipitation but type D (133 days) triggered the distinct rain belt across eastern Northeast China. The precipitation induced by type E (77 days) was concentrated in southeastern Liaoning Province.
As shown by the spatial distribution of cold vortex (CV) rainstorms (≥50 mm/24 h; Figure 10), the southeastern Liaoning Province was a typical high-frequency CV rainstorm area, with up to 24 rainstorm days occurring in the same region. The second-highest frequency occurred along the border between Inner Mongolia and Heilongjiang Province. Influenced by the type A NCCVs, CV rainstorms occurred most frequently in the southeastern Liaoning Province and the southern Jilin Province, with a maximum of 11 rainstorm days. Under the influence of type C NCCVs, CV rainstorms were rare. On the occurrence day of type E NCCVs, the CV rainstorms remained concentrated in the southeastern Liaoning Province.
The precipitation processes were classified into three categories to further analyze the impact of NCCVs on triggering CV rainstorms: low-intensity precipitation (during the NCCV process, total precipitation < 25 mm), moderate-intensity precipitation (total precipitation between 25–50 mm), and high-intensity precipitation, i.e., rainstorm (regional daily precipitation ≥ 50 mm). Table 1 shows that the tracks of types A and B triggered CV rainstorms most frequently, accounting for 44.6% and 56.3%, respectively, indicating that around half of type A and B events can trigger CV rainstorms. Combining the circulation configurations (Figure 8) suggested that the persistence of the strong blocking high (BH) over the Sea of Okhotsk, coupled with the slow movement of the NCCV, could enhance the probability of CV rainstorms in Northeast China. For NCCVs of types C, D, and E, the CV rainstorms occurred 9, 5, and 4 times, respectively, with the lower probability revealing that more attention should be paid to types A and B when forecasting CV rainstorms.

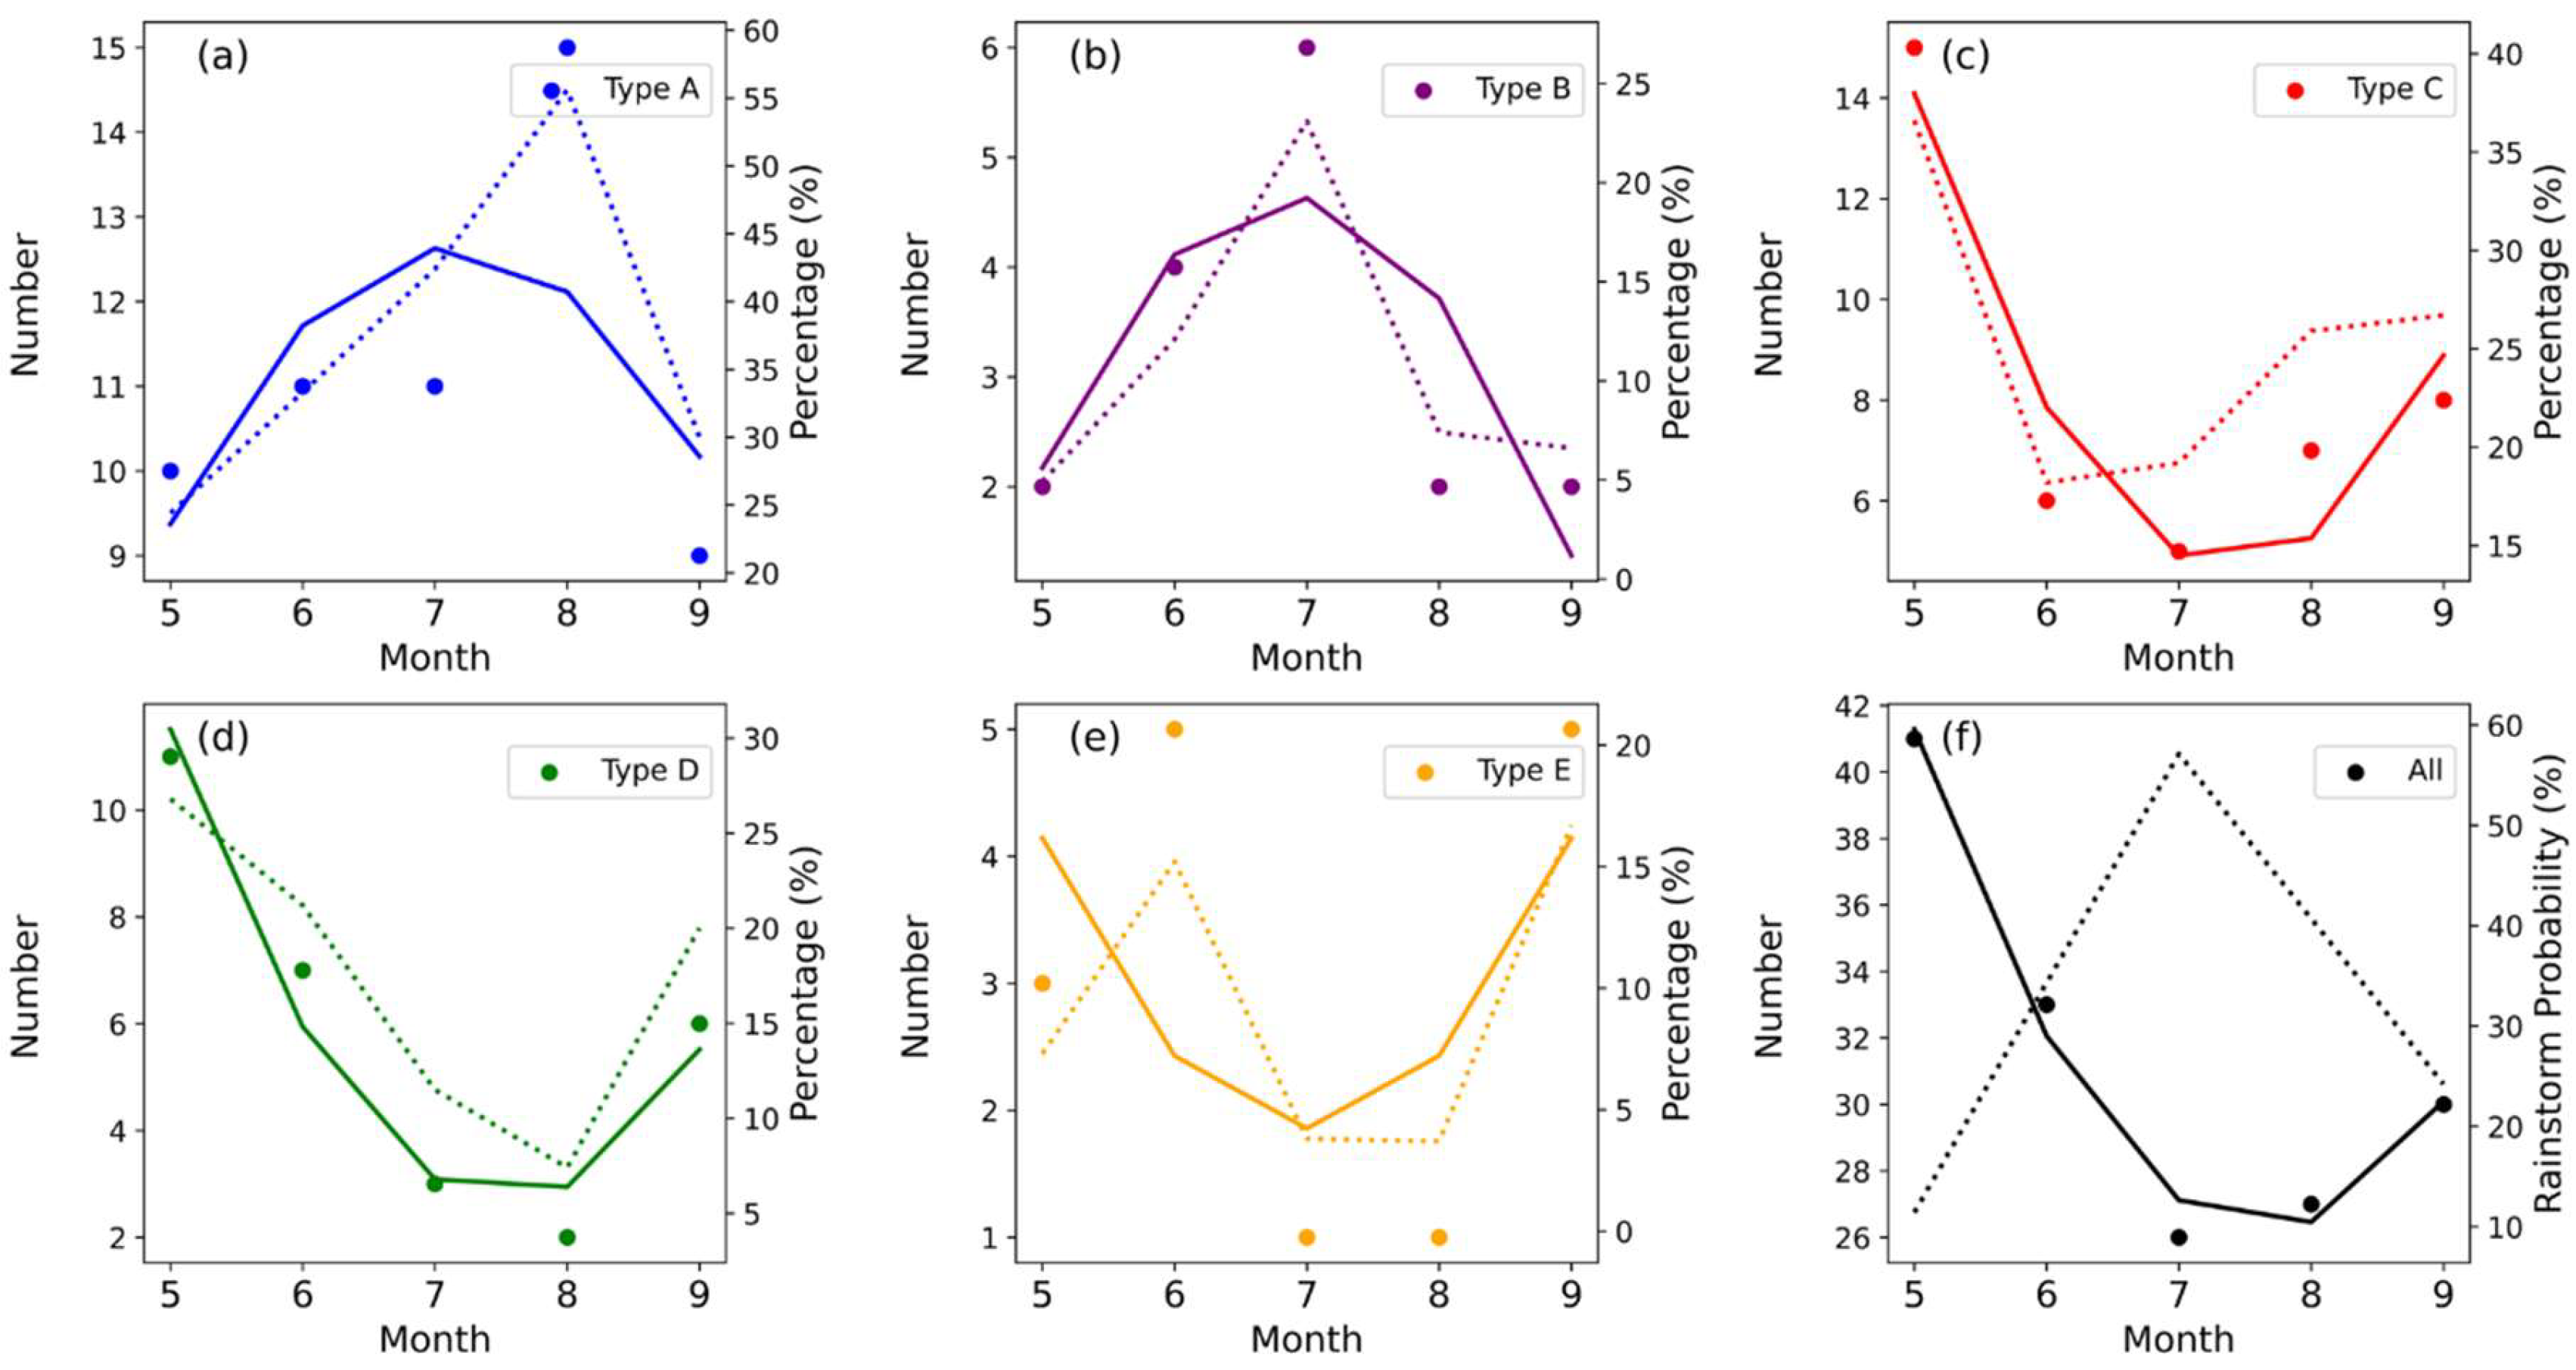
5. Inter-Monthly Variation of Five NCCV Types

As the occurrence times of the NCCVs exhibited diversity, Figure 11 illustrates the inter-monthly variation in the frequency and proportion of five NCCV types. Throughout the decade-long warm season, the NCCVs occurred most frequently in May (41 occurrences) and least frequently in July and August (26 and 27 occurrences, respectively). In June and September, the NCCVs occurred 33 and 30 times, respectively. The total number of NCCVs (Figure 11f) exhibits a clear decreasing trend from May to August, while the occurrence probability of CV rainstorms increased. From a classification perspective, type C NCCVs were most prevalent in May, accounting for nearly 40%, far surpassing the proportions of types A and B. However, the CV rainstorms occurred least frequently, with a probability of only 11%. From May to August, the proportions of types C, D, and E decreased, while those of types A and B increased from less than 30% to 65%. Meanwhile, the probability rates of CV rainstorms increased to 34%, 57%, and 40%, respectively, suggesting that the increases in types A and B mainly contributed to the occurrence of CV rainstorms in Northeast China. However, this trend reversed in September.
To further investigate the inter-monthly variations in the tracks of NCCVs during the warm season, Figure 12 reflects the geopotential height and temperature deviations at 500 hPa, as well as the relative humidity deviation at 850 hPa for each month relative to the average of the whole warm season. In May (Figure 12a), the noticeable negative potential height deviation occurred over Central Siberia, Northeast China, and the Sea of Okhotsk, with the prevalence of northwest winds favoring the formation of NCCVs of types C, D, and E. The humidity at 850 hPa was relatively weak, and the possibility of precipitation was minimal. From June to August (Figure 12b–d), the potential height deviation over Northeast China and the Sea of Okhotsk gradually shifted from negative to positive, accompanied by a positive temperature anomaly. Thus, the BH over the Sea of Okhotsk was strengthened, hindering the eastward movement of the NCCV [43] and favoring the formation of types A and B. Additionally, the wind over Northeast China shifted from northerly to southerly, and the lower-level humidity increased, contributing to precipitation events. The deviations for August relative to May (Figure 12f) more clearly illustrated the adjustment of the circulation pattern. In September (Figure 12e), the subtropical high moved southward, and Northeast China and the Sea of Okhotsk gradually came under the influence of a low-pressure system, promoting the formation of other types of NCCVs. Additionally, the lower-troposphere humidity decreased, coupling with the westerly wind, leading to reduced precipitation.
Therefore, the blocking high (BH) over the Sea of Okhotsk in July and August played the dominant role in increasing the occurrence for types A and B. The strong BH and slow-moving NCCVs strengthened the southerly wind, facilitating the transportation of moisture, making CV rainstorms more likely to occur. This conclusion aligns with the findings of Sun et al. [44] and Liu et al. [45]. The other types of NCCVs primarily occurred in other months when the influence of the BH weakened and the southerly water vapor transport decreased, resulting in reduced precipitation during these periods.

6. Conclusions and Discussion

Considering the active phase (warm season, i.e., May to September) of NCCVs, this study employed the optimized K-means clustering algorithm to classify the 157 NCCV tracks based on ERA5 reanalysis data from 2012 to 2022. Furthermore, the activity characteristics, circulation configuration, rainstorm probability, and inter-monthly variations for each NCCV type were investigated. The main conclusions are as follows:
(1) The K-means clustering algorithm, incorporating intensity weights to optimize the centroid and variance parameters, classified the warm-season NCCV tracks into five types: (A) eastward-moving dissipative, (B) eastward-moving retrogressive, (C) short-range eastward-moving offshore, (D) long-range eastward-moving offshore, and (E) long-range southeastward-moving offshore.
(2) The NCCV tracks were closely linked to the blocking high (BH) configurations. The BH over the Sea of Okhotsk favored the formation of type A NCCVs, which were characterized by slow speeds, a mean lifespan of 4 days, and a rainstorm probability of 44.6%. The stronger BH promoted type B, which retreated westward and had the slowest speed, a longer lifespan (approximately 5 days), and a higher rainstorm probability of 56.3%. The low-pressure circulation over Eastern Siberia favored the fast-moving, short-lived (about 3 days) type C, which rarely triggered rainstorms, with a probability of 9.8%. The weaker BHs over Lake Baikal and the Sea of Okhotsk favored type D, while the stronger BHs over Lake Baikal and low-pressure systems over the Sea of Okhotsk favored type E. Types D and E had longer lifespans (around 4.5 and 5 days), the fastest speed, and a rainstorm probability of 30%, despite differing in movement direction.
(3) Obvious inter-monthly variation existed in the NCCV tracks. In May, type C NCCVs dominated, accounting for approximately 37%. As the subtropical high shifted northward and the BH over the Sea of Okhotsk strengthened in July and August, types A and B replaced type C as the dominant NCCV tracks, together making up about 65%. This shift favored southerly moisture transport, increasing the probability of CV rainstorms in Northeast China.
This study categorized NCCVs occurring during the warm season (May to September) into five distinct types according to their tracks, and confirmed the classifications through examinations of circulation configurations, activity characteristics, and rainstorm probabilities. Furthermore, the study demonstrated that the predominant NCCV tracks during the warm season show notable inter-monthly variations. However, the major track types that occur during the remaining months (e.g., winter) still need to be further explored. Thus, the classification method can introduce more parameters that can represent the tracks and intensity of the NCCVs, so as to conduct in-depth research. Meanwhile, the method used in this study was designed with the adaptability of the research area and subject; thus, it can be extended to other regions and weather systems with appropriate adjustments and parameter additions.

Author Contributions

Conceptualization: J.T. and X.M.; methodology: X.M. and Z.Z.; writing-original draft: J.T., Q.W., and Y.Y.; writing-review and editing: X.M. and Z.Z. All authors have read and agreed to the published version of the manuscript.

Funding

This work was supported by National Natural Science Foundation of China (No. U2242213) and National Key Research and Development Program of China (No. 2021YFC3000902).

Institutional Review Board Statement

Not applicable.

Informed Consent Statement

Not applicable.

Data Availability Statement

The NCCV events dataset is provided by the Key Laboratory of Northeast China Cold Vortex Research and the Liaoning Meteorological Service. The Hourly CMORPH satellite precipitation estimates data can be obtained from NOAA National Centers for Environmental Information (https://doi.org/10.25921/w9va-q159). The ERA5 reanalysis data are available through the ECMWF (https://cds.climate.copernicus.eu/datasets) (all accessed on 1 November 2023).

Conflicts of Interest

The authors declare no conflicts of interest.

References

  1. Liu, H.B.; Wen, M.; He, J.H.; Zhang, R.H. Characteristics of the Northeast Cold Vortexat Intraseasonal Time Scale and Its Impact. Chin. J. Atmos. Sci. 2012, 36, 959–973. (In Chinese) [Google Scholar]
  2. Zhang, C.; Zhang, Q.; Wang, Y.; Liang, X. Climatology of warm season cold vortices in East Asia: 1979–2005. Meteorol. Atmos. Phys. 2008, 100, 291–301. [Google Scholar] [CrossRef]
  3. Sun, L.; Zheng, X.Y.; Wang, Q. The climatological characteristics of the northeast cold vortexin China. J. Appl. Meteorol. Sci. 1994, 5, 297–303. (In Chinese) [Google Scholar]
  4. Hu, K.X.; Lu, R.Y.; Wang, D.H. Seasonal climatology of cut-off lows and associated precipitation patterns over Northeast China. Meteorol. Atmos. Phys. 2010, 106, 37–48. [Google Scholar] [CrossRef]
  5. Wang, C.W.; Xu, H.M.; Ren, L.; Chen, L. The objective identification method of northeast cold vortex. J. Meteorol. Environ. 2012, 28, 1–4. (In Chinese) [Google Scholar]
  6. Sun, L.; An, G.; Lian, Y.; Shen, B.Z.; Tang, X.L. A study of the persistent activity of northeast cold vortex in summer and its general circulationanomaly characteristics. Acta Meteorol. Sin. 2000, 58, 704–714. (In Chinese) [Google Scholar]
  7. Chen, C.; Xie, Z.; Xiao, T.; Cheng, Z.; Bueh, C.; Li, S.; Yang, X. Key Circulation Patterns and Mechanisms of the Low Temperature Caused by Northeast China Cold Vortex. Chin. J. Atmos. Sci. 2023, 49, 1–14. (In Chinese) [Google Scholar]
  8. Liu, G.; Qu, M.H.; Feng, G.L.; Chu, Q.C.; Cao, J.; Yang, J.; Cao, L.; Feng, Y. Application study of monthly precipitation forecast in Northeast China based on the cold vortex persistence activity index. Theor. Appl. Climatol. 2019, 135, 1079–1090. [Google Scholar]
  9. Shen, B.Z.; Lin, Z.D.; Lu, R.Y.; Lian, Y. Circulation anomalies associated with interannual variation of early-and late-summer precipitation in Northeast China. Sci. China Earth Sci. 2011, 54, 1095–1104. (In Chinese) [Google Scholar] [CrossRef]
  10. Liu, G.; Feng, G.L.; Qin, Y.L.; Zeng, Y.X.; Yang, X.; Yao, S. “Cumulative Effect” of Cold Vortex Precipitation in Northeast China in Early Summer. Chin. J. Atmos. Sci. 2017, 41, 202–212. (In Chinese) [Google Scholar]
  11. Gao, J.; Gao, H. Influence of the northeast cold vortex on flooding in northeast China in summer 2013. J. Meteorol. Res. 2018, 32, 172–180. [Google Scholar] [CrossRef]
  12. Hu, P.; Xie, Z.; Zhou, T.; Bueh, C. Analysis of Water Vapor Transport and Trigger Mechanisms for Severe Rainstorms Associated with a Northeast China Cold Vortex in 2022. Atmosphere 2023, 14, 1363. [Google Scholar] [CrossRef]
  13. Sun, J.H.; Zhou, Y.S.; Fu, S.M.; Yang, S.; Zhang, Y.C.; Wang, H.J.; Huang, Y. Progress on Vortices in China in the Past Ten Years. Chin. J. Atmos. Sci. 2024, 48, 228–260. (In Chinese) [Google Scholar]
  14. Yang, L.; Zheng, Y.G. Observational characteristics of thunderstorm gusts in Northeast China and their association with the Northeast China Cold Vortex. Acta Meteorol. Sin. 2023, 81, 416–429. (In Chinese) [Google Scholar]
  15. Hu, P.Y.; Xu, S.; Geng, S.B.; Chen, C.L.; Su, C.; Chen, S.Y. Characteristic analysis of thunderstorm gale process in Shenyang under a background of cold vortex. J. Meteorol. Environ. 2023, 39, 9–18. (In Chinese) [Google Scholar]
  16. Duan, Y.X.; Li, D.Q.; Ji, Y.M.; Ban, W.L.; Wu, Y.T.; Li, X.O. Analysis of strong precipitation in the urban area of Shenyang under the Northeast Cold Vortex background. J. Meteorol. Environ. 2022, 39, 9–18. (In Chinese) [Google Scholar]
  17. Qian, W.H.; Ai, Y.; Chen, X.C. Anomalous synoptic environments of a strong convective process with tornado in Kaiyuan City, Liaoning Province. Chin. J. Geophys. 2021, 64, 1531–1541. (In Chinese) [Google Scholar]
  18. Zhang, G.L.; Chang, X.; Huang, X.L.; Zi, Y.H.; Li, R.Q.; Liang, F.J. The Environmental Conditions and Radar Echo Characteristics of the Super Cell Storm under the Background of the Northeast Cold Vortex. Plateau Meteorol. 2018, 37, 1364–1374. [Google Scholar]
  19. He, L.Y.; Ma, N.; Guo, J. The impact of the Northeast Cold Vortex on early summer precipitation anomalies in the Haihe River Basin. Chin. J. Geophys. 2017, 60, 3745–3752. (In Chinese) [Google Scholar]
  20. Hao, L.S.; He, L.Y.; Ma, N. Climatic characteristics of northeast cold vortex and its impact on summer precipitation in the Haihe river basin. Acta Meteorol. Sin. 2023, 81, 559–568. (In Chinese) [Google Scholar]
  21. He, J.H.; Wu, Z.W.; Jiang, Z.H.; Miao, C.S.; Hang, G.R. Climate effect of north-east cold vortex and its influences on Meiyu. Chin. Sci. Bull. 2006, 51, 2803–2809. (In Chinese) [Google Scholar]
  22. Wang, L.J.; He, J.H.; Si, D.; Wen, M.; Zhong, S.S. Analysis of Impacts of Northeast Cold Vortex Processes on Meiyu Rainfall Period over Yangtze-Huaihe River Basin. Trans. Atmos. Sci. 2010, 33, 89–97. (In Chinese) [Google Scholar]
  23. Chen, H.; Xie, Z.; He, X.; Zhao, X.; Gao, Z.; Wu, B.; Zhang, J.; Zou, X. Northeast China Cold Vortex Amplifies Extreme Precipitation Events in the Middle and Lower Reaches Yangtze River Basin. Atmosphere 2024, 15, 819. [Google Scholar] [CrossRef]
  24. Miao, C.S.; Wu, Z.W.; He, J.H.; Chi, Y.Z. The anomalous features of the northeast cold vortex during the first flood period in the last 50 years and its correlation with rain-fall in South China. Chin. J. Atmos. Sci. 2006, 30, 1249–1256. (In Chinese) [Google Scholar]
  25. Jiang, D.K.; Wang, J.S.; Yan, Q.; Wang, P.; Lu, Z.Y. Climatic characters of northeast cold vortex and its effect on air temperature in Liaoning province from May to September during 1961–2010. J. Meteorol. Environ. 2012, 28, 5–9. (In Chinese) [Google Scholar]
  26. Xie, Z.W.; Bueh, C. Low frequency characteristics of northeast China cold vortex and its background circulation pattern. Acta Meteorol. Sin. 2012, 70, 704–716. (In Chinese) [Google Scholar]
  27. Xie, Z.W.; Bueh, C. Different Types of Cold Vortex Circulations over Northeast China and Their Weather Impacts. Mon. Weather Rev. 2015, 143, 845–863. [Google Scholar] [CrossRef]
  28. Lian, Y.; Shen, B.Z.; Li, S.F.; Liu, G.; Yang, X. Mechanisms for the formation of Northeast China cold vortex and its activities and impacts: An overview. J. Meteorol. Res. 2016, 30, 881–896. [Google Scholar] [CrossRef]
  29. Sun, L.; Wang, Q.; Tang, X.L. A composite diagnostic analysis of cold vortex of storm rainfall and non-storm rainfall Types. Meteorol Mon. 1995, 21, 7–10. (In Chinese) [Google Scholar]
  30. Zhou, T.; Xie, Z.; Bueh, C.; Chen, L.; Li, S.; Yang, X. Evaluation of spatial-temporal features and circulation patterns of Northeast China cold vortex in CMIP6 AMIP simulations. Clim. Dyn. 2023, 61, 5653–5671. [Google Scholar] [CrossRef]
  31. Fang, Y.H.; Zhao, C.Y.; Li, Y.; Guo, T.T.; Li, J.W.; Lin, Y.T.; Qin, M.O.; Yu, Y.Q. A review on climatological research of cold vortex in Northeast China. J. Meteorol. Environ. 2022, 38, 92–99. (In Chinese) [Google Scholar]
  32. Camargo, S.J.; Robertson, A.W.; Gaffney, S.J.; Smyth, P.; Ghil, M. Cluster Analysis of Typhoon Tracks. Part I: General Properties. J. Clim. 2007, 20, 3635–3653. [Google Scholar] [CrossRef]
  33. Nakamura, J.; Lall, U.; Kushnir, Y.; Camargo, S.J. Classifying North Atlantic Tropical Cyclone Tracks by Mass Moments. J. Clim. 2009, 22, 5481–5494. [Google Scholar] [CrossRef]
  34. Zheng, Y.Q.; Yu, J.H.; Wu, Q.S.; Lin, J.H.; Gong, Z.B. K-means Clustering Method for Classification of the Northwestern Pacific Tropical Cyclone. J. Trop. Meteorol. 2013, 29, 607–615. (In Chinese) [Google Scholar]
  35. Peng, Y.H.; Yi, D.J.; Wang, T.; Wang, S.; Liu, B. Clustering analysis of typhoon track in the North-west Pacific Ocean. Mar. Forecasts 2019, 36, 63–70. (In Chinese) [Google Scholar]
  36. Yin, Y.F.; Yong, Y.Y. K-means Cluster Analysis on Track of Typhoons in the South China Sea. J. Agric. Catastrophol. 2023, 13, 135–137. (In Chinese) [Google Scholar]
  37. Fang, Y.H.; Chen, H.S.; Lin, Y.; Zhao, C.Y.; Lin, Y.T.; Zhou, F. Classification of Northeast China Cold Vortex Activity Paths in Early Summer Based on K-means Clustering and Their Climate Impact. Adv. Atmos. Sci. 2021, 38, 400–412. [Google Scholar] [CrossRef]
  38. Lin, Y.T.; Fang, Y.H.; Zhao, C.Y.; Gong, Z.Q.; Yang, S.Q.; Yu, Y.Q. The Coordinated Influence of Indian Ocean Sea Surface Temperature and Arctic Sea Ice on Anomalous Northeast China Cold Vortex Activities with Different Paths during Late Summer. Adv. Atmos. Sci. 2023, 40, 62–77. [Google Scholar] [CrossRef]
  39. Hersbach, H.; Bell, B.; Berrisford, P.; Hirahara, S.; Horányi, A.; Muñoz-Sabater, J.; Nicolas, J.; Peubey, C.; Radu, R.; Schepers, D. The ERA5 global reanalysis. Q. J. R. Meteorol. Soc. 2020, 146, 1999–2049. [Google Scholar] [CrossRef]
  40. Zhang, F.Q. Computer Recognition of Northeast Cold Vortex. Meteorol. Mon. 2001, 27, 46–49. (In Chinese) [Google Scholar]
  41. Maaten, L.; Hinton, G. Visualizing data using t-SNE. J. Mach. Learn. Res. 2008, 9, 2579–2605. [Google Scholar]
  42. Huang, L.J.; Cui, X.P. Statistical Characteristics of the Northeast China Cold Vortex and Its Impact on Precipitation Distribution from 2000 to 2019. Chin. J. Atmos. Sci. 2023, 47, 1925–1938. (In Chinese) [Google Scholar]
  43. Liang, H.; Wang, Y.; Guo, Z.Q. The teleconnection relationship between the northeast cold vortex and the subtropical high, the Okhotsk high in summer. J. Meteorol. Sci. 2009, 6, 793–796. (In Chinese) [Google Scholar]
  44. Sun, L.; An, G.; Gao, Z.T.; Tang, X.L.; Ding, L.; Shen, B.Z. A composite diagnostic study of heavy rain caused by the northeast cold vortex over Songhuajiang-Nenjiang River Basin in summer of 1998. J. Appl. Meteorol. Sci. 2002, 13, 156–162. (In Chinese) [Google Scholar]
  45. Liu, G.; Feng, G.L.; Qin, Y.L.; Cao, L.; Yao, H.W.; Liu, Z.Q. Activity of cold vortex in northeastern China and its connection with the characteristics of precipitation and circulation during 1960–2012. J. Geogr. Sci. 2015, 25, 1423–1438. [Google Scholar] [CrossRef]
Figure 1. A conceptual graph of K-means clustering algorithm.
Atmosphere 16 00554 g001
Figure 2. The NCCV process during the warm season (May to September) from 2012 to 2022: (a) activity tracks (black solid lines); (b) original positions (red dots); (c) peak positions (green dots); (d) ultimate positions (blue crosses) across the study region (35–60° N, 105–145° E).
Atmosphere 16 00554 g002
Figure 3. The mean silhouette value (a) and the number of negative silhouette values (b) across the number of clusters.
Atmosphere 16 00554 g003
Figure 4. Optimized K-means clustering results of NCCV tracks: (a) type A; (b) type B; (c) type C; (d) type D; (e) type E; (f) average track for each type.
Atmosphere 16 00554 g004
Figure 5. The spatial distribution of the clustered NCCV track data.
Atmosphere 16 00554 g005
Figure 6. Centroids and variance ellipses of NCCV tracks: (a) type A; (b) type B; (c) type C; (d) type D; (e) type E; (f) mean centroid and variance ellipse for each type.
Atmosphere 16 00554 g006
Figure 7. Box plots of (a) center intensity, (b) lifespan, (c) movement distance, and (d) speed for each type and for all NCCVs. The upper and lower bounds of the boxes represent the 75th and 25th percentiles, respectively; short solid lines and asterisks show the median and the mean values; short lines outside the boxes show the bounds, while plus signs show the outliers.
Atmosphere 16 00554 g007
Figure 8. Composite of the 500 hPa atmospheric circulation at the peak time of (a) type A, (b) type B, (c) type C, (d) type D, and (e) type E NCCVs. The shaded area indicates the geopotential height, the red line indicates the temperature, and the wind plume indicates the wind (>6 m/s).
Atmosphere 16 00554 g008
Figure 9. Spatial distribution of accumulated precipitation (mm) during the period of (a) type A, (b) type B, (c) type C, (d) type D, (e) type E, and (f) all NCCVs.
Atmosphere 16 00554 g009
Figure 10. Spatial distribution of CV rainstorms during the period of (a) type A, (b) type B, (c) type C, (d) type D, (e) type E, and (f) all NCCVs.
Atmosphere 16 00554 g010
Figure 11. Monthly variations of NCCVs: (a) type A, (b) type B, (c) type C, (d) type D, (e) type E, and (f) all NCCVs. Scatter point represents the quantity, dashed line represents the proportion, and solid line represents the trend.
Atmosphere 16 00554 g011
Figure 12. The deviations for May (a), June (b), July (c), August (d), and September (e) relative to the average for the whole warm season and for August relative to May (f). The red solid line indicates a 500 hPa temperature deviation, the blue solid (dashed) line indicates a 500 hPa positive (negative) geopotential height deviation, and shaded indicates an 850 hPa humidity deviation, while black dots indicate regions above the 99% confidence level.
Atmosphere 16 00554 g012
Table 1. Precipitation statistics for each NCCV type.
TypeNumberLow-IntensityModerate-IntensityHigh-IntensityRainstorm Probability
A564272544.6%
B1625956.3%
C41172049.8%
D29416931%
E1537533.3%
Disclaimer/Publisher’s Note: The statements, opinions and data contained in all publications are solely those of the individual author(s) and contributor(s) and not of MDPI and/or the editor(s). MDPI and/or the editor(s) disclaim responsibility for any injury to people or property resulting from any ideas, methods, instructions or products referred to in the content.

