Article

Drivers of PM10 Retention by Black Locust Post-Mining Restoration Plantations

by
Chariton Sachanidis
1,
Mariangela N. Fotelli
2,*,
Nikos Markos
2,
Nikolaos M. Fyllas
3 and
Kalliopi Radoglou
1
1
Department of Forestry and Management of the Environment and Natural Resources, Democritus University of the Thrace, GR-68200 Orestiada, Greece
2
Forest Research Institute, Hellenic Agricultural Organization Dimitra, Vassilika, GR-57006 Thessaloniki, Greece
3
Section of Ecology and Taxonomy, Department of Biology, National and Kapodistrian University of Athens. GR-15772 Athens, Greece
*
Author to whom correspondence should be addressed.
Atmosphere 2025, 16(5), 555; https://doi.org/10.3390/atmos16050555
Submission received: 22 March 2025 / Revised: 16 April 2025 / Accepted: 25 April 2025 / Published: 7 May 2025
(This article belongs to the Special Issue Dispersion and Mitigation of Atmospheric Pollutants)

Abstract

:
Atmospheric pollution due to an increased particulate matter (PM) concentration imposes a threat for human health. This is particularly true for regions with intensive industrial activity and nature-based solutions, such as tree plantations, are adopted to mitigate the phenomenon. Here, we report on the case of the lignite complex of western Macedonia (LCWM), the largest in Greece, where extensive Robinia pseudoacacia L. plantations have been established during the last 40 years for post-mining reclamation, but their PM retention capacity and the controlling parameters have not been assessed to date. Thus, during the 2021 growth season (May to October), we determined the PM10 capture by leaves sampled twice per month, across four 10-m long transects, each consisting of five trees, and at three different heights along the tree canopy. During the same period, we also measured the leaf area index (LAI) of the plantations and collected climatic data, as well as data on PM10 production by the belt conveyors system, the main polluting source at the site. We estimated that the plantations’ foliage captures on average c. 42.85 μg cm−2 PM10 and we developed a robust linear model that describes PM10 retention on a leaf area basis, as a function of PM10 production, LAI (a proxy of seasonal changes in leaf area), distance from the emitting source, and wind speed and foliage height within the crown. The accuracy of the estimates and the performance of the model were tested with the bootstrap cross-validate resampling technique. PM10 retention increased in spring and early summer following the increase in LAI, but its peak in August and October was controlled by the highest PM10 production, due to elevated energy demands. Moreover, PM10 retention was facilitated by wind speed, and it was higher at the lower part of the trees’ canopy. On the contrary, the PM10 load on the trees’ foliage decreased with an increasing distance from the conveyor belt system and the frontline of the plantations. Our findings support the positive role of R. pseudoacacia plantations for PM10 retention at heavily polluted areas, such as the lignite mines in Greece, and provide a model for the estimation of PM10 retention by their foliage based on basic environmental drivers and characteristics of the plantations, which could be helpful for planning their future management.

1. Introduction

A significant proportion of the population in Europe (73%) lives in environments where pollutant concentrations often exceed the limits set by regulations [1]. Air pollution due to particulate matter (PM) worsens air quality and threatens human health. Thus, PM is considered one of the main health risks for European citizens, particularly in urban areas and close to industry complexes, and it is classified as a very dangerous contaminant, according to the International Agency for Research on Cancer [2]. In addition, increased PM emissions have negative impacts on natural ecosystems, like reduced tree growth and biodiversity due to the loss of sensitive species [3]. Among PM categories, PM10 stands for particulate matter with a diameter of 10 µm or less, emitted mainly by the combustion of solid fuels for domestic and industrial activities. Currently, the concentration of PM10 in Greece and other eastern European countries are above the EU daily limit thresholds [4].
Forests, forest trees plantations, and even tree lines are often used as nature-based solutions to improve air quality by retaining PM10 [5,6,7]. Such an approach has been implemented at the open-cast mines of the Lignite Center of Western Macedonia (LCWM), Greece, during the last 40 years. LCWM is a complex of surface lignite mines that belongs to the Hellenic Public Power Corporation (HPPC S.A.) and has dominated the country’s electricity sector for more than six decades, boosting its economic growth and energy security [8,9]. At LCWM, the excavation, transportation, and deposition of mined materials is applied according to the continuous mining method, meaning that machinery such as vehicles, excavators, dust depositors, conveyor belts, and others steadily operate and emit particulate matter that largely comprise of PM10. According to the legislative obligations for the restoration of the environment, LCWM has established post-mining forest restoration plantations at reclaimed mines where the excavation of lignite has ended, in line with the practices implemented in most European countries, where more than 50% of former mine land is reclaimed as forest or grassland. Apart from the restoration of reclaimed mine soils and the landscape, these plantations provide multiple benefits like the prevention of erosion and the carbon sequestration in their soil and biomass [10,11,12], as well as PM10 retention by their foliage.
It is estimated that since the 1980s, approximately 7,000,000 saplings have been planted at the LCWM, covering an area of 2570 hectares [13], which is expected to increase as this is a dynamic process that continues after the operation of lignite mines is finalized. More than 95% of these restoration plantations are dominated by black locust (Robinia pseudoacacia L). Black locust is a tree native to North America, which was introduced to Europe in the 17th century, and it is naturalized in several Mediterranean and temperate regions [14,15]. This species is nowadays considered alien and invasive [15], but it has been often used for the restoration of heavily degraded lands [16,17,18] as it is a N2-fixing woody legume with low nutrient requirements [19] and a high growth rate and drought tolerance [14,15]. Black locust is also considered a good candidate species for phytoremediation in heavily polluted areas [20]. These properties have led to the use of black locust for the restoration plantations at reclaimed mines characterized by harsh environmental conditions, like at the LCWM.
Despite the extensive present distribution and planned future plantings of black locust at LCWM, its contribution to retention of PM10 has not been evaluated to date. In the literature, the PM10 retention efficiency of black locust has been assessed by a limited number of studies that yielded diverse findings, ranging from a moderate to high PM10 removal from the atmosphere, compared to herbaceous vegetation and other broadleaf trees and conifers [21,22,23,24].
Moreover, the drivers that control PM10 retention at the black locust restoration plantations are unknown. In general, the majority of studies on factors that control the PM10 load of trees’ foliage has focused on leaf traits, like leaf shape and size, surface roughness, wax layer, thrichome, and other microstructures [25,26,27], and less on tree properties, such as height [28]. Less research is available on how environmental parameters like the pollution level and the distance of vegetation from the PM source [29,30,31], the climate [32,33], and phenology [34] control PM retention. However, most of these studies refer to urban areas and roadside trees or small groves, while there is limited information available on the role of forests and forest plantations on PM removal, particularly at post-mining reclaimed sites.
Therefore, the current study aims to perform the following tasks:
  • Quantify PM10 retention by the foliage of black locust plantations at open cast lignite sites, such as the LCWM in Greece.
  • Assess the factors that have a positive or negative effect on PM10 retention.
  • Build a model to estimate PM10 retention by the studied black locust plantations.

2. Materials and Methods
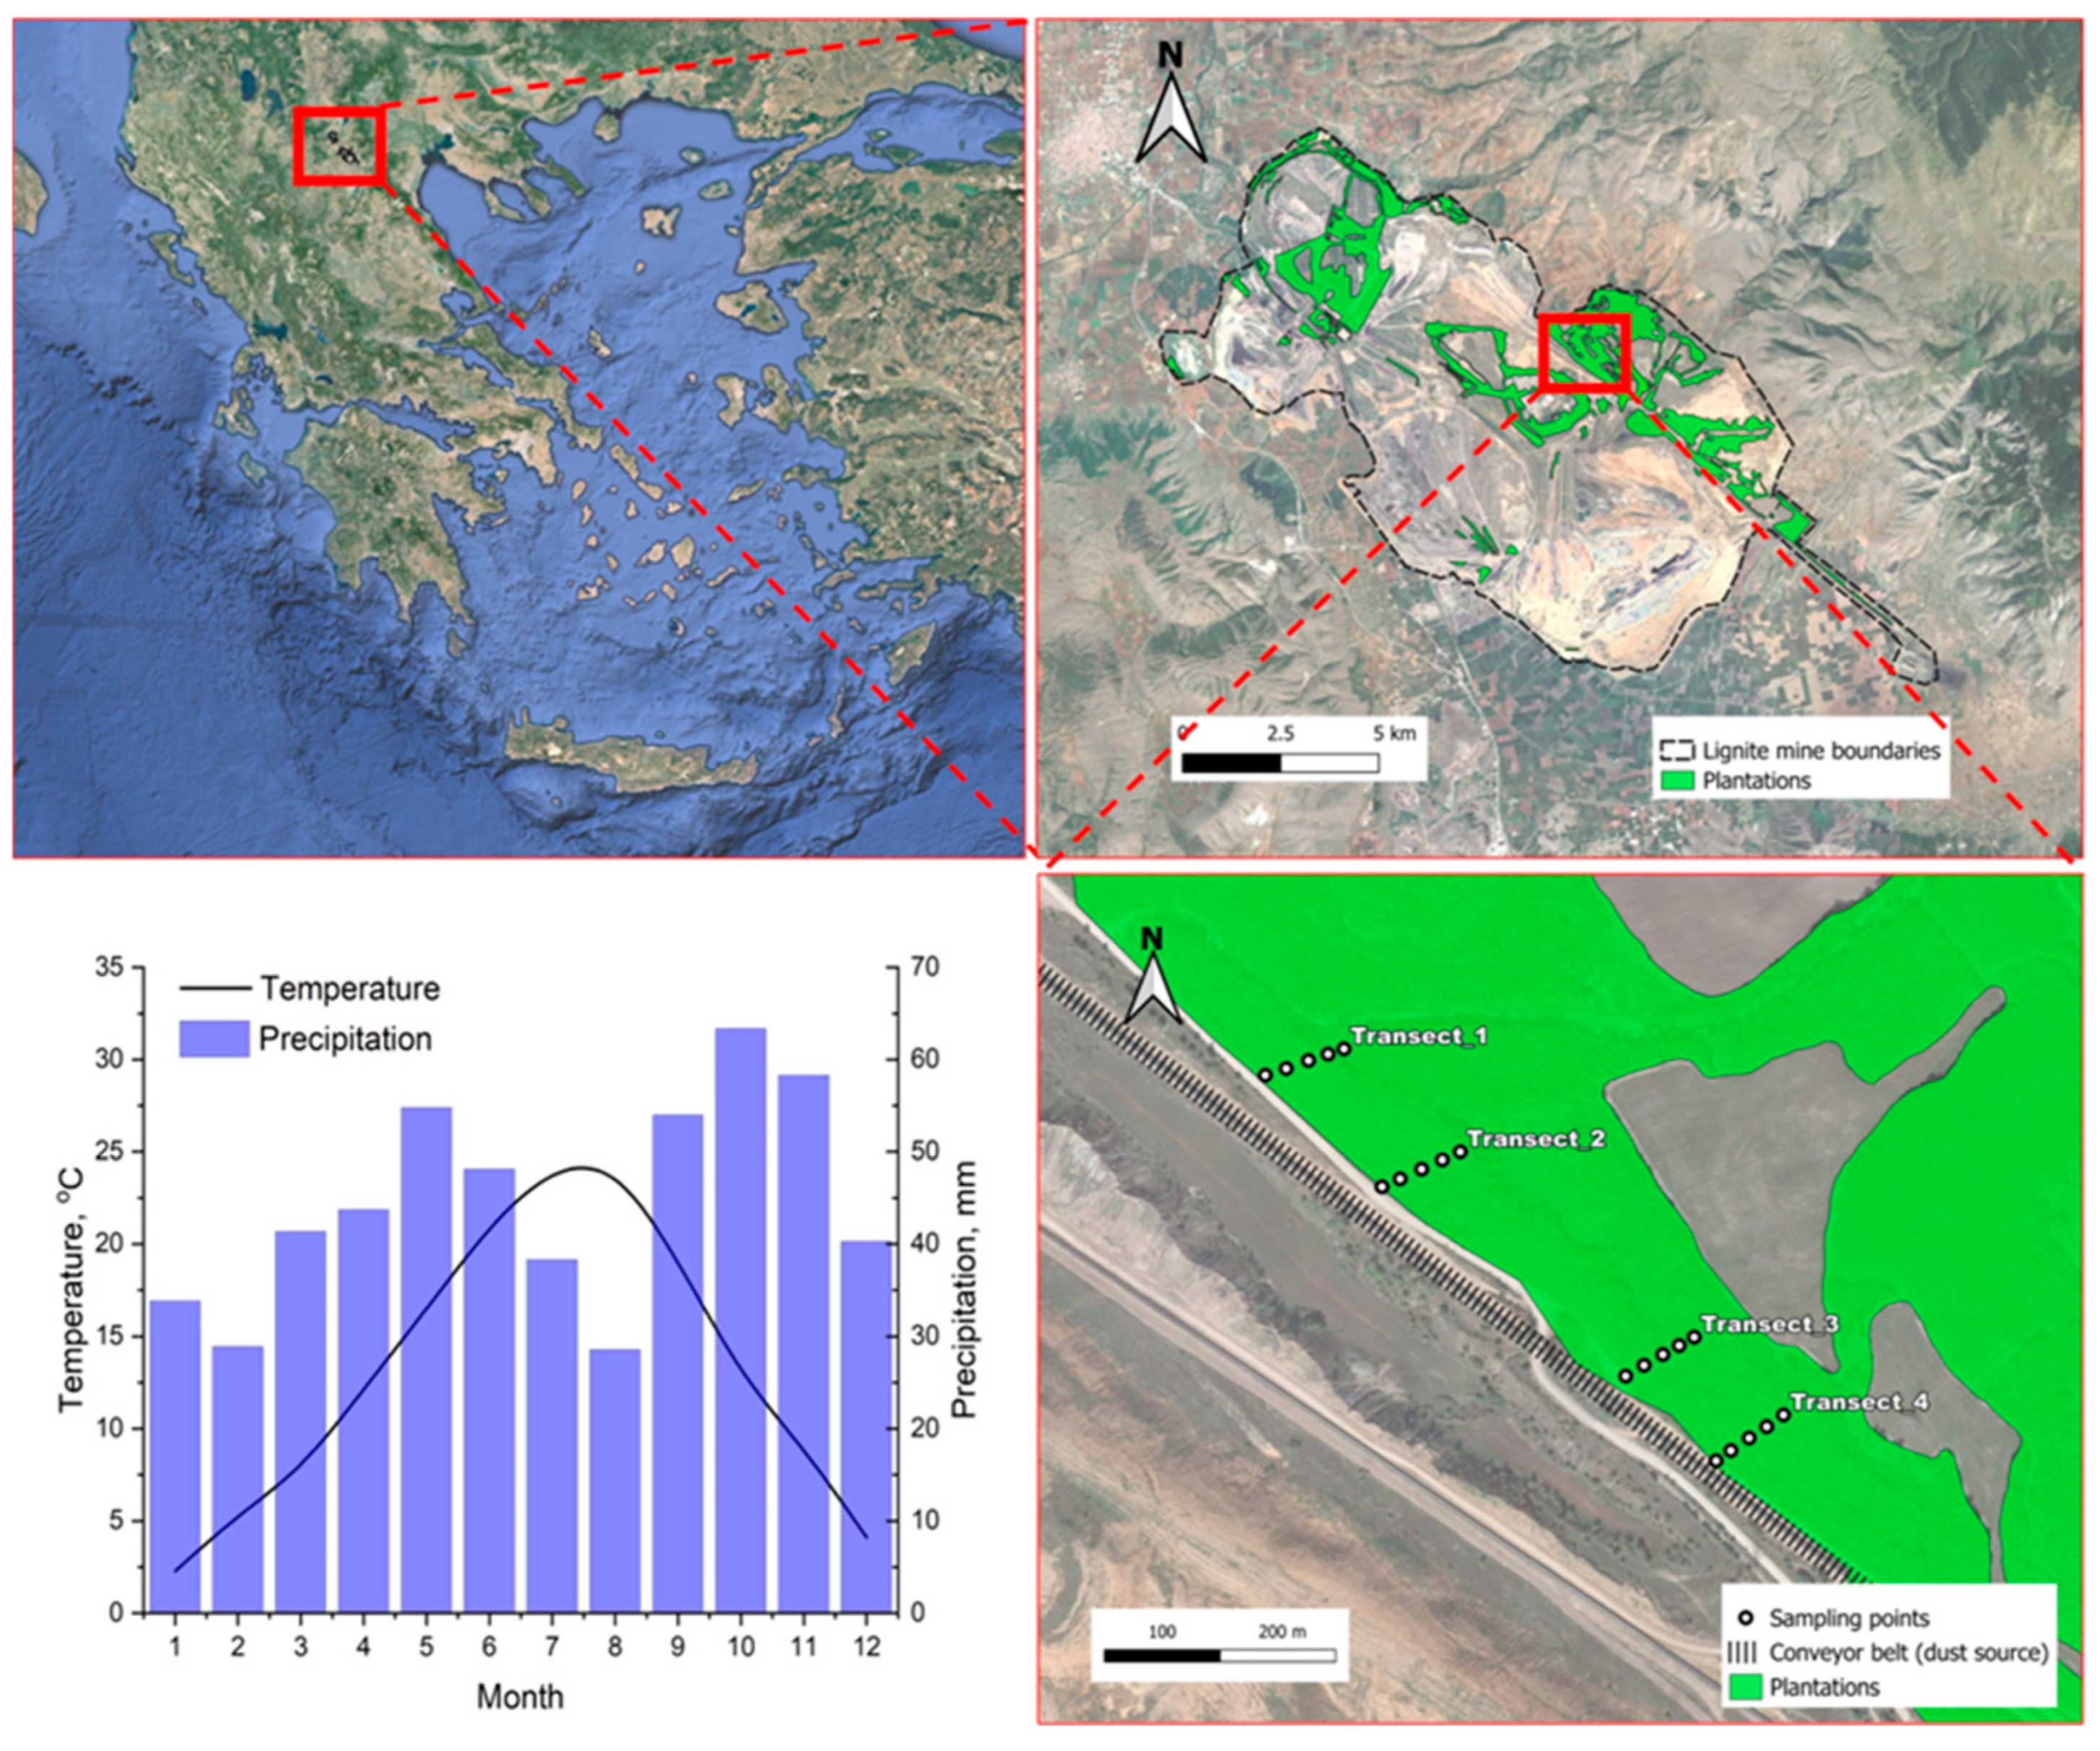
2.1. Study Area

The study area is located at north-western Greece, within the LCWM, at the black locust restoration plantations (Figure 1) of the restored mines of Ptolemaida (40.39° to 40.51° N, 21.70° to 21.89° E). According to the climate diagram of the study area, which is based on data from the closest station of the National Observatory of Athens (http://penteli.meteo.gr/stations/amyntaio/; accessed on 31 January 2021) for the period 2010–2020, the mean annual precipitation is 510 ± 156 mm and the mean monthly air temperature is 13.36 ± 0.92 °C, while a xerothermic period is observed only in July and August.
The plantations are established on waste heaps consisting of open-cast mining overburden material resulting from lignite excavation at the LCWM. These waste heaps have a texture of sandy clay loam (on average 48.4% sand, 28.5% silt, and 23.1% clay) and an alkaline pH (mean 7.9; ranging from 7.7 to 8.3) [12].
The PM10 emitting sources within the LCWM include the sites of drilling and explosion for lignite extraction, the sites of lignite and dust deposition, and the conveyor belt system for the transport of lignite and dust. Among these, the conveyor belt system is the most polluting one, as it has a total length of 250 km and it is distributed across the LCWM, while the other PM10 emitting sources are point-wise pollutants. Therefore, in this study, we focused on the role of the belt conveyor system as a PM10 emitting source and measurements were conducted at restoration plantations established in close proximity to this source (Figure 1) on a flat terrain.

2.2. The Monitoring of PM10 and Climate Parameters

The HPPC has a network of 8 stations for pollution measurements across LCWM and the closest to our study site is the station of Pontokomi (20.22° N, 21.50° E, 707 m.a.s.l.), from which we used hourly data of the PM10 concentration in the air (g m−3), wind speed (m s−1) and direction (degrees), air temperature (°C), and air relative humidity (%). The amount of PM10 production on a bi-weekly basis (kg) was estimated based on the Theofrastos software of HPPC, taking into account the PM10 concentration in the air, the source of the PM10 production (the belt conveyor system), and the duration of the operation of the source.

2.3. The Collection of Foliar Samples and the Determination of Leaf Area Index

The sampling of black locust leaves was performed approximately every 15 days during the growing season, from 28 May to 25 October 2021, at a restoration plantation established close to a belt conveyor. Four transects of 50 m each were selected within the studied plantation (Figure 1) in a way that each transect had a different distance from the conveyor belt. Thus, the frontline of each transect had a distance of 13, 25, 32, and 45 m, respectively, from the conveyor belt. Each transect consisted of five trees with a distance of 10 m among them. Therefore, the different distance of the frontline trees from the emitting source and the 10 m distance among them resulted in a gradient from 13 to 85 m between the source and the last measured tree, which allowed us to assess the effect of distance from the emitting source on PM10 retention by foliage.
On each tree, leaf samplings were performed at three canopy heights, measured from the basis of the canopy: low (1.5–2 m), medium (4.5–5 m), and high (9–10 m). One composite leaf was collected from each canopy position. In total, 660 leaf samples were collected. Each sample was immediately closed in a plastic bag to avoid contamination and stored in a portable cool box [35]. All samples were then transferred to the laboratory, where they were stored at −20 °C until their further analysis.
During each sampling, thus every two weeks, the Leaf Area Index (LAI) of the studied plantation was measured with the use of the LI2000 Plant Canopy Analyzer (LICOR, Lincoln, NE, USA) to assess the seasonal variation of the foliage area. The measurements were done at dawn or under overcast conditions. During every measurement, the LAI of each of the four studied transects was computed by obtaining five recordings along the transect, approximately every ten meters.

2.4. The Foliar Samples Area, Mass, and PM10 Retention

The leaf area and weight of each sample were measured in the lab. The leaf area was determined by using ImageJ; ver. 1.53m [36], after scanning each sample. For the estimation of PM10 retention, the methodology described by Dzierżanowski et al. [37] was applied, which limits losses and contamination. Leaf mass was measured by weighing each sample with an analytical balance (AB54-S, Mettler Toledo, OH, USA) and then put in a glass vial with 250 mL of distilled water and mixed by hand for 60 sec to rinse and remove the particles from the surface of the leaves. The liquid was then passed through a 100 μm stainless-steel sieve to eliminate particles larger than 10 μm. Type 91 paper filters were used for determining 10 μm retention. Each filter was weighed with the analytical balance, dried for 30 min at 60 °C, put in a glass desiccator, and passed through an ionization gate (KERN YBI-01A, Kern & Sohn GmbH, Balingen, Germany) to avoid electrostatic charges before being weighed again. The washing solutions, resulting from the process of sieving the water where the leaf samples were rinsed, were filtered through the Type 91 filters by using glass funnels and a vacuum pump. The filters with the retained dust were dried for 30 min at 60 °C, put for 30 min in the glass drying chamber, and weighed. The difference between the initial and the final filter weight represented the amount of PM10 retained by the R. pseudoacacia leaves.

2.5. Data Analysis

From the initial 660 PM10 retention measurements, 11 outliers were excluded based on the z-score criterion (Equation (1)), with a defined z-score threshold equal to 3. This resulted in 649 values included in further analyses. A two-sample t-test was applied to compare the initial PM10 retention dataset with the one after outliers’ removal and no significant difference was found among them. More information on the descriptive statistics of the PM10 dataset with and without outliers is given in Figure S1 and Table S1.
z = ( X μ ) / σ
where z is the estimated z score;
  • X is the vector of observed value;
  • μ is the mean of the observed values;
  • σ is the standard deviation of the observed values.
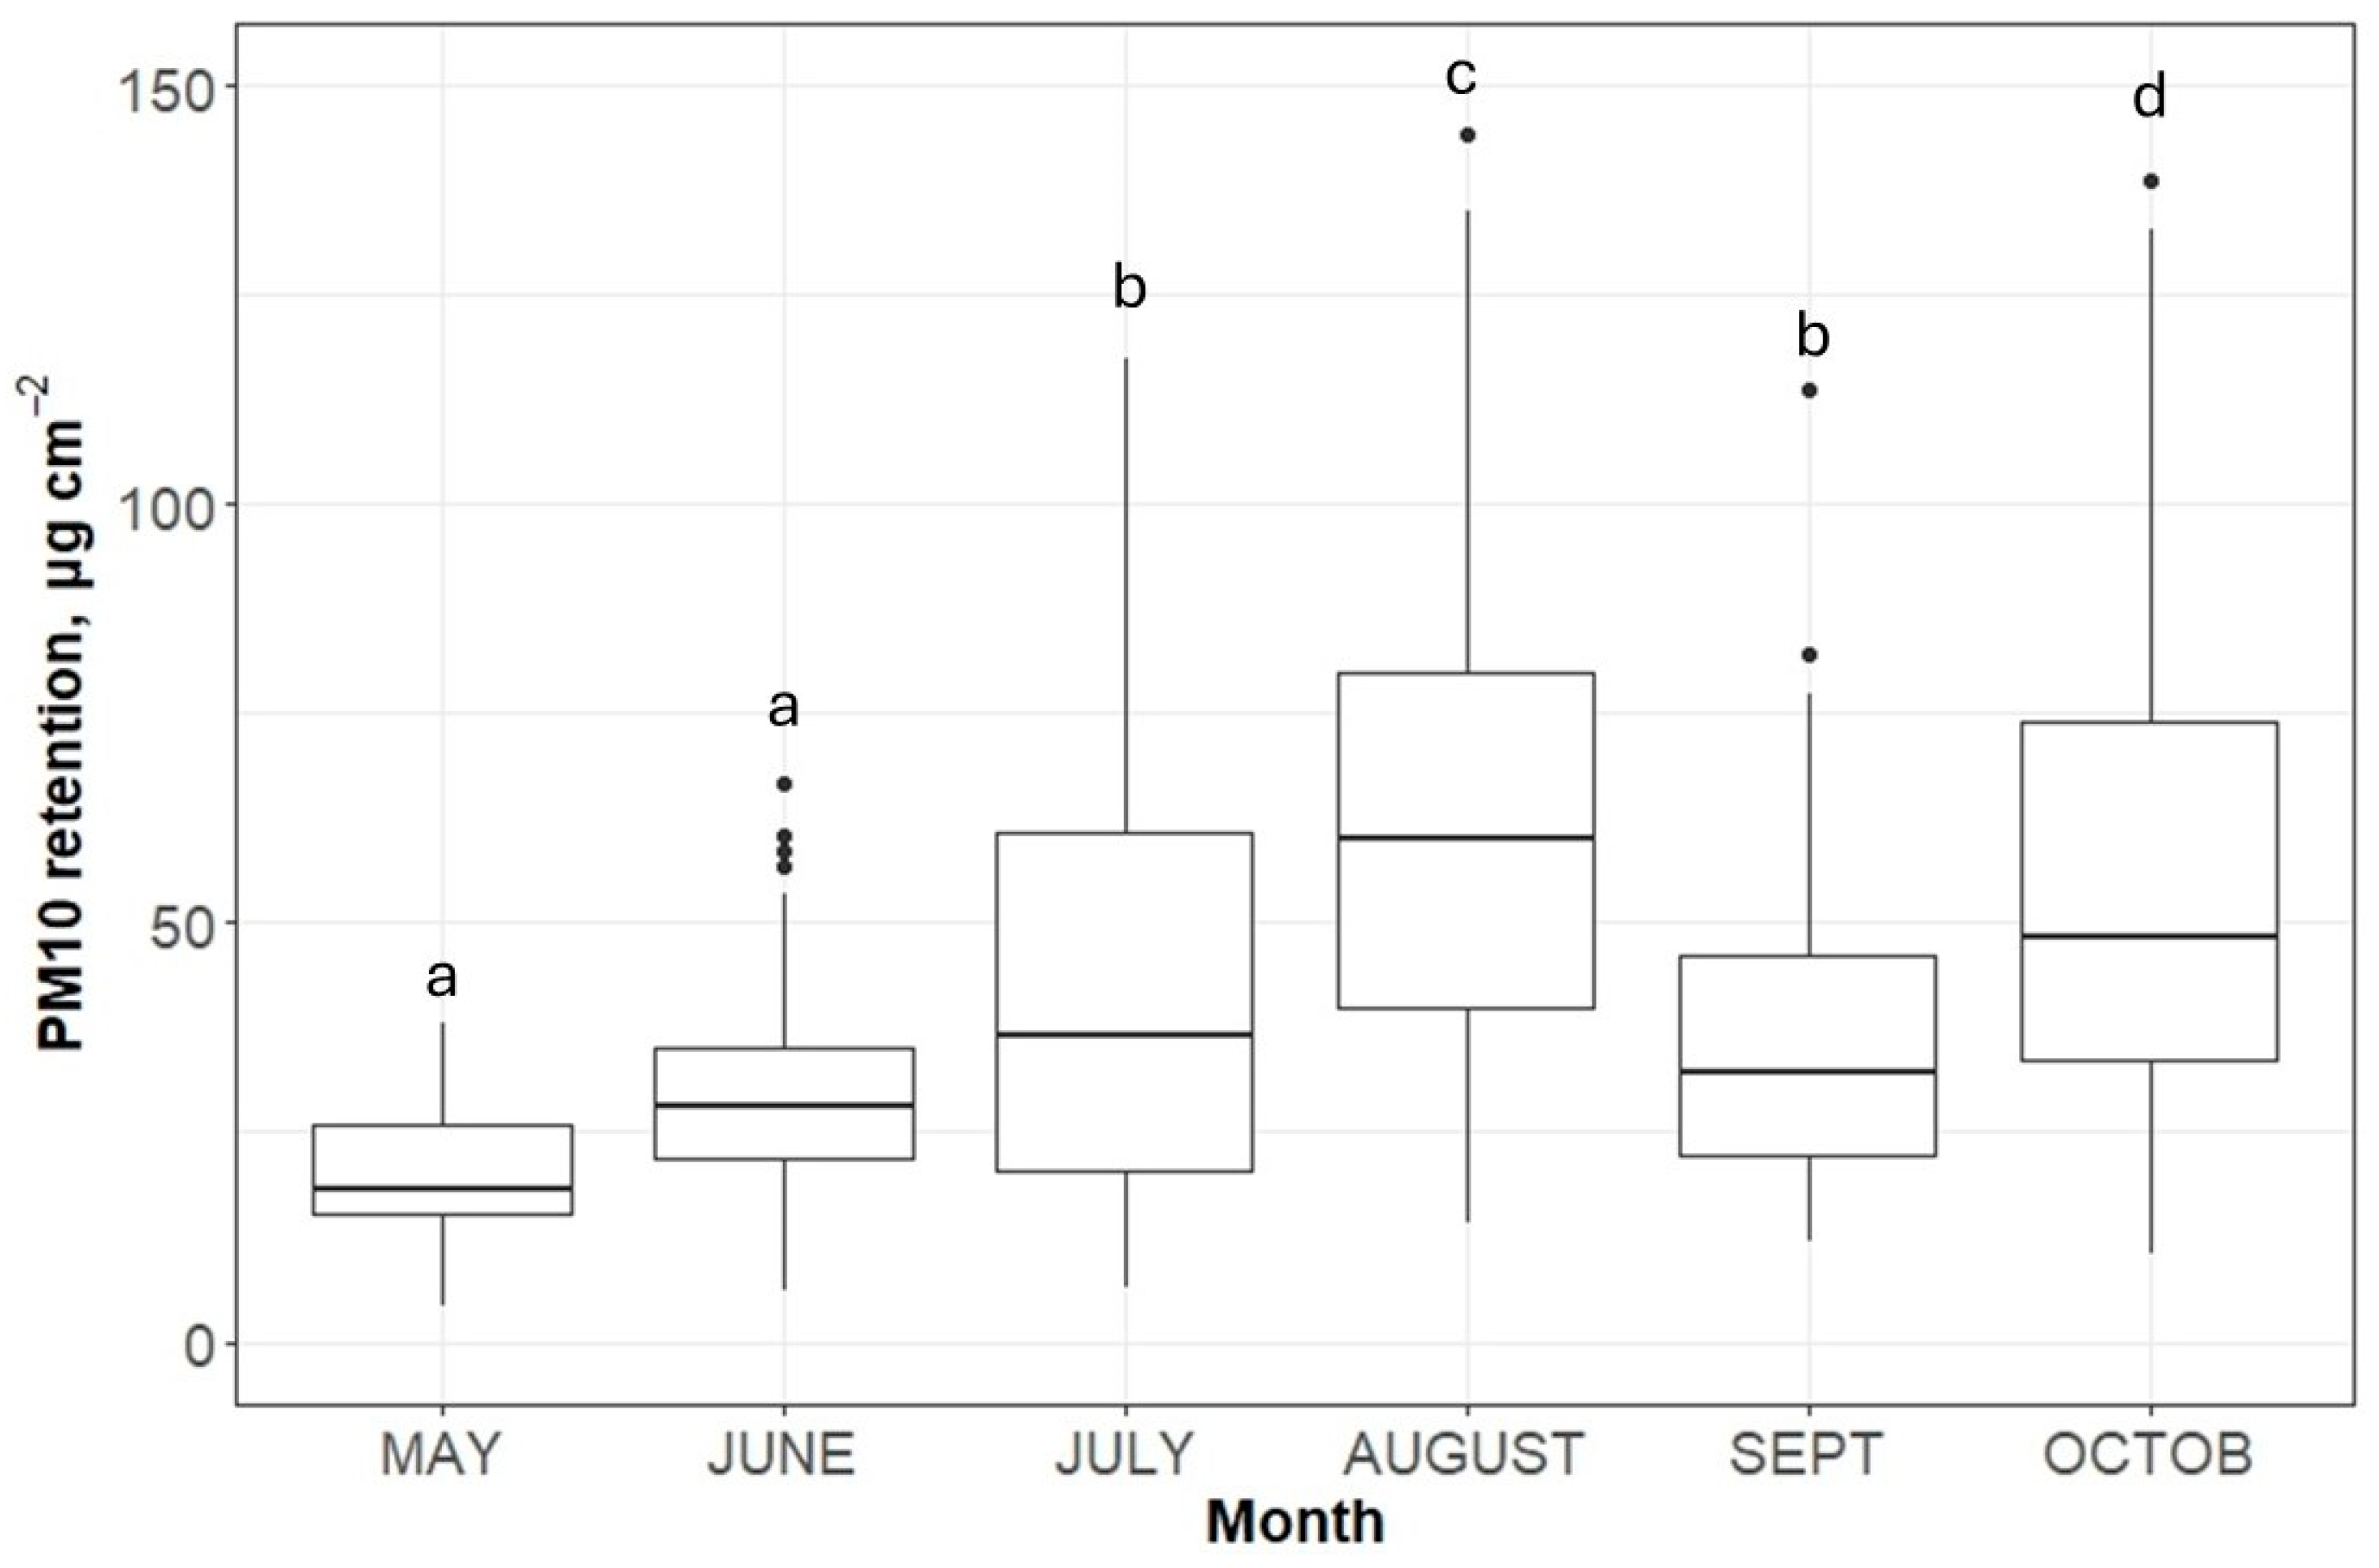
One-Way ANOVA was used to test for the effect of sampling month on PM10 retention per leaf area and LAI, and Tukey’s-b post hoc test was applied to identify the significant differences between the months. A Pearson correlation matrix among PM10 retention and the rest of the monitored variables was developed. The variables included were the following: the cumulative PM10 production after each rain event (kg), the distance from the source (m), rainfall (mm), air relative humidity (%), wind speed (m s−1), LAI (m2 m−2), as numeric variables and crown position (a = high, b = medium, and c = low), and as categorical variables. All these variables were considered as potential predictors of PM10 retention in the subsequent linear regression analysis.
We initially used a mixed effects model, with transect as a random effect and the rest of the predictors used as fixed effects (R packages lme4, lmerTest; [38,39]). The proportion of random (within transects) variation was very low and we, thus, proceeded with multiple linear regression model analysis. From the full set of independent predictors, we maintained only the significant ones. However, as there was a slight violation of the assumptions regarding the residuals of the model, i.e., their distribution did not follow a normal distribution (Kolmogorov–Smirnov test D = 0.073, p-value = 0.002) and there was an increased variance at higher fitted values (heteroscedasticity), we decided to implement a robust regression both on the whole dataset and use a bootstrap cross-validation procedure. We initially fitted a robust regression (package MASS [40]) to the whole dataset and tested for the significance of each coefficient using the (quasi-) t Wald test (package lmtest [41]). Partial effects for each significant predictor variable were estimated using the ggeffects [42] package. To evaluate how the model generalizes to unseen data, we additionally performed a “bootstrap cross-validation” [43]. We made 500 random sample draws with replacement to create bootstrap samples from the whole dataset. Within each bootstrap sample, we performed a k-fold validation (k = 5), where the sample was split into five folds. Four of the folds were used to train a robust regression model (using the predictors identified as significant in the robust regression analysis of the whole dataset) and to keep track of the coefficient estimates. The fold not used to fit the model was used to validate the model and estimate the root mean square error (RMSE) and a pseudo R2 (as the ratio of the models’ sum of squares to the sum of squares of the null model). For each bootstrap sample, this step was repeated for each fold. Average performance metrics were estimated by calculating the mean RMSE and pseudo R2 across all folds and bootstrap samples, while the uncertainty of the coefficient estimate was quantified by computing the 5 and 95 percent quantile of their distribution within the bootstrap samples. These were considered in comparison to the original robust regression estimates using the whole dataset. All analyses were performed in R (R Core Development Team, 2025), with the libraries referred to above.

3. Results

During the 2021 growing season, PM10 retention by the foliage of black locust ranged from 4.31 to 144.24 (mean: 42.85) μg cm−2 and presented a considerable seasonal variation (Figure 2). The values of May and June were significantly lower than those of all other months. Then, the PM10 load on foliage gradually increased in July and peaked in August and October, when it was significantly the highest among the sampling months.
The seasonal pattern of PM10 retention by black locust leaves is largely reflected in the PM10 production by the belt conveyor system, depicted in Figure 3a, which showed a similar change over time. On the contrary, the seasonal change of LAI, which is an index of foliage expansion and senescence, presented a different seasonal fluctuation (Figure 3b). LAI was significantly the highest in June and July and substantially declined from then on until October, when the lowest LAI was observed, apparently due to autumn leaf fall.
Figure 4 shows the Pearson correlations between PM10 retention, and all the independent factors studied. The PM10 production by the belt conveyor system since the last rain event had the strongest positive effect on PM10 retention, followed by the sampling month. On the contrary, the distance from the source and LAI had the strongest negative impact on PM10, followed by rainfall, wind speed, air relative humidity, and crown height.
In order to choose the best model that describes the relationship between PM10 and its drivers, we selected those presented in the correlation matrix of Figure 4 that are clearly independent among them. Given that cumulative PM10 production was computed since the last rain event and, thus, the washing effect of rainfall was already considered, rainfall was excluded from the model. Similarly, RH was excluded as it is affected by rainfall. Moreover, the month was not included because the seasonal effect is incorporated into LAI, which changes seasonally. Thus, the significant factors that were included in the multiple linear model were as follows: rainfall (cumulative since last rainfall), distance from the source (belt conveyor system), wind speed, and crown height.
The combination of all significant parameters explained 60% of the total variation in PM10 retention by the black locust plantation (R2 = 0.60, p < 0.001). The estimates, the z value and the p value of the coefficients of the robust regression model, are presented in Table 1. Based on these, Equation (2) estimates PM10 retention per leaf area at the restoration plantations of LCWM as following:
P M 10   r e t e n t i o n = 58.910 + 0.017 P M 10   p r o d u c t i o n 0.738 D i s t a n c e 13.740 L A I + 0.154 D i s t a n c e L A I + 0.931 W i n d   s p e e d ( + 3.868   i f   c r o w n   h e i g h t = l o w )
Figure 5 presents the partial effects of the significant drivers of PM10 retention by the black locust plantation. The level of significance of the partial effect of each of these drivers is given in Table 1 from which it is obvious that PM10 production, distance from the PM10 emitting source (belt conveyor), LAI, and wind speed have a highly significant impact (p < 0.001), while crown height has a significant influence at p < 0.01, on the PM10 load on the foliage of black locust.
The PM10 retention exhibits a plausible strong linear increment with an increasing PM10 production by the conveyor belt system (Figure 5a). A similar significant, but weaker, positive response of PM10 retention is observed in relation to the increasing wind speed (Figure 5d). On the contrary, the increasing distance of the trees from the conveyor belt (source) and LAI result in a linearly declining PM10 retention (Figure 5b,c). Finally, it is observed that the lowest part of the trees’ canopies (crown height c) withholds significantly more PM10 than the middle or higher canopy (crown heights a and b) as shown in Figure 5e.
The bootstrap cross-validation approach yielded coefficient estimates for each predictor variable that were close to the ones from the robust regression on the whole dataset, and in all cases were within the percentiles’ range (Table 1, Figure S2). The bootstrapped metrics of the model’s accuracy yielded an R2 = 0.59 ± 0.04 and an RMSE = 16.76 ± 1.50, suggesting a stable behavior of the initial robust regression model.

4. Discussion

The contribution of tree-planted areas to the reduction of air pollution caused by PM10 is supported by rich research literature. However, the majority of studies refer to large urban centers and metropolitan cities, e.g., [5,37,44] and focus on the importance of parks and urban and peri-urban forests as Green Infrastructures [45,46] that retain air pollutants, such as PM10 [33,47]. Quite less is known about the role of forest plantations in limiting atmospheric PM10 concentration at industrial areas that are quite more heavily polluted, like mines [48]. Here, we aimed at assessing PM10 retention and its controlling drivers at post-mining restoration plantations of black locust established during the last 40 years at LCWM, the largest lignite complex for electricity production in Greece.
On average, the PM10 retention by the foliage of the studied R. pseudoacacia plantations was 42.85 μg cm−2. Higher values, such as about 70 and 150 μg cm−2, are recorded for the same species at industrial areas in China [21] and Poland [24], respectively. On the contrary, a lower foliar PM load of about 3.8 μg cm−2 was measured at an urban park of an industrial city in Italy [35]. Compared to other forest trees used for PM retention at sites of low or high air pollution, the values we recorded for black locust were lower than that of pine, fir, willow, juniper, and plane (Pinus tabuliformis, Abies holophylla, Salix babylonica, Juniperus chinensis, and Platanus orientalis) [21]. This may at least partly be attributed to the smooth adaxial and abaxial surfaces of black locust leaves that bear only few trichomes [23], which could reduce its capacity to hold air particles. However, studies that compared black locust with other forest trees, such as poplars (Populus berolinensis and Populus × canescens) and maple (Acer negundo), showed both a higher and lower efficiency of black locust in retaining PM10 [21,22,24], than in our study. The fact that there is limited quantitative information on the PM10 concentration retained by black locust on a leaf area basis and that the published data originates from sites of greatly varying PM-emitting activities makes the comparison with the findings of other studies difficult.
Although successful algorithms have been developed for forecasting PM10 pollution [49,50], there is a lack of species-specific models for predicting PM retention by forest plantations, particularly at highly polluted industrial areas. Within our study, we have developed, and cross-validated through bootstrap resampling, a robust linear model that can be used to estimate PM10 capture by the black locust restoration plantations at the lignite complex of LCWM, or other similar ones. Based on this, c. 60% of the variation in PM10 retention by the trees’ foliage is explained by the positive effects of cumulative PM10 production between rain events, wind speed, and low height across the canopy and the negative influence of distance from the emitting source and seasonality in phenology, as expressed by leaf area index.
Ιn regard to the seasonal pattern of PM10 retention, a considerable fluctuation was observed (Figure 2). The enhanced PM10 retention from May to July is related to the parallel increase in leaf area from spring till mid-summer, when full foliar expansion takes place, as reflected in LAI (Figure 3b). The seasonal dependency of PM10 retention on the LAI variation of deciduous broadleaf forest species has been similarly demonstrated by previous studies [51] and linked to maximum PM10 foliar concentrations in summer rather than in spring [52]. However, the seasonal change in leaf area does not explain the peak of PM10 retention in August and October (Figure 2), as LAI declined in these months presumably due to the summer xerothermic conditions in August (Figure 1) and due to leaf senescence in October, and this is demonstrated as a slightly negative effect of LAI on PM10 retention (Figure 5c). On the contrary, the highest amount of PM10 retained by black locust foliage in these months was largely controlled by the increased electricity demand and, thus, the greatest PM10 production by the belt conveyor system of the lignite mining complex (Figure 3a) which had the strongest positive effect among the tested parameters (Figure 4). A similar, almost 2-fold increase in PM10 retention by black locust from June to August was observed by Przybysz et al. [24] but was attributed to the lack of regular rain events during this period, which allowed for the accumulation of PM10 on the foliage. In our case, rainfall had a clear washing, thus negative, effect on PM10 load on black locust leaves (Figure 4), in line with the findings of other studies [53,54]. However, the rain events that occurred between the samplings of July and October (three rainfalls with a sum of 57.6 mm) were not adequate to eliminate the PM10 accumulation due to the increased activity of the lignite mines during this period. On the other hand, a positive role of rainfall on the PM10 accumulation on leaves has also been reported in the literature, through the imposed increase in air relative humidity and the associated increased foliage stickiness [55], but such an effect cannot be supported by our study (Figure 4).
Another significant driver of PM10 retention by vegetation foliage is wind. The direction of local winds has been found to affect the PM10 load of different species [56], but wind direction did not play a significant role in our study (p > 0.25;. On the other hand, wind speed had a mild positive effect on PM10 capture by R. pseudoacacia leaves (Figure 5c). A plausible argumentation is that an increasing wind speed contributes to a higher PM10 transfer from the source of pollution to the plantations, resulting in enhanced PM10 load to the trees’ foliage. Research indicated that the effect of wind can both reduce and increase PM accumulation [57,58], probably through the redispersion and reallocation of PM pollution on the plants [59]. However, the belt conveyors that emit PM10 at our study site are close to the ground and the PM10 retention was higher by 3.9 μg cm−2 at the lower part of the trees’ crown up to 2 m than in the higher ones (Table 1, Figure 5e). This indicates that winds that may transfer particulate matter from the pollution source to the plantations mostly allocate PM10 to basal foliage and less to the middle or higher crown, as similarly found in several broadleaf species used for PM10 removal in parks and along roads in different European countries [52,60]. Then, a combination of factors can favor the further accumulation or maintenance of PM10 at the lower trees’ canopy. The large size and weight of PM10 only allows their allocation within a limited vertical distance from the source [61], while at the same time rainfall interception is reduced from the upper to the lower canopy, thus minimizing the rainfall washing effect and resulting in an increased PM10 load at the basal foliage. In addition, particles deposited at the basal tree canopy are subjected to low wind speeds and are less resuspended than particles located at the top of the canopy where higher wind speeds usually occur [54].
Increasing distance (from 13 to 85 m) from the PM10 emitting source had a pronounced negative impact on PM foliar concentrations on black locust trees (Figure 4), resulting in steadily decreasing values of PM10 retention with distance (Figure 5b). The effect of distance on PM10 load has mostly been studied at forests and plantations adjacent to traffic roads and it has been verified that PM10 retention decreased with increasing distance from the road [62]. In most cases, it is reported that the front line of trees is the one playing the greatest role in limiting PM pollution [63] and that PM10 retention does not change any further deeper in the forest [62], contrary to the gradual decline in foliar PM10 load observed in our study. The absence of understory shrub or herbaceous vegetation at the studied black locust plantations may explain the difference from other literature findings, as herbs and shrubs have an important PM retention capacity [34,64] and their co-occurrence in forests or forest plantations creates a more complex forest structure that has an additive effect on PM10 retention, which is profound already at the frontline of the forest [62]. In addition, the less dense tree canopy of black locust, compared to other conifer or evergreen broadleaf trees studied, may have allowed particulate matter to disperse deeper in the studied plantations, and can ultimately result in a greater total PM10 retention by these ecosystems and be preferable in areas with high air PM concentrations [65].

5. Conclusions

Our results, in line with these of previous studies, verify that PM10 retention by vegetation foliage is a complex and dynamic process which is not fully understood yet and is controlled by a range of different environmental parameters. Our current knowledge is mostly based on studies in urban areas and less on heavily polluted industrial ones. Within this study, we present a robust regression model to predict PM10 retention by plantations of black locust at the largest lignite complex in Greece or at similar post-mining restoration plantations. We estimated that on average, c. 43 μg cm−2 of PM10 are captured by the foliage of black locust during the growing season and we showed that PM10 retention is largely controlled by leaf expansion in spring and PM10 production in autumn to cover energy needs. In addition, the PM10 load is enhanced with wind speed, particularly at the basal foliage of the trees, while it decreases as the distance from the emitting source and the frontline of the plantations is increased. To support the long-term management of such black locust restoration plantations at lignite complexes, future research should focus on the development of models for upscaling the estimation of PM10 retention on the total plantations’ area, taking into account our findings on how controlling factors change on a fine scale.

Supplementary Materials

The following supporting information can be downloaded at: https://www.mdpi.com/article/10.3390/atmos16050555/s1, Figure S1. PM10 retention with (Xlf) and without (Xlf_filtered) outlier values, which were removed after application of the Z-score criterion. Figure S2. Distribution of coefficient estimates for PM10 Production, Distance, LAI, Wind Speed and Crown Height across the bootstrap samples. The blue vertical line indicates the value for each coefficient from the robust regression model on the whole dataset. Table S1. Descriptive statistics and t-test statistics of the 2 samples t-test applied to compare the PM10 retention with (Xlf) and without (Xlf_filtered) outlier values, after application of the Z-score criterion.

Author Contributions

C.S., N.M. and M.N.F.; methodology, K.R., M.N.F. and N.M.F.; validation, C.S., M.N.F., N.M. and N.M.F.; formal analysis, C.S., N.M., M.N.F., N.M.F. and K.R.; investigation, K.R.; resources, C.S., N.M., M.N.F. and N.M.F.; data curation, C.S., M.N.F. and N.M.; writing—original draft preparation, C.S., N.M., N.M.F., M.N.F. and K.R.; writing—review and editing, C.S., N.M., N.M.F. ang M.N.F.; visualization, M.N.F., N.M.F. and K.R.; supervision, K.R.; project administration, K.R.; funding acquisition. All authors have read and agreed to the published version of the manuscript.

Funding

The study was funded by the COFORMIT project “Contribution of the tree planted land of Western Macedonia lignite center to protection of environment and to mitigation of climate change” (T1EDK-02521), which was financially supported by the Single RTDI state Aid Action Research—Create—Innovate funded by the Operational Program Competitiveness, Entrepreneurship, and Innovation 2014–2020 (EPAnEK).

Institutional Review Board Statement

Not applicable.

Informed Consent Statement

Not applicable.

Data Availability Statement

The datasets generated during and/or analyzed during the current study are available from the corresponding author upon reasonable request.

Acknowledgments

We kindly acknowledge the Hellenic Public Power Corporation (HPPC) and in particular Tryfon Barbas, Melina Andreadou, and Marina Tentsoglidou for their support with personnel and equipment during the field campaigns and for providing all necessary information for the completion of this work. We are also thankful to Makis Kaligiros for his assistance in field work and sampling.

Conflicts of Interest

The authors declare no conflicts of interest.

References

  1. European Environment Agency. Air Quality in Europe: 2015 Report; Publications Office: Luxembourg, 2015. [Google Scholar]
  2. Sun, Y.; Hu, X.; Wu, J.; Lian, H.; Chen, Y. Fractionation and Health Risks of Atmospheric Particle-Bound As and Heavy Metals in Summer and Winter. Sci. Total Environ. 2014, 493, 487–494. [Google Scholar] [CrossRef] [PubMed]
  3. Chávez-García, E.; González-Méndez, B. Particulate Matter and Foliar Retention: Current Knowledge and Implications for Urban Greening. Air Qual. Atmos. Health 2021, 14, 1433–1454. [Google Scholar] [CrossRef]
  4. European Environment Agency. Europe’s Air Quality Status 2023; EEA Briefing; Publications Office: Luxembourg, 2023. [Google Scholar]
  5. McDonald, A.G.; Bealey, W.J.; Fowler, D.; Dragosits, U.; Skiba, U.; Smith, R.I.; Donovan, R.G.; Brett, H.E.; Hewitt, C.N.; Nemitz, E. Quantifying the Effect of Urban Tree Planting on Concentrations and Depositions of PM10 in Two UK Conurbations. Atmos. Environ. 2007, 41, 8455–8467. [Google Scholar] [CrossRef]
  6. Bealey, W.J.; McDonald, A.G.; Nemitz, E.; Donovan, R.; Dragosits, U.; Duffy, T.R.; Fowler, D. Estimating the Reduction of Urban PM10 Concentrations by Trees within an Environmental Information System for Planners. J. Environ. Manag. 2007, 85, 44–58. [Google Scholar] [CrossRef] [PubMed]
  7. Mandal, M.; Popek, R.; Przybysz, A.; Roy, A.; Das, S.; Sarkar, A. Breathing Fresh Air in the City: Implementing Avenue Trees as a Sustainable Solution to Reduce Particulate Pollution in Urban Agglomerations. Plants 2023, 12, 1545. [Google Scholar] [CrossRef] [PubMed]
  8. Nikas, A.; Neofytou, H.; Karamaneas, A.; Koasidis, K.; Psarras, J. Sustainable and Socially Just Transition to a Post-Lignite Era in Greece: A Multi-Level Perspective. Energy Sources Part B Econ. Plan. Policy 2020, 15, 513–544. [Google Scholar] [CrossRef]
  9. Vlassopoulos, C. Persistent Lignite Dependency: The Greek Energy Sector under Pressure. Energy Policy 2020, 147, 111825. [Google Scholar] [CrossRef]
  10. Papadopoulos, C.; Gekaa, C.; Pavloudakis, F.; Roumpos, C.; Andreadou, S. Evaluation of the Soil Quality on the Reclaimed Lignite Mine Land in West Macedonia, Greece. Procedia Earth Planet. Sci. 2015, 15, 928–932. [Google Scholar] [CrossRef]
  11. Pavloudakis, F.; Roumpos, C.; Karlopoulos, E.; Koukouzas, N. Sustainable Rehabilitation of Surface Coal Mining Areas: The Case of Greek Lignite Mines. Energies 2020, 13, 3995. [Google Scholar] [CrossRef]
  12. Xanthopoulos, G.; Radoglou, K.; Derrien, D.; Spyroglou, G.; Angeli, N.; Tsioni, G.; Fotelli, M.N. Carbon Sequestration and Soil Nitrogen Enrichment in Robinia pseudoacacia L. Post-Mining Restoration Plantations. Front. For. Glob. Change 2023, 6, 1190026. [Google Scholar] [CrossRef]
  13. Spyroglou, G.; Fotelli, M.; Nanos, N.; Radoglou, K. Assessing Black Locust Biomass Accumulation in Restoration Plantations. Forests 2021, 12, 1477. [Google Scholar] [CrossRef]
  14. Nicolescu, V.-N.; Rédei, K.; Mason, W.L.; Vor, T.; Pöetzelsberger, E.; Bastien, J.-C.; Brus, R.; Benčať, T.; Đodan, M.; Cvjetkovic, B.; et al. Ecology, Growth and Management of Black Locust (Robinia pseudoacacia L.), a Non-Native Species Integrated into European Forests. J. For. Res. 2020, 31, 1081–1101. [Google Scholar] [CrossRef]
  15. Vítková, M.; Müllerová, J.; Sádlo, J.; Pergl, J.; Pyšek, P. Black Locust (Robinia Pseudoacacia) Beloved and Despised: A Story of an Invasive Tree in Central Europe. For. Ecol. Manag. 2017, 384, 287–302. [Google Scholar] [CrossRef] [PubMed]
  16. Kou, M.; Garcia-Fayos, P.; Hu, S.; Jiao, J. The Effect of Robinia pseudoacacia Afforestation on Soil and Vegetation Properties in the Loess Plateau (China): A Chronosequence Approach. For. Ecol. Manag. 2016, 375, 146–158. [Google Scholar] [CrossRef]
  17. Papaioannou, A.; Chatzistathis, T.; Papaioannou, E.; Papadopoulos, G. Robinia Pseudοacacia as a Valuable Invasive Species for the Restoration of Degraded Croplands. CATENA 2016, 137, 310–317. [Google Scholar] [CrossRef]
  18. Shi, Z.; Bai, Z.; Guo, D.; Ma, X.; Chen, M.; Li, S. Synergistic Effects Aided the Growth of Black Locust in Reclaimed Areas of Semi-Arid Open-Pit Coal Mines. Front. Ecol. Evol. 2023, 11, 1082321. [Google Scholar] [CrossRef]
  19. Liu, Z.; Hu, B.; Bell, T.L.; Flemetakis, E.; Rennenberg, H. Significance of Mycorrhizal Associations for the Performance of N2-Fixing Black Locust (Robinia pseudoacacia L.). Soil Biol. Biochem. 2020, 145, 107776. [Google Scholar] [CrossRef]
  20. Dadea, C.; Russo, A.; Tagliavini, M.; Mimmo, T.; Zerbe, S. Tree Species as Tools for Biomonitoring and Phytoremediation in Urban Environments: A Review with Special Regard to Heavy Metals. Arboric. Urban For. 2017, 43. [Google Scholar] [CrossRef]
  21. Zhang, W.; Li, Y.; Wang, Q.; Zhang, T.; Meng, H.; Gong, J.; Zhang, Z. Particulate Matter and Trace Metal Retention Capacities of Six Tree Species: Implications for Improving Urban Air Quality. Sustainability 2022, 14, 13374. [Google Scholar] [CrossRef]
  22. Muñoz, D.; Aguilar, B.; Fuentealba, R.; Préndez, M. Environmental Studies in Two Communes of Santiago de Chile by the Analysis of Magnetic Properties of Particulate Matter Deposited on Leaves of Roadside Trees. Atmos. Environ. 2017, 152, 617–627. [Google Scholar] [CrossRef]
  23. Capozzi, F.; Di Palma, A.; Sorrentino, M.C.; Adamo, P.; Giordano, S.; Spagnuolo, V. Morphological Traits Influence the Uptake Ability of Priority Pollutant Elements by Hypnum Cupressiforme and Robinia pseudoacacia Leaves. Atmosphere 2020, 11, 148. [Google Scholar] [CrossRef]
  24. Przybysz, A.; Wińska-Krysiak, M.; Małecka-Przybysz, M.; Stankiewicz-Kosyl, M.; Skwara, M.; Kłos, A.; Kowalczyk, S.; Jarocka, K.; Sikorski, P. Urban Wastelands: On the Frontline between Air Pollution Sources and Residential Areas. Sci. Total Environ. 2020, 721, 137695. [Google Scholar] [CrossRef] [PubMed]
  25. Sæbø, A.; Popek, R.; Nawrot, B.; Hanslin, H.M.; Gawronska, H.; Gawronski, S.W. Plant Species Differences in Particulate Matter Accumulation on Leaf Surfaces. Sci. Total Environ. 2012, 427–428, 347–354. [Google Scholar] [CrossRef]
  26. Kwak, M.J.; Lee, J.K.; Park, S.; Kim, H.; Lim, Y.J.; Lee, K.-A.; Son, J.; Oh, C.-Y.; Kim, I.; Woo, S.Y. Surface-Based Analysis of Leaf Microstructures for Adsorbing and Retaining Capability of Airborne Particulate Matter in Ten Woody Species. Forests 2020, 11, 946. [Google Scholar] [CrossRef]
  27. Zhang, L.; Zhang, Z.; Chen, L.; McNulty, S. An Investigation on the Leaf Accumulation-Removal Efficiency of Atmospheric Particulate Matter for Five Urban Plant Species under Different Rainfall Regimes. Atmos. Environ. 2019, 208, 123–132. [Google Scholar] [CrossRef]
  28. Weerakkody, U.; Dover, J.W.; Mitchell, P.; Reiling, K. Topographical Structures in Planting Design of Living Walls Affect Their Ability to Immobilise Traffic-Based Particulate Matter. Sci. Total Environ. 2019, 660, 644–649. [Google Scholar] [CrossRef]
  29. Soltani, N.; Keshavarzi, B.; Moore, F.; Tavakol, T.; Lahijanzadeh, A.R.; Jaafarzadeh, N.; Kermani, M. Ecological and Human Health Hazards of Heavy Metals and Polycyclic Aromatic Hydrocarbons (PAHs) in Road Dust of Isfahan Metropolis, Iran. Sci. Total Environ. 2015, 505, 712–723. [Google Scholar] [CrossRef]
  30. Baldacchini, C.; Sgrigna, G.; Clarke, W.; Tallis, M.; Calfapietra, C. An Ultra-Spatially Resolved Method to Quali-Quantitative Monitor Particulate Matter in Urban Environment. Environ. Sci. Pollut. Res. 2019, 26, 18719–18729. [Google Scholar] [CrossRef]
  31. Hofman, J.; Wuyts, K.; Van Wittenberghe, S.; Brackx, M.; Samson, R. On the Link between Biomagnetic Monitoring and Leaf-Deposited Dust Load of Urban Trees: Relationships and Spatial Variability of Different Particle Size Fractions. Environ. Pollut. 2014, 189, 63–72. [Google Scholar] [CrossRef]
  32. Xu, X.; Zhang, Z.; Bao, L.; Mo, L.; Yu, X.; Fan, D.; Lun, X. Influence of Rainfall Duration and Intensity on Particulate Matter Removal from Plant Leaves. Sci. Total Environ. 2017, 609, 11–16. [Google Scholar] [CrossRef]
  33. Islam, A.; Pattnaik, N.; Moula, M.M.; Rötzer, T.; Pauleit, S.; Rahman, M.A. Impact of Urban Green Spaces on Air Quality: A Study of PM10 Reduction across Diverse Climates. Sci. Total Environ. 2024, 955, 176770. [Google Scholar] [CrossRef]
  34. Przybysz, A.; Popek, R.; Stankiewicz-Kosyl, M.; Zhu, C.Y.; Małecka-Przybysz, M.; Maulidyawati, T.; Mikowska, K.; Deluga, D.; Griżuk, K.; Sokalski-Wieczorek, J.; et al. Where Trees Cannot Grow—Particulate Matter Accumulation by Urban Meadows. Sci. Total Environ. 2021, 785, 147310. [Google Scholar] [CrossRef]
  35. Sgrigna, G.; Sæbø, A.; Gawronski, S.; Popek, R.; Calfapietra, C. Particulate Matter Deposition on Quercus Ilex Leaves in an Industrial City of Central Italy. Environ. Pollut. 2015, 197, 187–194. [Google Scholar] [CrossRef] [PubMed]
  36. Schneider, C.A.; Rasband, W.S.; Eliceiri, K.W. NIH Image to ImageJ: 25 Years of Image Analysis. Nat. Methods 2012, 9, 671–675. [Google Scholar] [CrossRef]
  37. Dzierżanowski, K.; Popek, R.; Gawrońska, H.; Sæbø, A.; Gawroński, S.W. Deposition of Particulate Matter of Different Size Fractions on Leaf Surfaces and in Waxes of Urban Forest Species. Int. J. Phytoremediation 2011, 13, 1037–1046. [Google Scholar] [CrossRef]
  38. Bates, D.; Mächler, M.; Bolker, B.; Walker, S. Fitting Linear Mixed-Effects Models Using Lme4. J. Stat. Softw. 2015, 67. [Google Scholar] [CrossRef]
  39. Kuznetsova, A.; Brockhoff, P.B.; Christensen, R.H.B. lmerTest Package: Tests in Linear Mixed Effects Models. J. Stat. Softw. 2017, 82. [Google Scholar] [CrossRef]
  40. Venables, W.N.; Ripley, B.D. Modern Applied Statistics with S, 4th ed.; Springer: New York, NY, USA, 2002; ISBN 0-387-95457-0. [Google Scholar]
  41. Zeileis, A.; Hothorn, T. Diagnostic Checking in Regression Relationships. R News 2002, 2, 7–10. Available online: https://journal.r-project.org/articles/RN-2002-018/ (accessed on 1 April 2025).
  42. Lüdecke, D. Ggeffects: Tidy Data Frames of Marginal Effects from Regression Models. J. Open Source Softw. 2018, 3, 772. [Google Scholar] [CrossRef]
  43. Cai, B.; Pellegrini, F.; Pang, M.; de Moor, C.; Shen, C.; Charu, V.; Tian, L. Bootstrapping the Cross-Validation Estimate. arXiv 2023, arXiv:2307.00260. [Google Scholar] [CrossRef]
  44. Chen, J.; Yu, X.; Sun, F.; Lun, X.; Fu, Y.; Jia, G.; Zhang, Z.; Liu, X.; Mo, L.; Bi, H. The Concentrations and Reduction of Airborne Particulate Matter (PM10, PM2.5, PM1) at Shelterbelt Site in Beijing. Atmosphere 2015, 6, 650–676. [Google Scholar] [CrossRef]
  45. Tzoulas, K.; Korpela, K.; Venn, S.; Yli-Pelkonen, V.; Kaźmierczak, A.; Niemela, J.; James, P. Promoting Ecosystem and Human Health in Urban Areas Using Green Infrastructure: A Literature Review. Landsc. Urban Plan. 2007, 81, 167–178. [Google Scholar] [CrossRef]
  46. Roy, S.; Byrne, J.; Pickering, C. A Systematic Quantitative Review of Urban Tree Benefits, Costs, and Assessment Methods across Cities in Different Climatic Zones. Urban For. Urban Green. 2012, 11, 351–363. [Google Scholar] [CrossRef]
  47. Freer-Smith, P.H.; Beckett, K.P.; Taylor, G. Deposition Velocities to Sorbus aria, Acer campestre, Populus deltoides × trichocarpa ‘Beaupré’, Pinus nigra and × Cupressocyparis leylandii for Coarse, Fine and Ultra-Fine Particles in the Urban Environment. Environ. Pollut. 2005, 133, 157–167. [Google Scholar] [CrossRef] [PubMed]
  48. Krzysztofik, R.; Rahmonov, O.; Kantor-Pietraga, I.; Dragan, W. The Perception of Urban Forests in Post-Mining Areas: A Case Study of Sosnowiec-Poland. Int. J. Environ. Res. Public Health 2022, 19, 3852. [Google Scholar] [CrossRef]
  49. Taheri Shahraiyni, H.; Sodoudi, S. Statistical Modeling Approaches for PM10 Prediction in Urban Areas; A Review of 21st-Century Studies. Atmosphere 2016, 7, 15. [Google Scholar] [CrossRef]
  50. Mampitiya, L.; Rathnayake, N.; Hoshino, Y.; Rathnayake, U. Performance of Machine Learning Models to Forecast PM10 Levels. MethodsX 2024, 12, 102557. [Google Scholar] [CrossRef]
  51. Silli, V.; Salvatori, E.; Manes, F. Removal of Airborne Particulate Matter by Vegetation in an Urban Park in the City of Rome (Italy): An Ecosystem Services Perspective. Ann. Bot. 2015, 5, 53–62. [Google Scholar] [CrossRef]
  52. Vigevani, I.; Corsini, D.; Mori, J.; Pasquinelli, A.; Gibin, M.; Comin, S.; Szwałko, P.; Cagnolati, E.; Ferrini, F.; Fini, A. Particulate Pollution Capture by Seventeen Woody Species Growing in Parks or along Roads in Two European Cities. Sustainability 2022, 14, 1113. [Google Scholar] [CrossRef]
  53. Xu, X.; Xia, J.; Gao, Y.; Zheng, W. Additional Focus on Particulate Matter Wash-off Events from Leaves Is Required: A Review of Studies of Urban Plants Used to Reduce Airborne Particulate Matter Pollution. Urban For. Urban Green. 2020, 48, 126559. [Google Scholar] [CrossRef]
  54. Kwak, M.J.; Lee, J.; Park, S.; Lim, Y.J.; Kim, H.; Jeong, S.G.; Son, J.; Je, S.M.; Chang, H.; Oh, C.-Y.; et al. Understanding Particulate Matter Retention and Wash-Off during Rainfall in Relation to Leaf Traits of Urban Forest Tree Species. Horticulturae 2023, 9, 165. [Google Scholar] [CrossRef]
  55. Wu, Y.; Liu, J.; Zhai, J.; Cong, L.; Wang, Y.; Ma, W.; Zhang, Z.; Li, C. Comparison of Dry and Wet Deposition of Particulate Matter in Near-Surface Waters during Summer. PLoS ONE 2018, 13, e0199241. [Google Scholar] [CrossRef] [PubMed]
  56. Janhäll, S. Review on Urban Vegetation and Particle Air Pollution—Deposition and Dispersion. Atmos. Environ. 2015, 105, 130–137. [Google Scholar] [CrossRef]
  57. Gromke, C.; Ruck, B. Influence of Trees on the Dispersion of Pollutants in an Urban Street Canyon—Experimental Investigation of the Flow and Concentration Field. Atmos. Environ. 2007, 41, 3287–3302. [Google Scholar] [CrossRef]
  58. Vos, P.E.J.; Maiheu, B.; Vankerkom, J.; Janssen, S. Improving Local Air Quality in Cities: To Tree or Not to Tree? Environ. Pollut. 2013, 183, 113–122. [Google Scholar] [CrossRef]
  59. Zheng, G.; Li, P. Resuspension of Settled Atmospheric Particulate Matter on Plant Leaves Determined by Wind and Leaf Surface Characteristics. Environ. Sci. Pollut. Res. 2019, 26, 19606–19614. [Google Scholar] [CrossRef]
  60. Mori, J.; Fini, A.; Galimberti, M.; Ginepro, M.; Burchi, G.; Massa, D.; Ferrini, F. Air Pollution Deposition on a Roadside Vegetation Barrier in a Mediterranean Environment: Combined Effect of Evergreen Shrub Species and Planting Density. Sci. Total Environ. 2018, 643, 725–737. [Google Scholar] [CrossRef]
  61. Bottalico, F.; Chirici, G.; Giannetti, F.; De Marco, A.; Nocentini, S.; Paoletti, E.; Salbitano, F.; Sanesi, G.; Serenelli, C.; Travaglini, D. Air Pollution Removal by Green Infrastructures and Urban Forests in the City of Florence. Agric. Agric. Sci. Procedia 2016, 8, 243–251. [Google Scholar] [CrossRef]
  62. Popek, R.; Fornal-Pieniak, B.; Chyliński, F.; Pawełkowicz, M.; Bobrowicz, J.; Chrzanowska, D.; Piechota, N.; Przybysz, A. Not Only Trees Matter—Traffic-Related PM Accumulation by Vegetation of Urban Forests. Sustainability 2022, 14, 2973. [Google Scholar] [CrossRef]
  63. Zhang, Z.; Liu, J.; Wu, Y.; Yan, G.; Zhu, L.; Yu, X. Multi-Scale Comparison of the Fine Particle Removal Capacity of Urban Forests and Wetlands. Sci. Rep. 2017, 7, 46214. [Google Scholar] [CrossRef]
  64. Kończak, B.; Cempa, M.; Pierzchała, Ł.; Deska, M. Assessment of the Ability of Roadside Vegetation to Remove Particulate Matter from the Urban Air. Environ. Pollut. 2021, 268, 115465. [Google Scholar] [CrossRef] [PubMed]
  65. Wang, X.; Teng, M.; Huang, C.; Zhou, Z.; Chen, X.; Xiang, Y. Canopy Density Effects on Particulate Matter Attenuation Coefficients in Street Canyons during Summer in the Wuhan Metropolitan Area. Atmos. Environ. 2020, 240, 117739. [Google Scholar] [CrossRef]
Figure 1. The location of the LCWM in north-western Greece (upper left box) and an enlargement of the LCMW with the location of the study area, at the restored mines of Ptolemaida (40.39° to 40.51° N, 21.70° to 21.89° E; upper right box). The low right box depicts an enlarged map of the studied black locust restoration plantation (green color), the four selected transects where measurements were conducted (white dots), and the conveyor belt (black lines) which is the PM10-emitting source. The climate diagram of the study area is shown in the lower left box.
Atmosphere 16 00555 g001
Figure 2. The seasonal variation of PM10 retention per leaf area (μg m−2) of black locust restoration plantations at LCWM, Greece, during the growing season (May to October). The horizontal lines represent mean values (n = 120, except for May, where n = 60), the bars indicate the standard deviation of the means and the dots represent outliers. Different letters depict statistically significant differences among months at p < 0.05.
Atmosphere 16 00555 g002
Figure 3. (a) The seasonal variation of the mean monthly PM10 production by the belt conveyor system (n = 2 measurements per month) and (b) mean monthly Leaf Area Index (LAI) of the black locust restoration plantations (n = 8) at the LCWM, Greece, during the growing season (May to October). The horizontal lines represent mean values, the bars indicate standard deviation of the mean, and the dots represent outliers. Different letters depict statistically significant differences among months at p < 0.05 (only for LAI).
Atmosphere 16 00555 g003
Figure 4. The correlation matrix indicating pairwise Pearson correlations between PM10 retention per leaf area and all tested drivers. PM10 production stands for PM10 produced by the belt conveyor system from the last rain event until the day of sampling—kg, Distance stands for the distance of the belt conveyor system from the plantations—m, Rainfall stands for the cumulative rain of 5 days prior to sampling—mm, Wind Speed stands for mean monthly wind speed—km h−1, RH stands for mean air relative humidity of the last 5 days prior to sampling—%, Month indicates the month of sampling, LAI indicates the monthly leaf area index of the plantations—m2 m−2, and Crown Height indicates the position of the sampled leaves within the tree canopy—high, medium, and low. Positive and negative relationships are indicated by red and blue colors, respectively. One, two, or three asterisks indicate the level of significance (p < 0.05, p < 0.01, and p < 0.001), respectively.
Atmosphere 16 00555 g004
Figure 5. The partial effect of the significant drivers on PM10 retention per leaf area: (a) PM10 production from the belt conveyor system from the last rain event until sampling, (b) distance from the source of PM10 (belt conveyor), (c) LAI, (d) wind speed, and (e) crown height, where c represents the lower crown height, while a and b represent the higher and middle crown heights, respectively.
Atmosphere 16 00555 g005
Table 1. Coefficient estimates from the whole dataset and the bootstrap cross-validated robust regression model and the 5–95% bootstrap percentiles. The z value and the corresponding p level are from the robust regression model on the whole dataset.
CoefficientsWhole Dataset Estimatez Valuep LevelBootstrap EstimateBootstrap Percentiles
Intercept58.9106.328<0.00158.65840.875–75.642
PM10 production0.01722.484<0.0010.0170.015–0018
Distance from source−0.738−4.426<0.001−0.733−1.034–−0.417
LAI−13.740−4.577<0.001−13.674−19.142–−7.928
Wind speed0.9314.758<0.0010.9340.572–1.297
Crown height c3.6862.662<0.013.8371.324–6.362
Distance x LAI0.1542.757<0.010.1520.048–0.250
Disclaimer/Publisher’s Note: The statements, opinions and data contained in all publications are solely those of the individual author(s) and contributor(s) and not of MDPI and/or the editor(s). MDPI and/or the editor(s) disclaim responsibility for any injury to people or property resulting from any ideas, methods, instructions or products referred to in the content.

