Article

Climate Change in Southeast Tibet and Its Potential Impacts on Cryospheric Disasters

1
Key Laboratory of Mountain Hazards and Engineering Resilience, Institute of Mountain Hazards and Environment, Chinese Academy of Sciences, Chengdu 610299, China
2
State Key Laboratory of Cryospheric Science and Frozen Soil Engineering, Northwest Institute of Eco-Environment and Resources, Chinese Academy of Sciences, Lanzhou 730000, China
3
China-Pakistan Joint Research Centre on Earth Sciences, CAS-HEC, Islamabad 610041, Pakistan
*
Authors to whom correspondence should be addressed.
Atmosphere 2025, 16(5), 547; https://doi.org/10.3390/atmos16050547
Submission received: 21 March 2025 / Revised: 30 April 2025 / Accepted: 2 May 2025 / Published: 5 May 2025
(This article belongs to the Special Issue Climate Change in the Cryosphere and Its Impacts)

Abstract

:
Southeast Tibet is characterized by extensive alpine glaciers and deep valleys, making it highly prone to cryospheric disasters such as avalanches, ice/ice–rock avalanches, glacial lake outburst floods, debris flows, and barrier lakes, which pose severe threats to infrastructure and human safety. Understanding how cryospheric disasters respond to climate warming remains a critical challenge. Using 3.3 km resolution meteorological downscaling data, this study analyzes the spatiotemporal evolution of multiple climate indicators from 1979 to 2022 and assesses their impacts on cryospheric disaster occurrence. The results reveal a significant warming trend across Southeast Tibet, with faster warming in glacier-covered regions. Precipitation generally decreases, though the semi-arid northwest experiences localized increases. Snowfall declines, with the steepest decrease observed around the lower reaches of the Yarlung Zangbo River. In the moisture corridor of the lower reaches of the Yarlung Zangbo River, warming intensifies freeze–thaw cycles, combined with high baseline extreme daily precipitation, which increases the likelihood of glacial disaster chains. In northwestern Southeast Tibet, accelerated glacier melting due to warming, coupled with increasing extreme precipitation, heightens glacial disaster probabilities. While long-term snowfall decline may reduce avalanches, high baseline extreme snowfall suggests short-term threats remain. Finally, this study establishes meteorological indicators for predicting changes in cryospheric disaster risks under climate change.

1. Introduction

The Tibetan Plateau (TP) is the highest huge plateau in the world, with an elevation exceeding 4000 m. It is characterized by a cold and arid climate, widespread glaciers and permafrost, and a fragile ecosystem, making it a hotspot for global change research [1,2,3,4,5,6]. Southeast Tibet (SET) lies in the area where the TP descends toward the Yarlung Zangbo–Brahmaputra River Valley; thus, it is one of the most distinctive regions within the TP. Compared to most areas of the TP, SET experiences a warmer and more humid climate [7,8]. The region is dominated by steep mountain valleys, which create pronounced vertical climate and vegetation zonation, fostering some of the world’s richest biodiversity [9,10]. However, the complex geological, geomorphological, and climatic conditions of SET render it one of the most geohazard-prone regions in China, exhibiting both a high frequency and a wide variety of disaster types. These hazards pose significant threats to local residents’ livelihoods, critical transportation routes, and the safety of major infrastructure projects [11,12]. The 1950 Medog–Zayü M8.6 earthquake was the strongest recorded earthquake in China [13]. The 1988 Guangxiecuo glacial lake outburst flood (GLOF) caused devastating destruction in Midui Village downstream [14]. In 2000, the Yigong ice–rock avalanche—landslide—barrier lake—outburst disaster chain caused extensive infrastructure damage and casualties along the Yarlung Zangbo–Brahmaputra River [15]. In recent years, frequent ice–rock avalanches—debris flows/landslides—barrier lake events in Tianmo Gully and Sedongpu Gully have severely threatened local villages and road accessibility [16,17]. Additionally, avalanche disasters occurred in the Duoxiongla Mountains during the winters of 2021–2023, leading to road blockages and casualties [18]. Notably, most of these disasters in SET are closely linked to the cryosphere. With global warming, SET has undergone intensified glacier retreat and glacial lake expansion in recent decades [19,20,21], suggesting that climate change may significantly influence the occurrence of disasters or disaster chains in this region [22,23]. Therefore, it is imperative to obtain a comprehensive understanding of the climate change history and its role in triggering geohazards in SET.
Previous studies, based on meteorological station observations and climate proxies, have revealed the spatiotemporal characteristics of temperature, precipitation, snowfall, and extreme climate indices in SET. Research has demonstrated that the region is experiencing an unprecedented warming trend, with a warming rate exceeding both the national and global averages [24,25,26]. Precipitation in SET has shown an overall decreasing trend, albeit with regional discrepancies and multiple decadal mutations [27,28,29]. Another consequence of climate warming is the increased frequency of extreme weather and climate events. Both extreme high-temperature and low-temperature events have become more frequent, with a more pronounced increase in extreme high temperatures [30,31]. The trend in extreme precipitation remains insignificant [32], although some studies indicate a general decline in maximum daily precipitation and consecutive wet days, accompanied by a rise in consecutive dry days [33,34]. Under the combined effects of warming and decreasing precipitation, snowfall, extreme snowfall days, and snow cover extent, duration, and depth have shown a severe and widespread decline [35,36,37,38]. Previous research has also examined the effects of meteorological elements in the past geohazard events in SET. It is widely recognized that warming and extreme climates—aside from tectonic factors—are the primary triggers of recent ice rock avalanches, GLOFs, glacial debris flows, and other disasters or disaster chains in SET [39,40]. The increased frequency of freeze–thaw cycles accelerates rock weathering and fragmentation, supplying abundant loose materials for debris flows and facilitating ice–rock avalanches, as observed in the recent disaster chain events in the Sedongpu, Zhibai, and Tianmo Gullies [16,41,42]. At the regional scale, extensive studies have identified the geological and geomorphological factors influencing geohazard occurrence [43,44,45,46]. However, due to data limitations, high-resolution meteorological datasets have rarely been applied to analyze the regional patterns of geohazard occurrence, leaving the meteorological drivers of geohazards insufficiently explored. This knowledge gap hinders a comprehensive understanding and accurate forecasting of geohazards under climate change.
This study utilizes the highest-resolution and most accurate meteorological downscaling dataset available to examine historical climate changes in SET and evaluate the roles of climate factors and their variability in geohazard occurrence. Initially, we analyzed the spatiotemporal patterns and long-term trends of temperature, precipitation, and snowfall across SET over the past four decades. Subsequently, we explored how these meteorological variables behave specifically in glacier-covered and avalanche-prone regions, assessing their potential impacts on cryospheric disasters or disaster chains under changing climate conditions. Finally, we identified the optimal combination of meteorological indicators for predicting disaster occurrences associated with climate change in the cryosphere of SET. This research aims to provide critical theoretical insights into the occurrence and evolution of geohazards—especially cryospheric disasters and associated disaster chains—in response to climate change in SET, thereby supporting regional hazard assessment and disaster risk management efforts.

2. Study Area, Data, and Methods
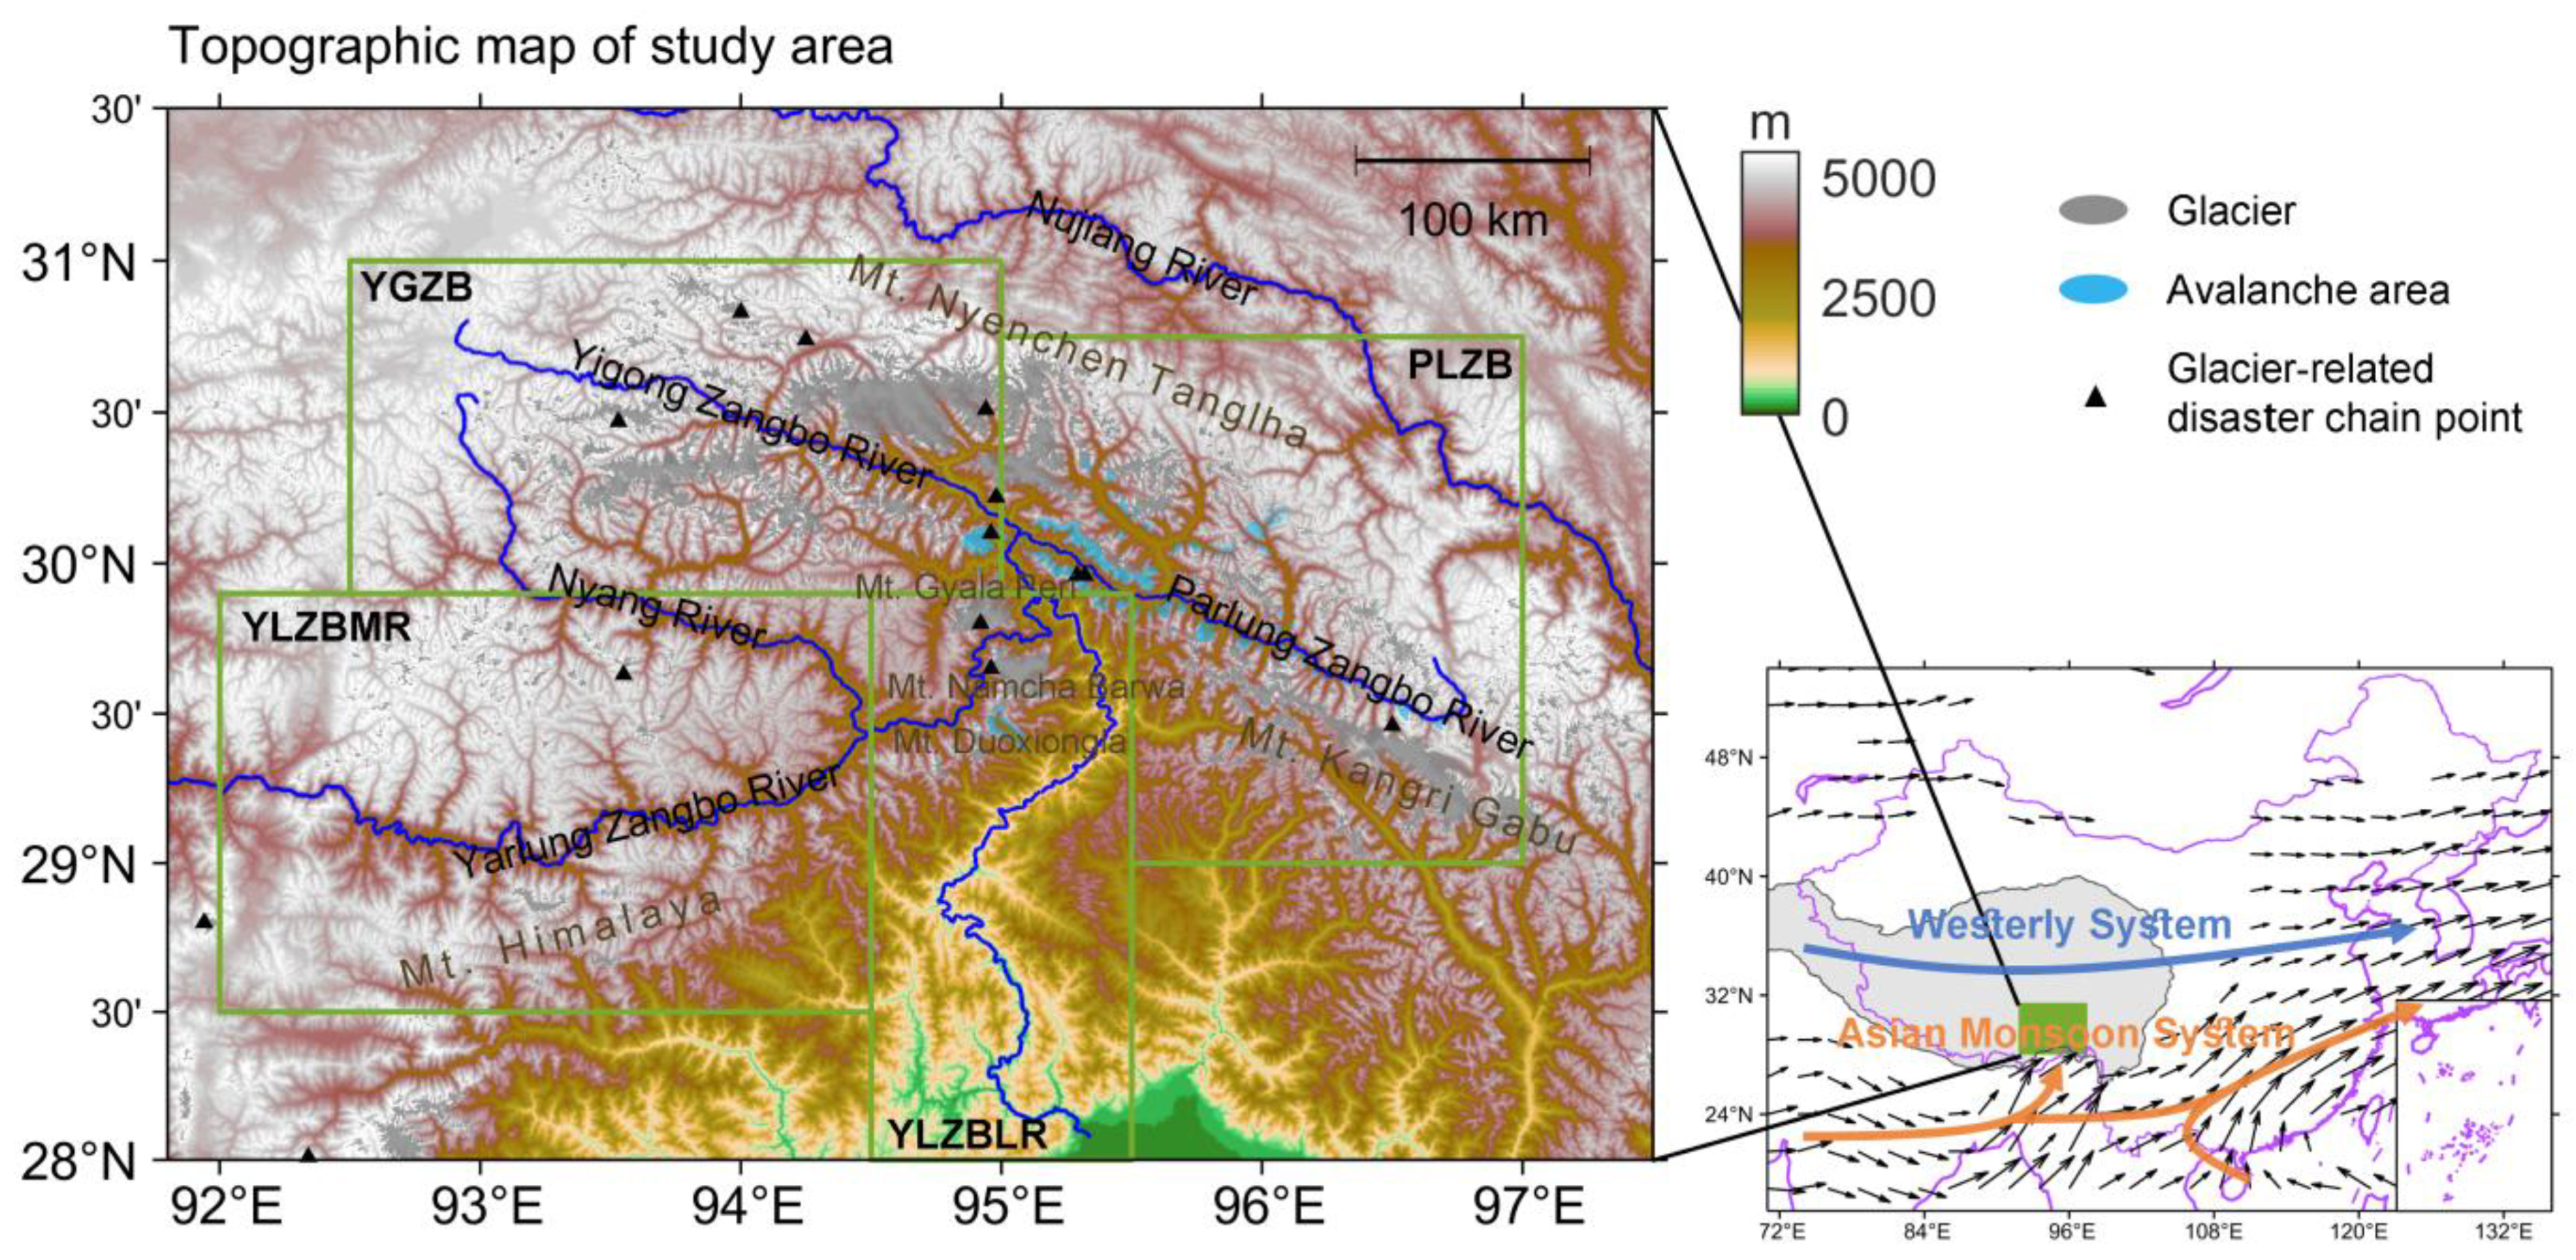
2.1. Study Area

The SET region is located in southwestern China, at the southeastern margin of the TP, forming a transitional zone between the TP and the Brahmaputra Plain (Figure 1). The topography in this region is highly complex, ranging from the towering Namcha Barwa Peak (over 7700 m) to the Yarlung Zangbo–Brahmaputra River Valley, where elevations drop below 200 m.
The Asian monsoon and the westerlies are the two dominant atmospheric circulation systems shaping the regional climate. In summer, the monsoon transports large amounts of moisture along the Yarlung Zangbo River Valley, which ascends and condenses along the windward slopes of the Himalayas, Nyenchen Tanglha, and Kangri Gabu Mountains, leading to orographic precipitation. In winter, the southern branch of the westerlies also brings significant moisture and snowfall to the region. Consequently, SET receives substantially more precipitation than other parts of the TP, with local annual precipitation maxima reaching up to 4000 mm [47].
SET is characterized by a dense river network (Figure 1). The Nyenchen Tanglha Mountains divide the Yarlung Zangbo River Basin from the Nujiang River Basin. This study primarily focuses on the area within the Yarlung Zangbo River Basin, where the river cuts through the Himalayas, Nyenchen Tanglha, and Kangri Gabu Mountains, forming a dramatic 180-degree bend. Meanwhile, the Yarlung Zangbo River also integrates several major tributaries, including the Parlung Zangbo, Yigong Zangbo, and Niyang Rivers. The active tectonic processes and deeply incised valleys in this region create extreme elevation differences, giving rise to various natural disasters or disaster chains, particularly ice–rock avalanches, GLOFs, glacial debris flows, and avalanches, which are closely linked to cryospheric processes. The Himalayas, Nyenchen Tanglha, and Kangri Gabu Mountains host extensive alpine glaciers, and the catchments connecting these glaciers to the main valleys are highly susceptible to debris flows. Additionally, unstable glacial lakes near glacier termini pose a potential risk of GLOF disasters. Table 1 summarizes the major glacial disaster chain events that have occurred in the study area over the past 40 years.
Based on climatic and hydrological differences, we have classified the study area into four subregions (Figure 1): the lower reaches of the Yarlung Zangbo River (YLZBLR), the middle reaches of the Yarlung Zangbo River (YLZBMR), the Yigong Zangbo River (YGZB), and the Parlung Zangbo River (PLZB). Under this classification, the sites of frequently occurring disaster chains in recent years, Sedongpu Gully and Zhibai Gully, are both located within the YLZBLR subregion, corresponding to the glacier-covered areas of the Gyala Peri and Namcha Barwa Peaks, respectively. In contrast, glaciers in the YLZBMR subregion are relatively scattered and small, resulting in fewer glacial disaster chain events. Several major disaster chain events in recent decades, such as the Peilong Gully debris flow, Zhamunong Gully landslide (i.e., Yigong landslide), and Tianmo Gully debris flow, occurred near the boundary between the YGZB and PLZB subregions, where the elevation is relatively lower. This zone serves as a monsoon moisture corridor, bringing higher precipitation and supporting well-developed glaciers, which together contribute to the frequent occurrence of disaster chains. Moreover, avalanches are likely widespread across SET. However, according to ref. [45], the currently identified avalanche-prone areas are concentrated near Duoxiongla Mountain, south of Namcha Barwa, and in the PLZB Basin, which are the primary focus areas for avalanche research in SET.
Figure 1. Topographic map of the study area in Southeast Tibet. The map highlights the primary rivers and mountains of Southeast Tibet, glaciers (gray patches), primarily concerned avalanche-prone areas (light blue patches), and points of major glacial disaster chains in recent decades (see Table 1; black triangles). The green boxes indicate the four subregions in Southeast Tibet: the lower reaches of the Yarlung Zangbo River (YLZBLR), the middle reaches of the Yarlung Zangbo River (YLZBMR), the Yigong Zangbo River (YGZB), and the Parlung Zangbo River (PLZB). The subgraph in the bottom right corner shows the location of the study area within China and the Tibetan Plateau (gray patch), with vectors representing the climatological annual mean water vapor flux. The two primary climate systems, the Asian monsoon and westerlies, that drive climate changes in Southeast Tibet are shown in the subgraph. The water vapor flux data are derived from the fifth-generation ECMWF atmospheric reanalysis (ERA5) [48].
Atmosphere 16 00547 g001
Table 1. List of major glacial disaster chain events observed from 1979 to 2022 over Southeast Tibet according to references from [11,12,49].
SiteLat. (°N)Lon. (°E)Occur. TimeSub-AreaDisaster ChainInducing Factors
Peilong Gully30.194.96Jul, 1983, Aug, 1984; Jun, 1985YGZBice–rock avalanche—GLOF—debris flowPre. and Temp.
Midui Gully29.4696.5Jul, 1988PLZBice–rock avalanche—GLOF—debris flowPre. and Temp.
Xiaga Lake28.8091.94May, 1995YLZBMRice avalanche—GLOFTemp.
Zhamunong Gully30.2294.98Apr, 2000YGZBice–rock avalanche—landslide—barrier dam—outburst floodTemp.
Ouguchonggu Co29.6393.552003YLZBMRice–rock avalanche—GLOFUnknown
Tianmo Gully29.9695.29Sep, 2007; Jul, 2010;
Sep, 2010;
Jul, 2018
PLZBice–rock avalanche—debris flow—barrier damPre. and Temp.
Jianmupuqu River29.9695.32Apr, 2008PLZBice–rock avalanche—debris flow—barrier dam—floodPre. and Temp.
Zhemai Co28.0192.34Jul, 2009Otherice avalanche—GLOFTemp.
Cuoga Lake30.8394.00Jul, 2009YGZBice–rock avalanche—GLOFUnknown
Ranzeria Co30.4793.53Jul, 2013YGZBice–rock avalanche—GLOF—debris flowPre. and Temp.
Nalongzangbu Gully30.5194.94Jun, 2014YGZBice–rock avalanche—debris flow—GLOFPre. and Temp.
Tula Gully30.7494.25Jul, 2015YGZBice–rock avalanche—GLOFPre. and Temp.
Sedongpu Gully29.894.922014; Oct, 2017; Dec, 2017; Jul, 2018; Oct, 2018YLZBLRice–rock avalanche—debris flow—barrier damEarthq. and Pre.
Zhibai Gully29.6594.96Sep, 2020YLZBLRice–rock avalanche—debris flowEarthq. and Temp.

2.2. Data

The daily mean, maximum, and minimum temperature and precipitation data were obtained from the meteorological forcing dataset for the Third Pole region (TPMFD) [50]. This dataset covers 1979–2022 with a horizontal resolution of 1/30° (≈3.3 km) and was developed by downscaling 0.25°-resolution fifth-generation ECMWF reanalysis (ERA5) data using a combination of convection-permitting Weather Research and Forecasting (WRF) model simulations and convolutional neural network (CNN) deep learning downscaling models [51]. The key downscaling techniques include refined radiation parameterization, terrain drag parameterization, and optimized physical schemes, which significantly enhance the accuracy of temperature and precipitation estimates in complex terrain [52]. Additionally, the deep learning downscaling process incorporates data from >9000 rain gauge observations for bias correction. Evaluations confirm that TPMFD outperforms other existing downscaled datasets, making it one of the most reliable precipitation datasets for climate, hydrology, and hazard studies in the Third Pole region, i.e., the TP [53].
The terrain data were sourced from the Shuttle Radar Topography Mission Digital Elevation Model (SRTM DEM). The glacier coverage data were obtained from the Second Glacier Inventory Dataset of China [54]. The avalanche areas, sourced from ref. [45], were identified using a combination of remote sensing visual interpretation, machine learning algorithms, and field investigations. The boundary data of glacier coverage area and avalanche gullies are all polygon shape files.

2.3. Methods

2.3.1. Snowfall Calculation

The daily snowfall is calculated using daily near-surface temperature, precipitation, specific humidity, and pressure data, based on the temperature threshold approach [55,56]. This method determines precipitation type (rain, sleet, or snow) using the wet-bulb temperature (Tw). The snowfall amount is then estimated as a fraction of total daily precipitation (P) using the following formula:
s n o w f a l l = P × 1 ,   T w T m i n T m a x T w T m a x T m i n , T m i n T w T m a x 0 , T w T m a x
where Tmin and Tmax are the lower and upper threshold temperatures, respectively, where all precipitation occurs as snow or rain. The Tw is derived using the following equation:
T w = T e s a t T 1 R H 0.000643 × p s f c + e s a t T
where T, RH, and psfc indicate temperature, relative humidity, and pressure, respectively. esat is saturated vapor pressure and is calculated using the Magnus formula, while RH is derived from esat, specific humidity (q) and psfc. The formulas are written as follows:
e s a t = 6.112 × exp 17.67 × T 273.15 T 29.66    
R H = q × p s f c 0.378 × e s a t / 0.62197 × e s a t

2.3.2. Extracting Meteorological Data in Glacier and Avalanche Areas

In addition to analyzing regional climate change characteristics in SET, this study focuses on meteorological indicators in glacier-covered and avalanche-prone areas. For glacier-covered areas, the original polygon data were projected onto a 1/300° grid (one-tenth of the meteorological data resolution). A grid cell was classified as glacier-covered if at least 50% of its area (50 grids) was covered by glaciers; otherwise, it was classified as a non-glacier area. This classification generated a glacier coverage atlas aligned with the meteorological data grid, which was then used to extract meteorological data for the corresponding regions. The same method was applied to extract meteorological data in avalanche-prone areas.
A total of 10 meteorological indicators were used for analysis (Table 2). In these, temperature indicators included annual mean temperature (Tavg), annual extreme maximum temperature (TXmax), percentage of days with daily mean temperature above 0 °C in a whole year (DTg0), and percentage of days with daily minimum temperature below 0 °C and daily maximum temperature above 0 °C in a whole year (DTc0). Precipitation indicators included annual total precipitation (Ptot), maximum daily precipitation (PX1d), and maximum cumulative precipitation for 7 consecutive days (PX7d). Snowfall indicators contained annual total snowfall (Stot), maximum daily snowfall (SX1d), and maximum cumulative snowfall for 3 consecutive days (SX3d). A full year for calculating snow-related variables spans from September of the previous year to August of the current year.

2.3.3. Trend Estimate and Test

Trends of meteorological variables from 1979 to 2022 were examined using the Theil–Sen (Sen’s) slope estimator [57] and tested with the Mann–Kendall (M–K) trend test [58]. Sen’s slope calculates the median slope between all possible pairs of data points in a time series, using the following formula:
β = median X j X i j i ,         i < j
where Xi and Xj are data values at time indices i and j, respectively. If β > 0, the time series exhibits an increasing trend, whereas β < 0 indicates a decreasing trend. The M–K trend test is a non-parametric rank-based test used to assess the statistical significance of a trend in time series. It is applied using the normally distributed statistic Z:
Z = 4 n n 1 i = 1 n 1 r i 1 4 n + 10 9 n n 1 1 / 2
where n is the length of the time series, and ri is the rank of series X at time index i, calculated as the total number for X j > X i , j > i . When |Z|>Zα, the trend is considered statistically significant at the significance level α.

2.3.4. Violin Plot and Rank-Sum Test

We analyzed the probability distribution characteristics of meteorological variables in glacier and avalanche areas using violin plots. A violin plot is a visualization tool that combines a box plot and a kernel density plot, allowing for a detailed representation of the distribution, spread, and shape of a dataset. It displays the median, interquartile range (IQR), and density, making it useful for identifying differences among groups, especially when data are non-normally distributed.
The Wilcoxon rank-sum test is a non-parametric statistical test used to compare two independent groups and determine whether their distributions differ significantly. Unlike the t-test, it does not assume normality and instead relies on ranking data rather than their absolute values. The test procedure first combines and sorts the two groups, then calculates the test statistic:
U = n 1 n 2 + n 1 n 1 + 1 2 R 1
where n1 and n2 are the sample sizes of the two groups, and R1 is the rank sum of the first group. A p-value of 0.05 from the rank-sum test indicates a statistically significant difference between the two groups.

3. Results

3.1. Regional Climate Distributions and Changes in SET

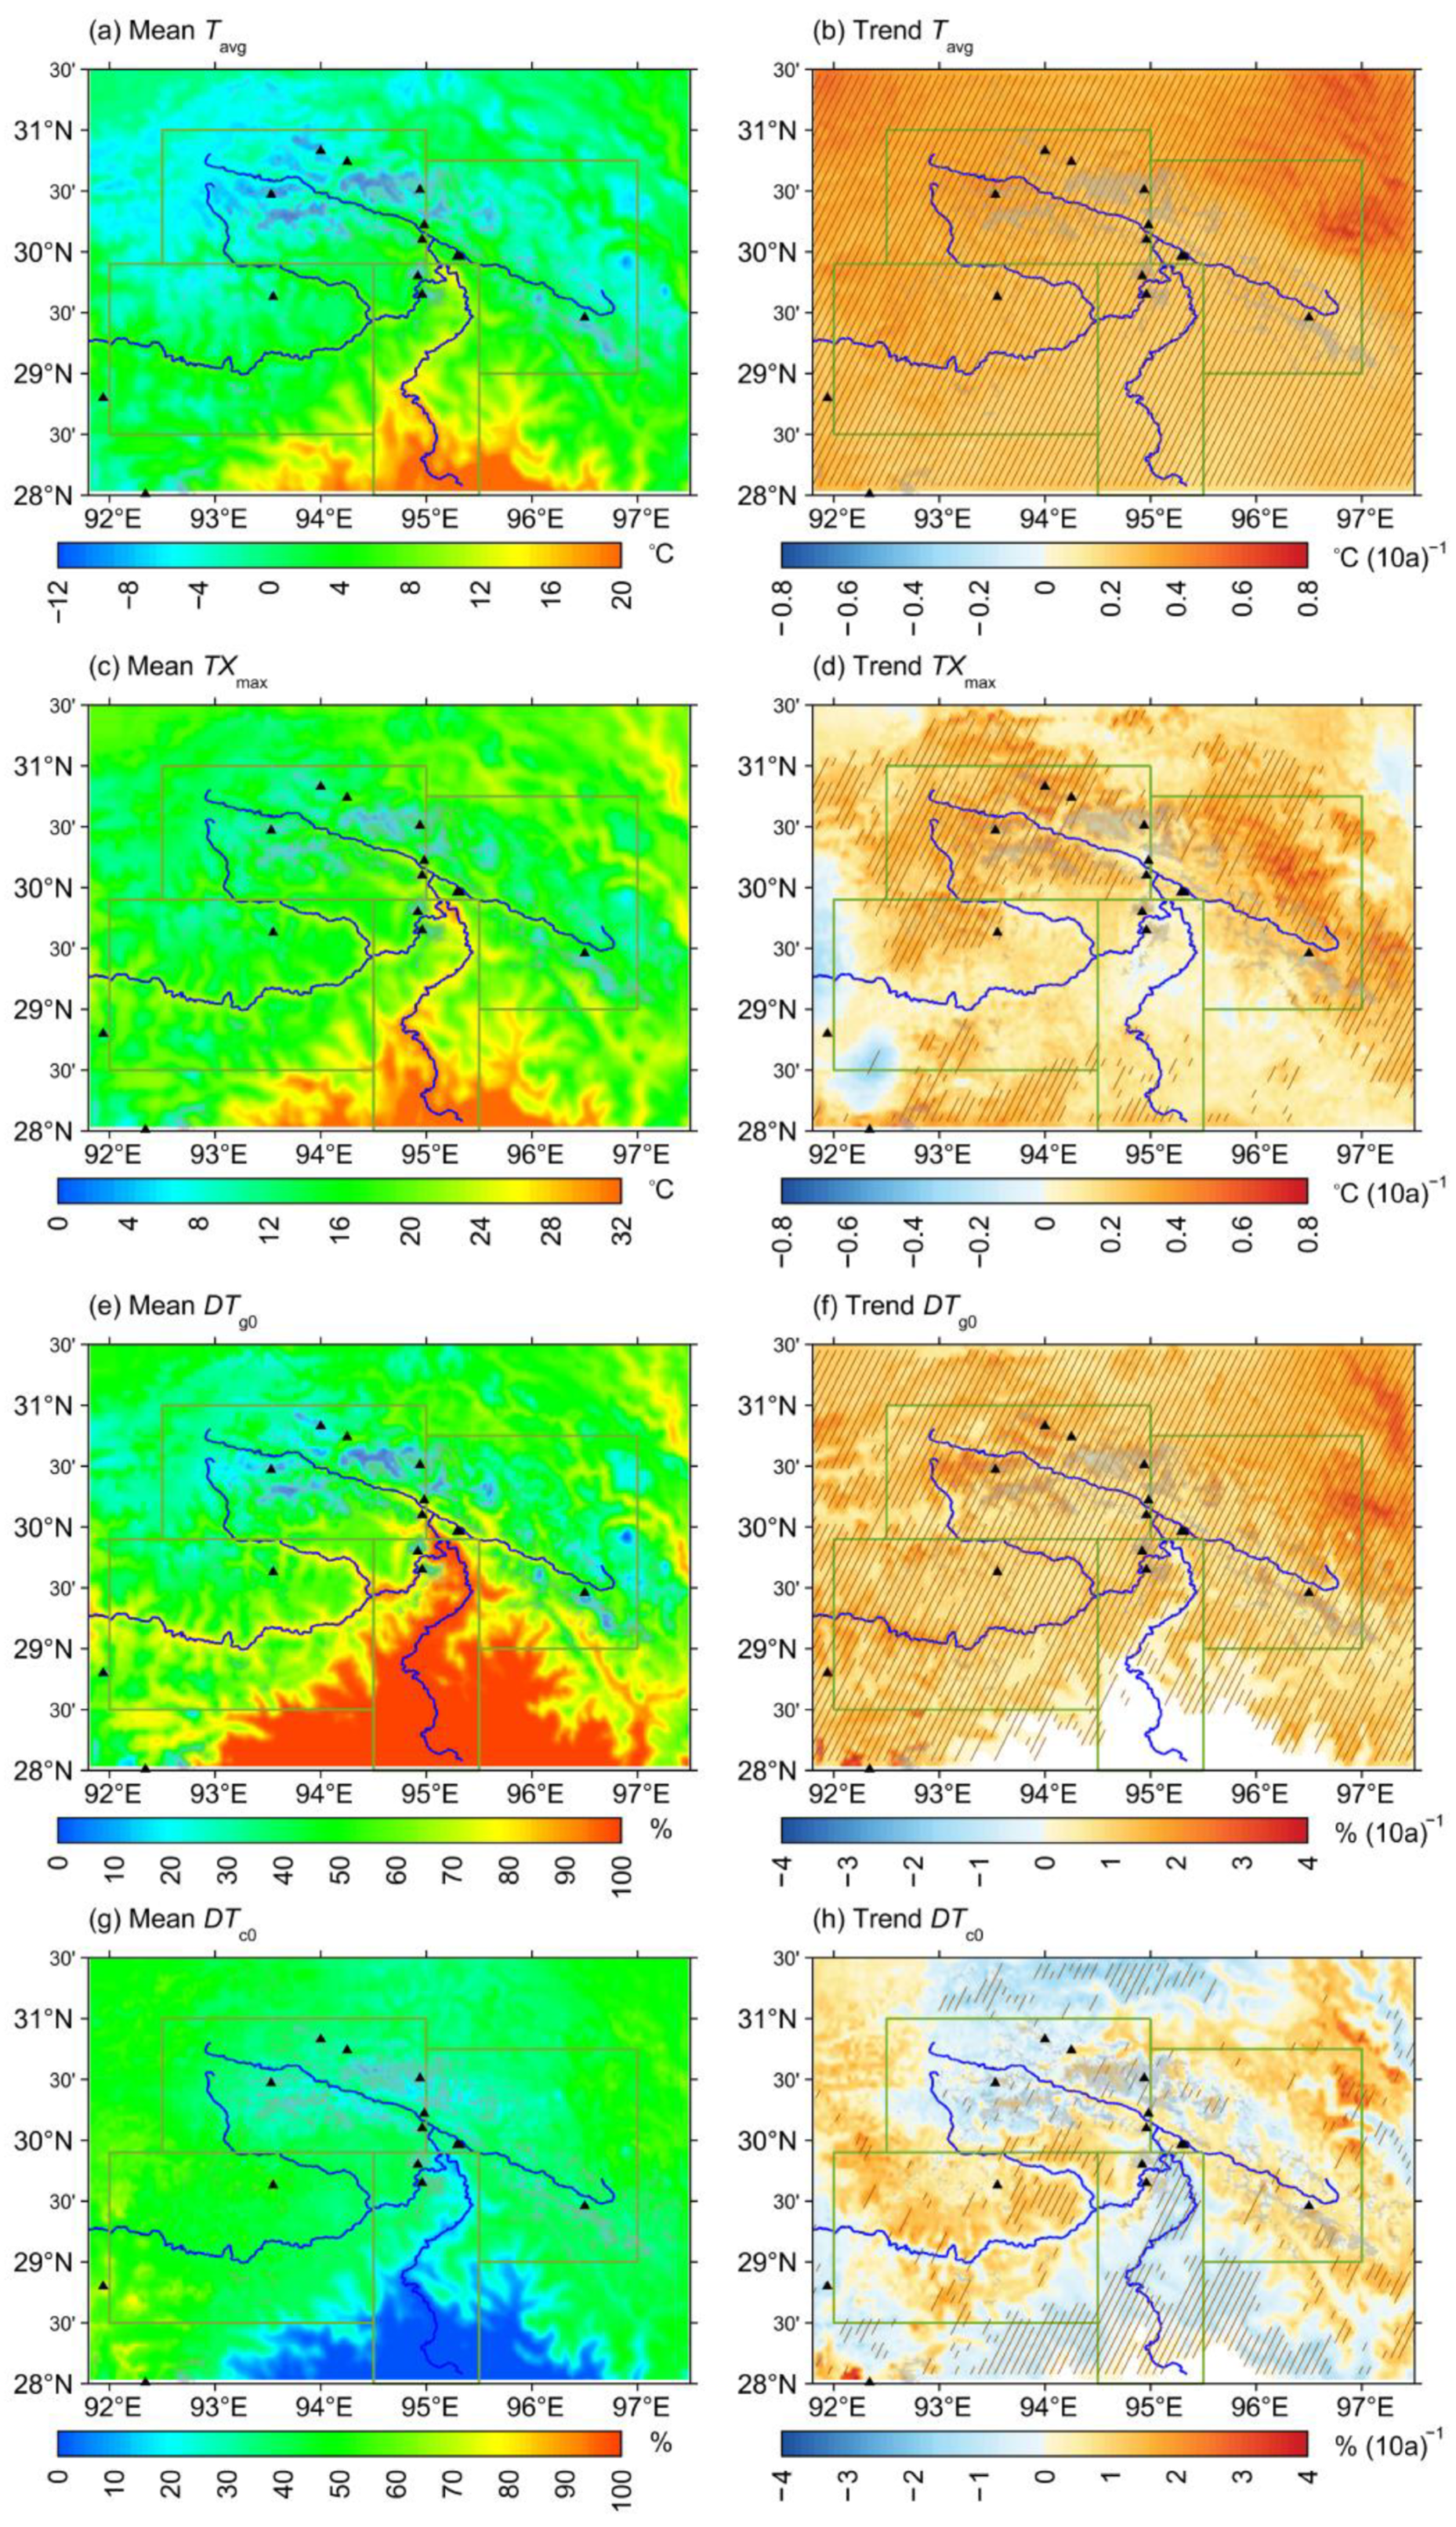
3.1.1. Regional Temperature Distributions and Changes

The Tavg in SET ranges from −8 °C to 16 °C (Figure 2a). Among the subregions, YGZB has the lowest regional average Tavg (−3.1 °C), followed by PLZB (0.3 °C), YLZBMR (2.3 °C), and YLZBLR (11.7 °C). The temperature distribution closely corresponds to elevation, as YGZB and PLZB contain extensive alpine glacier-covered areas, where temperatures remain frigid, with Tavg generally below 0 °C and in some places even below −8 °C. From 1979–2022, the entire SET region experienced a significant warming trend, exceeding the 0.05 significance level of the M–K test (Figure 2b). Notably, colder regions exhibited stronger warming trends. The YGZB subregion showed the most pronounced warming trend at +0.32 °C/decade, followed by PLZB (+0.29 °C/decade), YLZBMR (+0.27 °C/decade), and YLZBLR (+0.21 °C/decade). Seasonally, the most pronounced warming trend occurred in winter, with the most intense temperature increases observed in the high-altitude areas north of SET. The magnitude of the warming trend then decreases sequentially from autumn to summer, and finally to spring (Figure S1a–d).
The spatial pattern of the TXmax closely resembles that of the mean temperature, where TXmax is lower in alpine glacier areas and higher in river valleys. Across the SET region, TXmax is generally above 0 °C, with some areas in YLZBLR exceeding 30 °C (Figure 2c). From 1979 to 2022, TXmax exhibited an overall increasing trend, with the strongest warming occurring in the colder northern regions, reaching +0.25 °C/decade or more. However, this trend was less significant in the YLZBLR subregion and the Kangri Gabu Mountains of PLZB, where the increase was only about +0.1 °C/decade (Figure 2d).
Days with mean temperatures above 0 °C create favorable conditions for glacier melt and snowmelt, which can trigger ice and snow avalanches [59]. This study analyzed the spatial distribution and trends of DTg0, an indicator representing the percentage of days per year with mean temperatures above 0 °C (Table 2). Similar to the distributions of Tavg and TXmax, DTg0 increases from north to south. In most areas of the YLZBLR, the daily mean temperature remains above 0 °C for the majority of the year, while alpine glacier areas in the north experience fewer than 10% of days per year above 0 °C (Figure 2e). The regional averages of DTg0 are approximately 90% in the YLZBLR, 60% in the YLZBMR, 40% in the YGZB, and 50% in the PLZB. From 1979 to 2022, DTg0 showed a significant increasing trend across the SET region, with the largest increases occurring in alpine glacier regions (+2–4%/decade), while other regions saw a lower increase of +1–2%/decade (Figure 2f). The regional-average DTg0 increased by +0.4%/decade in the YLZBLR, +1.0%/decade in the YLZBMR, +1.1%/decade in the YGZB, and +1.2%/decade in the PLZB. The rise in DTg0 promotes glacier and snow melt.
Fluctuating temperatures around 0 °C enhance freeze–thaw cycles, which can lead to glacier collapse and rock disintegration, facilitating ice–rock avalanches and contributing to weathering and erosion, ultimately supplying material for glacial debris flows [60]. To quantify freeze–thaw intensity, we used DTc0 (Table 2), an indicator representing the percentage of days per year when the daily minimum temperature is below 0 °C while the daily maximum temperature exceeds 0 °C. Among the subregions, the YLZBMR exhibited the highest DTc0, accounting for more than 40% of the year, due to its large daily temperature variations. In contrast, the YLZBLR subregion, which has a warmer climate, recorded less than 20% DTc0. The alpine glacier areas of the YGZB and PLZB, due to persistently low temperatures, also exhibited relatively fewer DTc0, accounting for approximately 30% of the year (Figure 2g). Under the warming trend, changes in DTc0 varied significantly across the SET region. In both the YLZBLR’s warm/humid zones and the cold/dry northern areas of SET, DTc0 showed a significant decrease. However, in the YLZBMR, most of the PLZB, and the Namcha Barwa and Gyala Peri peaks, DTc0 exhibited a moderate increasing trend, with an increase of approximately +0.5–1%/decade, intensifying freeze–thaw cycles in these regions (Figure 2h).

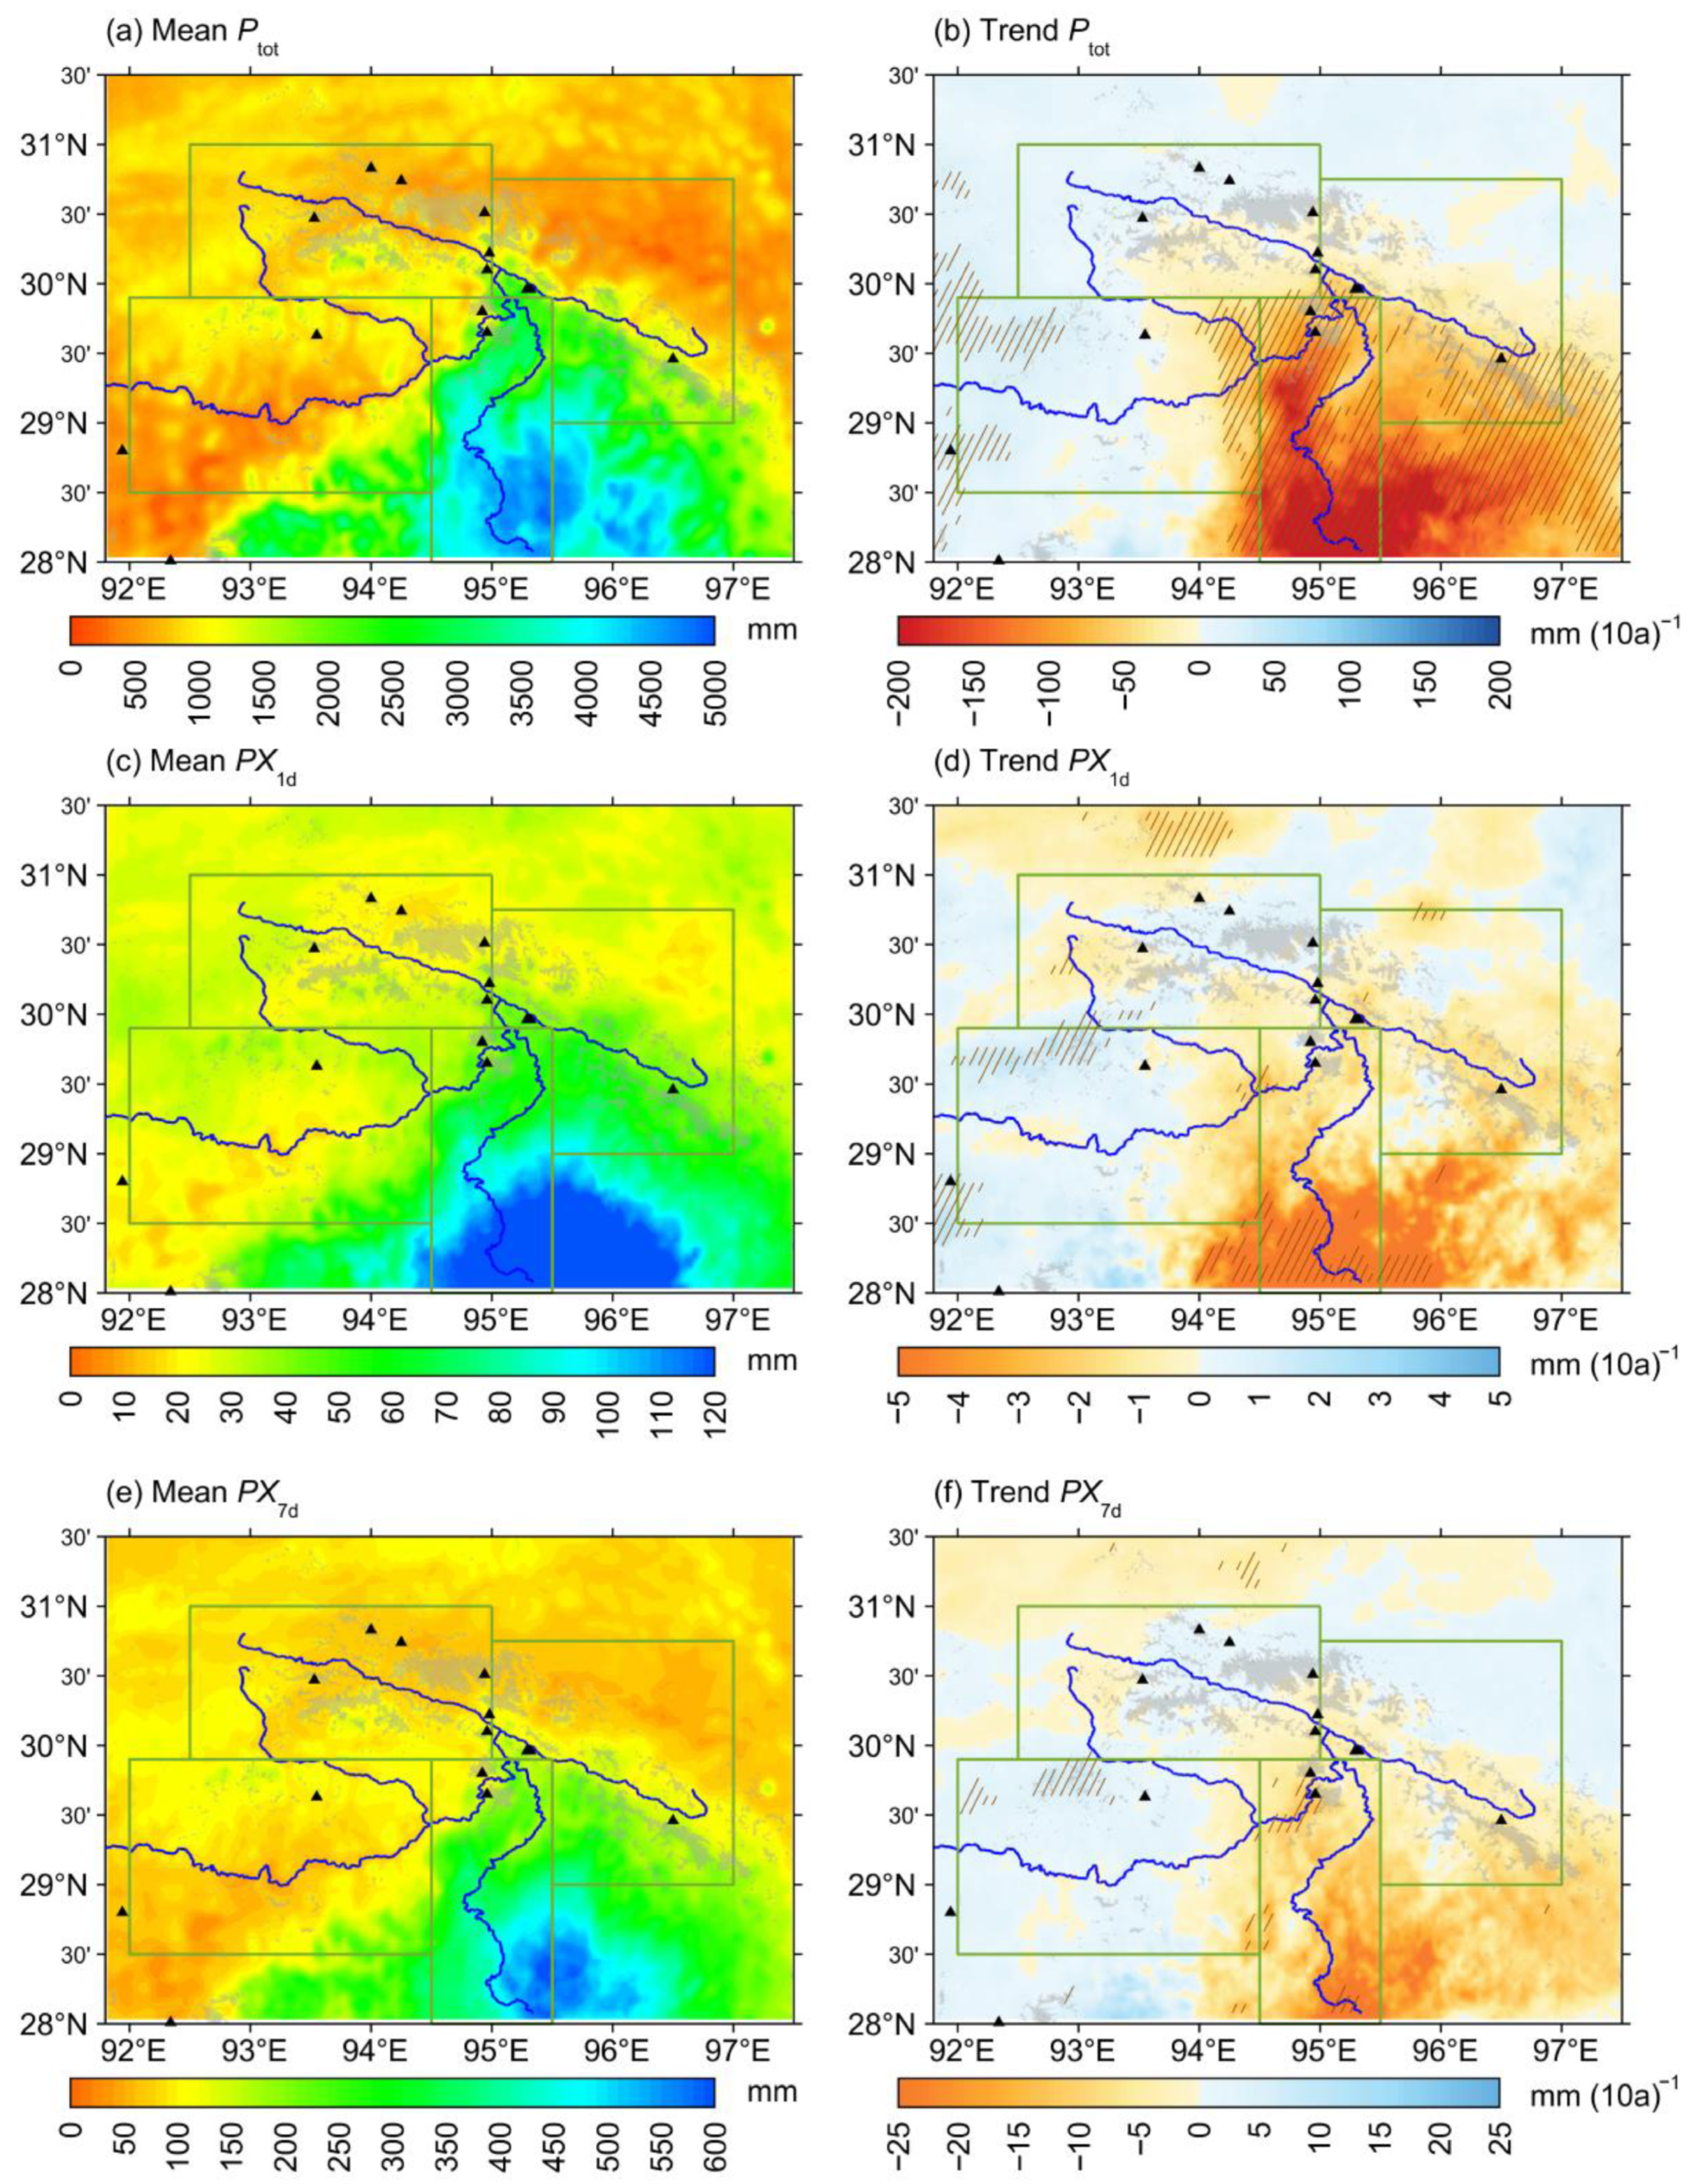
3.1.2. Regional Precipitation Distributions and Changes

In the SET region, annual precipitation (Ptot) varies significantly across different subregions. The southeastern corner, particularly the YLZBLR and its surrounding areas, receives 2000–4000 mm of precipitation annually, whereas most other areas receive less than 1000 mm. The western part of the YLZBMR experiences even lower Ptot, below 500 mm, classifying it as a semi-arid region (Figure 3a). From 1979 to 2022, a significant decrease in Ptot was observed in precipitation-rich areas, with a maximum reduction exceeding −200 mm/decade. In contrast, the semi-arid regions on the western side of SET exhibited a slight increasing trend in Ptot, with an increase of approximately +5 to +10 mm/decade (Figure 3b). Seasonally, the most significant reduction in precipitation is observed in summer, followed by autumn, mainly driven by the weakening of the South Asian monsoon. Moreover, decreases in winter and spring precipitation are concentrated in the southeastern part of SET, while most areas of SET experience increased precipitation in spring, primarily due to anomalous changes in the southern branch of the westerlies (Figure S1e–h).
Extreme rainfall events and prolonged precipitation are key meteorological factors triggering debris flows, GLOFs, and other hazards [61]. To further investigate these disaster-inducing precipitation patterns, we analyzed the spatial distribution and trends of maximum daily precipitation (PX1d) and maximum 7-day precipitation (PX7d). The long-term mean PX1d and PX7d closely follow the spatial pattern of annual precipitation, decreasing sequentially from the YLZBLR to the PLZB, YLZBMR, and YGZB subregions (Figure 3c,e). In the YLZBLR, the Himalayas, and the Kangri Gabu Mountains, PX1d and PX7d exceed 80 mm and 300 mm, respectively, making these areas prone to intense rainstorms and prolonged heavy rain events. Even in the semi-arid western YLZBMR, large areas experience PX1d > 50 mm, indicating that most of the SET region is highly susceptible to heavy rainfall. The trends of PX1d and PX7d largely follow the trends of Ptot. However, the statistical significance of the decreasing trend in PX1d and PX7d in most of southeastern SET did not pass the 0.05 significance level (Figure 3d,f). These findings suggest that the reduction in Ptot in SET may not be primarily driven by a decrease in extreme precipitation but rather by a decline in precipitation frequency [30].

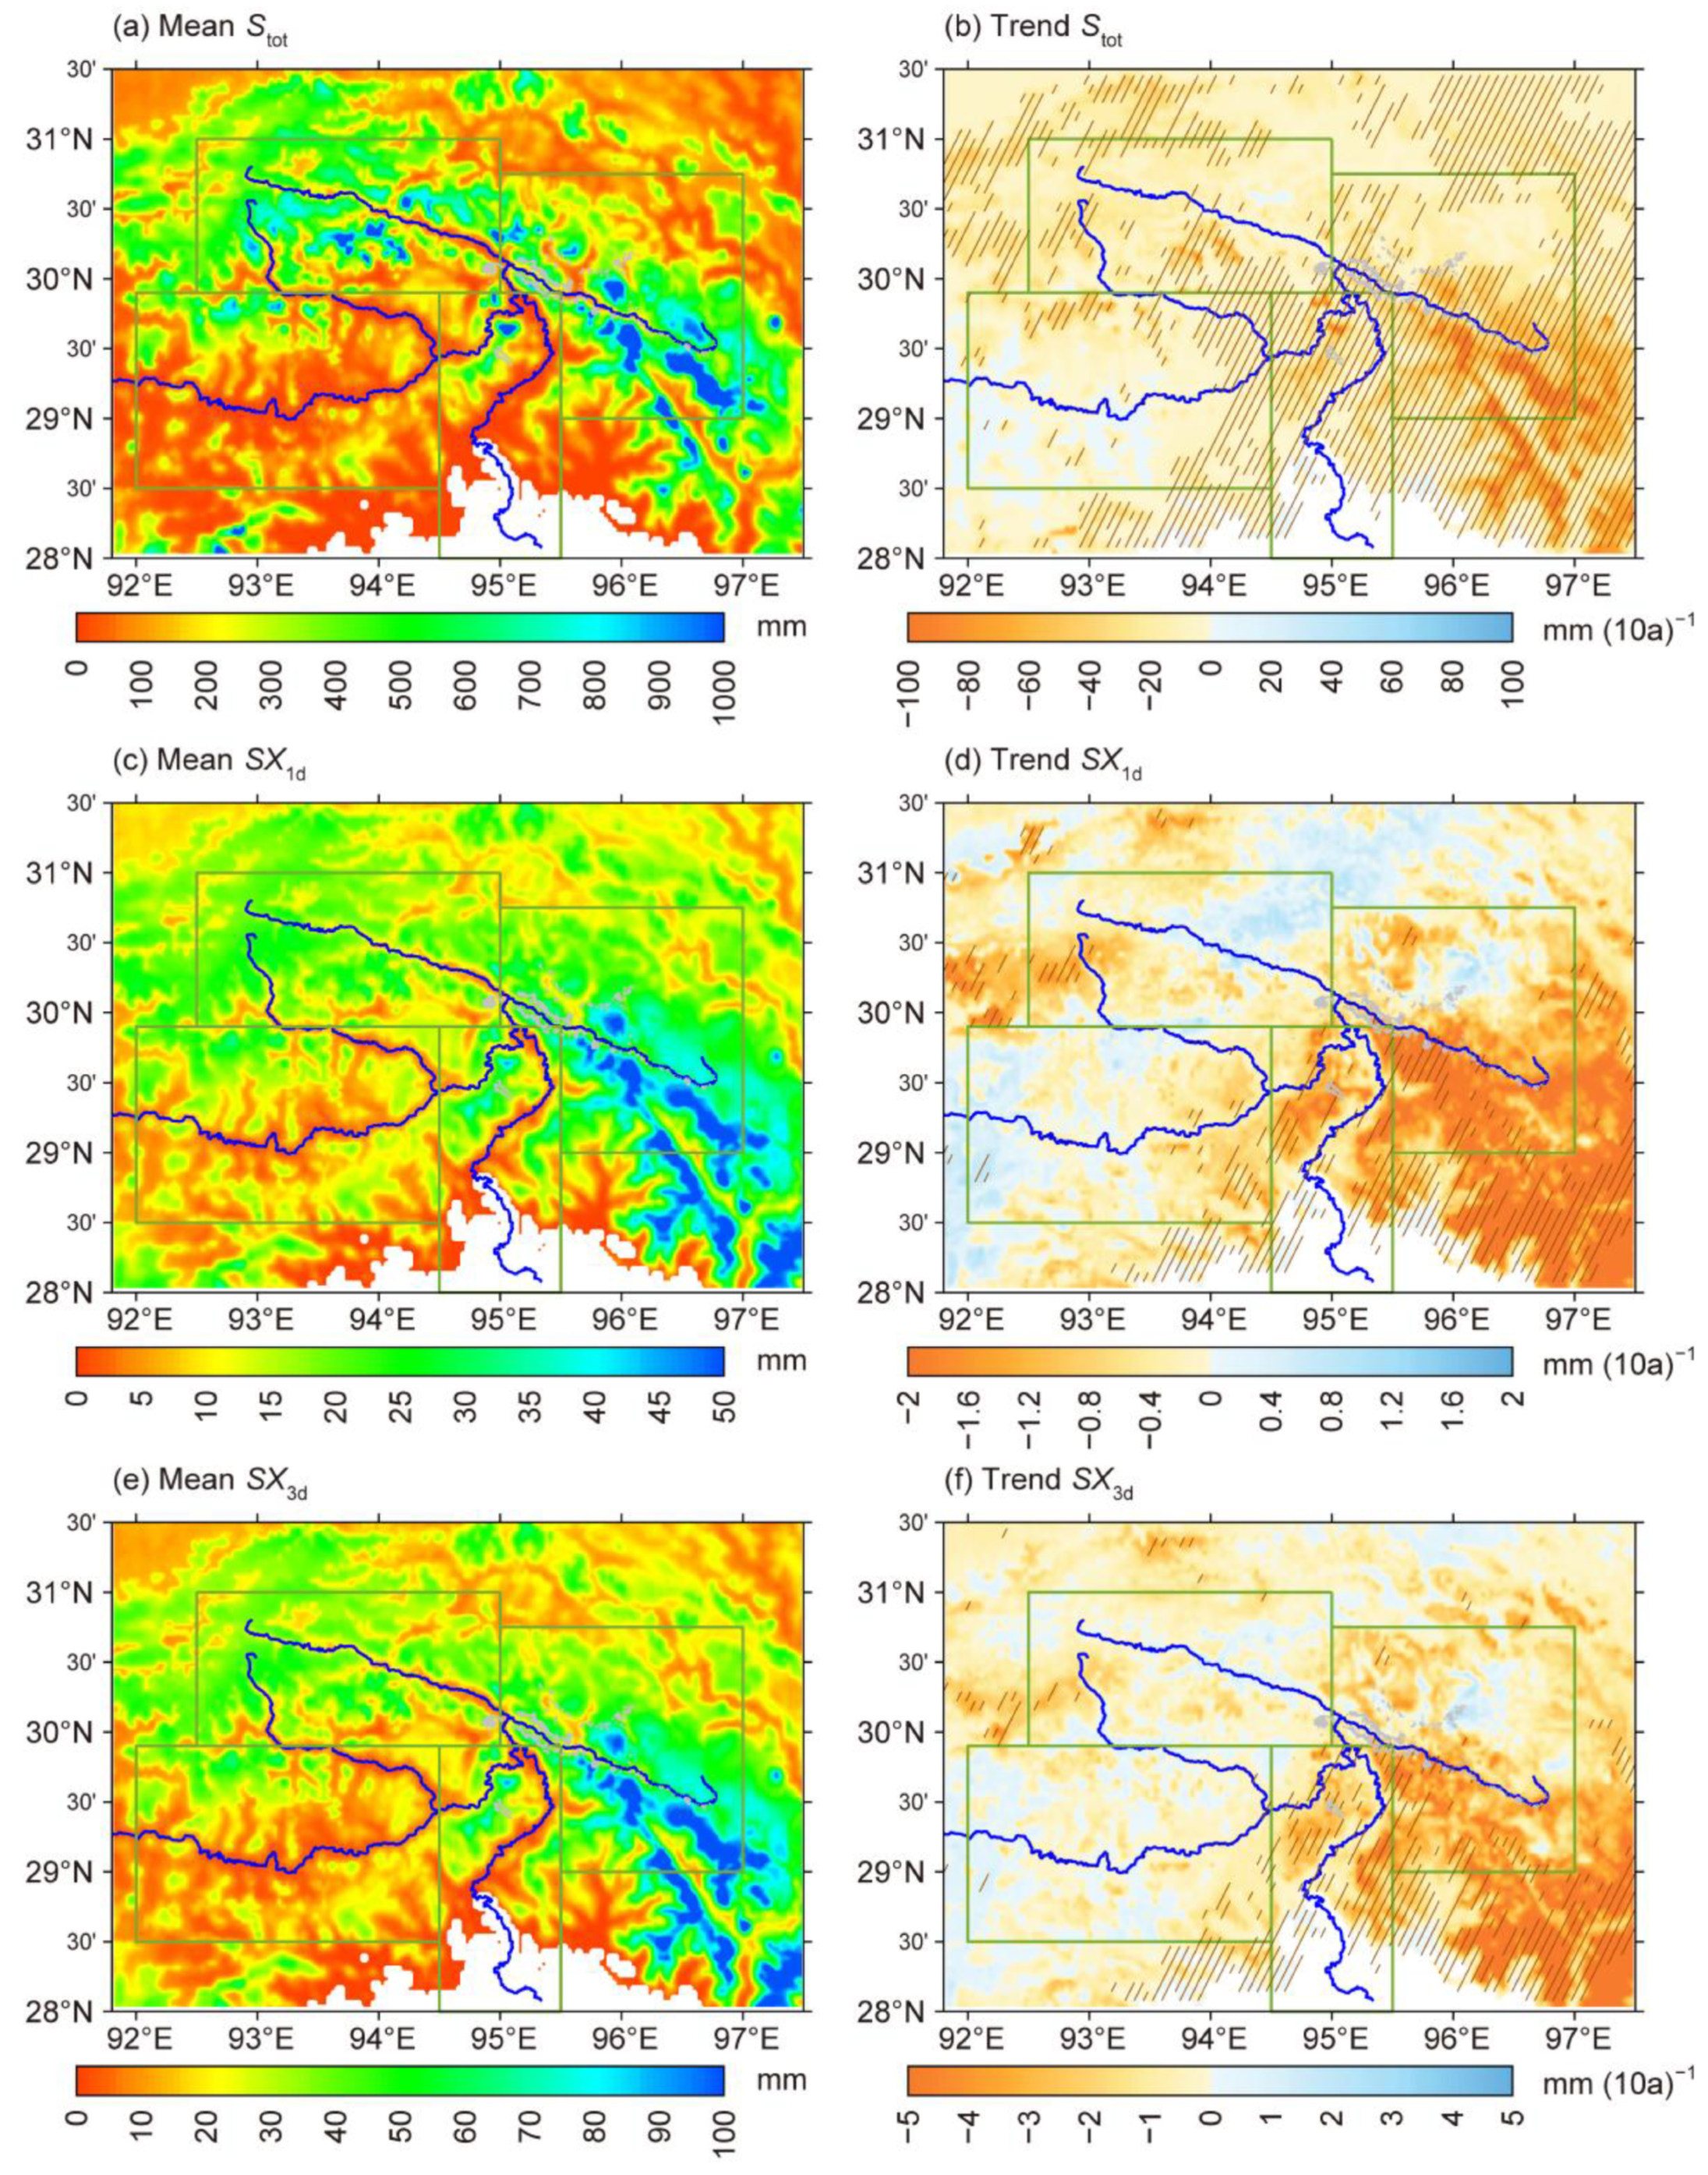
3.1.3. Regional Snowfall Distributions and Changes

The high-value centers of annual snowfall (Stot), maximum daily snowfall (SX1d), and maximum 3-day snowfall (SX3d) are primarily located in alpines ranges, with the Mts. Kangri Gabu and the Namcha Barwa experiencing the highest Stot, SX1d, and SX3d. In these areas, Stot can exceed 1000 mm per year, while extreme snowfall reaches up to 50 mm/day and 100 mm/3 days (Figure 4a,c,e). Extreme or persistent snowfall events are key meteorological triggers for snow-related disasters such as avalanches. Previous studies suggest that SX1d > 20 mm and SX3d > 30 mm create favorable conditions for avalanche occurrence [62]. Since snowfall in the Kangri Gabu and Namcha Barwa regions far exceeds these thresholds, avalanches are highly likely to occur. In contrast, snowfall in valley areas is significantly lower, generally below 100 mm/year. In particular, the warm valleys of YLZBLR received no snowfall at all.
Over the past 40 years, both annual total snowfall and extreme snowfall have shown a significant decreasing trend across SET, particularly in the Namcha Barwa region and the Kangri Gabu Mountains, where Stot, SX1d, and SX3d has decreased by approximately 40–80 mm/decade, 1–2 mm/decade, and 2–4 mm/decade, respectively, exceeding the 0.05 significance level (Figure 4b,d,f). However, in some parts of the YGZB, SX1d has shown a slight increasing trend, though this trend is not statistically significant. Seasonal differences in snowfall trends are also evident. In winter and spring, snowfall reduction is concentrated in the Namcha Barwa and Kangri Gabu mountainous regions, largely due to decreased precipitation. During summer and autumn, snowfall declines primarily in the high-altitude areas of the YLZBMR, YGZB, and PLZB subregions, driven by the combined effects of warming and a weakened monsoon. Additionally, the increasing trend in spring snowfall over northwestern SET may contribute to the relatively weak warming trend observed in that region (Figure S1i–l).

3.2. Climate Change in Cryosphere and Its Impact on Disasters

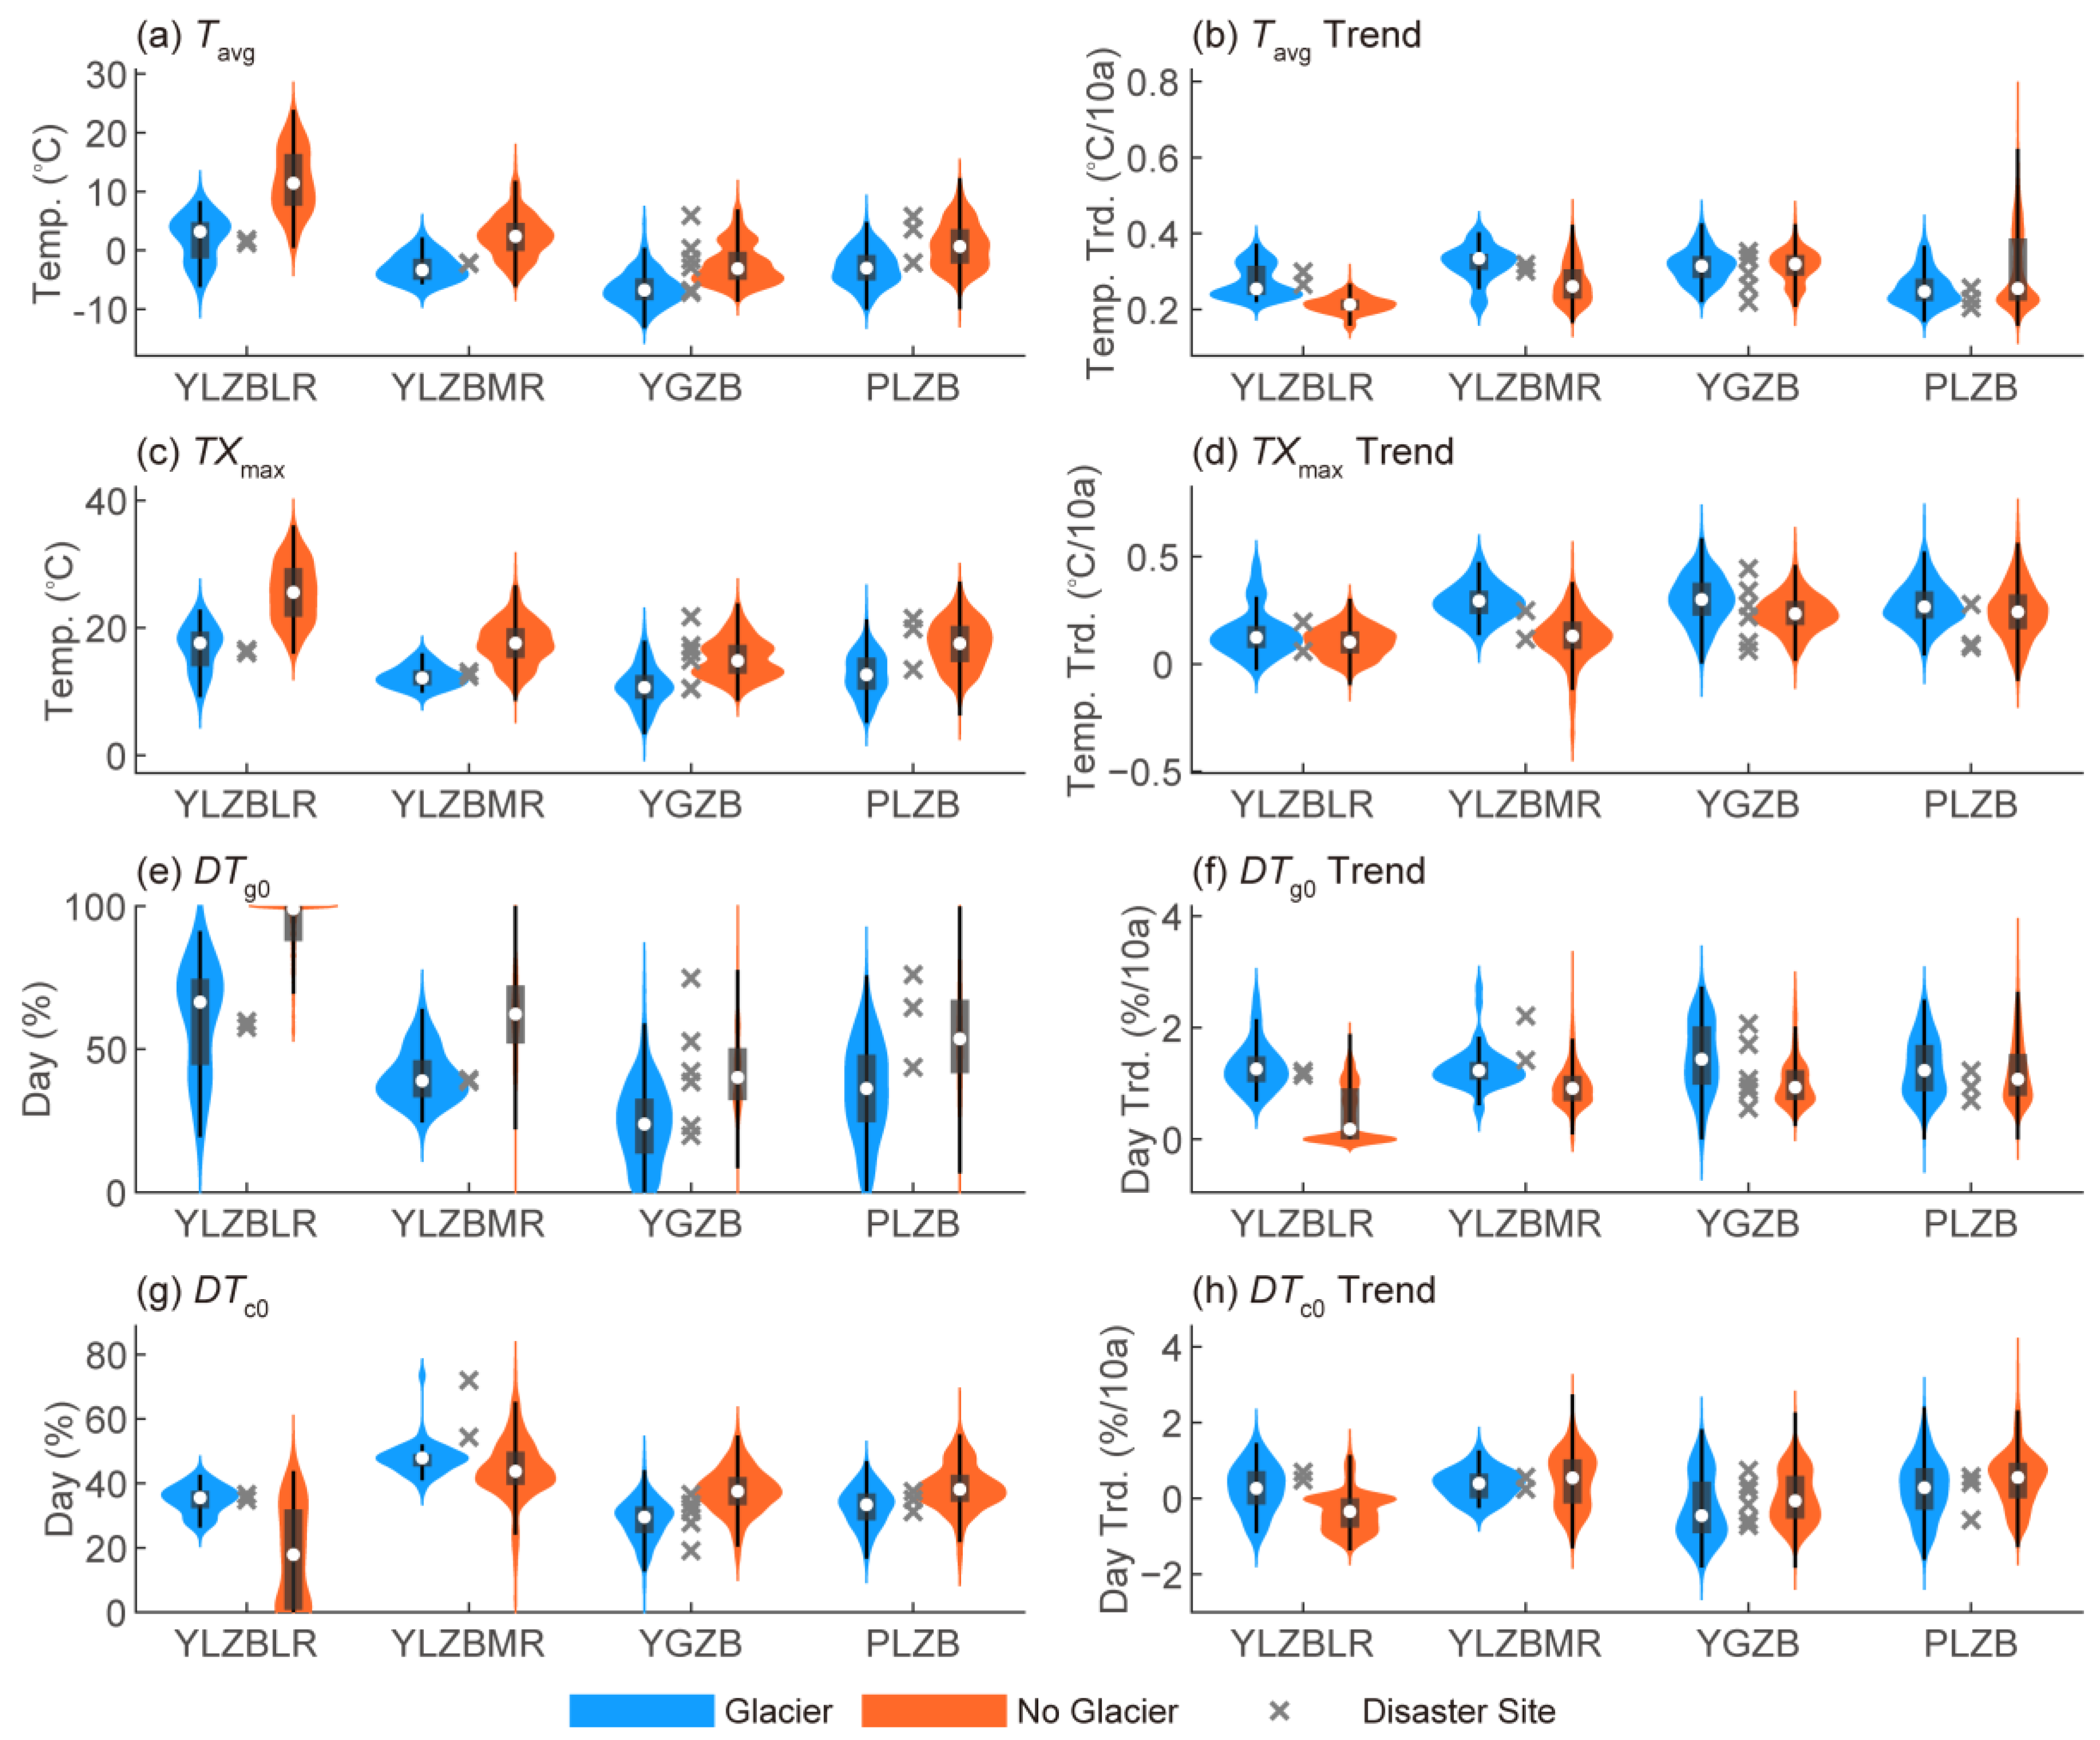
3.2.1. Temperature Change over Glaciers and Its Impact on Disasters

Across all SET subregions, glacier-covered areas exhibit significantly lower Tavg, TXmax, and DTg0 compared to non-glacier-covered areas due to their higher elevations and the high albedo of glacier surfaces (Figure 5a,c,e). Correspondingly, over the past 40 years, the warming trend in glacier-covered areas has been greater than that in non-glacier-covered areas (Figure 5b,d,f). However, in the YGZB and PLZB subregions, the differences in warming trends did not reach statistical significance at the 0.05 level based on the rank-sum test (Table S1). Interestingly, in the YLZBMR and YLZBLR subregions, DTc0 is significantly higher in glacier-covered areas than in non-glacier-covered areas. Over the past four decades, DTc0 in the YLZBLR has increased significantly in glacier-covered areas, whereas it has shown a decreasing trend in non-glacier areas. However, in the YGZB and PLZB subregions, the situation is reversed—DTc0 and its trend are both greater in non-glacier areas than in glacier-covered areas (Figure 5g–h). This difference may be attributed to the higher baseline temperatures and greater daily temperature variations in glacier-covered areas of the YLZBMR and YLZBLR, making them more susceptible to temperature fluctuations around 0 °C under warming conditions. These fluctuations intensify freeze–thaw cycles and increase the likelihood of ice and ice–rock avalanches.
Among glacial disaster chain sites, the greatest increase in DTc0 was observed at the Sedongpu, Zhibai, Zhamunong, and Tianmo Gullies, with trends of +0.69, +0.48, +0.74, and +0.57%/decade, respectively (Figure 5h; Table S2). These sites are all located in the moisture corridor of the Yarlung Zangbo Grand Bend, with a relatively warm and humid climate. This suggests that intensified freeze–thaw cycles may be a key factor contributing to the frequent occurrence of ice–rock avalanches—debris flow disaster chains in this region in recent years. Conversely, at disaster sites in the colder upstream regions of the YGZB and PLZB, including Cuoga Lake, Ranzeria Co, Nalongzangbu Gully, and Midui Gully, DTc0 has been decreasing. Additionally, at the Xiaga Lake and Ouguchonggu Co disaster sites in YLZBMR, although DTc0 has increased, the increase is less pronounced compared to the mean level of the glacier-covered regions of the YLZBMR. However, we observed that at these colder sites, warming has led to a more significant increase in DTg0. The DTg0 trends at Xiaga Lake, Ouguchonggu Co, Cuoga Lake, Ranzeria Co, and Midui Gully are +2.21, +1.42, +2.07, +1.7, and +1.23%/decade, respectively (Figure 5f; Table S2), which are higher than the median DTg0 trends in the glacier-covered areas of their respective subregions. Therefore, we suggest that in the cold and dry regions of SET, increased glacier melt due to warming is likely a key trigger for ice and ice–rock avalanches, which can initiate GLOF—debris flow disaster chains.

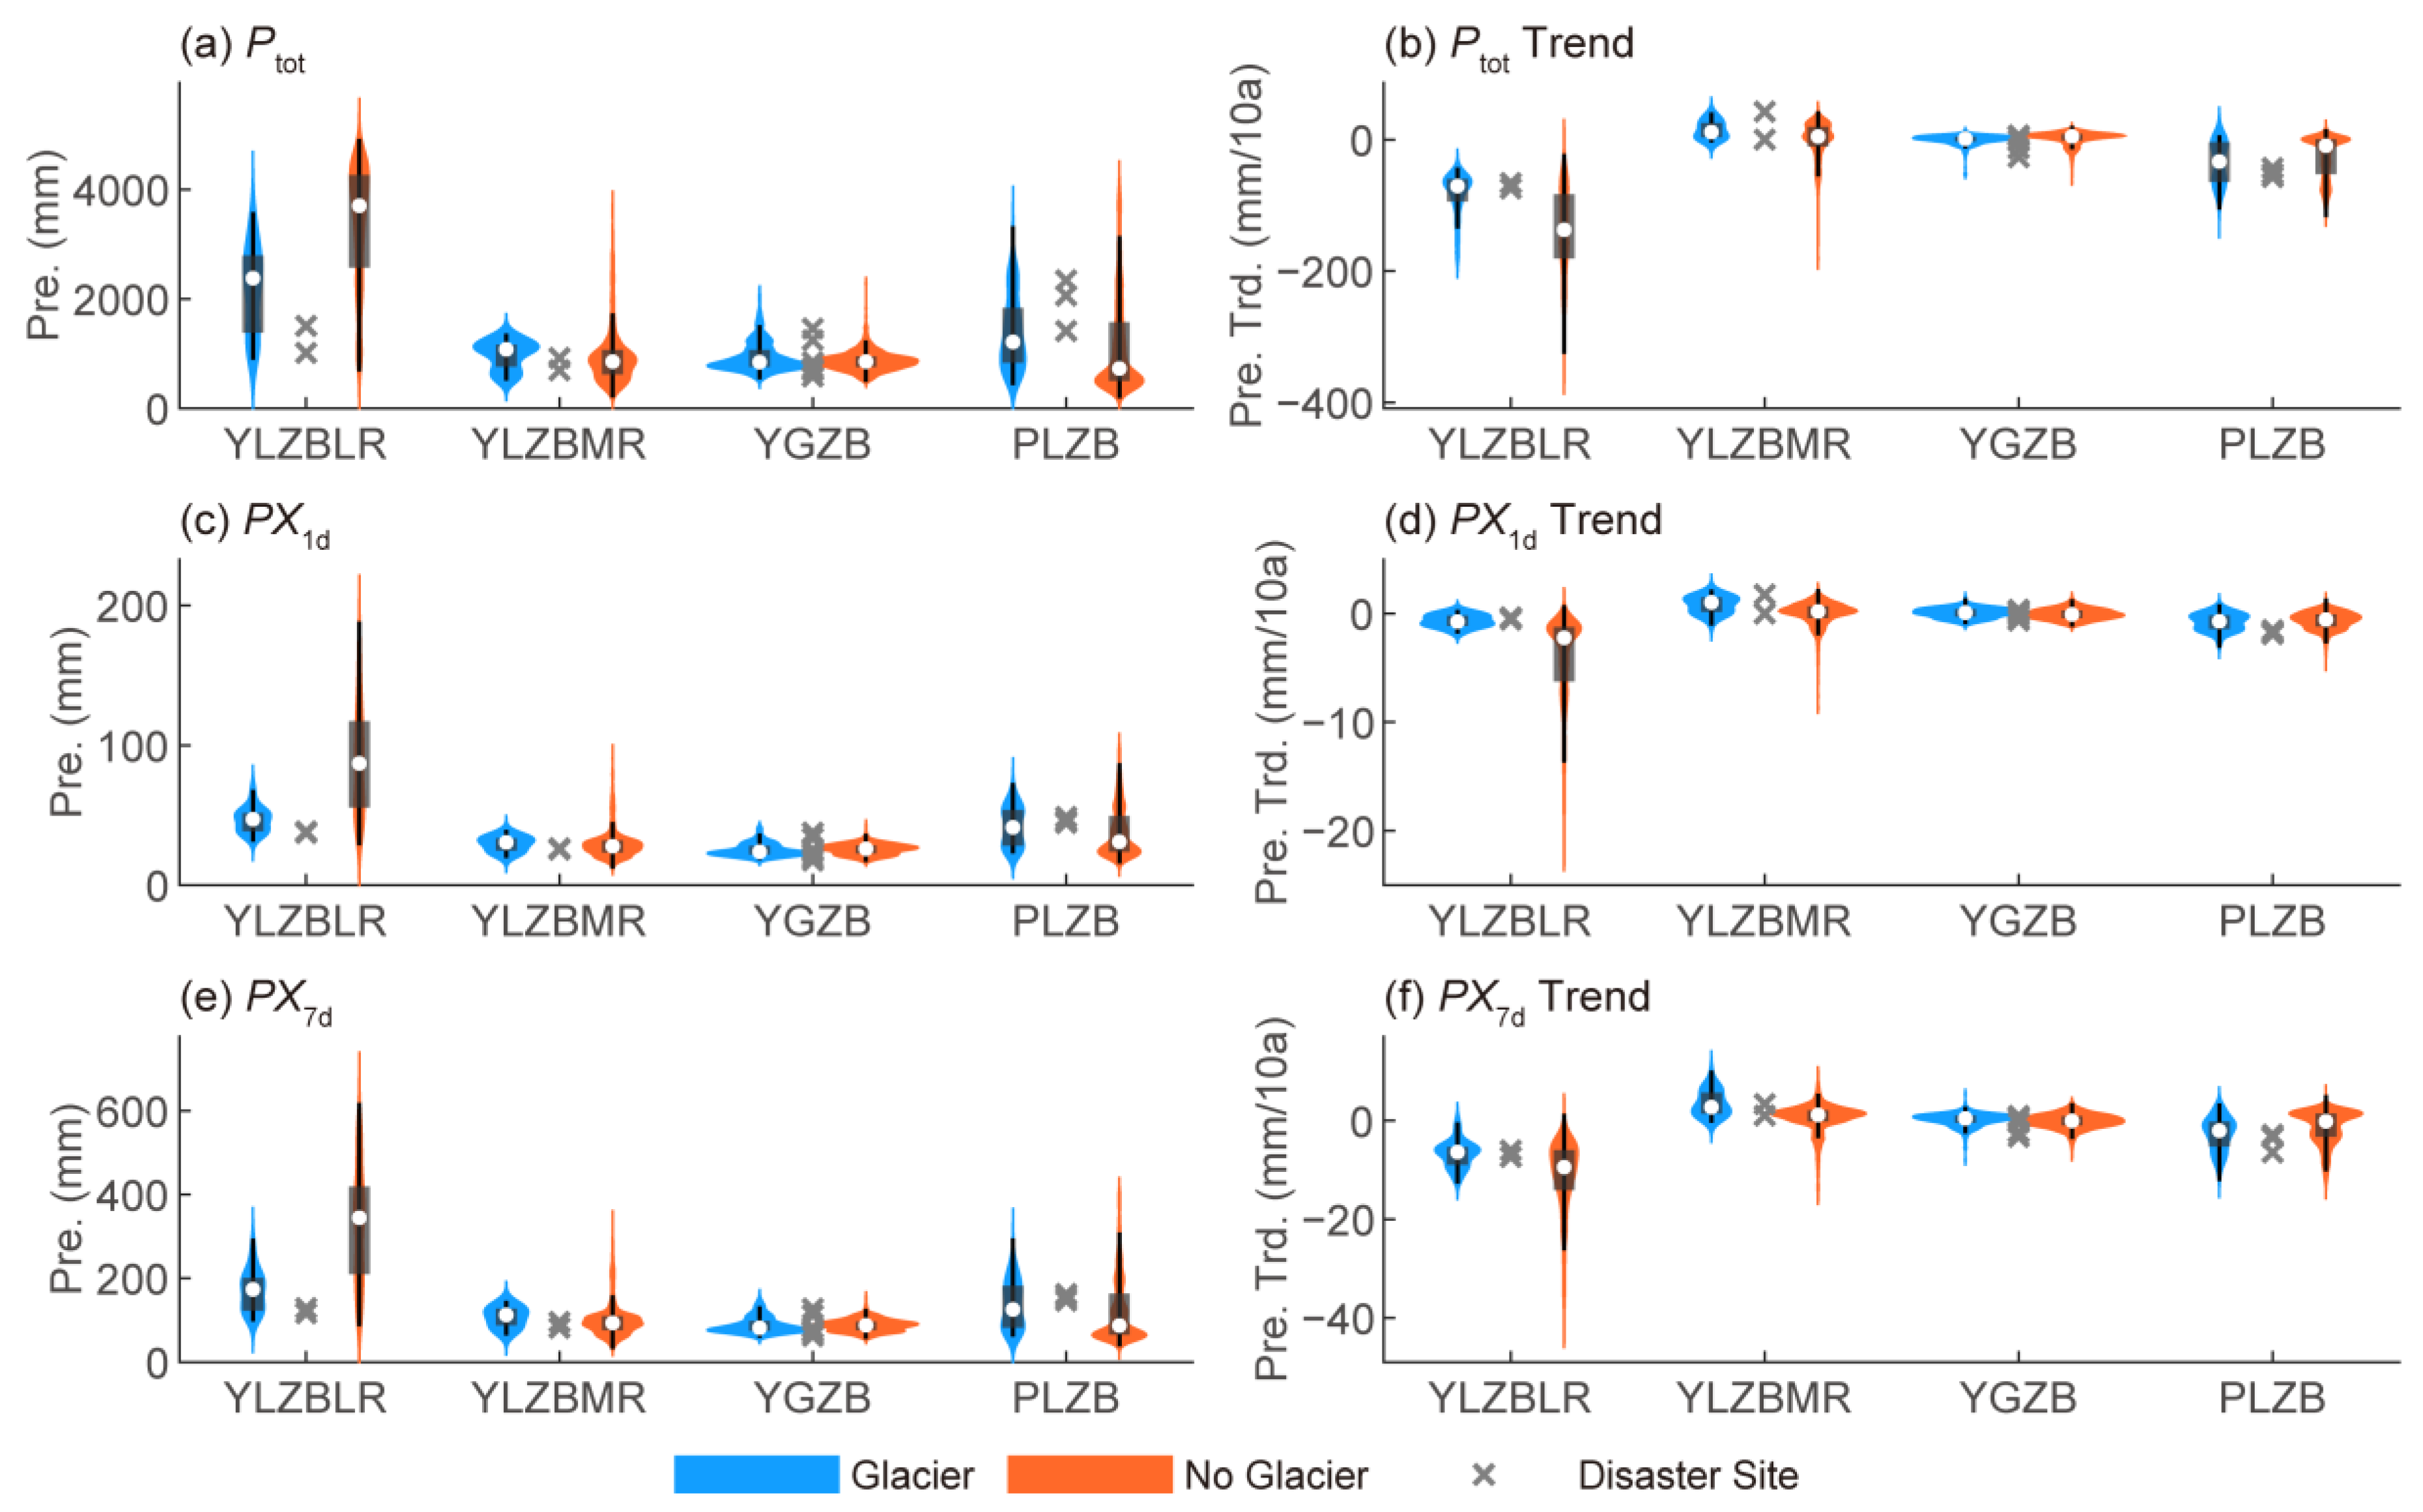
3.2.2. Precipitation Change over Glaciers and Its Impact on Disasters

In the YLZBLR and YGZB subregions, Ptot, PX1d, and PX7d are significantly higher in non-glacier areas than in glacier-covered areas. However, in the YLZBMR and PLZB subregions, these precipitation indicators are notably higher in glacier-covered areas than in non-glacier areas (Figure 6a,c,e). Correspondingly, areas with higher precipitation levels have experienced greater decreases in precipitation over the past 40 years (Figure 6b,d,f). Notably, in the glacier-covered areas of the YLZBMR and YGZB, Ptot, PX1d, and PX7d show a slight increasing trend. Even in the glacier-covered areas of the YLZBLR and PLZB, PX1d has only slightly decreased, with median values of −0.73 mm/decade and −0.7 mm/decade, respectively (Figure 6d; Table S3). Overall, across all glacier-covered areas in SET, PX1d exhibits a much less significant decreasing trend compared to those for Ptot and PX7d.
At specific disaster-chain sites, we observed that in relatively arid regions such as Xiaga Lake, Nalongzangbu Gully, and Tula Gully, PX1d has increased over the past 40 years, with values significantly exceeding the median level of the glacier-covered areas in their respective subregions (Figure 6d; Table S2). This suggests that in the drier regions of SET, the increase in extreme precipitation may enhance the likelihood of triggering ice–rock avalanches, GLOFs, and glacial debris flows. In contrast, in the humid regions of SET, extreme precipitation levels are already high and exhibit insignificant trends, indicating that the contribution of extreme precipitation to triggering glacial disaster chains is unlikely to diminish.

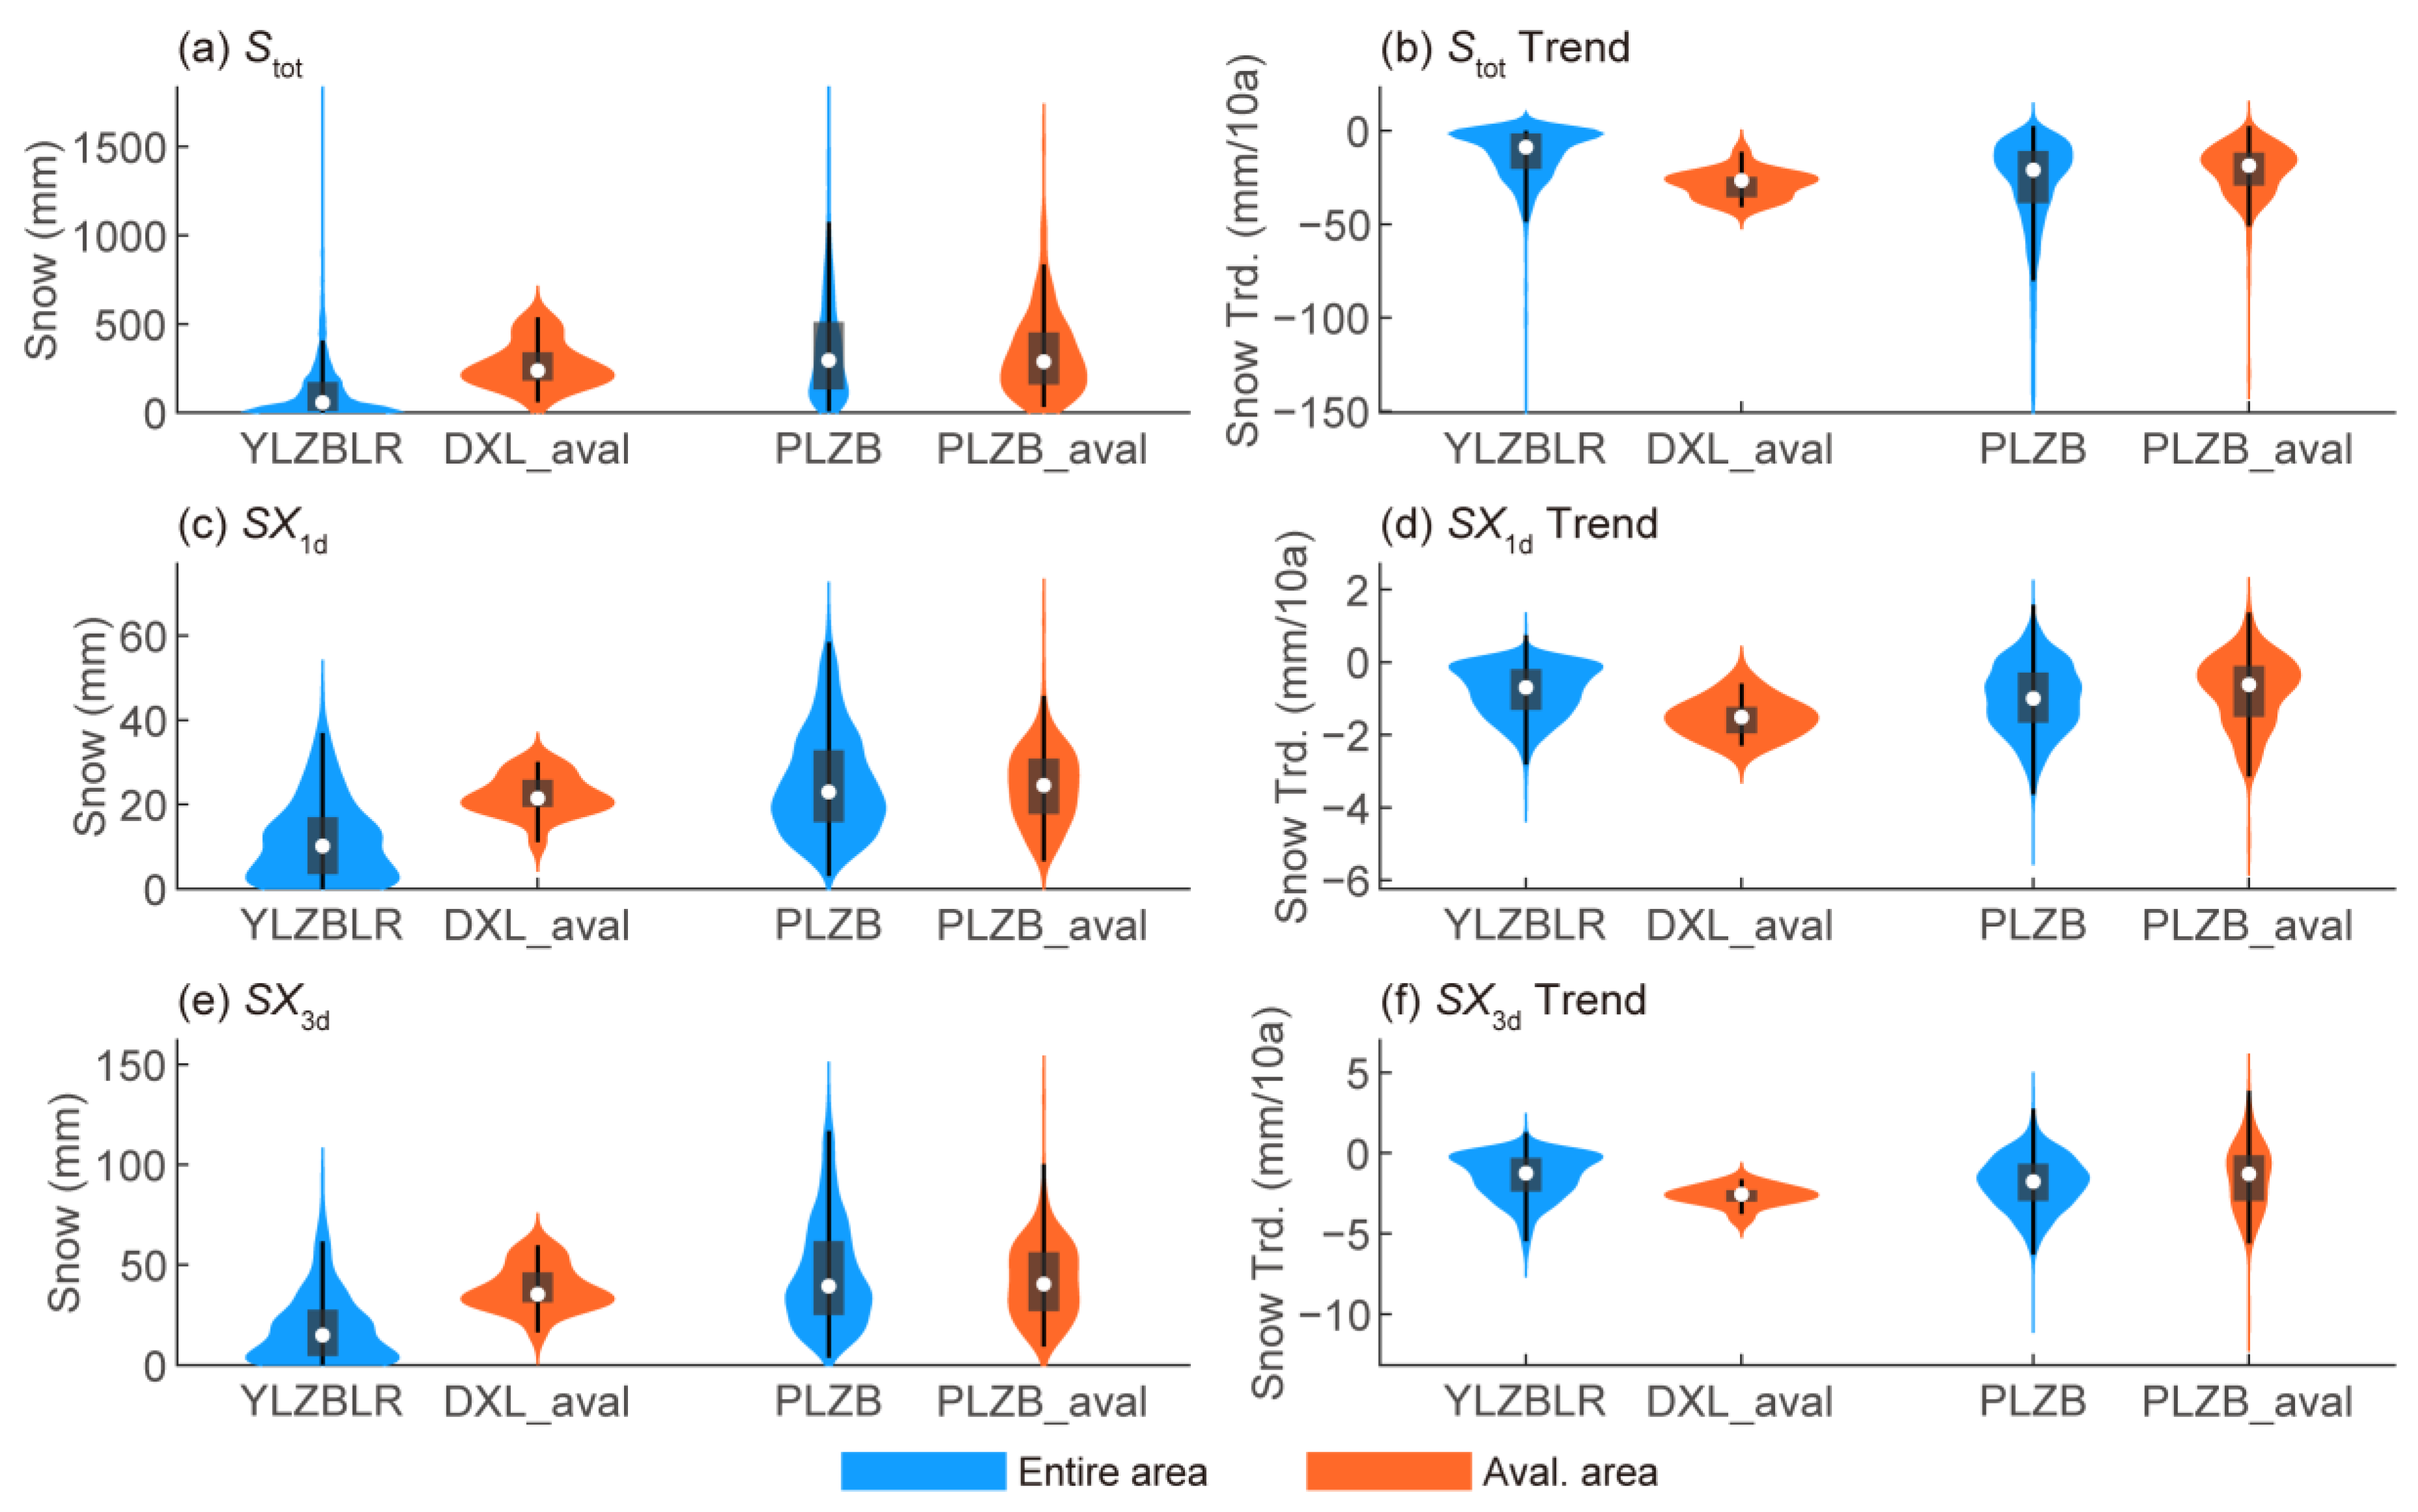
3.2.3. Snowfall Change in Avalanche-Prone Areas and Its Impact on Disasters

The median Stot in the avalanche-prone areas of Mt. Duoxiongla and the PLZB is 237 mm and 288 mm, respectively. The median SX1d is 21 mm and 25 mm, while the median SX3d is approximately 35 mm and 40 mm, respectively (Figure 7a,c,e; Table S4). In addition, snowfall in the Mt. Duoxiongla avalanche-prone area is significantly higher than the regional average of the YLZBLR, whereas the snowfall indicators in the PLZB avalanche-prone area are all comparable to the regional median level of the PLZB. Therefore, both total snowfall and extreme snowfall conditions in Mt. Duoxiongla and the PLZB are conducive to avalanche occurrences. However, over the past 40 years, Stot, SX1d, and SX3d in these avalanche-prone areas have shown a decreasing trend (Figure 7b,d,f). The rate of snowfall reduction is faster in Mt. Duoxiongla than in the PLZB’s avalanche gullies, likely due to a more rapid decline in precipitation in this region (Figure 4b). Compared with Stot, the decrease in SX1d and SX3d across all avalanche-prone areas is less pronounced, at approximately −1 mm/decade and −2 mm/decade, respectively (Table S4). Consequently, in the long term, the positive feedback mechanism of rising temperatures—shorter snowfall periods—reduced snowfall—decreased snow cover—lower surface albedo [56] could contribute to a faster reduction in avalanche hazards. However, given the high baseline snowfall levels and the relatively slow decline in extreme snowfall currently, avalanche risks in these regions remain significant.

3.3. Meteorological Indicators for Predicting Cryospheric Disasters in SET

Based on the above, we identified distinct meteorological indicators that best represent the effects of temperature and precipitation changes on glacial disaster chains across different climatic regions in SET. In the relatively warm and humid moisture corridor of the Yarlung Zangbo Grand Bend (green patch in Figure 8), DTc0 is the most suitable indicator for capturing the impact of temperature changes on glacial hazards, as it reflects variations in freeze–thaw cycle intensity in glacier-covered areas. Conversely, in the colder regions of the YLZBMR, YGZB, and the upper reaches of the PLZB (yellow patch in Figure 8), DTg0 better represents the influence of temperature changes on glacial disaster chains, as it indicates meteorological conditions favoring glacier melt. For precipitation-induced glacier hazards, PX1d is a more effective indicator than PX7d. This may be because GLOFs and glacial debris flows are more sensitive to short-duration intense precipitation, unlike rainfall-induced debris flows in non-glacier-covered areas, where factors such as soil infiltration and long-term progressive failure also play crucial roles, necessitating consideration of longer-duration precipitation events [61]. Regarding snow avalanche hazards, short-duration intense snowfall plays a more significant role than long-term cumulative snowfall [62]. Since snowfall events typically last longer than rainfall events, both SX1d and SX3d serve as key indicators of the effect of snowfall on avalanche hazards (blue patch in Figure 8). However, these are not the only relevant meteorological indicators for avalanches, as sudden warming and strong winds are also critical triggers.
Based on these identified indicators, we infer that in the glacier-covered areas of the Yarlung Zangbo Grand Bend moisture corridor, warming-induced intensification of freeze–thaw cycles, combined with high baseline extreme precipitation levels and minimal trends in precipitation changes, contributes to an increased likelihood of ice/ice–rock avalanche—GLOF—debris flow disaster chains in this region. In the colder and drier YLZBMR and YGZB subregions, weakening glacier freeze capacity and increasing extreme precipitation intensity suggest a greater probability of ice/ice–rock avalanche—GLOF—debris flow disaster chains. In the long run, warming-coupled reductions in extreme snowfall are expected to mitigate avalanche hazards in Mt. Duoxiongla and the PLZB. However, given the high baseline levels of extreme snowfall in these regions and the relatively weak declining trend, avalanche hazards remain severe in the short term.

4. Discussion

Compared to previous studies in SET that primarily focused on local meteorological changes [25,26,28,29,30,33,34,35,36,37,38], this study further investigates the impact of climate change on cryospheric disasters. By integrating meteorological analysis with geological hazard research, this study expands the significance of climate change research and fosters interdisciplinary collaboration. Our findings on the distribution and historical trends of temperature, precipitation, and snowfall in SET are consistent with previous studies, including the widespread warming trend under global climate change [24,25,26], the decrease in precipitation in southeastern SET and the increase in the northwest due to monsoon–westerly interactions [27,28,29,63], and the rapid decline in snowfall driven by the combined effects of temperature and precipitation changes [35,36]. Building upon these general trends, this study further quantifies climate change in disaster-prone areas and deduces its effect on glacial disaster chains and avalanche hazards through scientific statistics and indicator definitions, in contrast to previous studies that primarily relied on qualitative descriptions of climate change’s impacts on high-mountain hazards [23].
The extreme temperature, precipitation, and snowfall indices used in this study are widely recognized extreme climate indicators [8,30,31,32,33,34,37,38]. Our findings on extreme climate changes in SET are consistent with previous research, including the increasing trend in extreme high temperatures [30,31,32], the complex spatial variations in extreme precipitation trends [8,23,32,33,34], and the declining trend in extreme snowfall [37,38]. Other studies have introduced various indicators to assess melting and freeze–thaw intensity, such as accumulated temperature above or below 0 °C and their combined effect in representing freeze–thaw processes [64,65,66]. Compared to these approaches, our indicators more directly quantify the meteorological conditions favorable for melting or freeze–thaw cycles, while eliminating the influence of absolute temperature values. This makes our approach more applicable to large-scale studies across diverse climatic regions.
We acknowledge that a more refined analysis of meteorological indicators at seasonal or even monthly scales could yield more targeted results. However, conducting such detailed analyses exceeds the scope of a single study, and some disaster events lack sufficiently precise temporal records. It is therefore essential to consider the seasonal characteristics of different types of disasters and their associated meteorological drivers. For instance, extreme heat and precipitation are concentrated in the summer months (June to September), which also represent the primary active season for glacial disaster chains (Table 1). In contrast, extreme snowfall and avalanche disasters predominantly occur during the colder months (November to April). Moreover, glacier melt and the freeze–thaw cycles of ice–rock bodies are cumulative processes that require consideration of year-round conditions. Accordingly, the indicators used in this study to characterize extreme precipitation, extreme snowfall, glacier melt, and freeze–thaw cycles have been carefully designed to account for the seasonal characteristics of both disasters and climate.
It is important to emphasize that the indicators proposed in this study are intended to assess the overall impacts of climate change on the occurrence of cryospheric disasters rather than to serve as meteorological early-warning indicators for individual disaster events or disaster chains. Moreover, climate change is not the sole determinant of cryospheric disasters; other factors such as topography, geomorphology, tectonics, lithology, and seismic activity also play crucial roles [17,39,40]. However, under certain conditions, climate change can increase both the likelihood and intensity of these disasters. Therefore, a key future research direction is the quantitative assessment of climate change’s contribution to cryospheric hazards. Additionally, climate change-induced cryospheric disasters extend beyond ice–rock avalanches, GLOFs, glacial debris flows, and avalanches, encompassing rain-on-snow and meltwater floods, permafrost degradation, and wind-blown snow [23]. Nevertheless, in SET, the hazards examined in this study are among the most severe and pressing issues requiring immediate attention. Finally, while the TPMFD currently represents the highest-precision meteorological downscaling dataset available for the study area, this does not guarantee absolute accuracy—particularly in SET, which features some of the most complex topography and environmental conditions globally. Future studies will require more refined observational data for further validation and improvement.

5. Conclusions

The SET region exhibits a distinct southeast warm/humid to northwest cold/dry climatic gradient. Temperature distribution is closely linked to elevation and glacier coverage, while precipitation patterns are primarily influenced by moisture sources. Snowfall distribution is governed by the combined effects of temperature and precipitation, with higher snowfall in southeastern alpine areas and lower snowfall in the northwest and river valleys. Over the past 40 years, temperatures have increased across the SET region, while precipitation and snowfall have generally declined, though localized increases have also been observed. Colder regions have experienced stronger warming, wetter regions have seen more pronounced precipitation declines, and areas with higher snowfall have witnessed faster snowfall reduction. Under climate warming, the moisture corridor of the Yarlung Zangbo Grand Bend, which has a warm/humid climate, has experienced intensified freeze–thaw cycles. Combined with its high baseline extreme daily precipitation and minimal trend changes, these conditions favor the occurrence of glacial disaster chains. In the relatively cold/dry northwestern SET, warming primarily enhances glacial disaster chains by increasing temperature conditions favorable for cryospheric melt and intensifying extreme daily precipitation. Meanwhile, the reduction in extreme snowfall due to warming may help mitigate avalanche hazards in avalanche-prone areas of SET. However, given the high baseline extreme snowfall levels and a weak declining trend, avalanche risks remain a concern in the near term. Therefore, DTc0 (a freeze–thaw cycle indicator) and DTg0 (a glacier melt and snowmelt indicator) are suitable for assessing climate-change-induced disaster impacts in SET’s warm/humid and cold/dry subregions, respectively. Additionally, extreme daily precipitation and extreme daily and consecutive snowfall serve as key meteorological indicators for evaluating the risks of precipitation- or snow-driven cryospheric disasters in SET. These findings provide critical theoretical insights for understanding, predicting, and mitigating cryospheric disaster risks under climate change.

Supplementary Materials

The following supporting information can be downloaded at: https://www.mdpi.com/article/10.3390/atmos16050547/s1.

Author Contributions

Conceptualization, C.F. and J.C.; methodology, T.Y. and Z.Y.; software, C.F.; validation, J.C., T.Y. and Z.Y.; formal analysis, C.F.; investigation, C.F. and T.Y.; resources, T.Y.; data curation, L.S.; writing—original draft preparation, C.F.; writing—review and editing, J.C.; visualization, C.F.; supervision, J.C. and L.S.; project administration, L.S.; funding acquisition, L.S. All authors have read and agreed to the published version of the manuscript.

Funding

This research was funded by the NATIONAL KEY R&D PROGRAM OF CHINA (2023YFC3008300); the NATIONAL NATURAL SCIENCE FOUNDATION OF CHINA (42205059); the Gansu Provincial Science and Technology Program (25JRRA510); the program of the State Key Laboratory of Cryospheric Science and Frozen Soil Engineering, Chinese Academy of Sciences, CAS (CSFSE-ZQ-2411); the Science and Technology Research Program of the Institute of Mountain Hazards and Environment, Chinese Academy of Sciences (IMHE-CXTD-01); and the Young Elite Scientists Sponsorship Program by CAST (2023QNRC001).

Institutional Review Board Statement

Not applicable.

Informed Consent Statement

Not applicable.

Data Availability Statement

The data analyzed in this study were a re-analysis of existing data, which are openly available on the following websites. The ERA5 re-analysis data are available at https://cds.climate.copernicus.eu/datasets (accessed on 1 July 2024). The TPMFD and glacier coverage data are available at the National Tibetan Plateau Data Center websites: https://data.tpdc.ac.cn/en/data/44a449ce-e660-44c3-bbf2-31ef7d716ec7 (accessed on 1 July 2024) and https://data.tpdc.ac.cn/en/data/f92a4346-a33f-497d-9470-2b357ccb4246 (accessed on 4 March 2025), respectively.

Acknowledgments

We thank Professor Hong Wen from Southwest Jiaotong University and Associate professor Jiansheng Hao from the Institute of Geographic Sciences and Natural Resources Research, Chinese Academy of Sciences, who offered avalanche gully data in the PLZB region and Mt. Duoxiongla for this study. This work is also a contribution of the China–Pakistan Joint Research Center on Earth Sciences at the Institute of Mountain Hazards and Environment, Chinese Academy of Sciences.

Conflicts of Interest

The authors declare no conflicts of interest.

Abbreviations

The following abbreviations are used in this manuscript:
TPTibetan Plateau
SETSoutheast Tibet
GLOFglacial lake outburst flood
YLZBYarlung Zangbo River
YLZBLRlower reaches of the Yarlung Zangbo River
YLZBMRmiddle reaches of the Yarlung Zangbo River
YGZBYigong Zangbo River
PLZBParlung Zangbo River
ERA5fifth-generation ECMWF atmospheric reanalysis
TPMFDmeteorological forcing dataset for the Third Pole region

References

  1. Kang, S.; Xu, Y.; You, Q.; Flügel, W.A.; Pepin, N.; Yao, T. Review of climate and cryospheric change in the Tibetan Plateau. Environ. Res. Lett. 2010, 5, 015101. [Google Scholar] [CrossRef]
  2. Chen, D.; Xu, B.; Yao, T.; Guo, Z.; Cui, P.; Chen, F.; Zhang, R.; Zhang, X.; Zhang, Y. Assessment of Past, Present and Future Environmental Changes on the Tibetan Plateau. Chin. Sci. Bull. 2015, 60, 3025–3035, (In Chinese with English abstract). [Google Scholar]
  3. Ma, Z.; Liu, H.; Mi, Z.; Zhang, Z.; Wang, Y.; Xu, W.; Jiang, L.; He, J.-S. Climate warming reduces the temporal stability of plant community biomass production. Nat. Commun. 2017, 8, 15378. [Google Scholar] [CrossRef]
  4. Yao, T.; Xue, Y.; Chen, D.; Chen, F.; Thompson, L.; Cui, P.; Koike, T.; Lau, W.K.-M.; Lettenmaier, D.; Mosbrugger, V.; et al. Recent Third Pole’s Rapid Warming Accompanies Cryospheric Melt and Water Cycle Intensification and Interactions between Monsoon and Environment: Multidisciplinary Approach with Observations, Modeling, and Analysis. Bull. Am. Meteorol. Soc. 2019, 100, 423–444. [Google Scholar] [CrossRef]
  5. Immerzeel, W.W.; Lutz, A.F.; Andrade, M.; Bahl, A.; Biemans, H.; Bolch, T.; Hyde, S.; Brumby, S.; Davies, B.J.; Elmore, A.C.; et al. Importance and Vulnerability of the World’s Water Towers. Nature 2020, 577, 364–369. [Google Scholar] [CrossRef]
  6. You, Q.; Cai, Z.; Pepin, N.; Chen, D.; Ahrens, B.; Jiang, Z.; Wu, F.; Kang, S.; Zhang, R.; Wu, T.; et al. Warming amplification over the Arctic Pole and Third Pole: Trends, mechanisms and consequences. Earth-Sci. Rev. 2021, 217, 103625. [Google Scholar] [CrossRef]
  7. Liu, X.; Zeng, X.; Leavitt, S.W.; Wang, W.; An, W.; Xu, G.; Sun, W.; Wang, Y.; Qin, D.; Ren, J. A 400-Year Tree-Ring δ18O Chronology for the Southeastern Tibetan Plateau: Implications for Inferring Variations of the Regional Hydroclimate. Glob. Planet. Change 2013, 104, 23–33. [Google Scholar] [CrossRef]
  8. Deng, M.F.; Chen, N.S.; Wang, T.; Ding, H.T. Fluctuation of Daily Rainfall Extreme in Southeastern Tibet. J. Nat. Disasters 2017, 26, 152–159, (In Chinese with English abstract). [Google Scholar]
  9. Wu, M.; Huang, J.; Spicer, R.A.; Li, S.; Zhao, J.; Deng, W.; Ding, W.; Tang, H.; Xing, Y.; Tian, Y.; et al. The Early Oligocene Establishment of Modern Topography and Plant Diversity on the Southeastern Margin of the Tibetan Plateau. Glob. Planet. Change 2022, 214, 103856. [Google Scholar] [CrossRef]
  10. Zhao, C.; Xiong, Z.; Farnsworth, A.; Spicer, R.A.; He, S.; Wang, C.; Zeng, D.; Cai, F.; Wang, H.; Tian, X.; et al. The Late Eocene Rise of SE Tibet Formed an Asian ‘Mediterranean’ Climate. Glob. Planet. Change 2023, 231, 104313. [Google Scholar] [CrossRef]
  11. Zhang, Y.; Liu, Y.; Su, P.; Wei, F.; Huang, H.; Chen, Q. Advances in the Study of Glacier Avalanches in Tibet. Chin. J. Geol. Hazard Control 2023, 34, 132–145, (In Chinese with English abstract). [Google Scholar]
  12. Nian, T.; Zhao, R.; Zheng, D.; Xu, B.; Xu, L.; Yan, C. Advances in the Study of Ice-Rock Avalanche Disaster Chains in Yarlung Zangbo River Basin in Southeast Tibet. J. Hydraul. Eng. 2024, 55, 1146–1162, (In Chinese with English abstract). [Google Scholar]
  13. Shao, C.; You, H.; Cao, Z.; Wang, C.; Tang, F.; Zhang, D.; Lou, H.; Xu, G.; Chang, L.; Yang, Q.; et al. Tectonic Characteristics and Seismic Activities of Yaluzangbu Grand Canyon, Tibet, China. Technol. Earthq. Disaster Prev. 2008, 3, 398–412, (In Chinese with English abstract). [Google Scholar]
  14. Liu, W.; Carling, P.A.; Hu, K.; Wang, H.; Zhou, Z.; Zhou, L.; Liu, D.; Lai, Z.; Zhang, X. Outburst Floods in China: A Review. Earth-Sci. Rev. 2019, 197, 102895. [Google Scholar] [CrossRef]
  15. Yin, Y.; Xing, A. Aerodynamic Modeling of the Yigong Gigantic Rock Slide-Debris Avalanche, Tibet, China. Bull. Eng. Geol. Environ. 2012, 71, 149–160. [Google Scholar] [CrossRef]
  16. Wei, R.; Zeng, Q.; Davies, T.; Yuan, G.; Wang, K.; Xue, X.; Yin, Q. Geohazard Cascade and Mechanism of Large Debris Flows in Tianmo Gully, SE Tibetan Plateau and Implications to Hazard Monitoring. Eng. Geol. 2018, 233, 172–182. [Google Scholar] [CrossRef]
  17. Liu, C.; Lü, J.; Tong, L.; Chen, H.; Liu, Q.; Xiao, R.; Tu, J. Research on Glacial/Rock Fall-Landslide-Debris Flows in Sedongpu Basin along Yarlung Zangbo River in Tibet. Geol. China 2019, 46, 219–234, (In Chinese with English abstract). [Google Scholar]
  18. Zhang, P.; Li, B.; Gao, H.; Wan, J. Research on High-Altitude Avalanche Susceptibility Area Zoning Based on Informativeness Modeling in the Duoxiong River Basin, Nyingchi Area of Xizang Autonomous Region. Chin. J. Geol. Hazard Control 2024, 35, 44–57, (In Chinese with English abstract). [Google Scholar]
  19. Song, C.; Ke, L.; Huang, B.; Richards, K.S. Can Mountain Glacier Melting Explain the GRACE-Observed Mass Loss in the Southeast Tibetan Plateau: From a Climate Perspective? Glob. Planet. Change 2015, 124, 1–9. [Google Scholar] [CrossRef]
  20. Wang, W.; Yao, T.; Yang, X. Variations of Glacial Lakes and Glaciers in the Boshula Mountain Range, Southeast Tibet, from the 1970s to 2009. Ann. Glaciol. 2011, 52, 9–17. [Google Scholar] [CrossRef]
  21. Yao, T.; Yu, W.; Wu, G.; Xu, B.; Yang, W.; Zhao, H.; Wang, W.; Li, S.; Wang, N.; Li, Z.; et al. Glacier anomalies and relevant disaster risks on the Tibetan Plateau and surroundings. Chin. Sci. Bull. 2019, 64, 2770–2782, (In Chinese with English abstract). [Google Scholar]
  22. Cui, P.; Chen, R.; Xiang, L.; Su, F. Risk Analysis of Mountain Hazards in Tibetan Plateau Under Global Warming. Prog. Inq. Mutat. Clim. 2014, 10, 103–109. [Google Scholar]
  23. Wang, H.; Wang, B.-B.; Cui, P.; Ma, Y.-M.; Wang, Y.; Hao, J.-S.; Wang, Y.; Li, Y.-M.; Sun, L.-J.; Wang, J.; et al. Disaster Effects of Climate Change in High Mountain Asia: State of Art and Scientific Challenges. Adv. Clim. Change Res. 2024, 15, 367–389. [Google Scholar] [CrossRef]
  24. Liang, E.Y.; Shao, X.M.; Xu, Y. Tree-ring evidence of recent abnormal warming on the southeast Tibetan Plateau. Theor. Appl. Climatol. 2009, 98, 9–18. [Google Scholar] [CrossRef]
  25. Wang, S.-J. Spatiotemporal Variability of Temperature Trends on the Southeast Tibetan Plateau, China. Int. J. Climatol. 2018, 38, 1953–1963. [Google Scholar] [CrossRef]
  26. Li, C.; Cui, P.; Hao, J.; Zhang, G.; Wang, J.; Jia, Y. Variation Characteristics of Temperature and Precipitation over the Southeast Xizang since 1960. Plateau Meteorol. 2023, 42, 344–358, (In Chinese with English abstract). [Google Scholar]
  27. Shi, C.; Daux, V.; Zhang, Q.-B.; Risi, C.; Hou, S.-G.; Stievenard, M.; Pierre, M.; Li, Z.; Masson-Delmotte, V. Reconstruction of Southeast Tibetan Plateau Summer Climate Using Tree Ring δ18O: Moisture Variability over the Past Two Centuries. Clim. Past 2012, 8, 205–213. [Google Scholar] [CrossRef]
  28. Wang, X.; Pang, G.; Yang, M. Precipitation over the Tibetan Plateau during Recent Decades: A Review Based on Observations and Simulations. Int. J. Climatol. 2018, 38, 1116–1131. [Google Scholar] [CrossRef]
  29. Zhang, C.; Tang, Q.; Chen, D.; van der Ent, R.J.; Liu, X.; Li, W.; Haile, G.G. Moisture Source Changes Contributed to Different Precipitation Changes over the Northern and Southern Tibetan Plateau. J. Hydrometeorol. 2019, 20, 217–229. [Google Scholar] [CrossRef]
  30. You, Q.; Kang, S.; Aguilar, E.; Yan, Y. Changes in Daily Climate Extremes in the Eastern and Central Tibetan Plateau during 1961–2005. J. Geophys. Res. 2008, 113, D07101. [Google Scholar] [CrossRef]
  31. Duan, J.; Chen, L.; Li, L.; Wu, P.; Christidis, N.; Ma, Z.; Lott, F.C.; Ciavarella, A.; Stott, P.A. Anthropogenic Influences on the Extreme Cold Surge of Early Spring 2019 over the Southeastern Tibetan Plateau. Bull. Am. Meteorol. Soc. 2021, 102, S111–S116. [Google Scholar] [CrossRef]
  32. Zhang, J.; Zhao, T.; Zhou, L.; Ran, L. Historical Changes and Future Projections of Extreme Temperature and Precipitation along the Sichuan-Tibet Railway. J. Meteorol. Res. 2021, 35, 402–415. [Google Scholar] [CrossRef]
  33. Zhang, J.; Shen, X.; Wang, B. Changes in Precipitation Extremes in Southeastern Tibet, China. Quat. Int. 2015, 380–381, 49–59. [Google Scholar] [CrossRef]
  34. Bai, Y.; Du, J.; Wang, T.; Wangdoi, S.; Dang, X. Spatio-Temporal Change of Extreme Precipitation Index of Southeastern Tibet from 1971 to 2020. Plateau Mountain Meteorol. Res. 2022, 42, 31–40, (In Chinese with English abstract). [Google Scholar]
  35. Gao, J.; Williams, M.W.; Fu, X.; Wang, G.; Gong, T. Spatiotemporal Distribution of Snow in Eastern Tibet and the Response to Climate Change. Remote Sens. Environ. 2012, 121, 1–9. [Google Scholar] [CrossRef]
  36. Xu, W.; Ma, L.; Ma, M.; Zhang, H.; Yuan, W. Spatial–Temporal Variability of Snow Cover and Depth in the Qinghai–Tibetan Plateau. J. Clim. 2017, 30, 1521–1533. [Google Scholar] [CrossRef]
  37. Sun, F.; Chen, Y.; Li, Y.; Duan, W.; Li, B.; Fang, G.; Li, Z.; Zhu, Z.; Feng, M. Decreasing Trends of Mean and Extreme Snowfall in High Mountain Asia. Sci. Total Environ. 2024, 921, 171211. [Google Scholar] [CrossRef]
  38. Li, C.; Hao, J.; Zhang, G.; Wang, Y.; Fang, H.; Hou, W.; Cui, P. Extreme Snowfall Variations in the Southeastern Tibetan Plateau under Warming Climate. Atmos. Res. 2024, 311, 107690. [Google Scholar] [CrossRef]
  39. Hu, K.; Zhang, X.; You, Y.; Hu, X.; Liu, W.; Li, Y. Landslides and Dammed Lakes Triggered by the 2017 Ms6.9 Milin Earthquake in the Tsangpo Gorge. Landslides 2019, 16, 993–1001. [Google Scholar] [CrossRef]
  40. Cui, P.; Su, F.; Zou, Q.; Chen, N.; Zhang, Y. Risk Assessment and Disaster Reduction Strategies for Mountainous and Meteorological Hazards in Tibetan Plateau. Chin. Sci. Bull. 2015, 60, 3067–3077, (In Chinese with English abstract). [Google Scholar]
  41. Peng, D.; Zhang, L.; Jiang, R.; Zhang, S.; Shen, P.; Lu, W.; He, X. Initiation Mechanisms and Dynamics of a Debris Flow Originated from Debris-Ice Mixture Slope Failure in Southeast Tibet, China. Eng. Geol. 2022, 307, 106783. [Google Scholar] [CrossRef]
  42. Huang, H.; Gong, C. Spatial-Temporal Evolution of Geohazard Chain Participated by Glacier and Snow in Zhibai Gully, SE Tibetan Plateau. Earth Sci. 2024, 49, 3784–3798, (In Chinese with English abstract). [Google Scholar]
  43. Chen, N.; Zhou, H.; Hu, G. Development Rules of Debris Flow Under the Influence of Climate Change in Nyingchi. Adv. Clim. Change Res. 2011, 7, 412–417, (In Chinese with English abstract). [Google Scholar]
  44. Zou, Q.; Cui, P.; Jiang, H.; Wang, J.; Li, C.; Zhou, B. Analysis of Regional River Blocking by Debris Flows in Response to Climate Change. Sci. Total Environ. 2020, 741, 140262. [Google Scholar] [CrossRef]
  45. Wen, H.; Wu, X.; Liao, X.; Wang, D.; Huang, K.; Wünnemann, B. Application of Machine Learning Methods for Snow Avalanche Susceptibility Mapping in the Parlung Tsangpo Catchment, Southeastern Qinghai-Tibet Plateau. Cold Reg. Sci. Technol. 2022, 198, 103535. [Google Scholar] [CrossRef]
  46. Cui, P.; Ge, Y.; Li, S.; Li, Z.; Xu, X.; Zhou, G.G.D.; Chen, H.; Wang, H.; Lei, Y.; Zhou, L.; et al. Scientific Challenges in Disaster Risk Reduction for the Sichuan–Tibet Railway. Eng. Geol. 2022, 309, 106837. [Google Scholar] [CrossRef]
  47. Kad, P.; Ha, K.-J. Recent Tangible Natural Variability of Monsoonal Orographic Rainfall in the Eastern Himalayas. J. Geophys. Res. Atmos. 2023, 128, e2023JD038759. [Google Scholar] [CrossRef]
  48. Hersbach, H.; Bell, B.; Berrisford, P.; Hirahara, S.; Horányi, A.; Muñoz-Sabater, J.; Nicolas, J.; Peubey, C.; Radu, R.; Schepers, D.; et al. The ERA5 Global Reanalysis. Q. J. R. Meteorol. Soc. 2020, 146, 1999–2049. [Google Scholar] [CrossRef]
  49. Yao, X.; Liu, S.; Sun, M.; Zhang, X. Study on the Glacial Lake Outburst Flood Events in Tibet since the 20th Century. J. Nat. Resour. 2014, 29, 1377–1390, (In Chinese with English abstract). [Google Scholar]
  50. Jiang, Y.; Tang, W.; Yang, K.; He, J.; Shao, C.; Zhou, X.; Lu, H.; Chen, Y.; Li, X.; Shi, J. Development of a High-Resolution Near-Surface Meteorological Forcing Dataset for the Third Pole Region. Sci. China Earth Sci. 2025, 68, 1274–1290. [Google Scholar] [CrossRef]
  51. Jiang, Y.; Yang, K.; Qi, Y.; Zhou, X.; He, J.; Lu, H.; Li, X.; Chen, Y.; Li, X.D.; Zhou, B.; et al. TPHiPr: A Long-Term (1979–2020) High-Accuracy Precipitation Dataset (1/30° Daily) for the Third Pole Region Based on High-Resolution Atmospheric Modeling and Dense Observations. Earth Syst. Sci. Data 2023, 15, 621–638. [Google Scholar] [CrossRef]
  52. Zhou, X.; Yang, K.; Ouyang, L.; Wang, Y.; Jiang, Y.; Li, X.; Chen, D.; Prein, A. Added Value of Kilometer-Scale Modeling over the Third Pole Region: A CORDEX-CPTP Pilot Study. Clim. Dyn. 2021, 57, 1673–1687. [Google Scholar] [CrossRef]
  53. Liu, S.; Guo, W.; Xu, J. The Second Glacier Inventory Dataset of China (Version 1.0) (2006–2011); National Tibetan Plateau/Third Pole Environment Data Center: Beijing, China, 2012; Available online: https://doi.org/10.3972/glacier.001.2013.db (accessed on 4 March 2025).
  54. Rao, P.; Wang, F.; Yuan, X.; Liu, Y.; Jiao, Y. Evaluation and Comparison of 11 Sets of Gridded Precipitation Products over the Qinghai-Tibet Plateau. Atmos. Res. 2024, 302, 107315. [Google Scholar] [CrossRef]
  55. Vehvilainen, B. Temperature Index Snow Models Snow Cover. In Models in Operational Watershed Forecasting; National Board of Waters and the Environment: Helsinki, Finland, 1992; pp. 18–20. [Google Scholar]
  56. Yang, T.; Li, Q.; Zou, Q.; Hamdi, R.; Chen, X.; Bao, Y.; Cui, F.; De Maeyer, P.; Li, L. Quantifying the Snowfall Variations in the Third Pole Region from 1980 to 2020. Atmos. Res. 2023, 295, 106985. [Google Scholar] [CrossRef]
  57. Sen, P.K. Estimates of the Regression Coefficient Based on Kendall’s Tau. J. Am. Stat. Assoc. 1968, 63, 1379–1389. [Google Scholar] [CrossRef]
  58. Mann, M.E. On Smoothing Potentially Non-Stationary Climate Time Series. Geophys. Res. Lett. 2004, 31, L07214. [Google Scholar] [CrossRef]
  59. Shroder, J.F.; Haeberli, W.; Whiteman, C. Snow and Ice-Related Hazards, Risks, and Disasters; Elsevier: Amsterdam, The Netherlands, 2015. [Google Scholar]
  60. Zhou, J.; Cui, P.; Hao, M.H. Comprehensive analyses of the initiation and entrainment processes of the 2000 Yigong catastrophic landslide in Tibet, China. Landslides 2016, 13, 39–54. [Google Scholar] [CrossRef]
  61. Cui, P.; Yang, K.; Chen, J. Relationship between occurrence of debris flow and antecedent precipitation: Taking the Jiangjia Gully as an example. Sci. Soil Water Conserv. 2003, 1, 11–15, (In Chinese with English abstract). [Google Scholar]
  62. Hao, J.; Huang, F.; Liu, Y.; Li, L. Avalanche activity and characteristics of its triggering factors in the western Tianshan Mountains, China. J. Mt. Sci. 2018, 15, 1397–1411. [Google Scholar] [CrossRef]
  63. Bollasina, M.A.; Ramaswamy, V. Anthropogenic aerosols and the weakening of the South Asian summer monsoon. Science 2011, 334, 502–505. [Google Scholar] [CrossRef]
  64. Klene, A.E.; Nelson, F.E.; Shiklomanov, N.I.; Hinkel, K.M. The n-factor in natural landscapes: Variability of air and soil-surface temperatures, Kuparuk River Basin, Alaska, USA. Arct. Antarct. Alp. Res. 2001, 33, 140–148. [Google Scholar] [CrossRef]
  65. Frauenfeld, O.W.; Zhang, T.; McCreight, J.L. Northern hemisphere freezing/thawing index variations over the twentieth century. Int. J. Climatol. 2007, 27, 47–63. [Google Scholar] [CrossRef]
  66. Zhou, W.; Zou, Q.; Chen, S.; Jiang, H.; Zhou, B.; Yao, H.; Yang, T. Extreme climate and human activities contribute to low-frequency, large-scale catastrophic debris flow: A case study in the Heishui Gully. Geomat. Nat. Hazards Risk 2024, 15, 2316719. [Google Scholar] [CrossRef]
Figure 2. Spatial distribution of the annual mean temperature (Tavg) (a) and its trend (b) in Southeast Tibet from 1979 to 2022. The shaded areas in (b) indicate trends that are significant at the 0.05 significance level. The gray patches represent glacier-covered areas, while the black triangles indicate points of major glacial disaster chains. (c,d), (e,f), and (g,h) are similar to (a,b) but for annual extreme maximum temperature (TXmax), percentage of days with daily mean temperature above 0 °C in a whole year (DTg0), and percentage of days with daily minimum temperature below 0 °C and daily maximum temperature above 0 °C in a whole year (DTc0), respectively. The units for temperature and percentage of days are °C and %, respectively, while the units for their trends are °C and % per ten years (°C/10a and %/10a).
Atmosphere 16 00547 g002
Figure 3. (a,b), (c,d), and (e,f) are similar to Figure 2a,b but for annual total precipitation (Ptot), maximum daily precipitation (PX1d), and maximum cumulative precipitation for 7 consecutive days (PX7d), respectively. The gray patches represent glacier-covered areas, while the black triangles indicate points of major glacial disaster chains. The units for precipitation and its trend are mm and mm/10a, respectively.
Atmosphere 16 00547 g003
Figure 4. (a,b), (c,d), and (e,f) are similar to Figure 2a,b but for annual total snowfall (Stot), maximum daily snowfall (SX1d), and maximum cumulative snowfall for 3 consecutive days (SX3d), respectively. The gray patches represent avalanche-prone areas of Mt. Duoxiongla and the Parlung Zangbo River Basin. The units for snowfall and its trend are mm and mm/10a, respectively.
Atmosphere 16 00547 g004
Figure 5. Violin plots of temperature indicators, including the averages and trends of Tavg, TXmax, DTg0, and DTc0 (ah), for grid cells with (blue) and without (red) glacier coverage in the Yarlung Zangbo River, middle reaches of the Yarlung Zangbo River, Yigong Zangbo River, and Parlung Zangbo River subregions. The vertical lines in the center represent the range of non-outlier data, black boxes indicate the 25th and 75th percentiles, and white dots denote the median (the same below). Gray cross symbols represent the values of temperature indicators at the sites of glacial disaster chains (see Table 1) within the four subregions.
Atmosphere 16 00547 g005
Figure 6. Violin plots of precipitation indicators, including the averages and trends of Ptot, PX1d, and PX7d (af), for grid cells with (blue) and without (red) glacier coverage in the lower reaches of the Yarlung Zangbo River, middle reaches of the Yarlung Zangbo River, Yigong Zangbo River, and Parlung Zangbo River subregions. Gray cross symbols represent the values of precipitation indicators at the sites of glacial disaster chains (see Table 1) within the four subregions.
Atmosphere 16 00547 g006
Figure 7. Violin plots of snowfall indicators, including the averages and trends of Stot, SX1d, and SX3d (af), for grid cells in the lower reaches of the Yarlung Zangbo River (except for non-snow areas) and Parlung Zangbo River subregions (blue) and in the avalanche-prone areas of Mt. Duoxiongla and the Parlung Zangbo River subregion (red).
Atmosphere 16 00547 g007
Figure 8. Summary diagram of the historical changes of key meteorological indicators and their impacts on disasters in SET. The green patch indicates the Yarlung Zangbo Grand Bend moisture corridor. The yellow patches indicate the middle reaches of the Yarlung Zangbo River, the Yigong Zangbo River Basin, and the upper reaches of the Parlung Zangbo River. The blue patch marks the concerning avalanche areas.
Atmosphere 16 00547 g008
Table 2. List of meteorological indicators used in this study.
SymbolFull Name
TavgAnnual mean temperature
TXmaxAnnual extreme maximum temperature
DTg0Percentage of days with daily mean temperature above 0 °C in a whole year (indicating melt)
DTc0Percentage of days with daily minimum temperature below 0 °C and daily maximum temperature above 0 °C in a whole year (indicating freeze–thaw cycle)
PtotAnnual total precipitation
PX1dMaximum daily precipitation
PX7dMaximum cumulative precipitation for 7 consecutive days
StotAnnual total snowfall
SX1dMaximum daily snowfall
SX3dMaximum cumulative snowfall for 3 consecutive days
Disclaimer/Publisher’s Note: The statements, opinions and data contained in all publications are solely those of the individual author(s) and contributor(s) and not of MDPI and/or the editor(s). MDPI and/or the editor(s) disclaim responsibility for any injury to people or property resulting from any ideas, methods, instructions or products referred to in the content.

