

Sensitivity Analysis and Performance Evaluation of the WRF Model in Forecasting an Extreme Rainfall Event in Itajubá, Southeast Brazil


Abstract
1. Introduction
2. Methodology
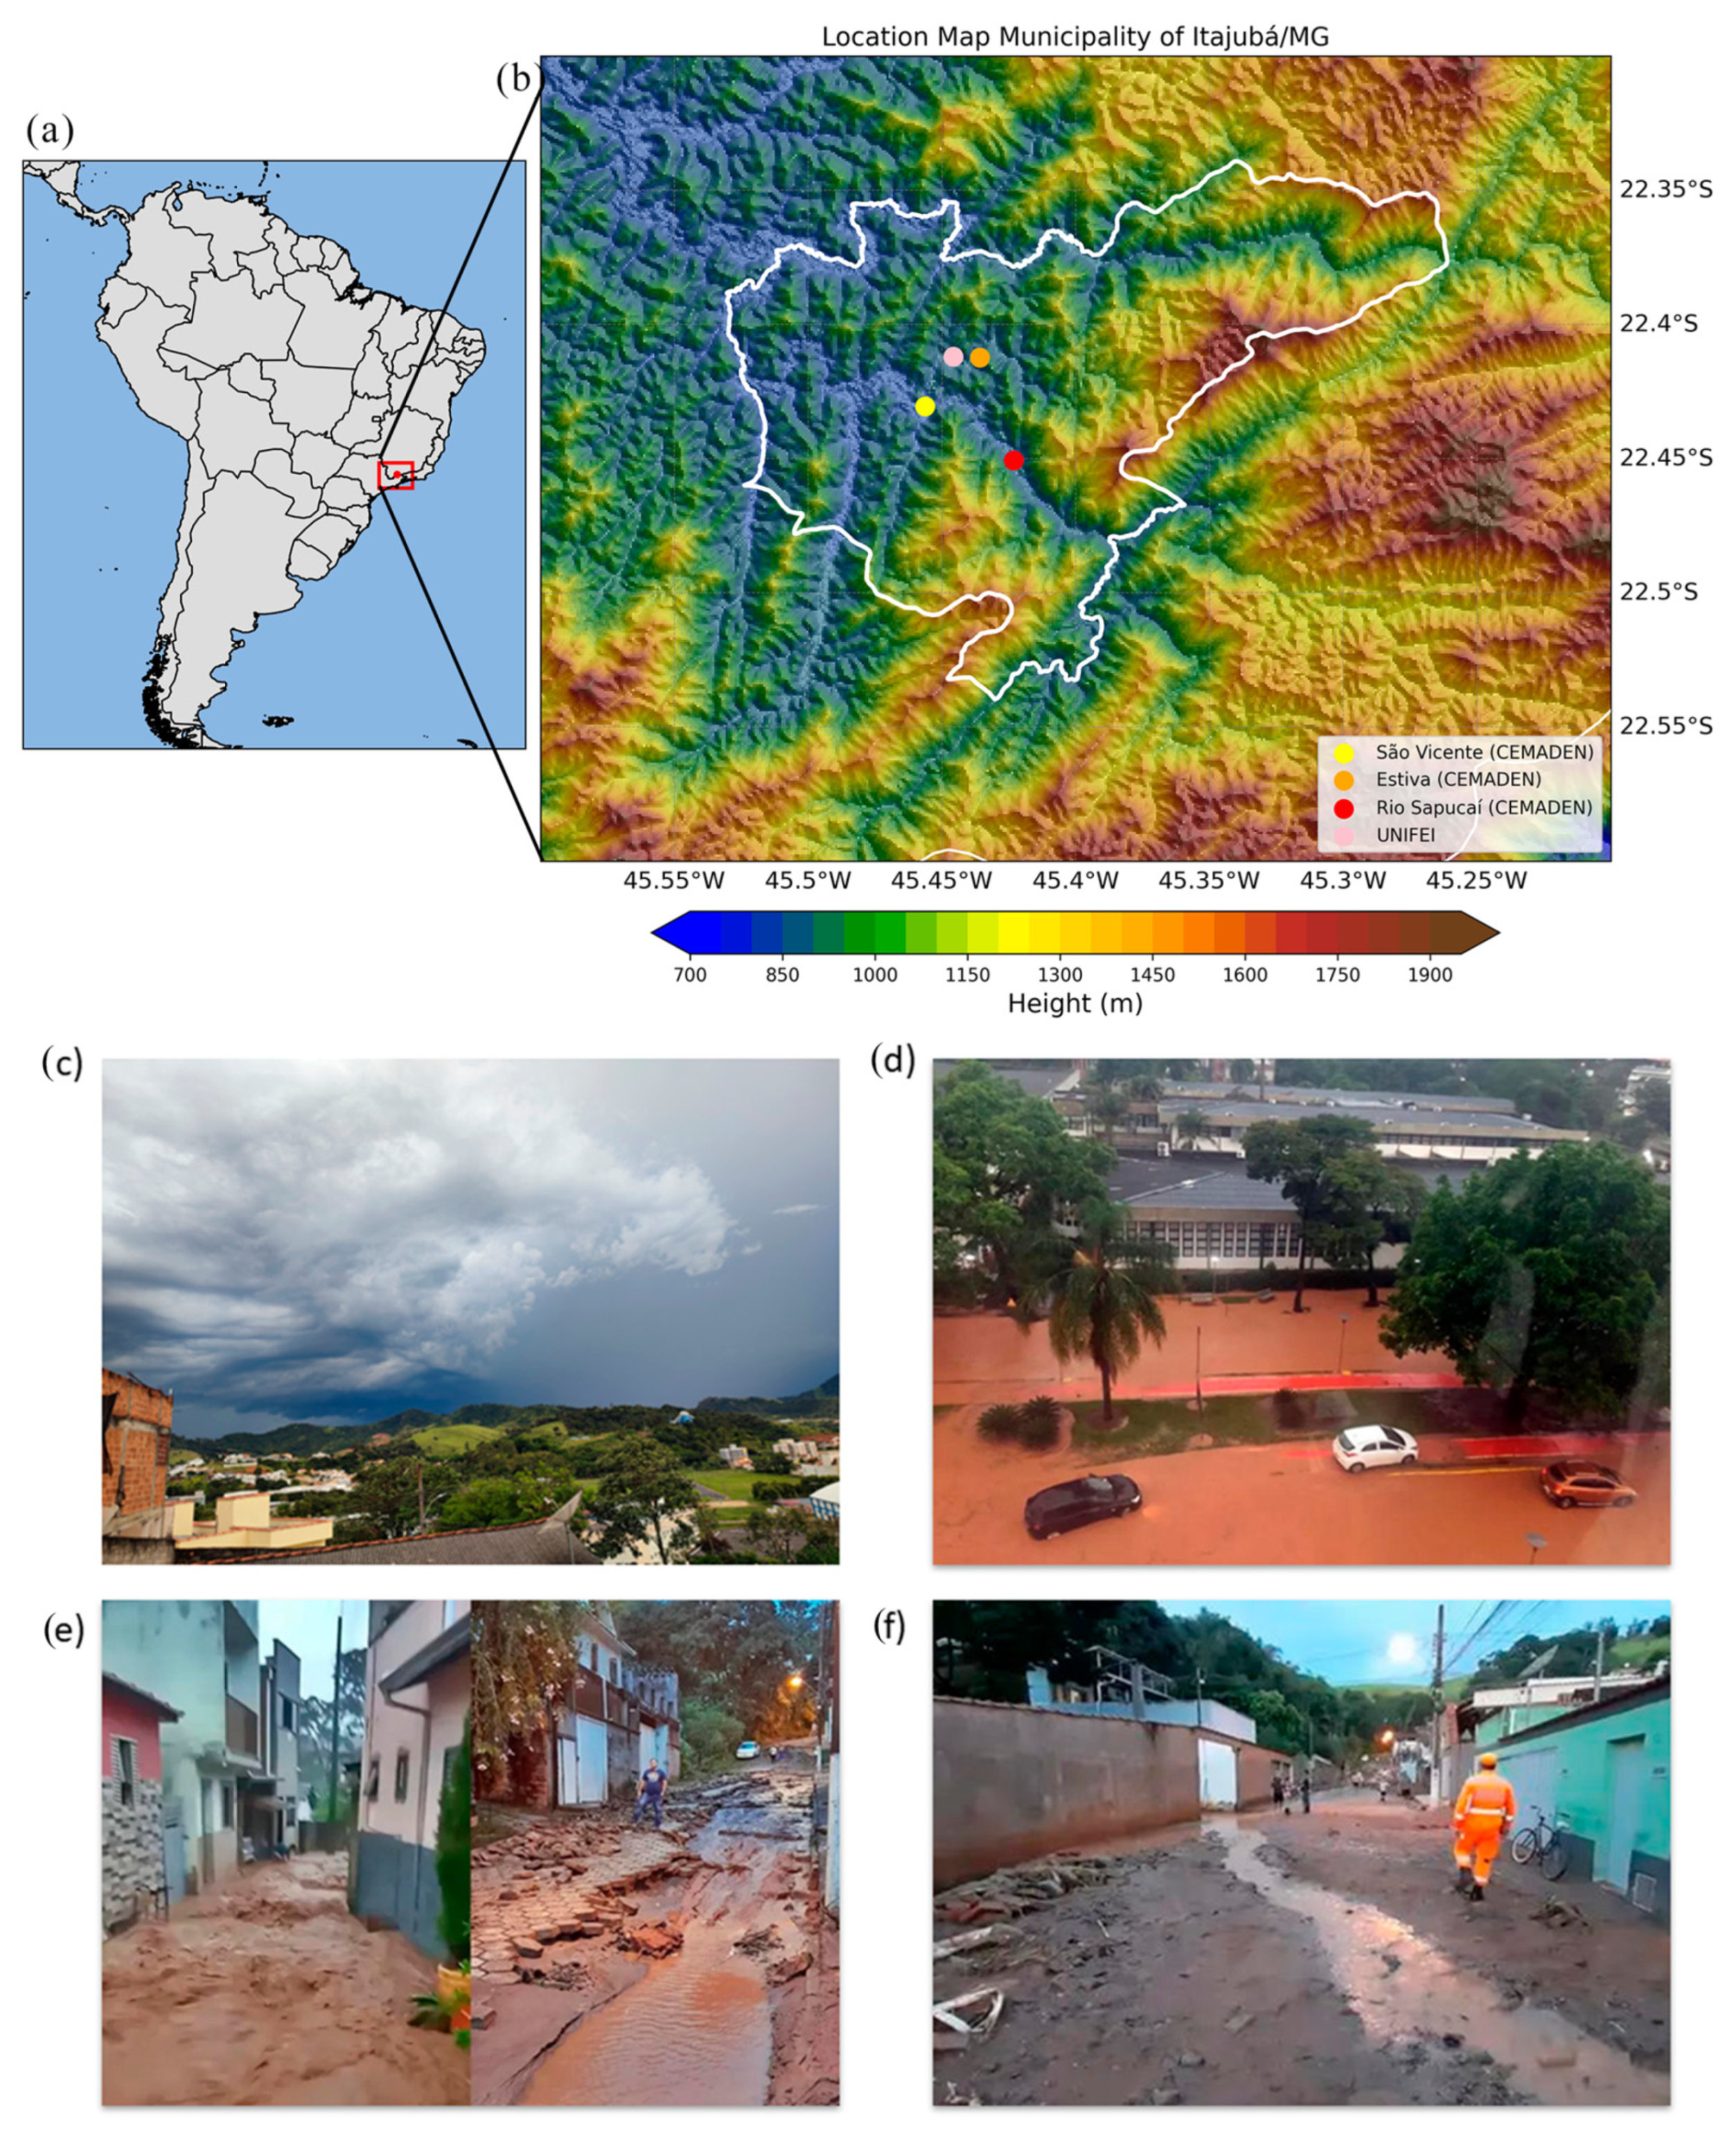
2.1. Study Area
2.2. Data
2.2.1. ERA5 Reanalysis
2.2.2. Global Data Assimilation System (GDAS) and Global Forecast System (GFS) Analyses
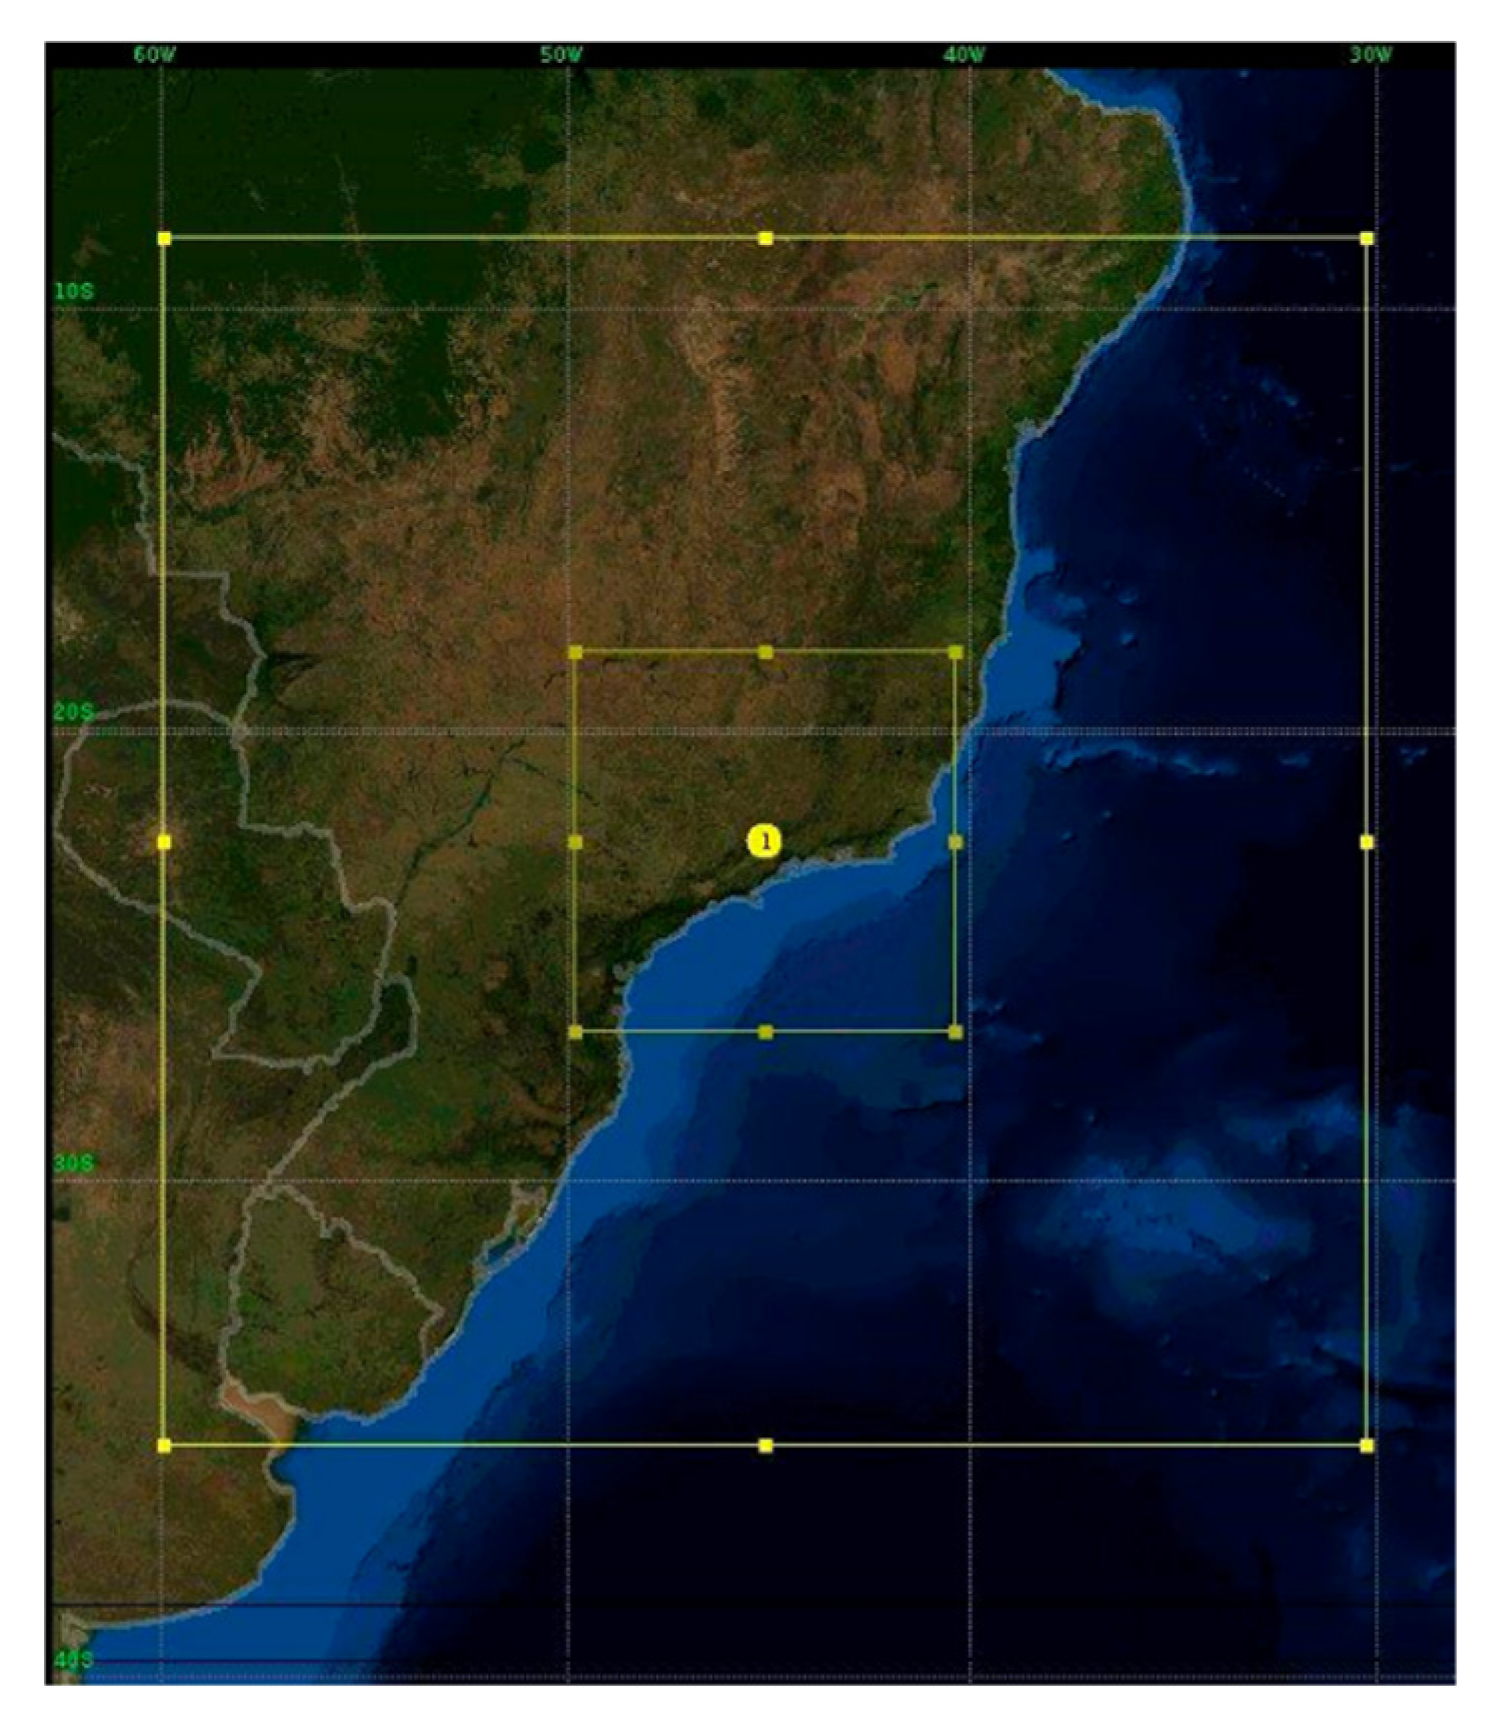
2.2.3. Radar Data
2.2.4. Geostationary Operational Environmental Satellite (GOES) Data
2.2.5. Precipitation Measurements
- -
- In situ data: Hourly precipitation data from 60 rain gauges and weather stations, located in the states of MG and São Paulo (SP), were provided by CEMADEN (http://www2.cemaden.gov.br/mapainterativo/, accessed on 15 November 2024) and the National Institute of Meteorology (INMET, https://portal.inmet.gov.br/, accessed on 15 November 2024). The stations are spread across the municipalities of Itajubá, Lambari, Juiz de Fora, Passos, Poços de Caldas, Extrema, Santa Rita do Sapucaí, São Lourenço, and Maria da Fé in MG and Lorena, Campos do Jordão, Cachoeira Paulista, São Bento do Sapucaí, and Atibaia in SP.
- -
- Gridded datasets: Gridded precipitation was provided by the MERGE/CPTEC and Rainfall Estimates from Rain Gauge and Satellite Observations (CHIRPS). The MERGE/CPTEC combines data from the Global Precipitation Measurement (GPM) Integrated Multi-satellite Retrievals for GPM (IMERG) [52,53] with ground-based observations. The MERGE/CPTEC dataset has a spatial resolution of 0.1° (~10 km), frequency of 30 min, and is available at http://ftp.cptec.inpe.br/modelos/tempo/MERGE/GPM (accessed on 15 November 2024).
2.3. WRF Model
2.4. Design of the Sensitivity Numerical Experiments
2.5. Analyses
3. Results and Discussion
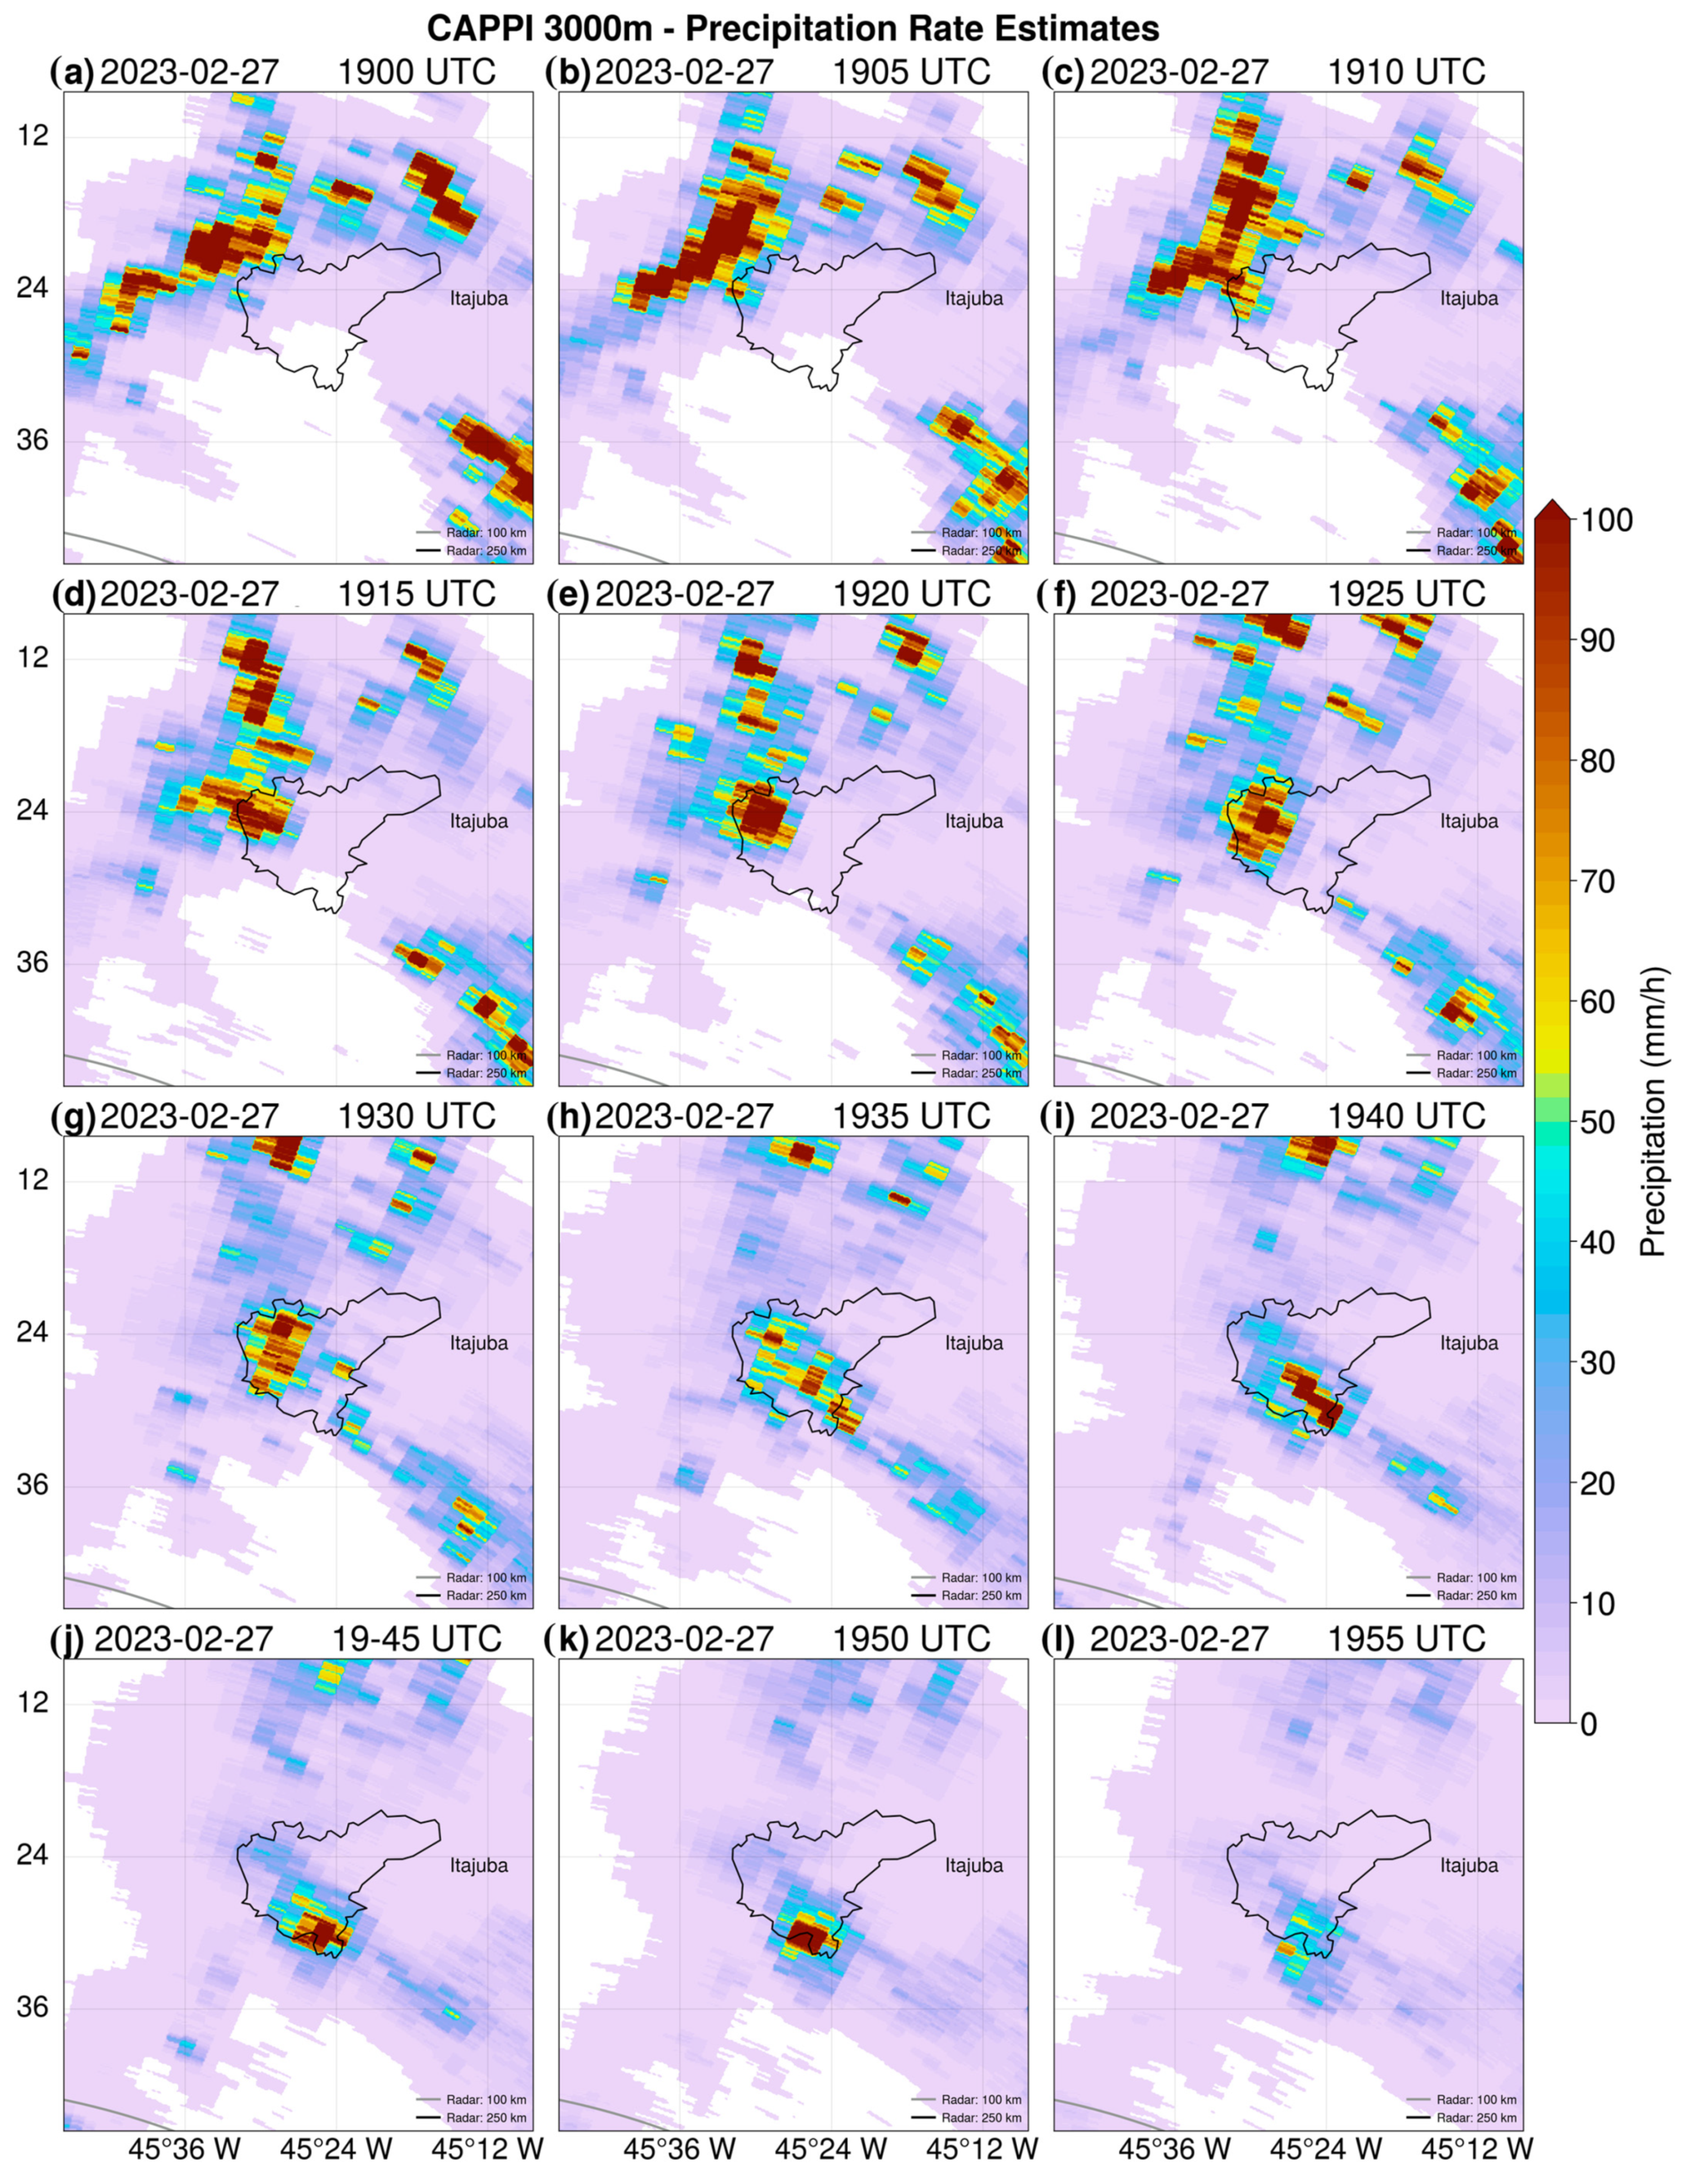
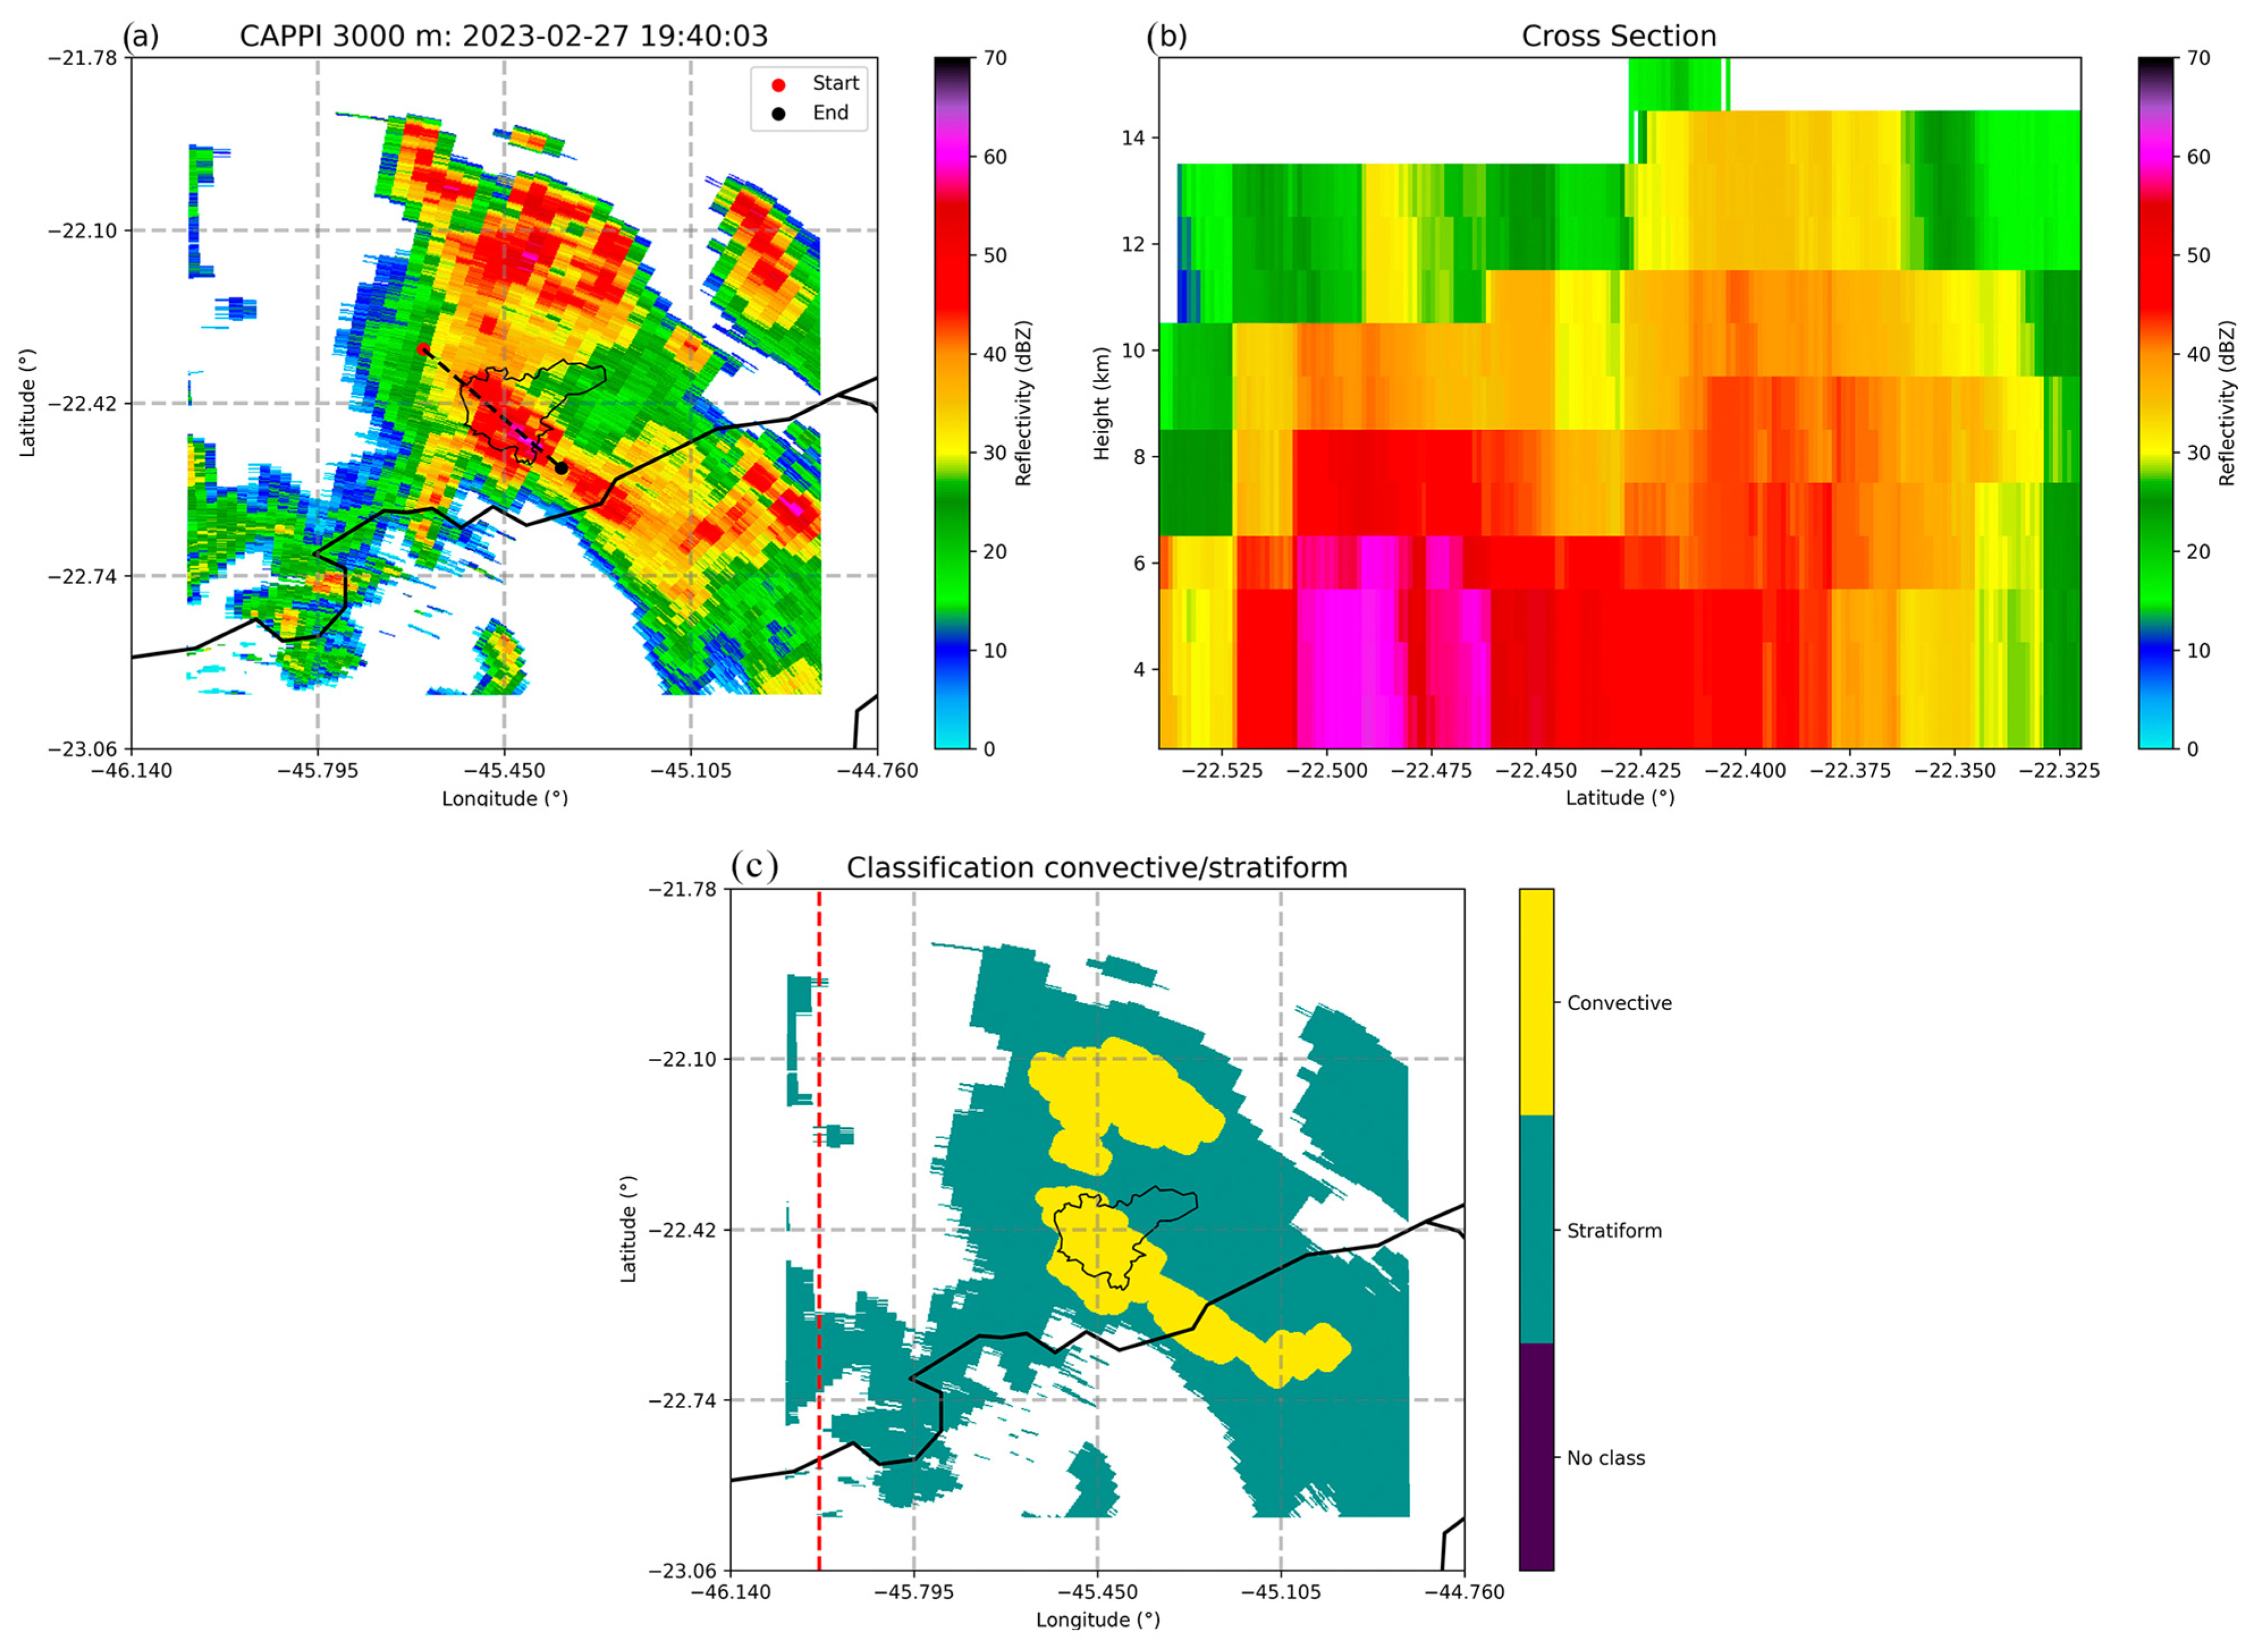
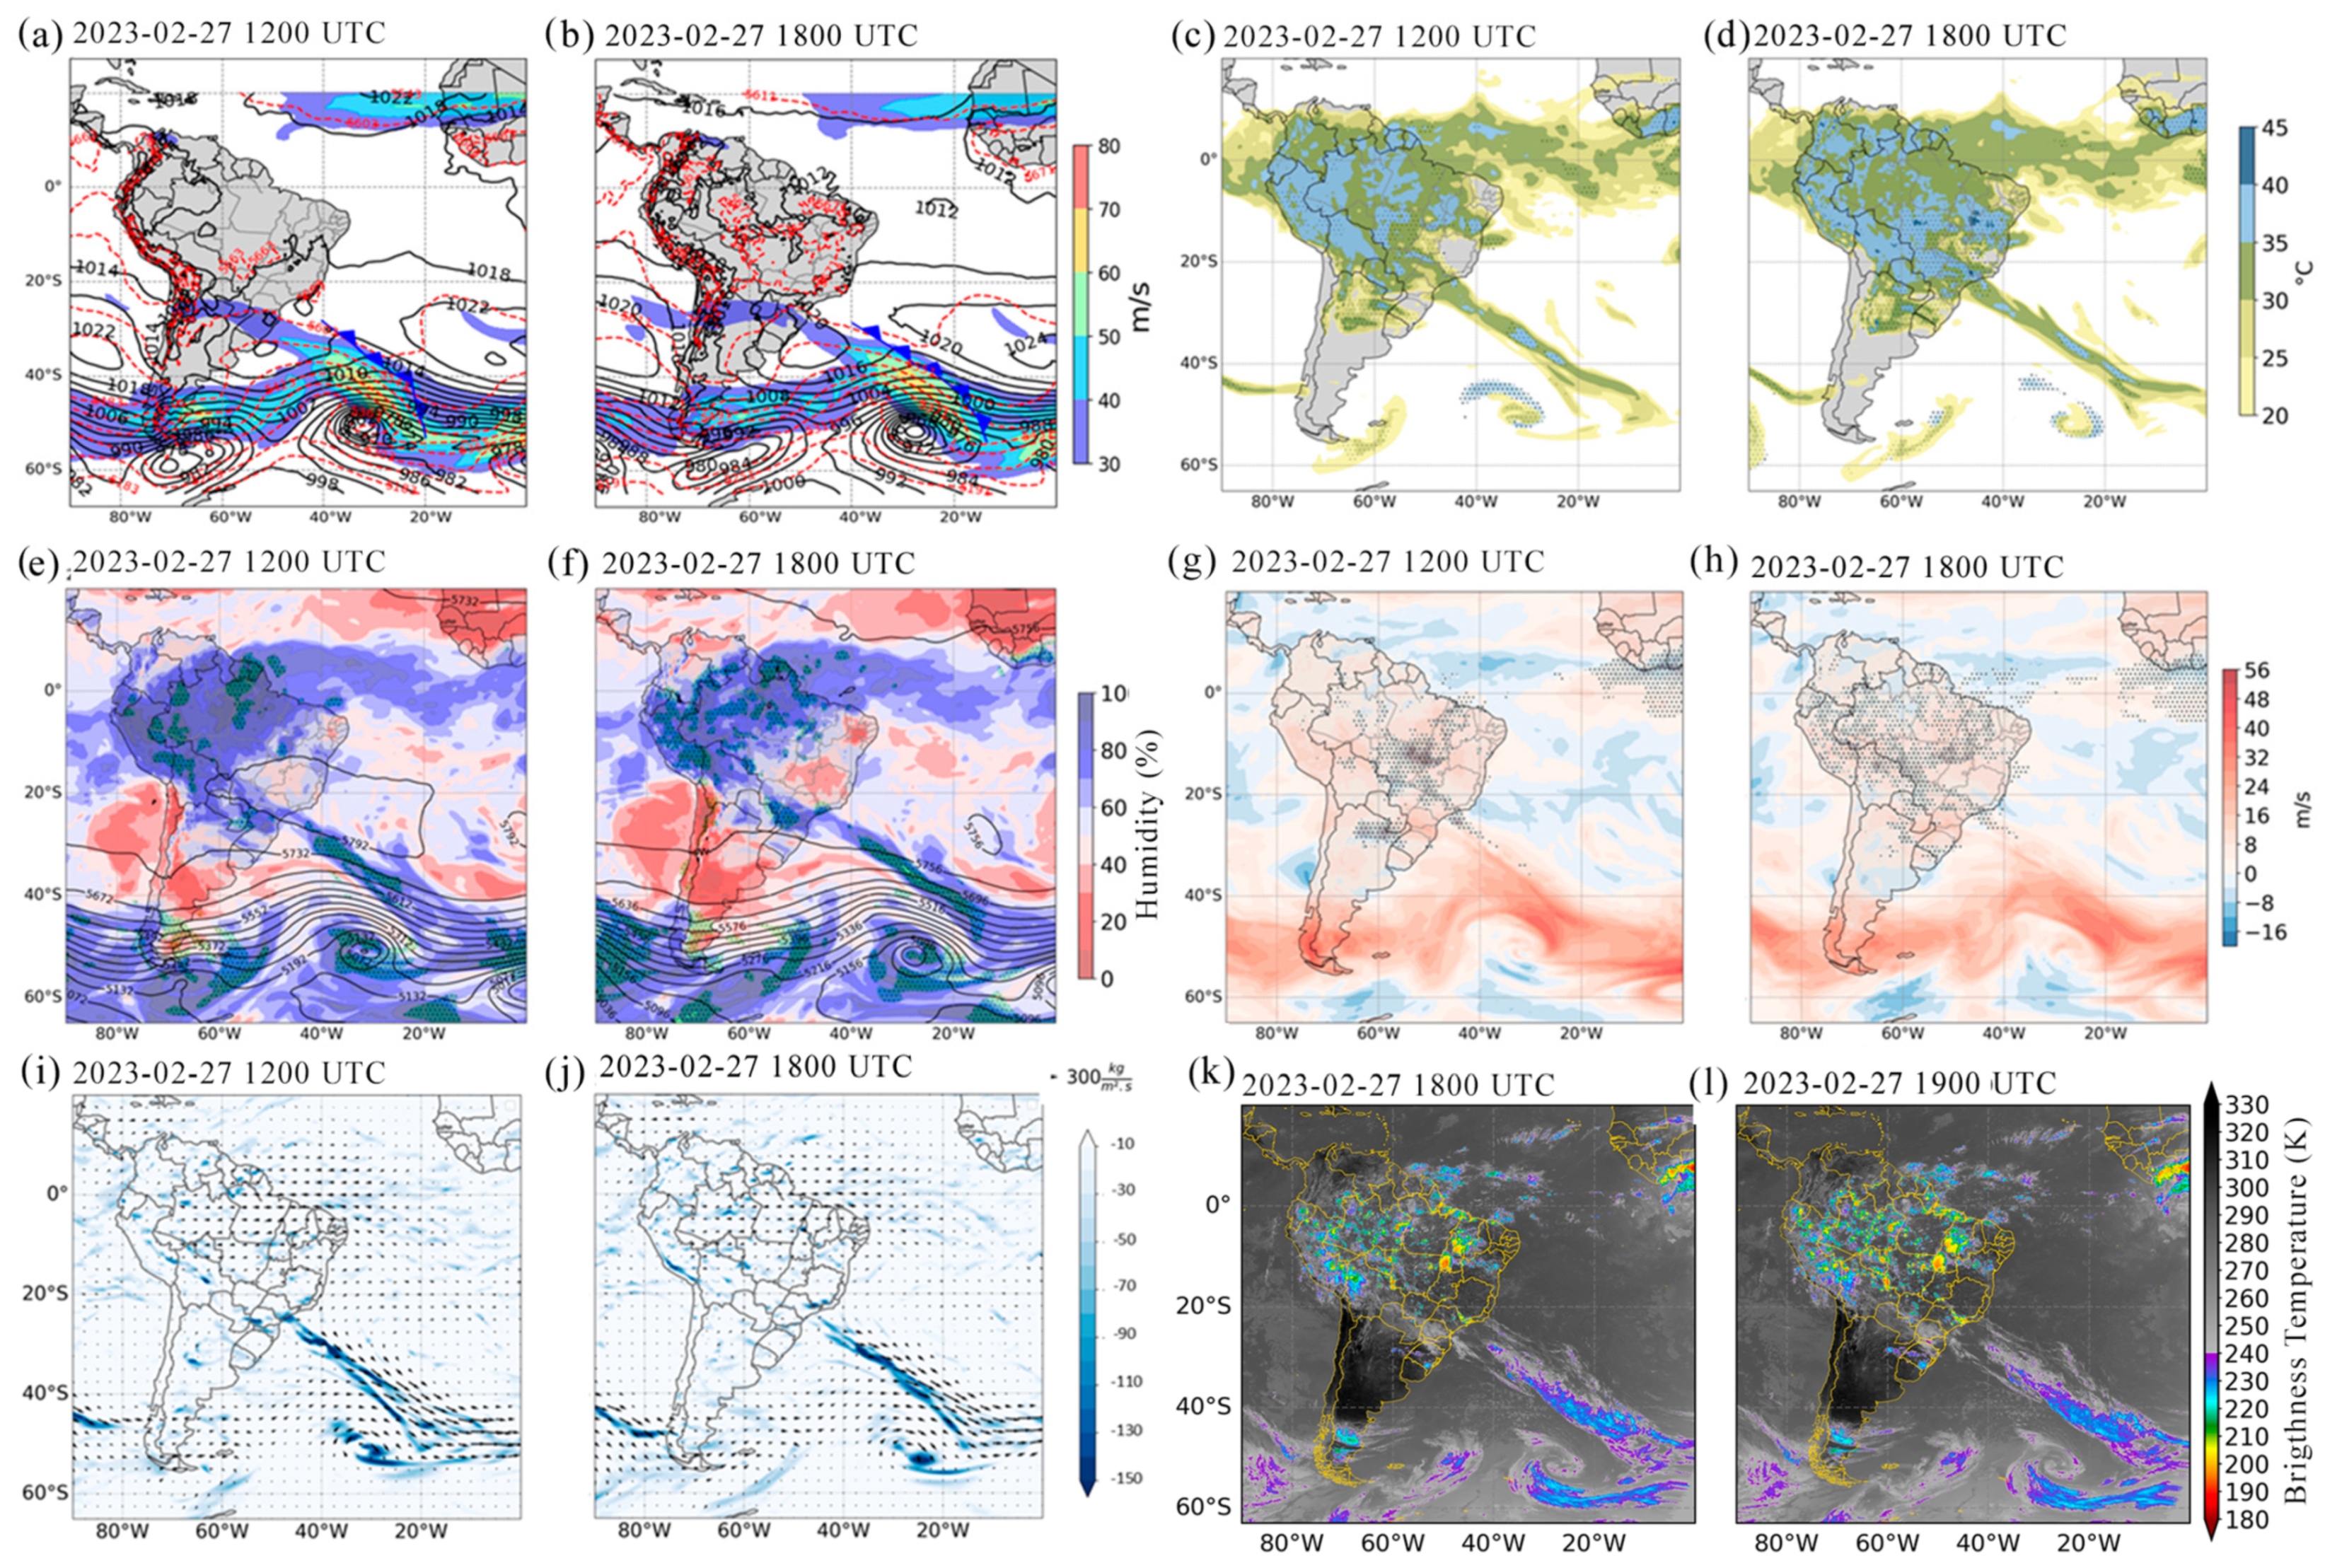
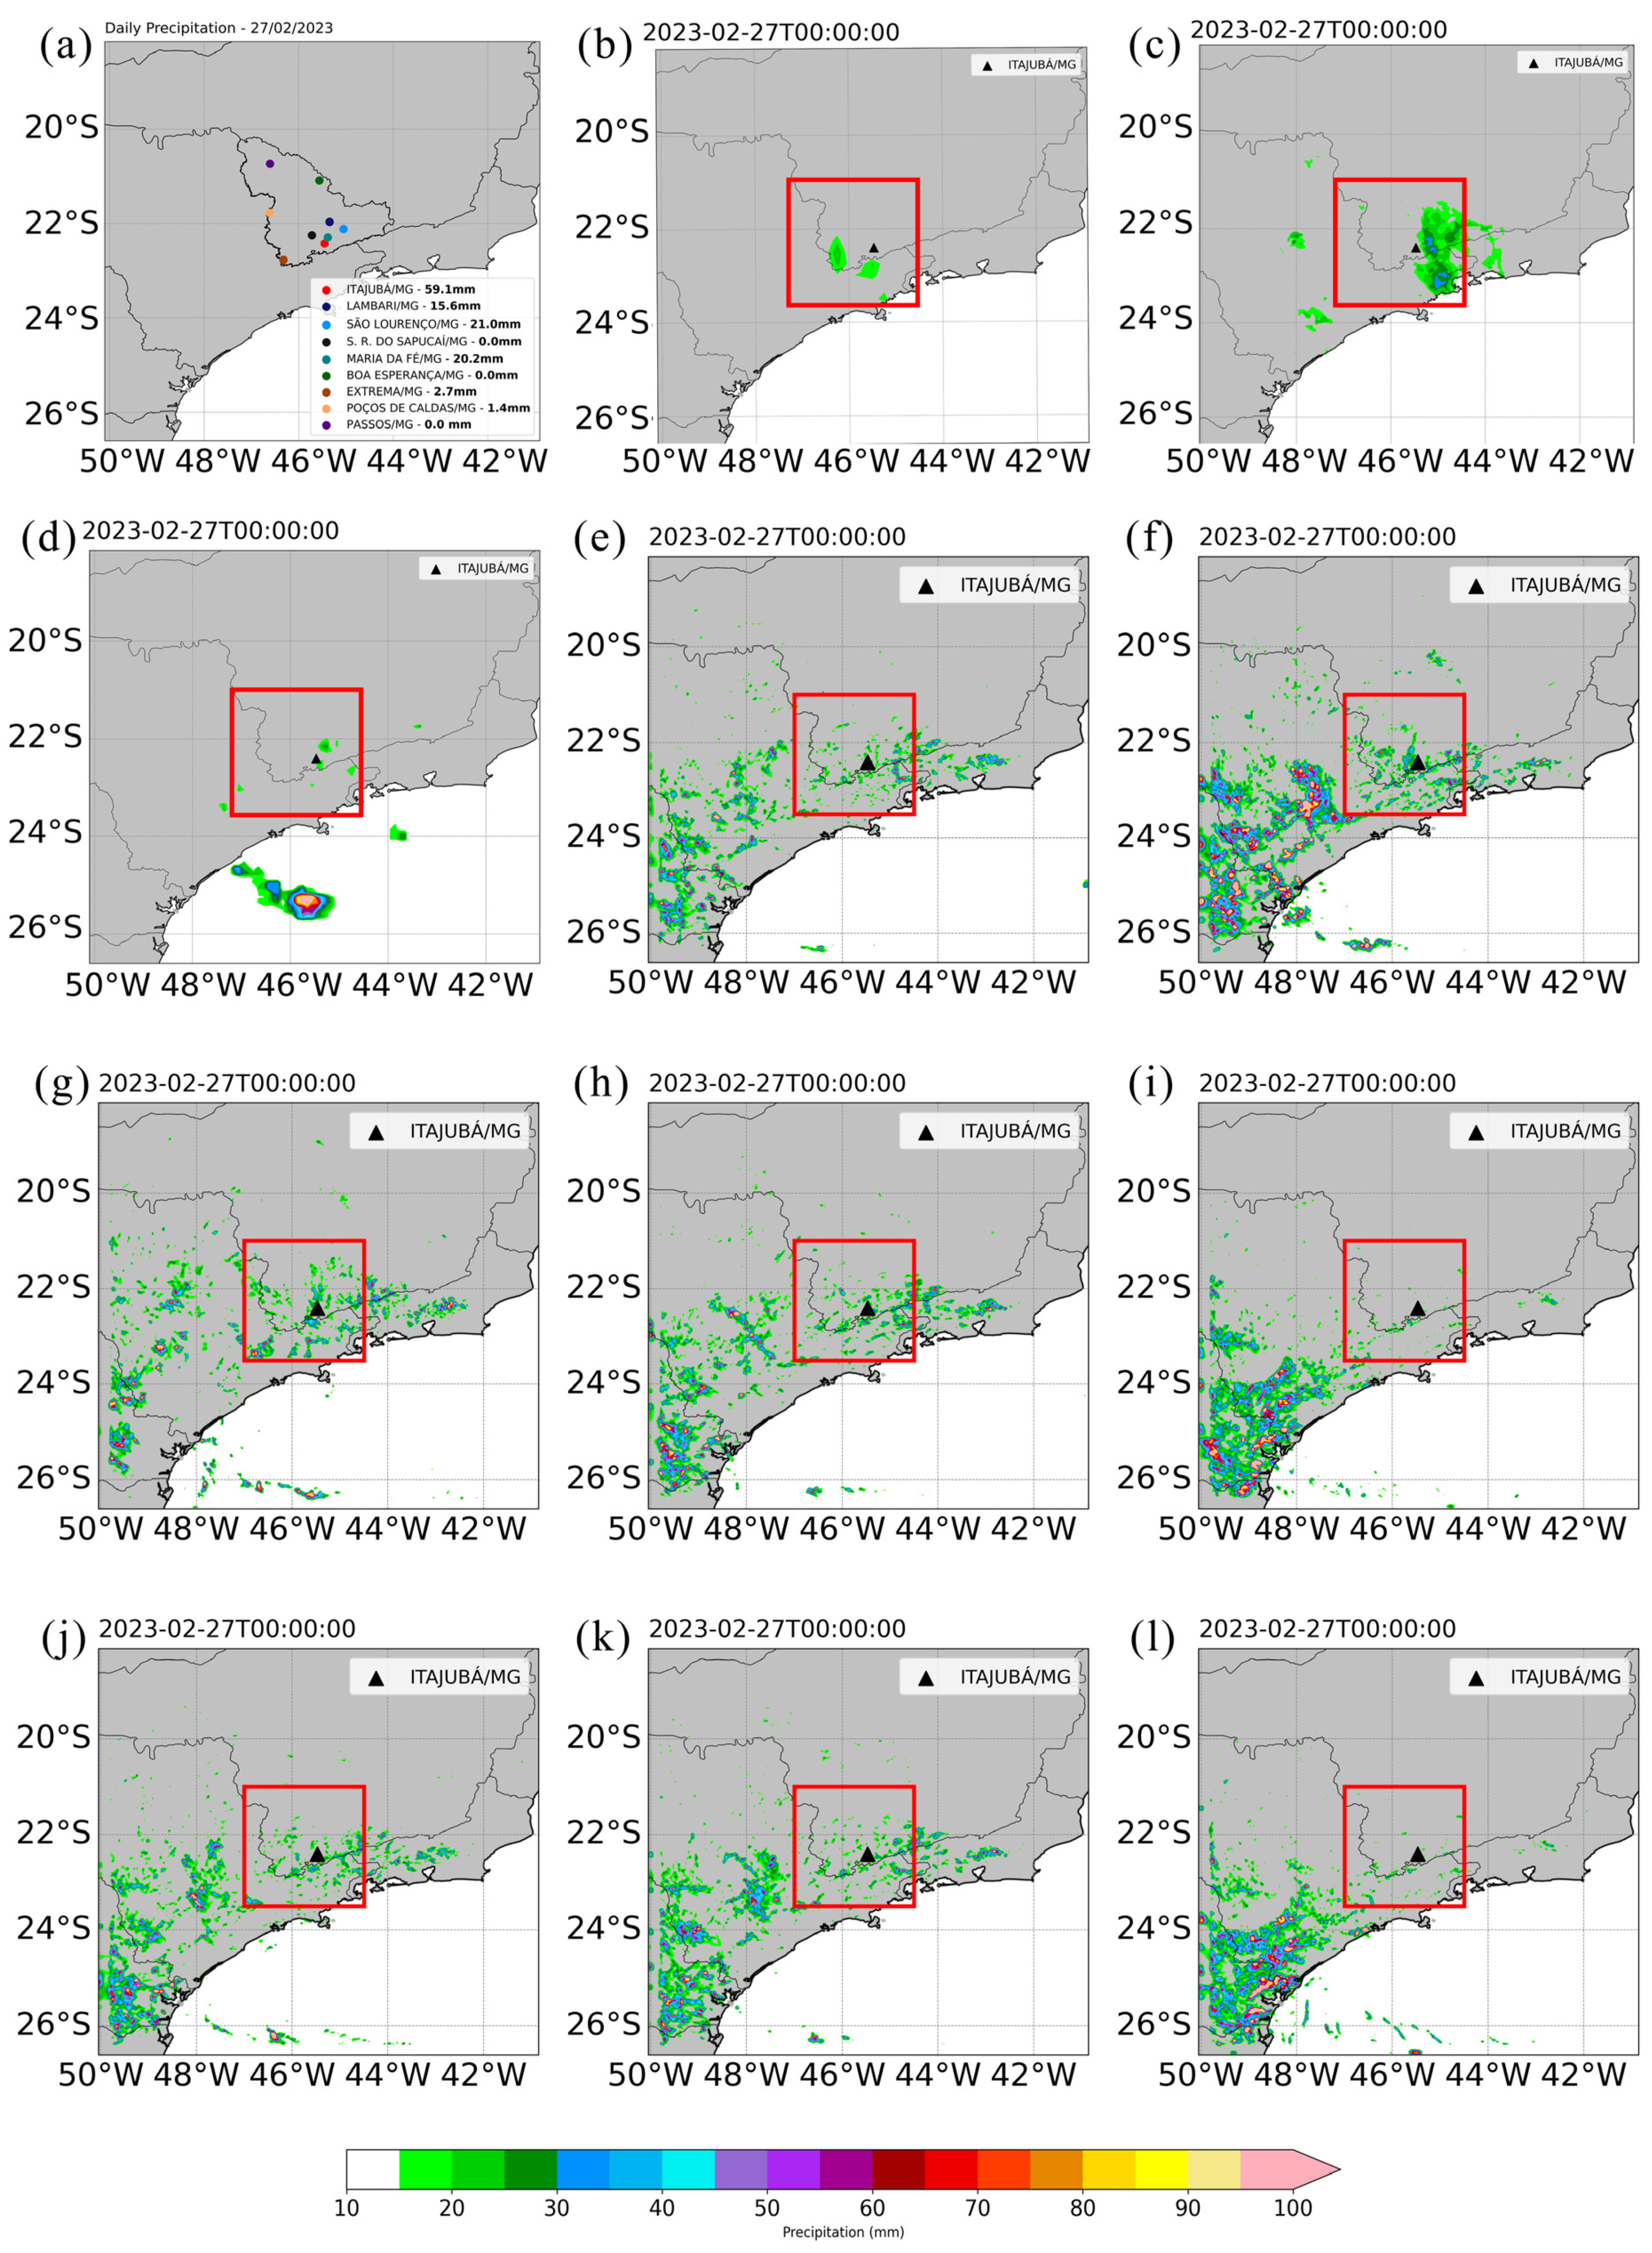
3.1. Characterization of the Study Case
3.2. Numerical Experiments
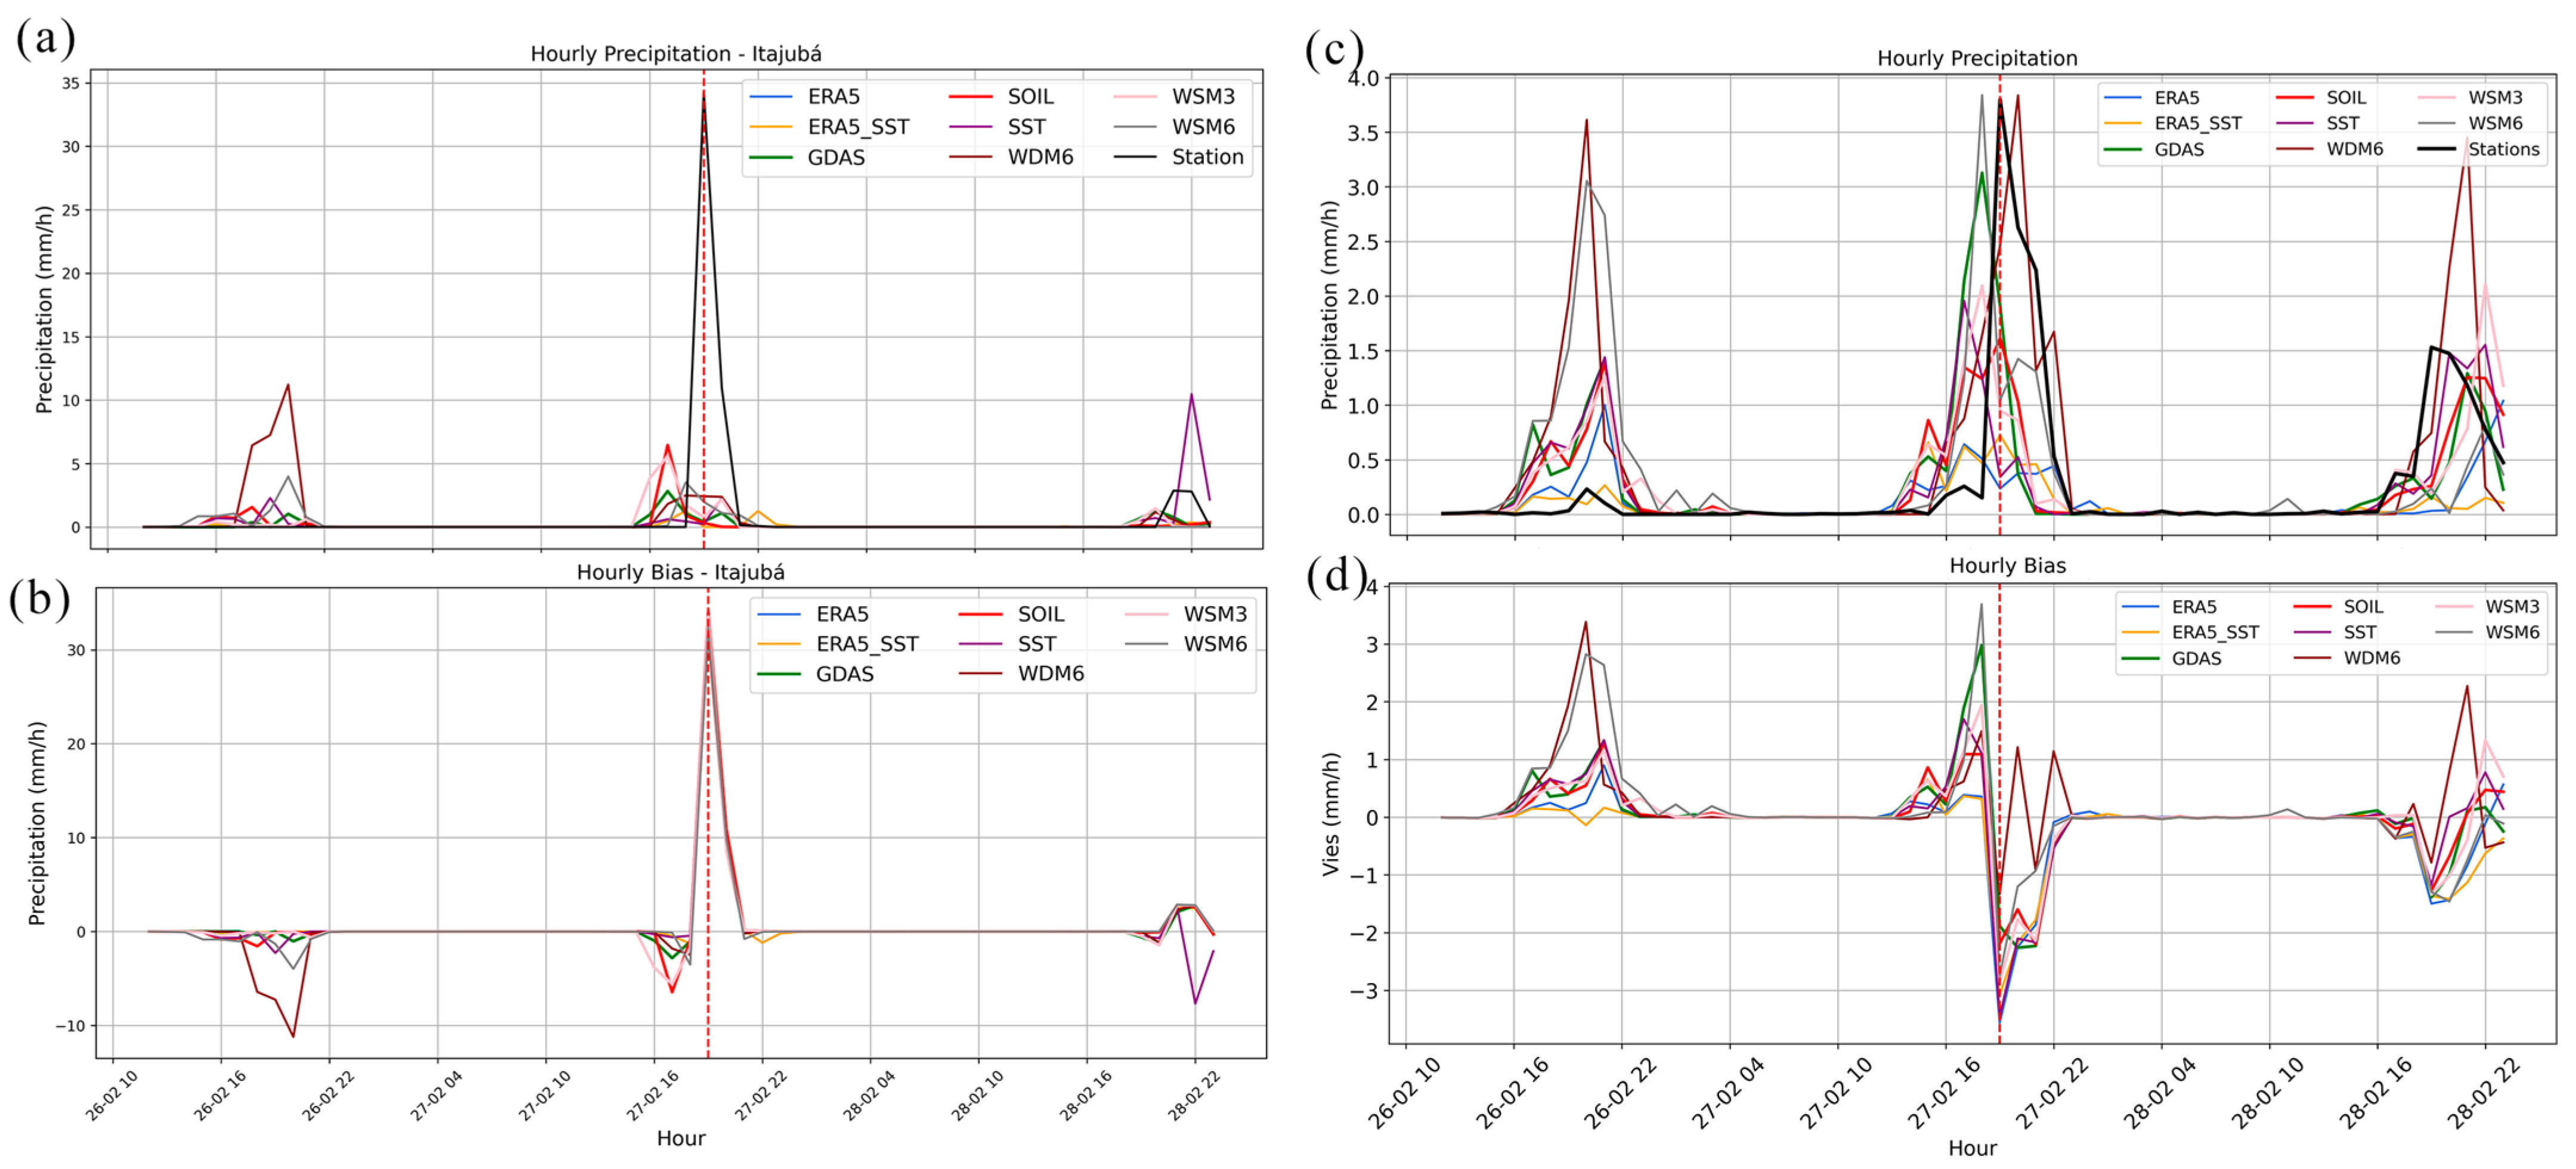
3.2.1. Precipitation
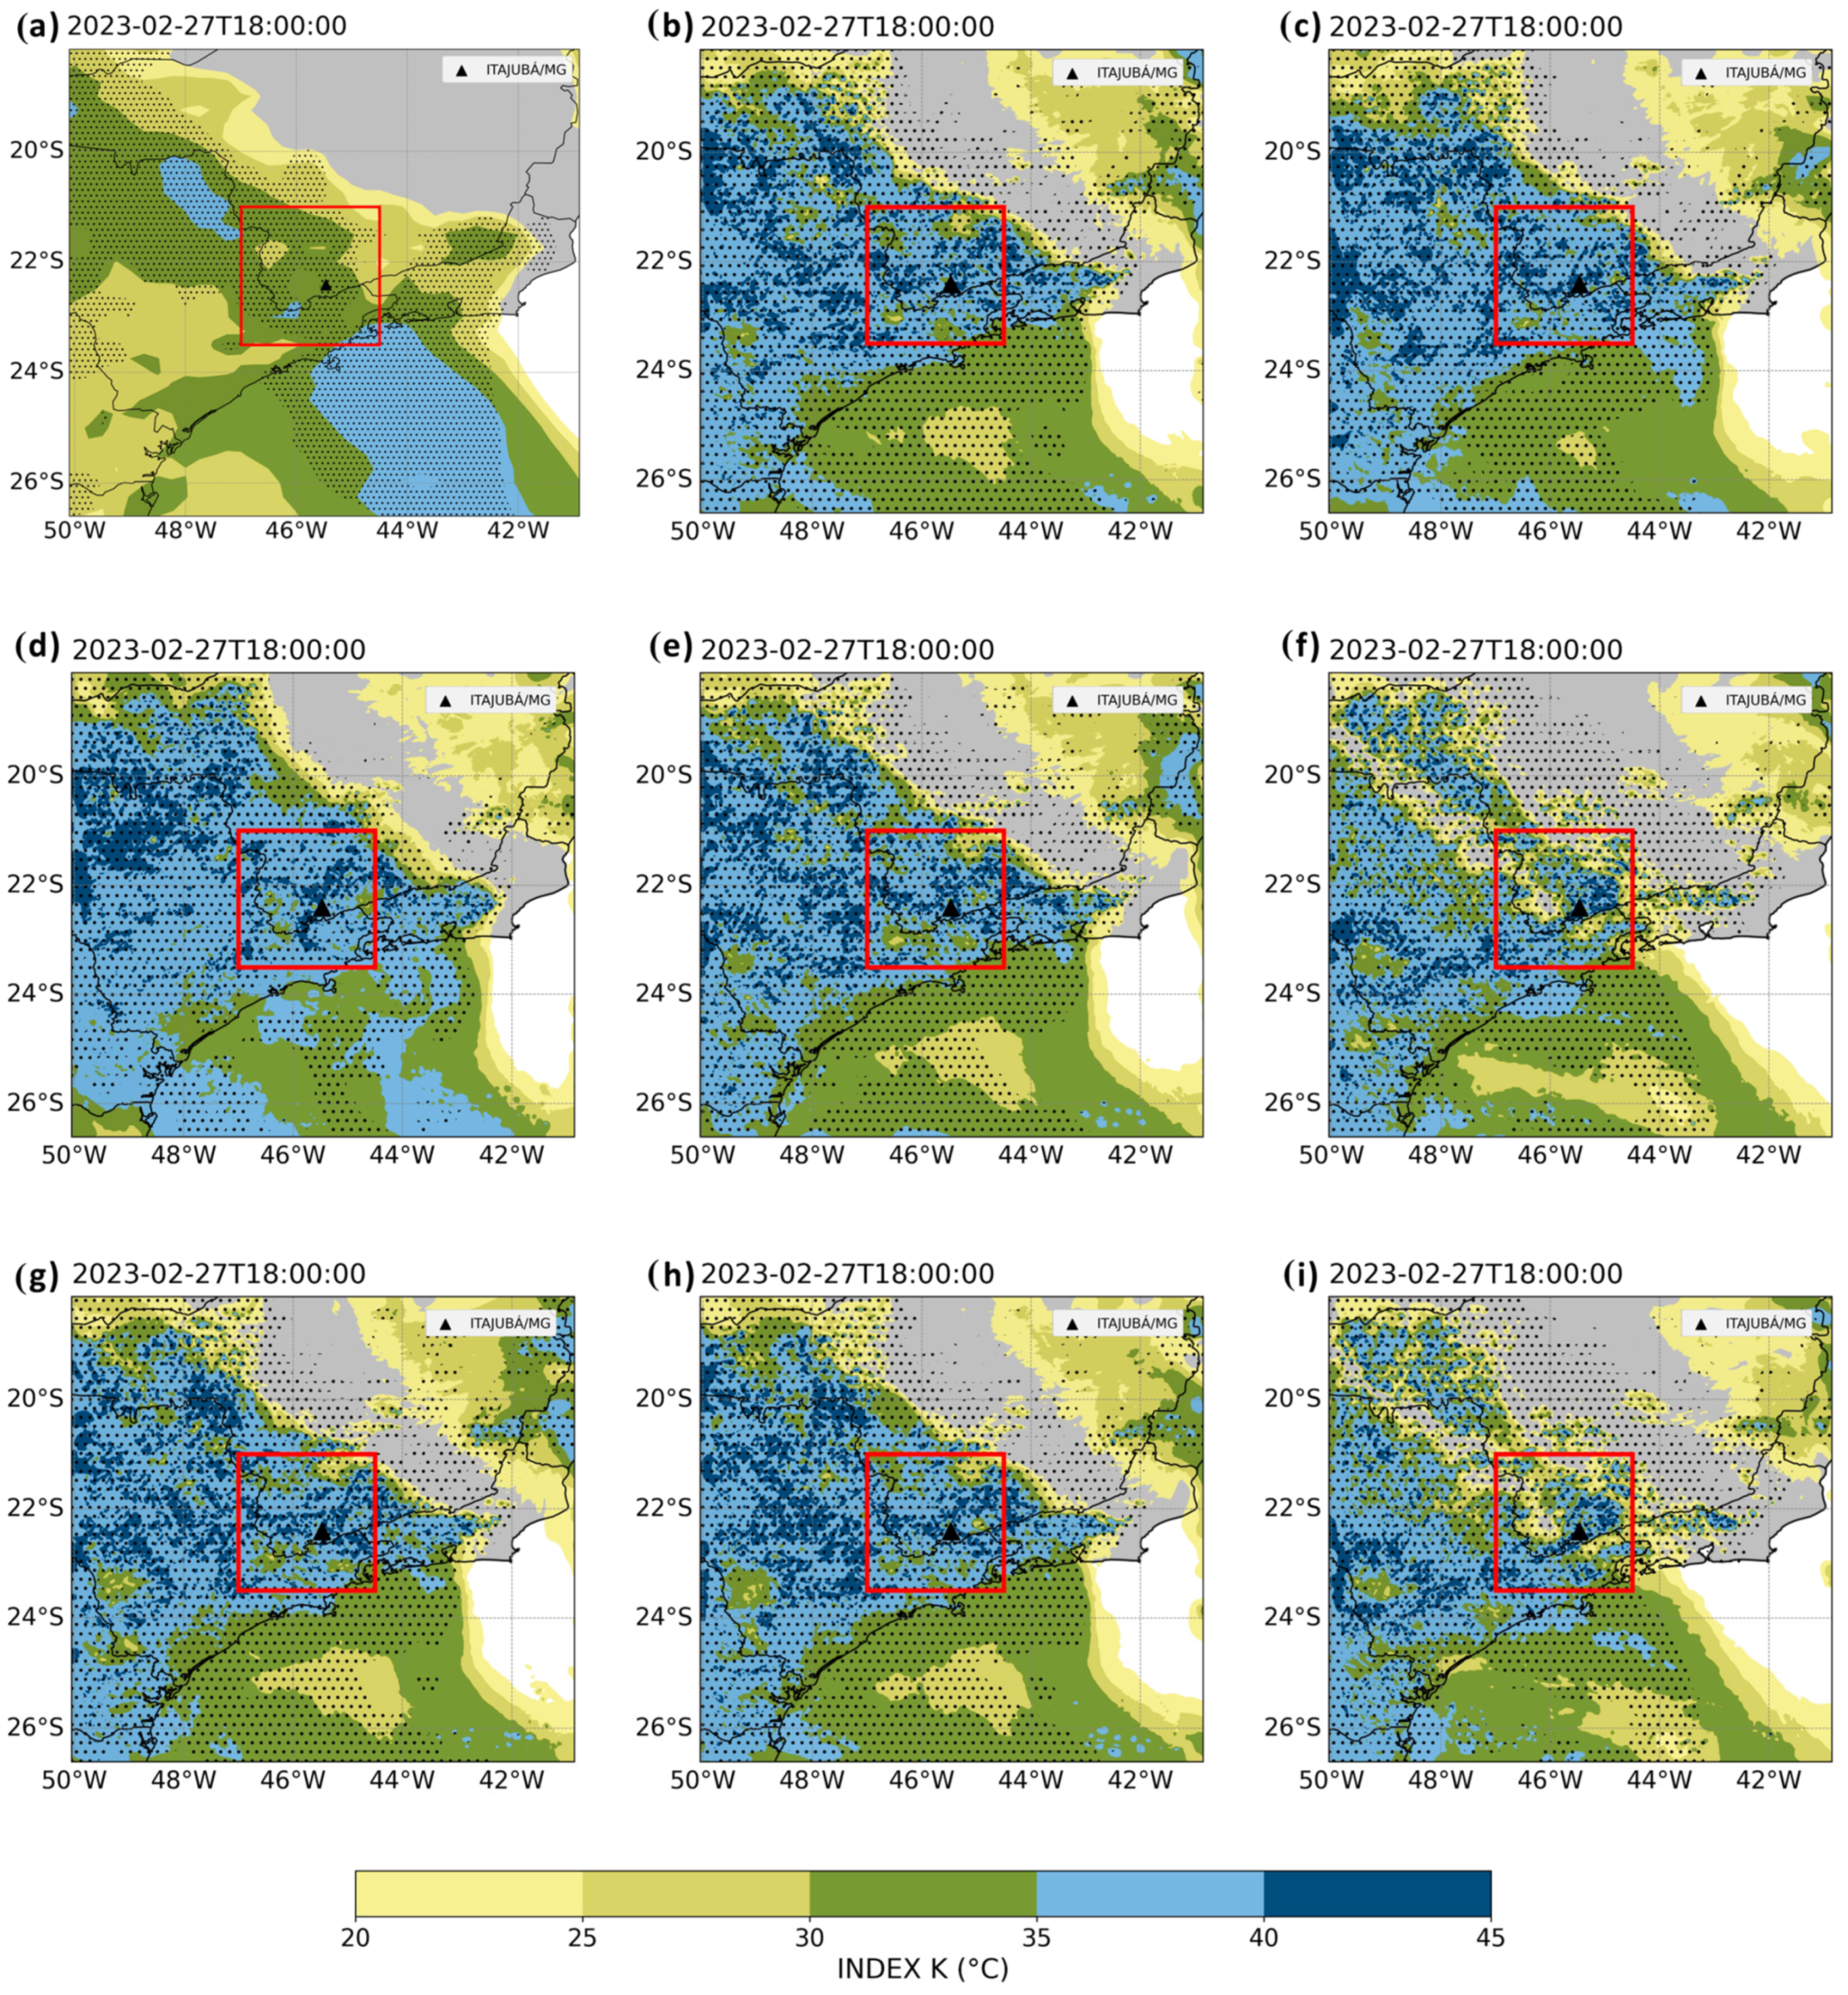
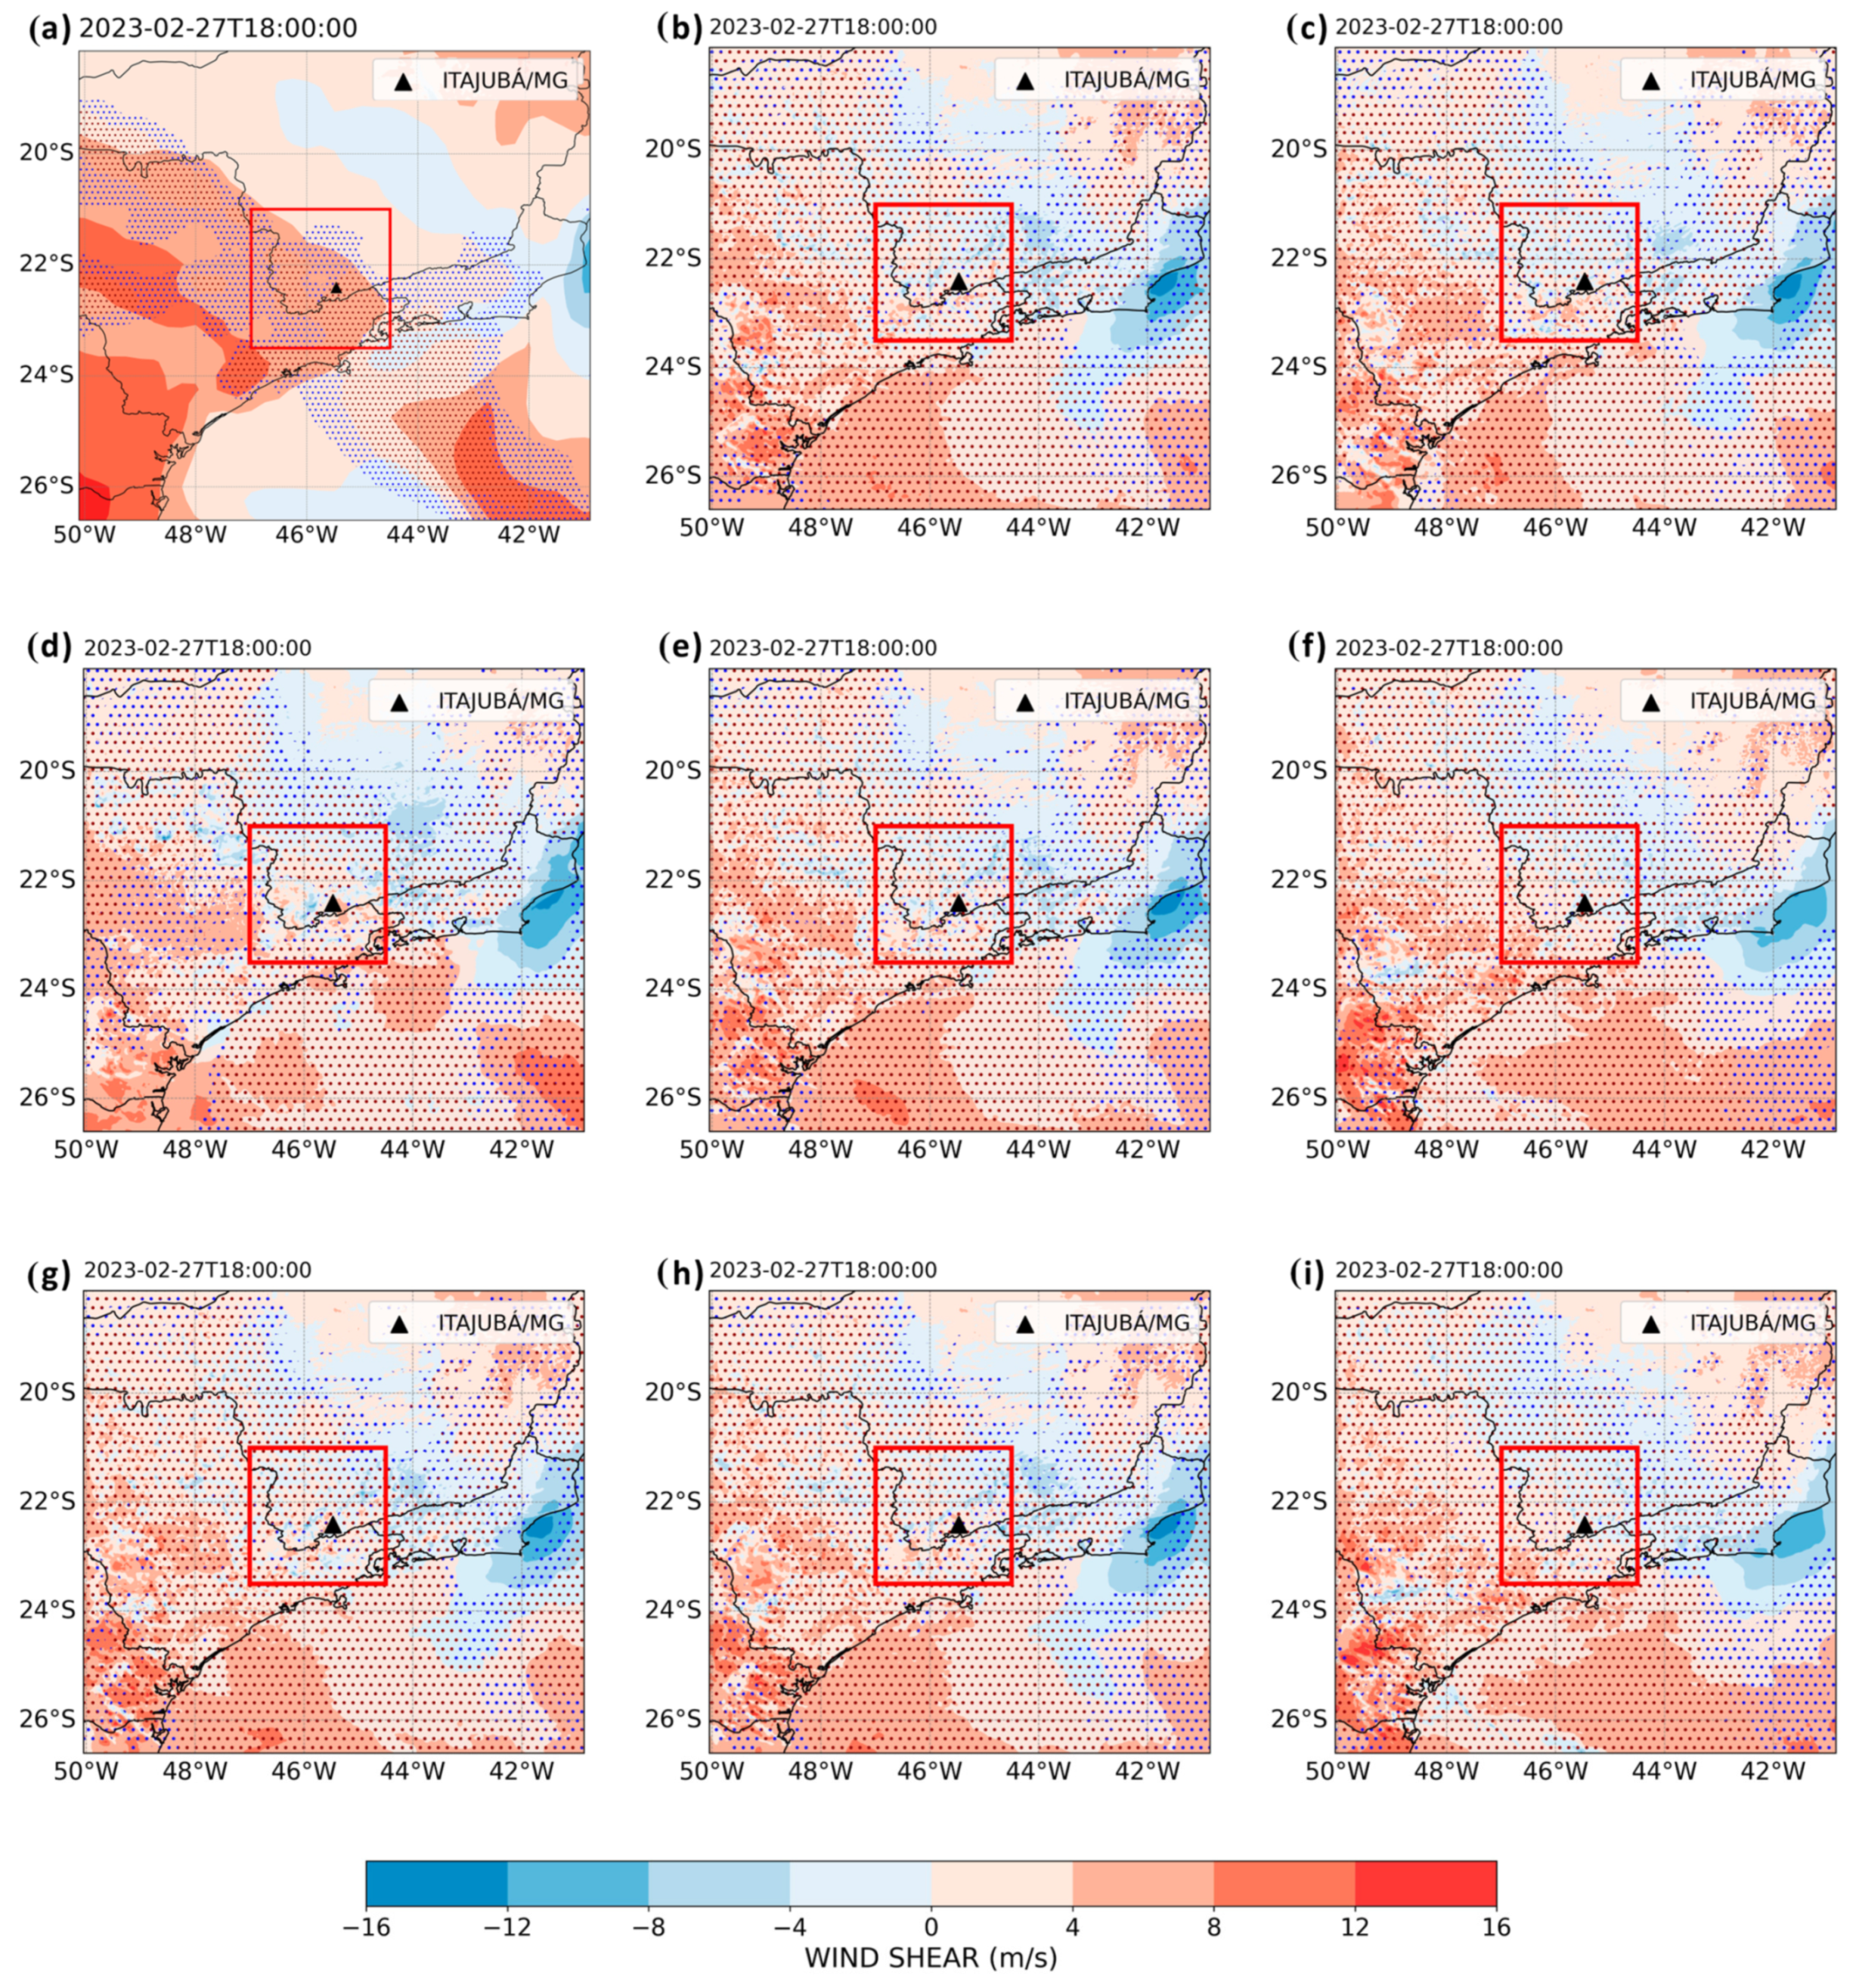
3.2.2. Atmospheric Instability Indices
4. Conclusions
Supplementary Materials
Author Contributions
Funding
Institutional Review Board Statement
Informed Consent Statement
Data Availability Statement
Acknowledgments
Conflicts of Interest
References
- IPCC. Climate Change—Synthesis Report; Contribution of Working Groups I, II and III to the Fifth Assessment Report of the Intergovernmental Panel on Climate Change; IPCC: Geneva, Switzerland, 2014. [Google Scholar]
- Cassalho, F.; Beskow, S.; Vargas, M.M.; Moura, M.M.D.; Ávila, L.F.; Mello, C.R.D. Hydrological Regionalization of Maximum Stream Flows Using an Approach Based on L-Moments. RBRH 2017, 22, e27. [Google Scholar] [CrossRef]
- Medeiros, R.M.D.; Sousa, E.P.D.; Gomes Filho, M.F. Ocorrência de Eventos Extremos de Precipitação em Campina Grande–Paraíba, Brasil. In Riscos Climáticos e Hidrológicos. 2014. Available online: https://www.riscos.pt/wp-content/uploads/2018/Outras_Pub/outros_livros/III_CIR/iii_cir_artigo074.pdf (accessed on 20 January 2024).
- Bourdeau-Brien, M.; Kryzanowski, L. The Impact of Natural Disasters on the Stock Returns and Volatilities of Local Firms. Q. Rev. Econ. Financ. 2017, 63, 259–270. [Google Scholar] [CrossRef]
- Reza, M. Urban Flood Modeling Using Hydrodynamic Models: A Case Study of Dhaka City. J. Hydrol. 2020, 590, 125448. [Google Scholar]
- Freitas, C.M.; Silva, D.R.X.; Sena, A.R.M.; Silva, E.L.; Sales, L.B.F.; Carvalho, M.L.; Costa, A.M. Natural Disasters and Health: An Analysis of the Situation in Brazil. Ciência Saúde Coletiva 2014, 19, 3645. [Google Scholar] [CrossRef]
- Hidalgo, J.; Baez, J. Impactos das Mudanças Climáticas nos Recursos Hídricos da América Latina. Rev. Bras. de Climatol. 2019, 15, 23–39. [Google Scholar]
- Henneman, A.; Thornby, K.A.; Rosario, N.; Latif, J. Evaluation of Pharmacy Resident Perceived Impact of Natural Disaster on Stress During Pharmacy Residency Training. Curr. Pharm. Teach. Learn. 2020, 12, 147–155. [Google Scholar] [CrossRef]
- Reichstein, M.; Bahn, M.; Ciais, P.; Frank, D.; Mahecha, M.D.; Seneviratne, S.I.; Wattenbach, M. Climate Extremes and the Carbon Cycle. Nature 2013, 500, 287–295. [Google Scholar] [CrossRef]
- Zilli, M.T.; Carvalho, L.M.; Liebmann, B.; Silva Dias, M.A.F. A Comprehensive Analysis of Trends in Extreme Precipitation over Southeastern Coast of Brazil. Int. J. Climatol. 2017, 37, 2269–2279. [Google Scholar] [CrossRef]
- Marrafon, V.H.; Reboita, M.S. Características da Precipitação na América do Sul Reveladas através de Índices Climáticos. Rev. Bras. Climatologia 2020, 26, 663. [Google Scholar] [CrossRef]
- Lagos-Zúñiga, M.; Balmaceda-Huarte, R.; Regoto, P.; Torrez, L.; Olmo, M.; Lyra, A.; Pareja-Quispe, D.; Bettolli, M. Extreme indices of temperature and precipitation in South America: Trends and intercomparison of regional climate models. Clim. Dyn. 2024, 62, 4541–4562. [Google Scholar] [CrossRef]
- Freitas, A.A.D.; Carvalho, V.S.B.; Reboita, M.S. Extreme Precipitation Events During the Wet Season of the South America Monsoon: A Historical Analysis over Three Major Brazilian Watersheds. Climate 2024, 12, 188. [Google Scholar] [CrossRef]
- Gu, G.; Adler, R.F. Precipitation Intensity–Duration–Frequency Curves for the United States Based on the Global Precipitation Measurement (GPM) Mission. J. Hydrometeorol. 2022, 23, 789–805. [Google Scholar]
- Bartolomei, F.R.; Ribeiro, J.G.M.; Reboita, M.S. Extreme Precipitation Events in Southeast Brazil: Summer 2021/2022. Rev. Bras. Geogr. Física 2023, 16, 2658–2676. [Google Scholar] [CrossRef]
- Pinto, T.A.C.; Mattos, E.V.; Reboita, M.S.; de Souza, D.O.; Oda, P.S.S.; Martins, F.B.; Biscaro, T.S.; Ferreira, G.W.d.S. Synoptic and Mesoscale Atmospheric Patterns That Triggered the Natural Disasters in the Metropolitan Region of Belo Horizonte, Brazil, in January 2020. Atmosphere 2025, 16, 102. [Google Scholar] [CrossRef]
- Alcântara, E.; Marengo, J.A.; Mantovani, J.; Londe, L.R.; San, R.L.Y.; Park, E.; Nobre, C. Deadly Disasters in Southeastern South America: Flash Floods and Landslides of February 2022 in Petrópolis, Rio de Janeiro. Nat. Hazards Earth Syst. Sci. 2023, 23, 1157–1175. [Google Scholar] [CrossRef]
- Blaudt, L.M.; Alvarenga, T.W.; Garin, Y. Disaster Occurred in Petrópolis in the Summer of 2022: General Aspects and Civil Defense Data. Geosciences 2023, 42, 59–71. [Google Scholar] [CrossRef]
- Oda, P.S.S.; Teixeira, D.L.S.; Pinto, T.A.C.; da Silva, F.P.; Riondet-Costa, D.R.T.; Mattos, E.V.; de Souza, D.O.; Bartolomei, F.; Reboita, M.; dos Santos, A.P.P. Disasters in Petrópolis, Brazil: Political, urban planning, and geometeorological factors that contributed to the event on February 15, 2022. Urban Clim. 2024, 54, 101849. [Google Scholar] [CrossRef]
- Marengo, J.A.; Cunha, A.P.; Seluchi, M.E.; Camarinha, P.I.; Dolif, G.; Sperling, V.B.; Alcântara, E.H.; Ramos, A.M.; Andrade, M.M.; Stabile, R.A.; et al. Heavy Rains and Hydrogeological Disasters on February 18–19, 2023, in the City of São Sebastião, São Paulo, Brazil: From Meteorological Causes to Early Warnings. Nat. Hazards 2024, 120, 7997–8024. [Google Scholar] [CrossRef]
- CEMADEN. Boletim de Impactos de Extremos de Origem Hidro-Geo-Climática. 2023. Available online: https://www.gov.br/cemaden/pt-br/assuntos/monitoramento/boletim-de-impactos (accessed on 29 June 2024).
- da Rocha, R.P.; Reboita, M.S.; Crespo, N.M. Analysis of the Extreme Precipitation Event in Rio Grande do Sul between April and May 2024. J. Health NPEPS 2024, 9, 1–10. [Google Scholar] [CrossRef]
- Reboita, M.S.; Mattos, E.V.; Capucin, B.C.; Souza, D.O.d.; Ferreira, G.W.d.S. A Multi-Scale Analysis of the Extreme Precipitation in Southern Brazil in April/May 2024. Atmosphere 2024, 15, 1123. [Google Scholar] [CrossRef]
- Reboita, M.S.; Marietto, D.M.G.; Souza, A.B.; Barbosa, M. Caracterização atmosférica quando da ocorrência de eventos extremos de chuva na região sul de Minas Gerais. Rev. Bras. Climatol. 2017, 21, 1–17. [Google Scholar] [CrossRef]
- Reboita, M.S.; Rodrigues, M.; Silva, L.F.; Alves, M.A. Aspectos climáticos do estado de Minas Gerais. Rev. Bras. Climatol. 2015, 17, 206–226. [Google Scholar] [CrossRef]
- Teodoro, T.A.; Reboita, M.S.; Llopart, M.; da Rocha, R.P.; Ashfaq, M. Climate change impacts on the South American monsoon system and its surface–atmosphere processes through RegCM4 CORDEX-CORE projections. Earth Syst. Environ. 2021, 5, 825–847. [Google Scholar] [CrossRef]
- Ferreira, G.W.S.; Reboita, M.S. A new look into the South America precipitation regimes: Observation and forecast. Atmosphere 2022, 13, 873. [Google Scholar] [CrossRef]
- Campos, B.; Carvalho, V.S.B.; Calheiros, A.J.P. Análise da ocorrência de eventos extremos de precipitação registrados no município de Itajubá, MG. In Anais do XIX Congresso Brasileiro de Meteorologia; Sociedade Brasileira de Meteorologia: João Pessoa, Brasil, 2011. [Google Scholar]
- Pinheiro, M.V. Avaliação técnica e histórica das enchentes em Itajubá–MG. Master’s Thesis, Universidade Federal de Itajubá, Itajubá, Brazil, 2005. [Google Scholar]
- G1. Universidade Federal de Itajubá Estima Prejuízo de R$ 3 Milhões com Chuva que Invadiu 70% do Campus. Available online: https://g1.globo.com/mg/sul-de-minas/noticia/2023/02/28/universidade-federal-de-itajuba-estima-prejuizo-de-r-3-milhoes-com-chuva-que-invadiu-70percent-do-campus.ghtml (accessed on 20 June 2023).
- Mohan, P.R.; Srinivas, C.V.; Yesubabu, V.; Baskaran, R.; Venkatraman, B. Simulation of a heavy rainfall event over Chennai in Southeast India using WRF: Sensitivity to microphysics parameterization. Atmos. Res. 2018, 210, 83–99. [Google Scholar] [CrossRef]
- Liu, D.; Yang, B.; Zhang, Y.; Qian, Y.; Huang, A.; Zhou, Y.; Zhang, L. Combined impacts of convection and microphysics parameterizations on the simulations of precipitation and cloud properties over Asia. Atmos. Res. 2018, 212, 172–185. [Google Scholar] [CrossRef]
- Campos, B.; Carvalho, V.S.B.; Mattos, E.V. Assessment of cloud microphysics and cumulus convection schemes to model extreme rainfall events over the Paraíba do Sul River Basin. Urban Clim. 2023, 51, 101618. [Google Scholar] [CrossRef]
- Solano-Farias, J.; Ojeda, M.G.-V.; Donaire-Montaño, D.; Rosa-Cánovas, J.J.; Castro-Díez, Y.; Esteban-Parra, M.J.; Gámiz-Fortis, S.R. Assessment of physical schemes for WRF model in convection-permitting mode over southern Iberian Peninsula. Atmos. Res. 2024, 299, 107175. [Google Scholar] [CrossRef]
- Souza, L.S.; da Silva, M.S.; de Almeida, V.A.; Moraes, N.O.; de Souza, E.P.; Senna, M.C.A.; Viana, L.Q. Evaluation of cumulus and microphysical parameterization schemes of the WRF model for precipitation prediction in the Paraíba do Sul River Basin, southeastern Brazil. Pure Appl. Geophys. 2024, 181, 679–700. [Google Scholar] [CrossRef]
- Faria, L.F.; Reboita, M.S.; Mattos, E.V.; Carvalho, V.S.B.; Ribeiro, J.G.M.; Capucin, B.C.; Drummond, A.; Santos, A.P.P. Synoptic and mesoscale analysis of a severe weather event in southern Brazil at the end of June 2020. Atmosphere 2023, 14, 486. [Google Scholar] [CrossRef]
- Gunwani, P.; Govardhan, G.; Jena, C.; Yadav, P.; Kulkarni, S.; Debnath, S.; Ghude, S.D. Sensitivity of WRF/Chem simulated PM2.5 to initial/boundary conditions and planetary boundary layer parameterization schemes over the Indo-Gangetic Plain. Environ. Monit. Assess. 2023, 195, 560. [Google Scholar] [CrossRef]
- Duzenli, E.; Yucel, I.; Yilmaz, M.T. Evaluation of the fully coupled WRF and WRF-Hydro modelling system initiated with satellite-based soil moisture data. Hydrol. Sci. J. 2024, 69, 691–708. [Google Scholar] [CrossRef]
- Prefeitura Municipal de Itajubá. Aspectos Físicos e Geográficos. Available online: https://itajuba.mg.gov.br/cidade/aspectos-fisicos-e-geograficos/ (accessed on 20 June 2023).
- Minuzzi, R.B.; Sediyama, G.C.; Barbosa, E.D.M.; Melo Júnior, J.C.F. Climatologia do comportamento do período chuvoso da região sudeste do Brasil. Rev. Bras. de Meteorol. 2007, 22, 338–344. [Google Scholar] [CrossRef]
- Siqueira, H.R.; Alves, G.D.F.; Guimarães, E.C. Comportamento da precipitação pluviométrica mensal do Estado de Minas Gerais: Análise espacial e temporal. Horiz. Científico 2007, 1, 1–15. [Google Scholar]
- Viola, M.R.; Mello, C.R.; Pinto, D.B.; Mello, J.M.; Ávila, L.F. Métodos de interpolação espacial para o mapeamento da precipitação pluvial. Rev. Bras. Eng. Agrícola E Ambient. 2010, 14, 970–978. [Google Scholar] [CrossRef]
- Souza, L.R.; Amanajás, J.C.; Silva, A.P.N.; Braga, C.C.; Correia, M.F. Determinação de padrões espaço-temporal e regiões homogêneas de precipitação pluvial no estado de Minas Gerais. Eng. Ambient. Pesqui. Tecnol. 2011, 8, 265–280. [Google Scholar]
- Mello, L.G.N.; Viola, M.R. Modelagem hidrológica aplicada à previsão de cheias em bacias urbanas. Rev. Bras. Recur. Hídricos 2013, 18, 215–226. [Google Scholar]
- Silva, L.J.; Reboita, M.S.; da Rocha, R.P. Relação da passagem de frentes frias na região sul de Minas Gerais com a precipitação e eventos de geada. Rev. Bras. Climatol. 2014, 14, 100–115. [Google Scholar] [CrossRef]
- Hersbach, H.; Bell, B.; Berrisford, P.; Hirahara, S.; Horányi, A.; Muñoz-Sabater, J.; Nicolas, J.; Peubey, C.; Radu, R.; Schepers, D.; et al. The ERA5 Global Reanalysis. Q. J. R. Meteorol. Soc. 2020, 146, 1999–2049. [Google Scholar] [CrossRef]
- NOAA. Global Data Assimilation System (GDAS) and Global Forecast System (GFS). 2025. Available online: https://www.ncei.noaa.gov/products/weather-climate-models/global-forecast (accessed on 10 January 2025).
- Rodriguez, C.A.M. Estratégias de Varredura para o Radar Meteorológico do CLA; Instituto de Aeronáutica e Espaço: São José dos Campos, Brazil, 2020. [Google Scholar]
- Houze, R.A. Cloud Dynamics; Academic Press: San Diego, CA, USA, 1993. [Google Scholar]
- Bringi, V.N.; Chandrasekar, V. Polarimetric Doppler Weather Radar: Principles and Applications; Cambridge University Press: Cambridge, UK, 2001. [Google Scholar]
- Steiner, M.; Houze, R.A.; Yuter, S.E. Climatological characterization of three-dimensional storm structure from operational radar and rain gauge data. J. Appl. Meteorol. 1995, 34, 1978–2007. [Google Scholar] [CrossRef]
- Rozante, J.R.; Moreira, D.S.; Gonçalves, L.G.G.; Carvalho, L.M.V. A technique for merging satellite and conventional rainfall observations: Application over South America. J. Hydrometeorol. 2010, 11, 1140–1153. [Google Scholar] [CrossRef]
- Huffman, G.J.; Bolvin, D.T.; Joyce, R.; Kelley, O.A.; Nelkin, E.J.; Tan, J.; Watters, D.C.; West, B. Integrated Multi-satellite Retrievals for GPM (IMERG) Technical Documentation; NASA Goddard Space Flight Center: Greenbelt, MD, USA, 2023. Available online: https://gpm.nasa.gov/sites/default/files/2023-07/IMERG_TechnicalDocumentation_final_230713.pdf (accessed on 29 January 2024).
- Funk, C.; Peterson, P.; Landsfeld, M.; Pedreros, D.; Verdin, J.; Shukla, S.; Husak, G.; Rowland, J.; Harrison, L.; Hoell, A.; et al. The climate hazards infrared precipitation with stations—A new environmental record for monitoring extremes. Sci. Data 2015, 2, 150066. [Google Scholar] [CrossRef] [PubMed]
- Skamarock, W.C. A Description of the Advanced Research WRF Version 4; NCAR Technical Note NCAR/TN-556+STR; National Center for Atmospheric Research: Boulder, CO, USA, 2019. [Google Scholar]
- Skamarock, W.C.; Klemp, J.B. A Time-Split Nonhydrostatic Atmospheric Model for Weather Research and Forecasting Applications. J. Comput. Phys. 2008, 227, 3465–3485. [Google Scholar] [CrossRef]
- Araújo, A.A.; Garcia, D.W.; Monteiro, J.R.; Miguel, T.V.; Campos, B.; Carvalho, V.S.B.; Reboita, M.S. Avaliação do modelo WRF na simulação operacional de um evento de frente fria no sudeste do Brasil. Rev. Bras. Geogr. Física 2023, 16, 805–817. [Google Scholar] [CrossRef]
- Garcia, D.W.; Reboita, M.S.; Carvalho, V.S.B. Evaluation of WRF Performance in Simulating an Extreme Precipitation Event Over the South of Minas Gerais, Brazil. Atmosphere 2023, 14, 1276. [Google Scholar] [CrossRef]
- Campos, B.; Reboita, M.S.; Carvalho, V.S.B.; Dias, C.G. Circulações Locais Induzidas pela Topografia no Vale do Paraíba e na Serra da Mantiqueira: Um estudo de caso para o período entre os dias 16 e 22 de agosto de 2010. Rev. Bras. Geogr. Física 2016, 9, 753–765. [Google Scholar] [CrossRef]
- Freitas, E.D.; Rozoff, C.M.; Cotton, W.R.; Dias, P.L.S. Interactions of an urban heat island and sea-breeze circulations during winter over the metropolitan area of São Paulo, Brazil. Bound.-Layer Meteorol. 2007, 122, 43–65. [Google Scholar] [CrossRef]
- Grell, G.A.; Freitas, S.R.; Stuefer, M.; Fast, J.D. Inclusion of Biomass Burning in WRF-Chem: Impact of Wildfires on Weather Forecasts. Atmos. Chem. Phys. 2014, 14, 527–552. [Google Scholar] [CrossRef]
- Hong, S.Y.; Dudhia, J.; Chen, S.H. A Revised Approach to Ice Microphysical Processes for the Bulk Parameterization of Cloud and Precipitation. Mon. Weather Rev. 2004, 132, 103–120. [Google Scholar] [CrossRef]
- Hong, S.-Y.; Lim, J.-O.J. The WRF Single-Moment 6-Class Microphysics Scheme (WSM6). J. Korean Meteorol. Soc. 2006, 42, 129–151. [Google Scholar]
- Jiménez, P.A.; Dudhia, J.; González-Rouco, J.F.; Navarro, J.; Montávez, J.P.; García-Bustamante, E. A Revised Scheme for the WRF Surface Layer Formulation. Mon. Weather Rev. 2012, 140, 898–918. [Google Scholar] [CrossRef]
- Tewari, M.; Chen, F.; Wang, W.; Dudhia, J.; LeMone, M.A.; Mitchell, K.; Ek, M.; Gayno, G.; Wegiel, J.; Cuenca, R.H. Implementation and Verification of the Unified Noah Land Surface Model in the WRF Model. In Proceedings of the 20th Conference on Weather Analysis and Forecasting/16th Conference on Numerical Weather Prediction, Seattle, WA, USA, 12–16 January 2004; American Meteorological Society: Boston, MA, USA, 2004. [Google Scholar]
- Dudhia, J. Numerical Study of Convection Observed During the Winter Monsoon Experiment Using a Mesoscale Two-Dimensional Model. J. Atmos. Sci. 1989, 46, 3077–3107. [Google Scholar] [CrossRef]
- Mlawer, E.J.; Taubman, S.J.; Brown, P.D.; Iacono, M.J.; Clough, S.A. Radiative Transfer for Inhomogeneous Atmospheres: RRTM, a Validated Correlated-k Model for the Longwave. J. Geophys. Res. Atmos. 1997, 102, 16663–16682. [Google Scholar] [CrossRef]
- Lim, J.O.J.; Hong, S.Y. Development of an Effective Double-Moment Cloud Microphysics Scheme with Prognostic Cloud Condensation Nuclei (CCN). J. Atmos. Sci. 2010, 67, 1308–1315. [Google Scholar] [CrossRef]
- Lin, Y.L.; Farley, R.D.; Orville, H.D. Bulk Parameterization of the Snow Field in a Cloud Model. J. Clim. Appl. Meteorol. 1983, 22, 1065–1092. [Google Scholar] [CrossRef]
- Dudhia, J.; Gill, D.; Manning, K.W.; Wang, W.; Bruyere, C.L. PSU/NCAR Mesoscale Modeling System Tutorial Class Notes and User’s Guide; National Center for Atmospheric Research: Boulder, CO, USA, 2008. [Google Scholar]
- Jackson, B.M.; Kavetski, D.; Franks, S.W. Bayesian Estimation of Hydrological Model Parameters and Uncertainty. Water Resour. Res. 2019, 55, 10866–10881. [Google Scholar] [CrossRef]
- Vasquez, M.C. Severe Storm Forecasting; National Weather Service: Silver Spring, MD, USA, 2017. [Google Scholar]
- George, J.J. Weather Forecasting for Aeronautics; Academic Press: New York, NY, USA, 1960. [Google Scholar]
- Miller, R.C. Notes on Analysis and Severe-Storm Forecasting Procedures of the Air Force Global Weather Central; AWS Tech. Rep. 200; Air Weather Service (MAC), USAF: Scott AFB, IL, USA, 1972. [Google Scholar]
- Delgado, R.C.; Santos, E.O. Precipitation. In Basic Meteorology Handbook—IF 111—2013—DCA/IF/UFRRJ; 2013; p. 245. Available online: https://doceru.com/doc/n5c1n85 (accessed on 26 June 2024).
- Doswell, C.A., III. The distinction between large-scale and mesoscale contribution to severe convection: A case study example. Weather. Forecast. 1987, 2, 3–16. [Google Scholar] [CrossRef]
- Wallace, J.M.; Hobbs, P.V. Atmospheric Science: An Introductory Survey; Academic Press: San Diego, CA, USA, 2006. [Google Scholar]
- Ahrens, C.D.; Henson, R. Meteorology Today: An Introduction to Weather, Climate, and the Environment; Cengage Learning: Boston, MA, USA, 2015. [Google Scholar]
- Weisman, M.L.; Klemp, J.B. The Dependence of Numerically Simulated Convective Storms on Vertical Wind Shear and Buoyancy. Mon. Weather Rev. 1982, 110, 504–520. [Google Scholar] [CrossRef]
- Campos, B. Sensibilidade de Parametrizações de Convecção Cumulus e Microfísica de Nuvens em Eventos Extremos de Precipitação na Bacia do Rio Paraíba do Sul. Master’s Thesis, Programa de Pós-Graduação em Meio Ambiente e Recursos Hídricos, Universidade Federal de Itajubá (UNIFEI), Itajubá, Brazil, 2022. [Google Scholar]
- Jeworrek, J.; Barthlott, C.; Hoose, C. The Influence of Orography on Precipitation Patterns: Idealized Simulations and Observations. Atmos. Res. 2021, 256, 105561. [Google Scholar] [CrossRef]
- Yavuz, V. Variations in Air Pollutant Concentrations on Dry and Wet Days with Varying Precipitation Intensity. Atmosphere 2024, 15, 896. [Google Scholar] [CrossRef]
- NOAA. Severe Weather Event Guide. National Oceanic and Atmospheric Administration. 2025. Available online: https://www.noaa.gov/severe-weather-guide (accessed on 20 April 2025).
- Henry, R. Thunderstorm Forecasting Using Stability Indices. Weatherwise 1987, 40, 94–100. [Google Scholar]
- Wu, J.; Guo, J.; Yun, Y.; Yang, R.; Guo, X.; Meng, D.; Chen, T. Can ERA5 reanalysis data characterize the pre-storm environment? Atmos. Res. 2024, 297, 107108. [Google Scholar] [CrossRef]
- Weisman, M.L.; Klemp, J.B. The structure and classification of numerically simulated convective stormsin directionally varying wind shears. Mon. Weather Rev. 1984, 112, 2479–2498. [Google Scholar] [CrossRef]
- Markowski, P.; Richardson, Y. Mesoscale Meteorology in Midlatitudes; Wiley-Blackwell: Chichester, UK, 2010. [Google Scholar]
- Joe, P.; Dance, S.; Lakshmanan, V.; Heizenreder, D.; James, P.; Lang, P.; Hengstebeck, T.; Feng, Y.; Li, P.W.; Yeung, H.-Y.; et al. Automated processing of doppler radar data for severe weather warnings. In Doppler Radar Observations: Weather Radar, Wind Profiler, Ionospheric Radar, and Other Advanced Applications; InTech: Houston, TX, USA, 2012; pp. 33–74. [Google Scholar]
- Pucik, T.; Groenemeijer, P.; Tijssen, L.; Holzer, A.M. The Environments of Severe Thunderstorms over Europe. Mon. Weather Rev. 2021, 149, 1793–1811. [Google Scholar]


| Parameter | Outer Domain (D01) | Inner Domain (D02) |
|---|---|---|
| Points in X-direction | 190 | 153 |
| Points in Y-direction | 240 | 181 |
| Points in Z-direction | 42 | 42 |
| Horizontal Resolution | 12 km | 3 km |
| Timestep | 60 | 15 |
| Central Latitude | 22.4255° S | |
| Central Longitude | 45.4527° W | |
| Cumulus Convection | Grell–Freitas [61] This option is turned off for D-2 grid. | |
| Microphysics | WSM3 [62] | |
| Planetary Boundary Layer | Yonsei University Scheme [63] | |
| Surface Layer | Revised-MM5 [64] | |
| Land-Surface | Noah-LSM [65] | |
| Shortwave Radiation | MM5 [66] | |
| Longwave Radiation | RRTM [67] | |
| Experiments | Description |
|---|---|
| WSM3 | WRF CEPreMG control configuration, using the WSM3 microphysics scheme, GFS initial and boundary conditions, SST, and climatological soil moisture. |
| WSM6 | Change in the microphysical parameter, using the WSM6 microphysics scheme, which is a system that has six classes instead of three, used by CEPreMG. |
| WDM6 | Change in microphysical parameter, using WDM6 microphysics scheme, which takes into account mass and particle quantity. |
| GDAS | The initial and boundary condition is GDAS. |
| ERA5 | The initial and boundary condition is ERA5. |
| SST | Change in climatological SST, the standard used in the model, by weekly SST. The same is used by ERA5 data. |
| SOIL | Soil moisture changes with climatological data, standard used in the model, by weekly soil moisture. Same used by GDAS data |
| ERA5_SST | Simulation with the best results obtained from previous simulations. In this case, the initial and boundary conditions data and the SST data were changed from climatological to weekly. |
| Experiments | KGE | R | Bias | |
|---|---|---|---|---|
| Microphysics | WSM3 | −0.34 | 0.14 | −31.3 |
| WSM6 | −0.27 | 0.32 | −37.6 | |
| WDM6 | −0.07 | 0.15 | −35.9 | |
| Initial and boundary conditions | GDAS | −0.46 | 0.15 | −39.0 |
| ERA5 | −0.67 | −0.03 | −42.1 | |
| Boundary conditions | SST | −0.26 | 0.11 | −41.3 |
| SOIL | −0.49 | 0.01 | −37.7 | |
| ERA5_SST | −0.57 | 0.19 | −43.3 |
| Experiments | CAPE | Wind Shear | K | TT | Daily Rainfall |
|---|---|---|---|---|---|
| ERA5 | 1023.2 | 4.82 | 32.9 | 45.2 | 5.9 |
| WSM3 | 537.0 | 0.64 | 33.8 | 46.8 | 14.1 |
| WSM6 | 1387.4 | 0.20 | 39.9 | 49.2 | 7.7 |
| WDM6 | 254.5 | 2.23 | 40.2 | 47.7 | 9.4 |
| GDAS | 163.5 | 1.66 | 35.6 | 47.3 | 6.3 |
| ERA5 (WRF) | 1554.0 | 0.64 | 36.5 | 47.3 | 3.3 |
| SST | 1033.1 | 0.57 | 36.4 | 47.8 | 4.1 |
| SOIL | 439.2 | 0.02 | 39.1 | 48.1 | 7.7 |
| ERA_SST | 1994.5 | 0.68 | 37.5 | 48.3 | 2.0 |
Disclaimer/Publisher’s Note: The statements, opinions and data contained in all publications are solely those of the individual author(s) and contributor(s) and not of MDPI and/or the editor(s). MDPI and/or the editor(s) disclaim responsibility for any injury to people or property resulting from any ideas, methods, instructions or products referred to in the content. |
© 2025 by the authors. Licensee MDPI, Basel, Switzerland. This article is an open access article distributed under the terms and conditions of the Creative Commons Attribution (CC BY) license (https://creativecommons.org/licenses/by/4.0/).
Share and Cite
Garcia, D.W.; Reboita, M.S.; Carvalho, V.S.B. Sensitivity Analysis and Performance Evaluation of the WRF Model in Forecasting an Extreme Rainfall Event in Itajubá, Southeast Brazil. Atmosphere 2025, 16, 548. https://doi.org/10.3390/atmos16050548
Garcia DW, Reboita MS, Carvalho VSB. Sensitivity Analysis and Performance Evaluation of the WRF Model in Forecasting an Extreme Rainfall Event in Itajubá, Southeast Brazil. Atmosphere. 2025; 16(5):548. https://doi.org/10.3390/atmos16050548
Chicago/Turabian StyleGarcia, Denis William, Michelle Simões Reboita, and Vanessa Silveira Barreto Carvalho. 2025. "Sensitivity Analysis and Performance Evaluation of the WRF Model in Forecasting an Extreme Rainfall Event in Itajubá, Southeast Brazil" Atmosphere 16, no. 5: 548. https://doi.org/10.3390/atmos16050548
APA StyleGarcia, D. W., Reboita, M. S., & Carvalho, V. S. B. (2025). Sensitivity Analysis and Performance Evaluation of the WRF Model in Forecasting an Extreme Rainfall Event in Itajubá, Southeast Brazil. Atmosphere, 16(5), 548. https://doi.org/10.3390/atmos16050548