
Spatiotemporal Patterns and Regional Transport Contributions of Air Pollutants in Wuxi City


Abstract
1. Introduction
2. Data and Methodology
2.1. Site and Data Description
2.2. Methods
3. Results and Discussion
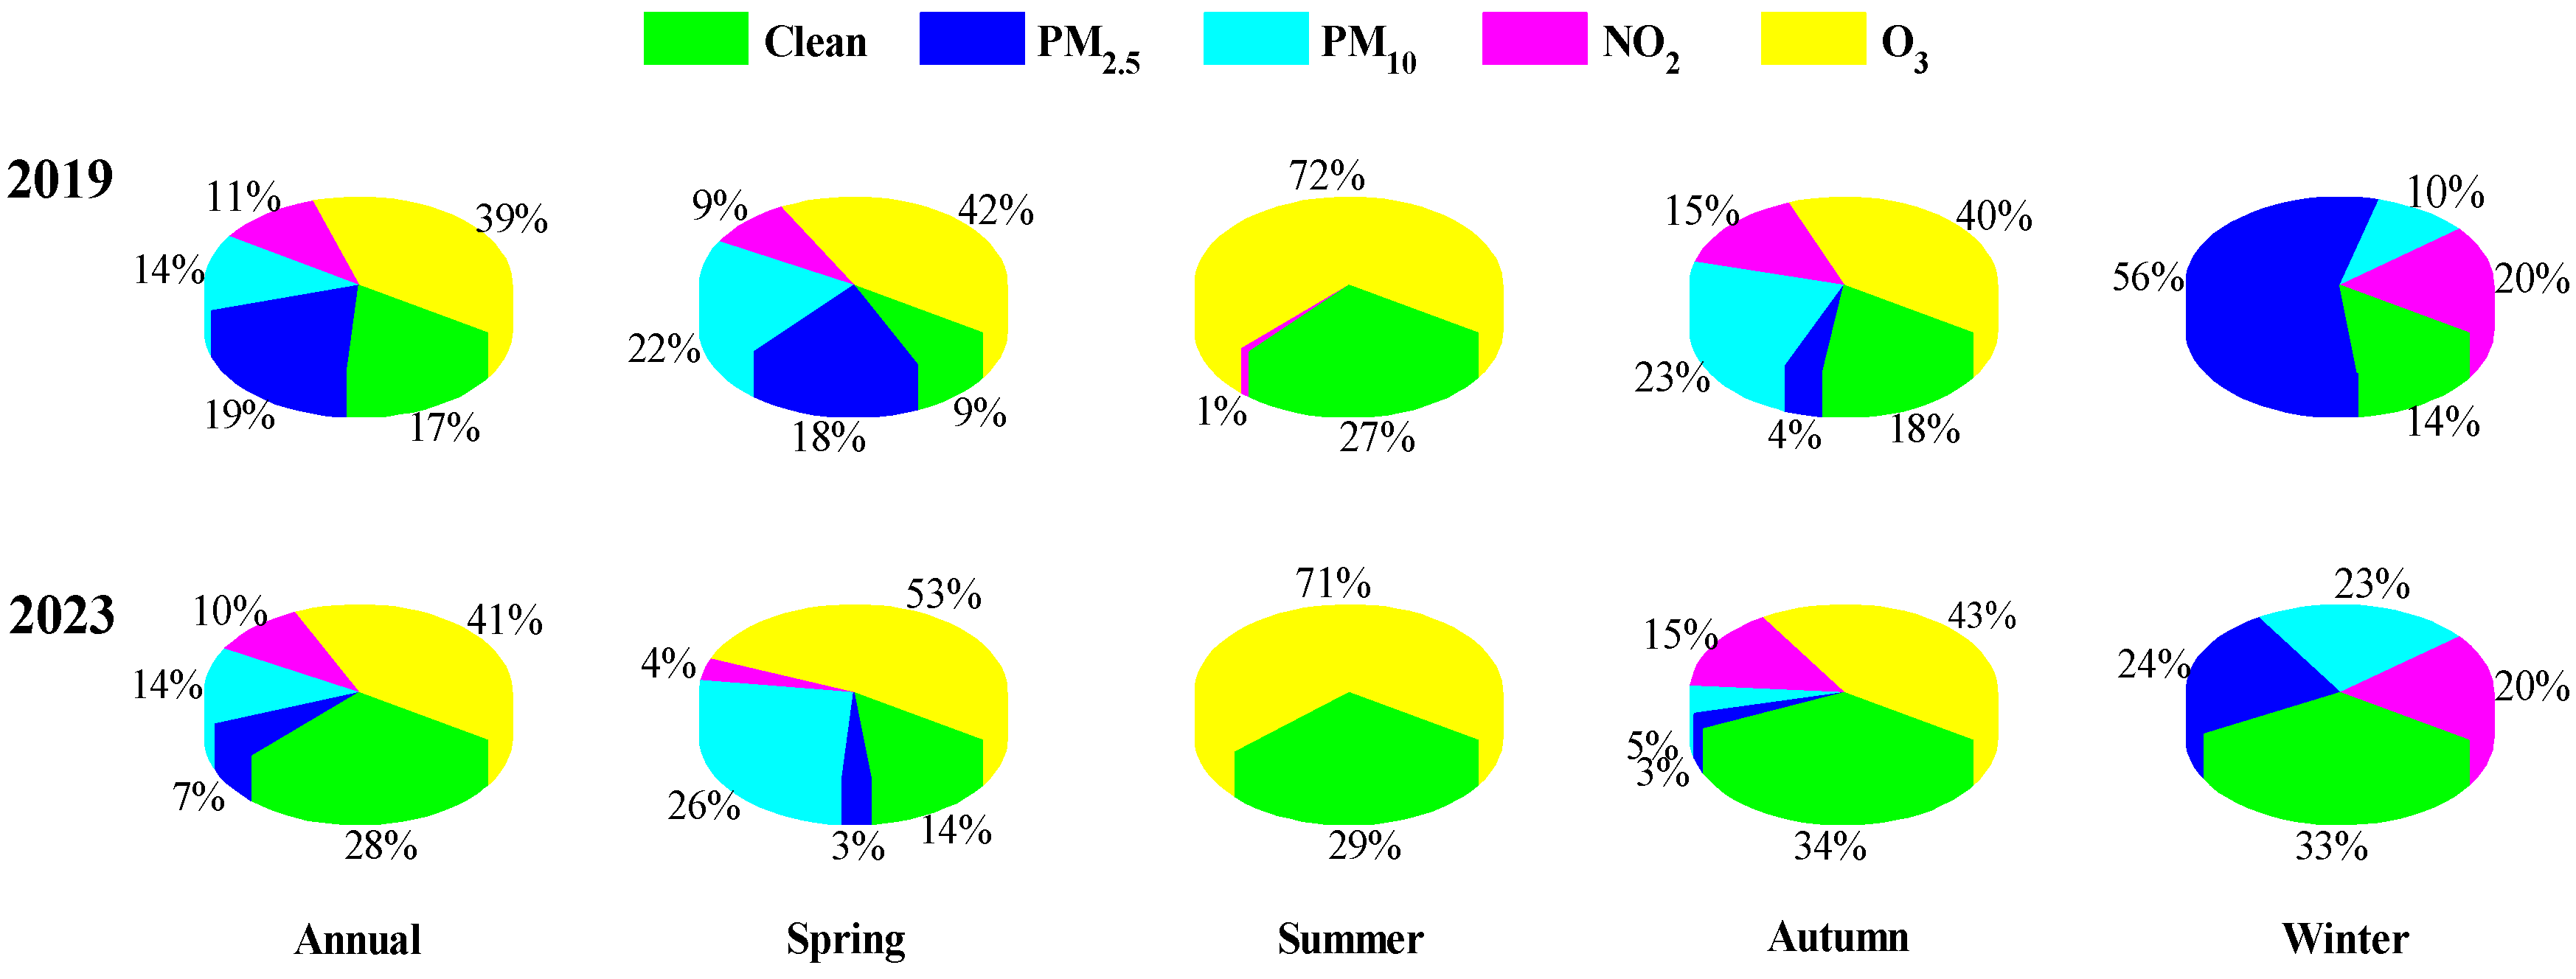
3.1. Annual Variation
3.2. Temporal Variations
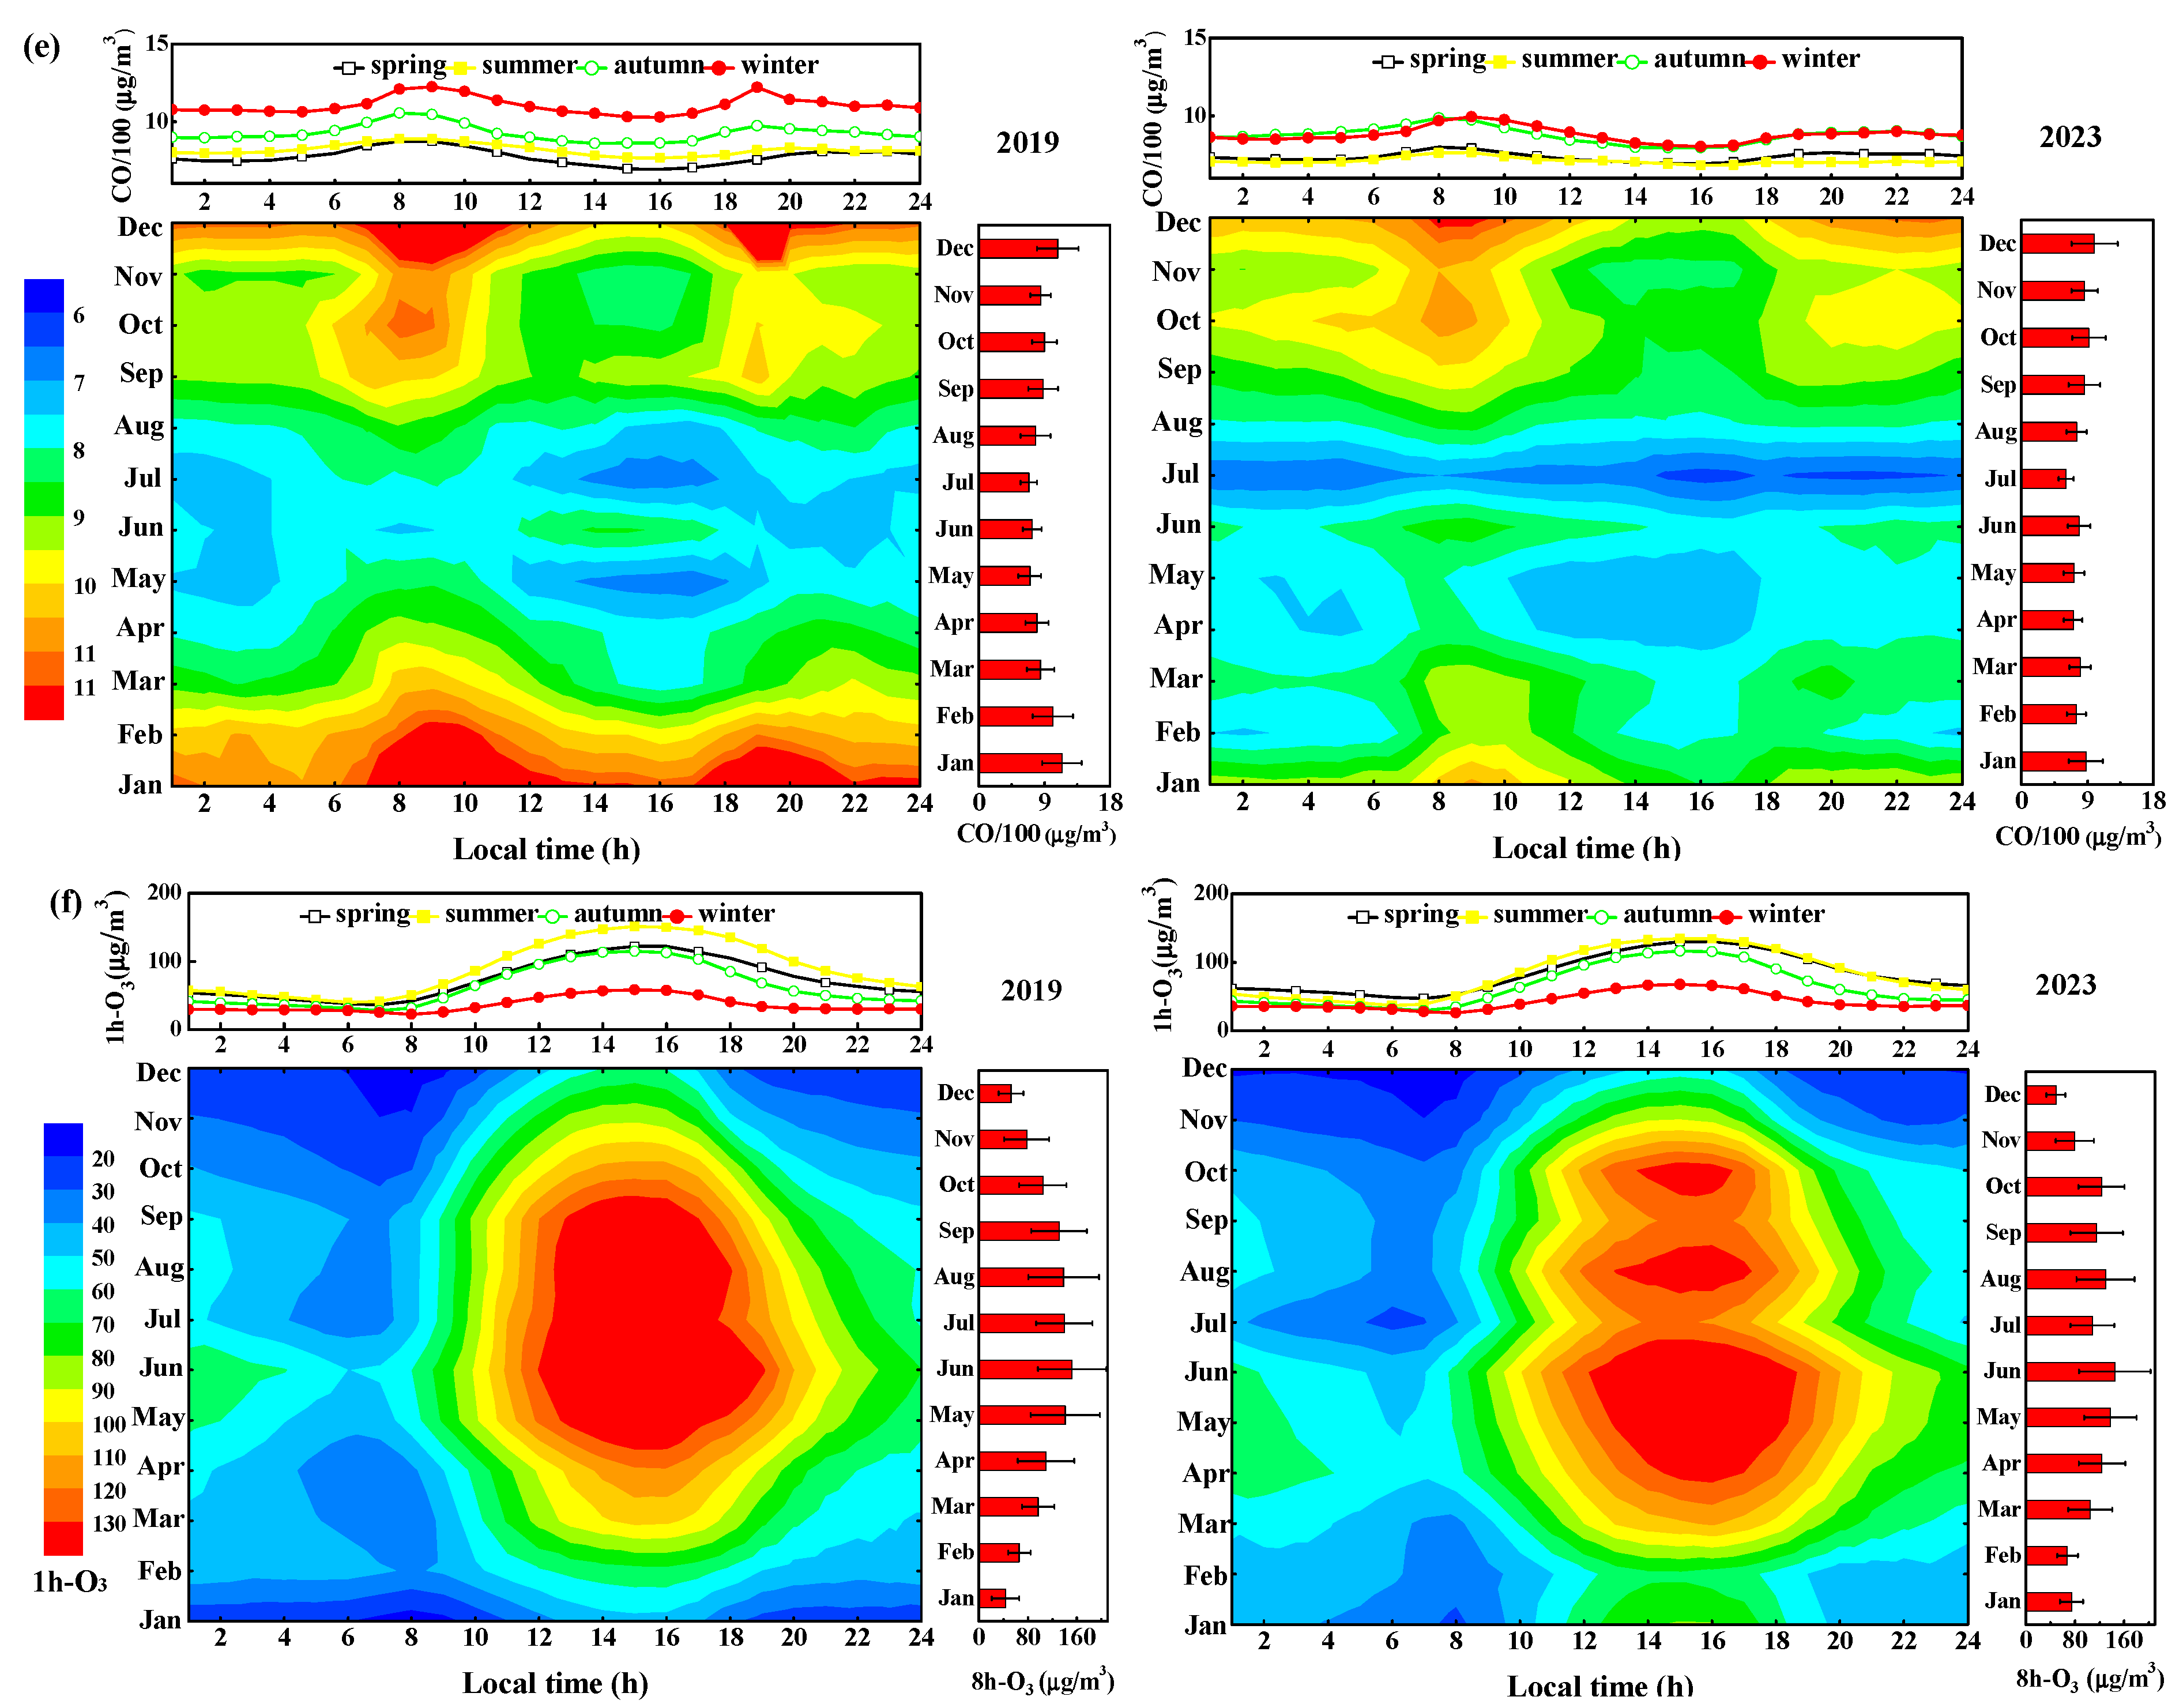
3.2.1. Seasonal and Diurnal Variation
3.2.2. Monthly Variation
3.3. Spatial Distribution
3.4. Correlations Between Air Pollutants and Meteorological Factors
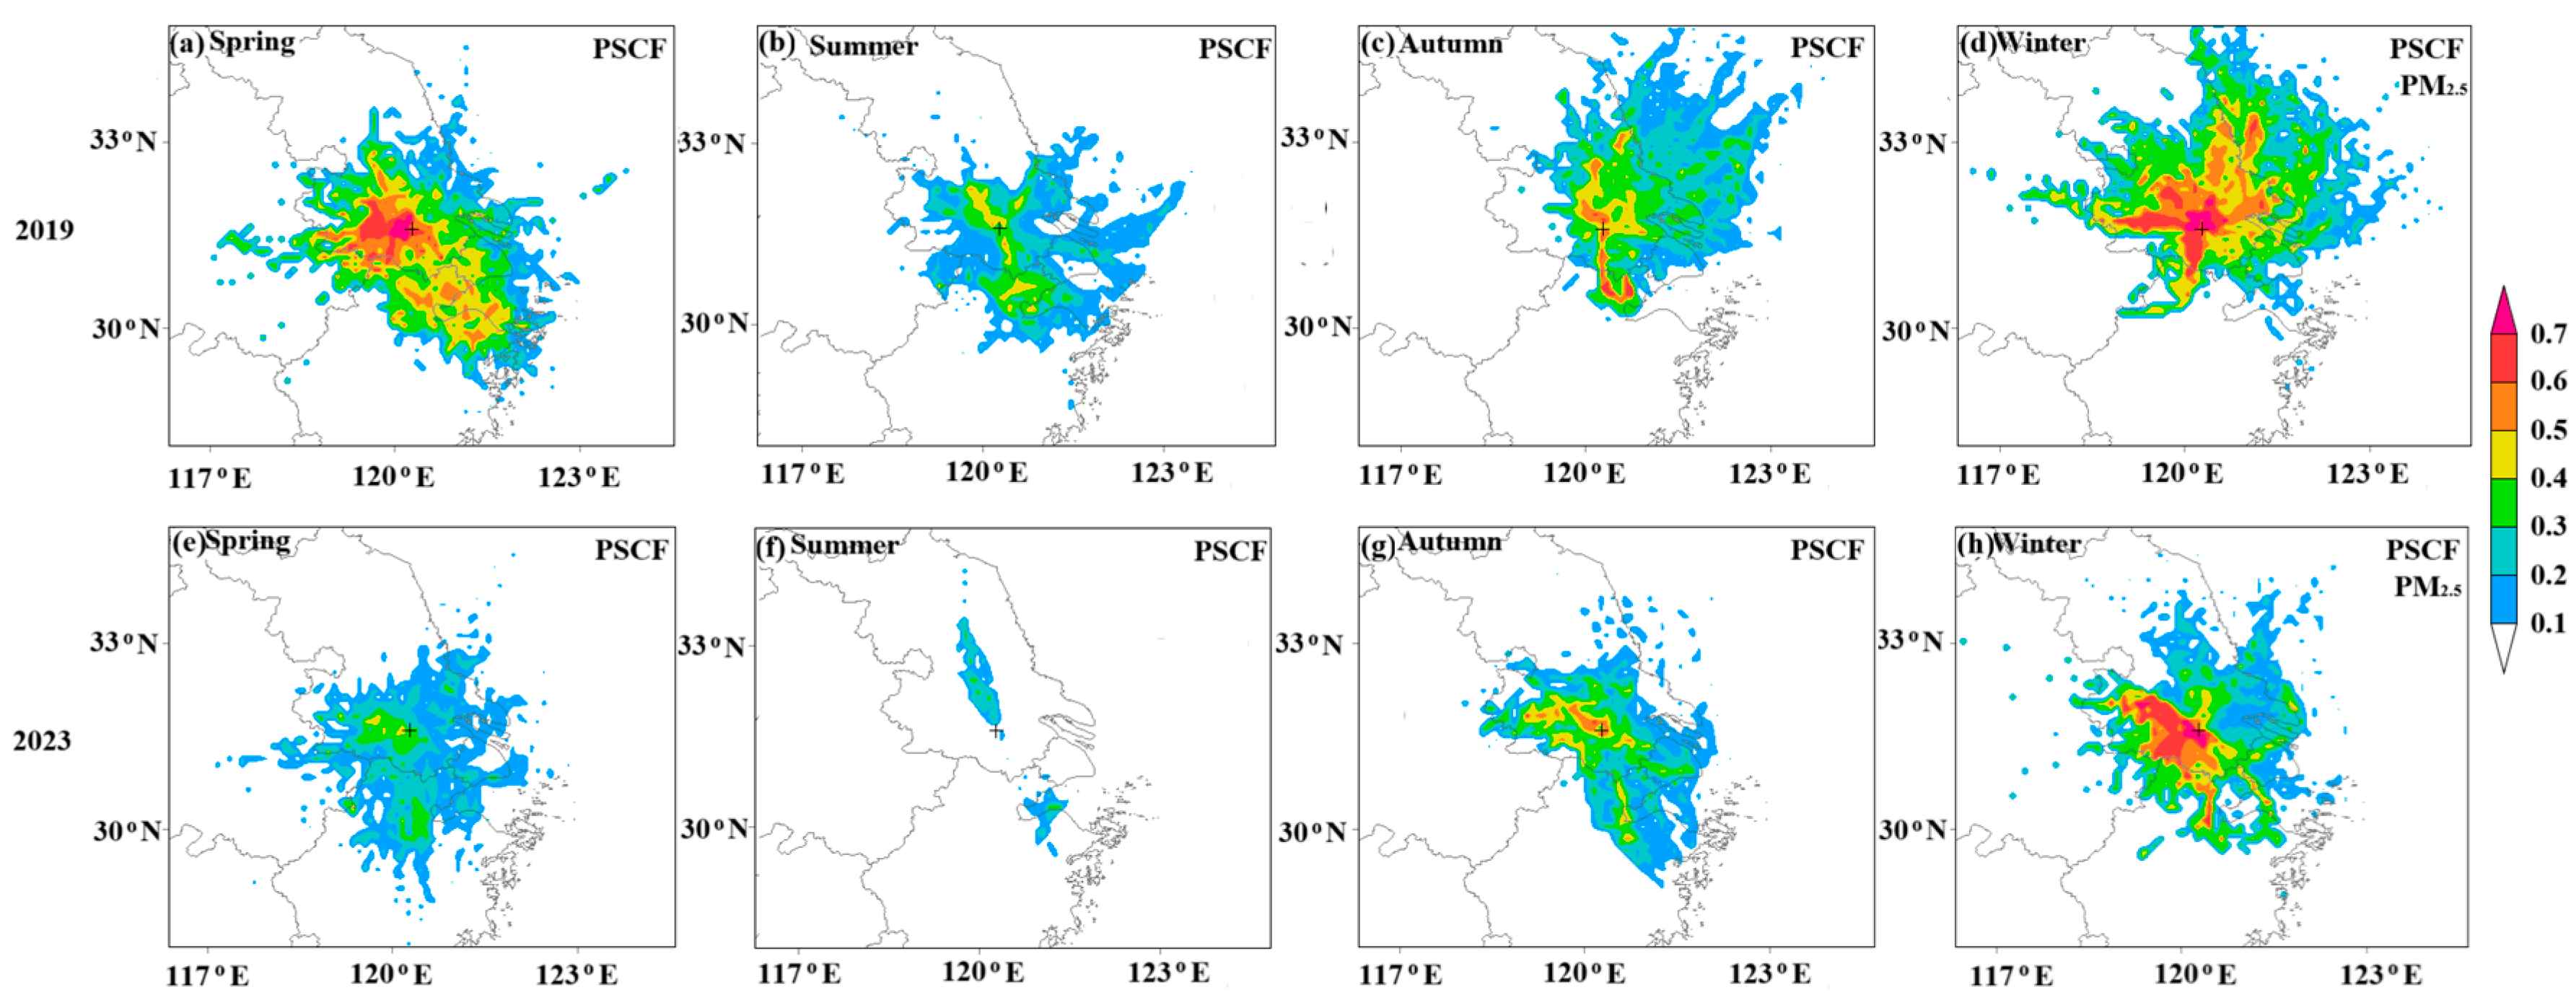
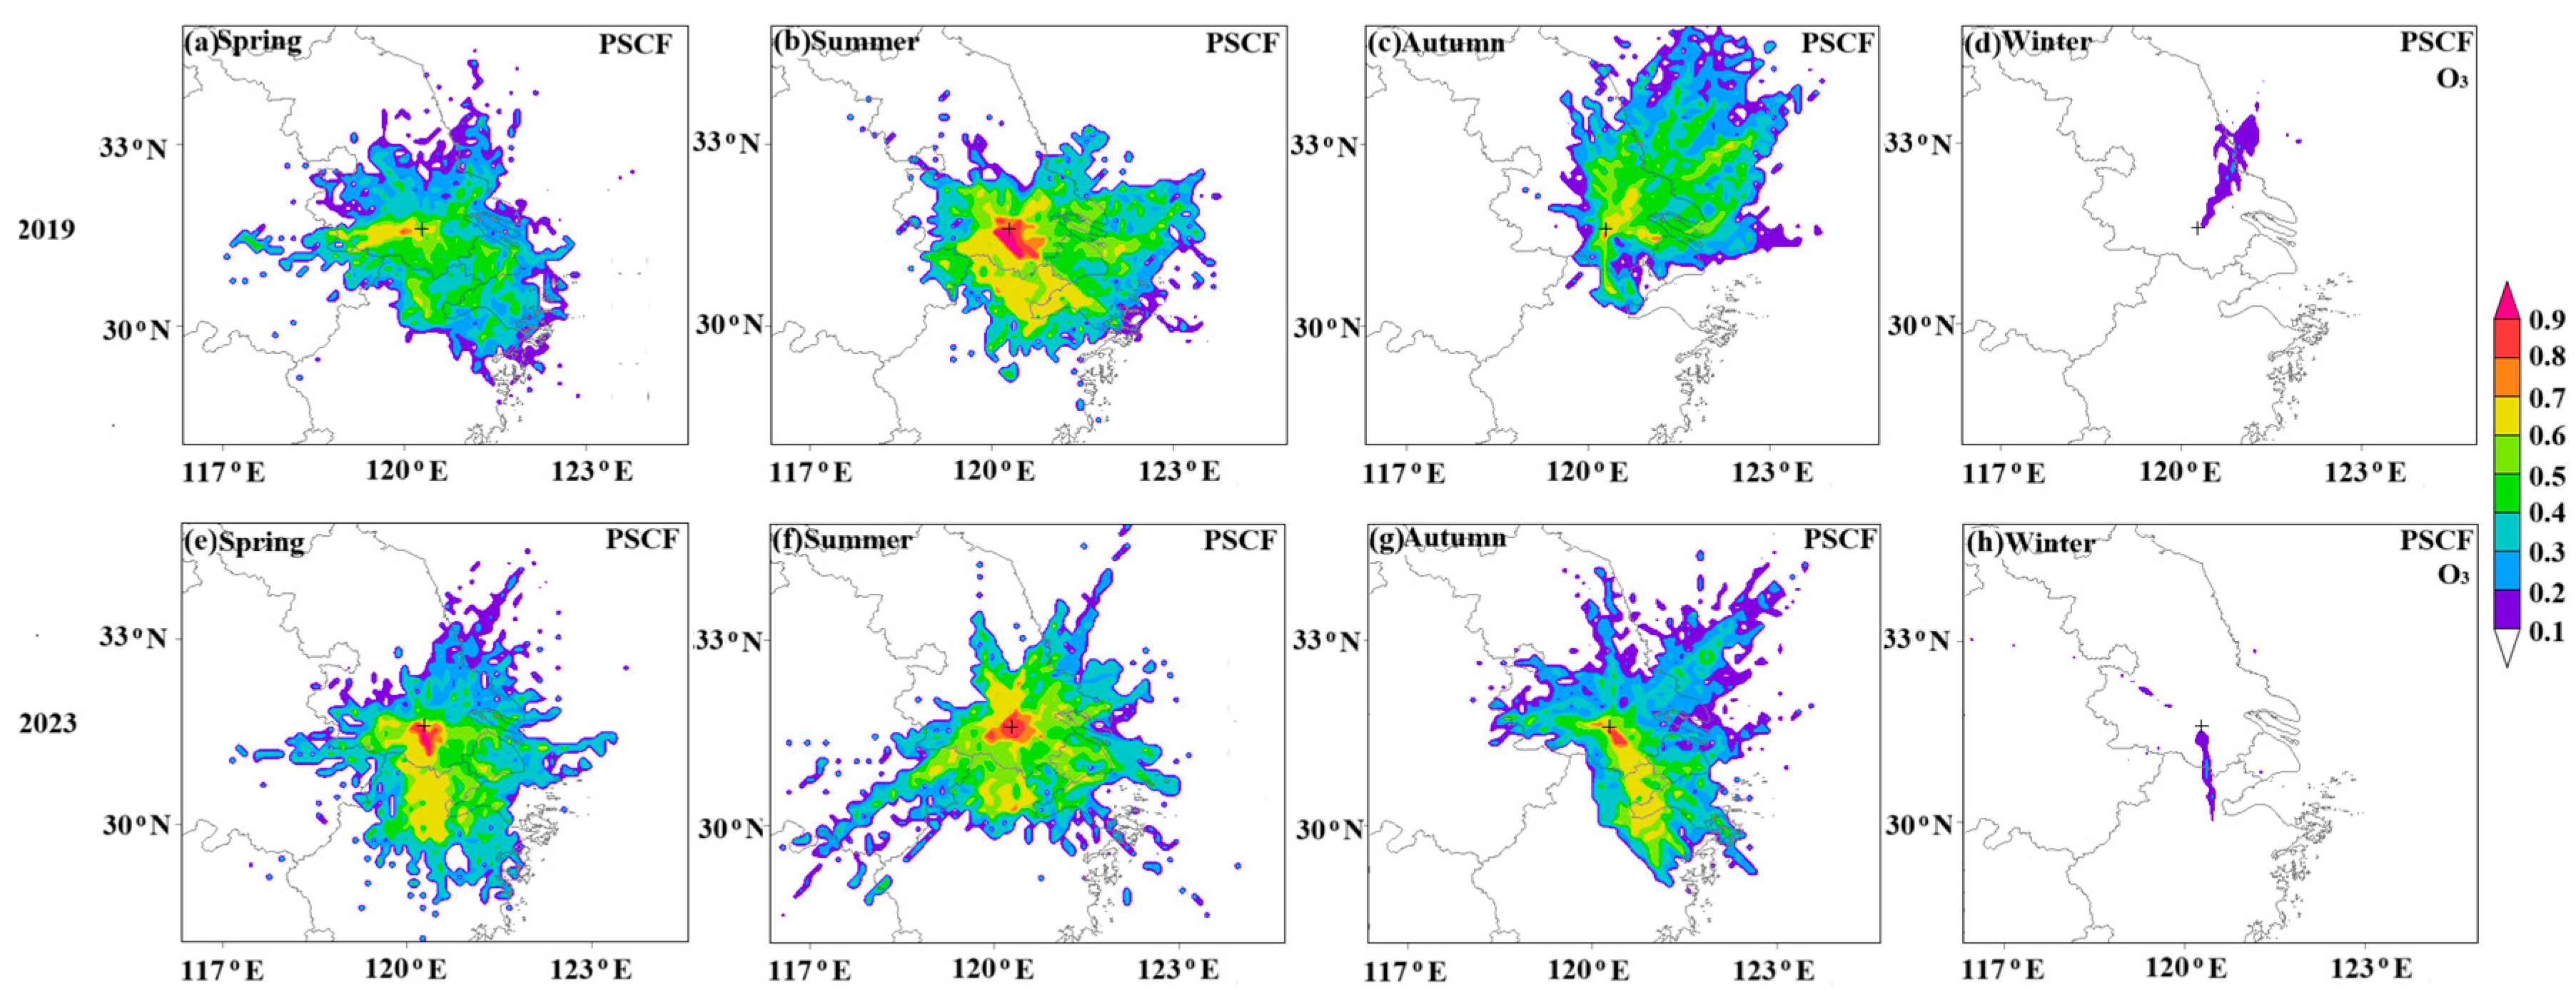
3.5. Pollutants Source Analysis Based on PSCF and CWT
4. Conclusions
- (1)
- The exceedances of O3 and PM concentrations occurred with significantly higher frequency compared to other pollutants, marking them as the dominant contaminants. SO2 and CO concentrations never exceeded national standards throughout the study period. Compared with 2019, a 26% reduction in PM2.5 concentrations was observed in 2023, decreasing from 39.6 μg/m3 to 29.3 μg/m3. However, 8h O3 pollution exhibited no significant improvement, remaining at persistently elevated levels (104.6 μg/m3 in 2019 vs. 105.0 μg/m3 in 2023).
- (2)
- The diurnal profiles of criteria pollutants, except O3, exhibited consistent bimodal concentration patterns. Winter demonstrated significantly greater amplitude in mass concentration fluctuations relative to other seasons. NO2 concentrations peaked during morning and evening traffic rush hours, consistent with vehicular emission patterns. PM exhibited delayed peak occurrences, lagging NO2 by 1–2 h, suggesting secondary aerosol formation processes. SO2 displayed a unimodal distribution. O3 also demonstrated a distinct single-peak diurnal profile, reaching maximal values during mid-afternoon, with summer exhibiting highest peak amplitudes compared to other seasons.
- (3)
- From the spatial distribution pattern of air pollutants, it can be observed that in Wuxi’s central urban area, the mass concentrations of PM2.5, PM10, and NO2 are relatively high, while O3 concentrations are relatively low. In contrast, monitoring sites near the northern shore of Taihu Lake exhibit lower PM concentrations but higher O3 levels. Additionally, O3 demonstrates a weekend effect.
- (4)
- Correlation analysis indicates that PM concentrations exhibit significant correlations with other air pollutants. Temperature demonstrated moderate negative correlations with PM and NO2, while exhibiting a strong positive correlation with O3. Both wind speed and precipitation showed weak to moderate negative correlations with pollutant concentrations. Relative humidity displayed a particularly strong negative correlation with SO2, along with moderate negative correlations with PM10 and O3.
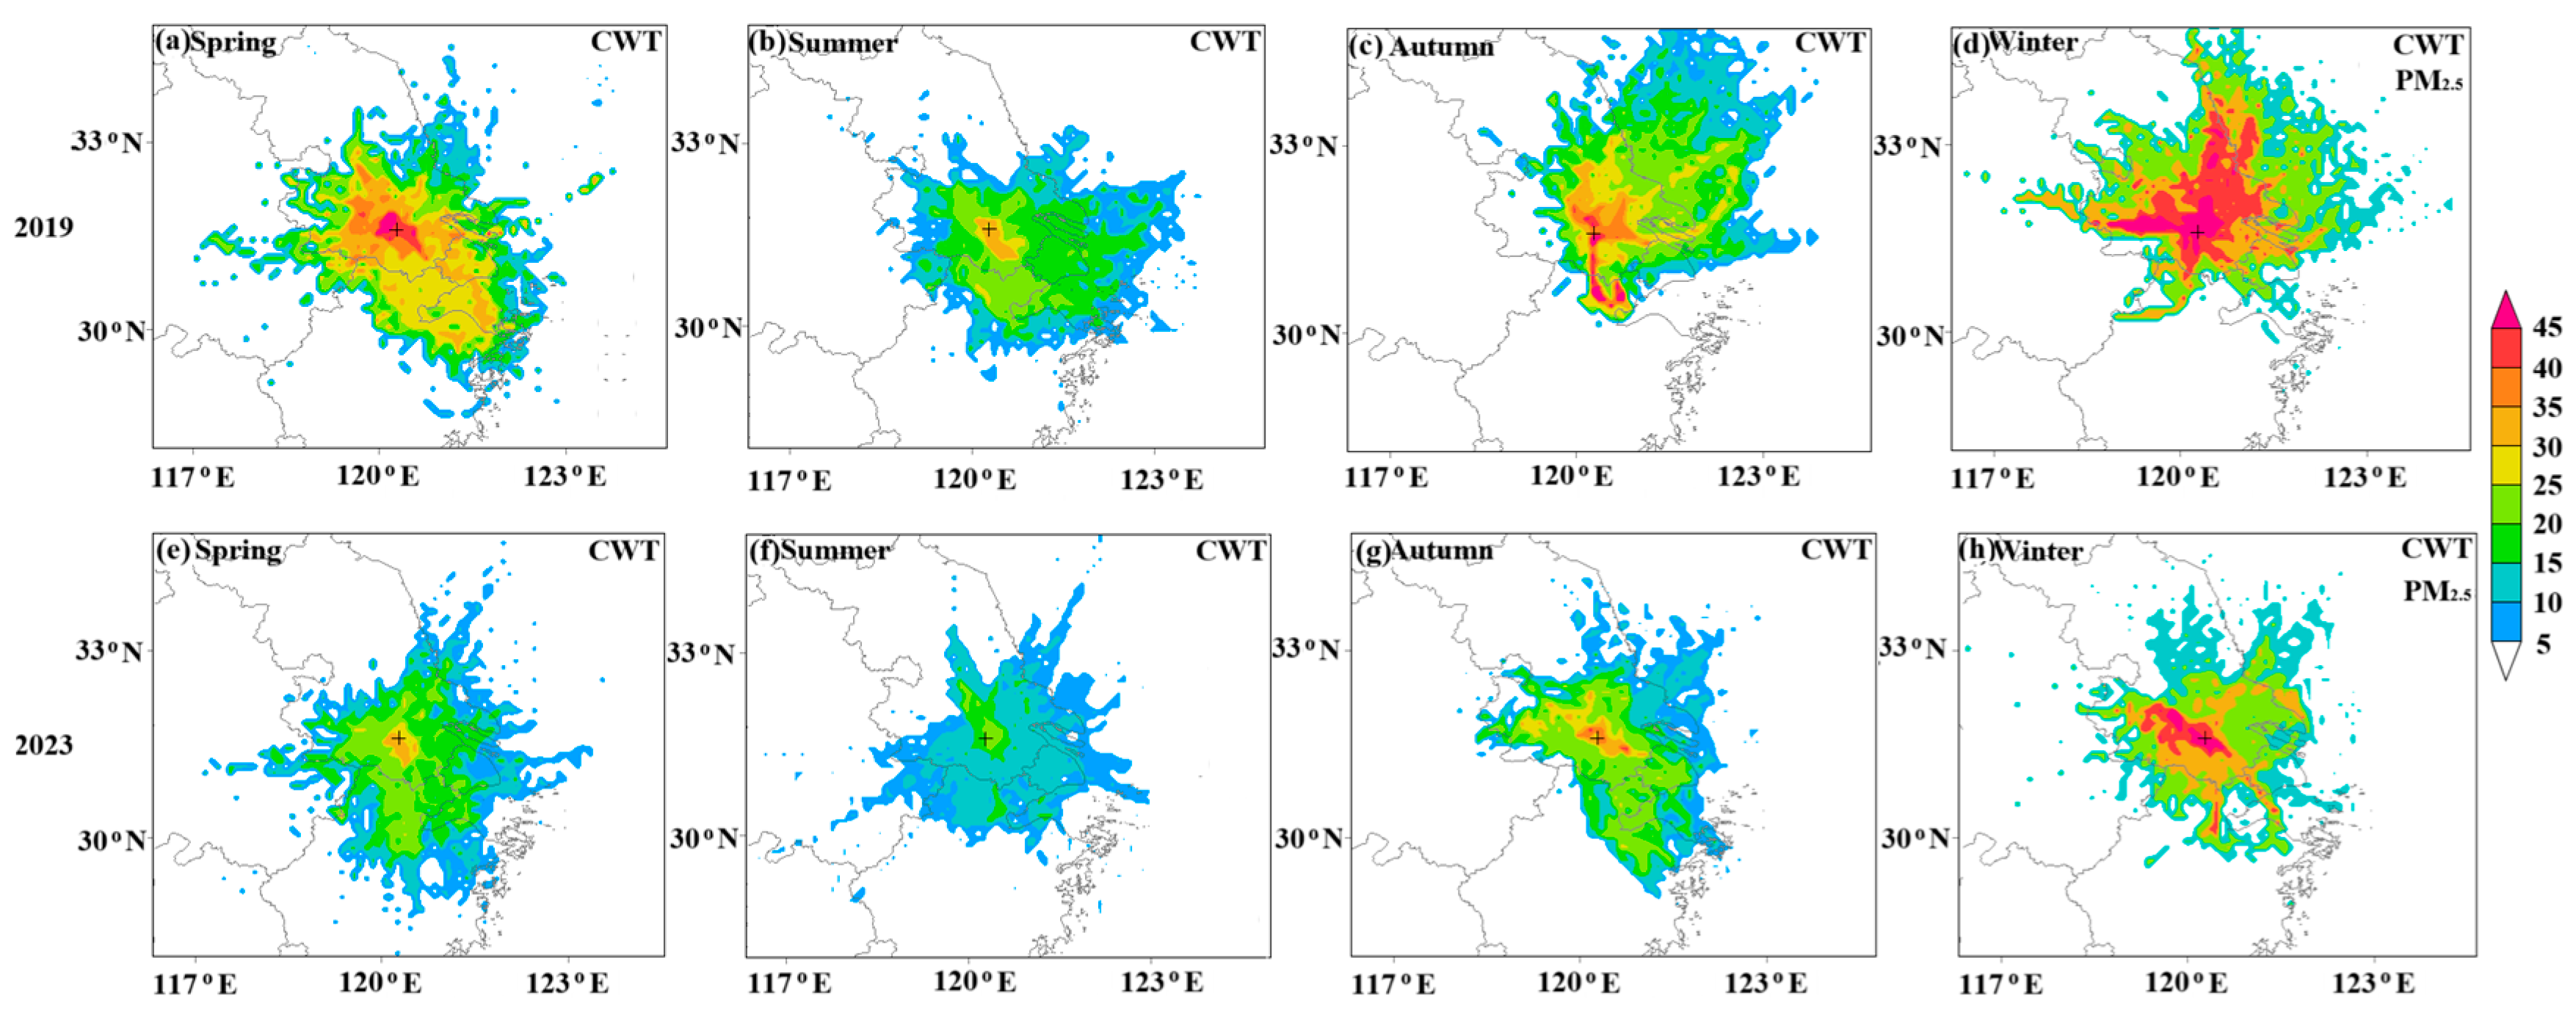
- (5)
- PSCF and CWT analyses showed high consistency in identifying major potential source regions. In spring, the dominant potential source regions of O3 and PM2.5 in Wuxi were concentrated in the Suzhou–Wuxi–Changzhou metropolitan area, southern Nanjing, Zhenjiang, and northern Zhejiang Province. During summer, high-potential source areas of O3 were mainly distributed around Taihu Lake, including Changzhou, Wuxi, Suzhou, and Huzhou, while southeastern cities such as Jiaxing, Ningbo, Huzhou, and Shanghai also contributed to O3 pollution transport in Wuxi. In autumn, the dominant potential sources of O3 were located in the eastern part of Wuxi. In winter, the major source regions of PM2.5 originated from central and northern Jiangsu Province.
Supplementary Materials
Author Contributions
Funding
Institutional Review Board Statement
Informed Consent Statement
Data Availability Statement
Acknowledgments
Conflicts of Interest
References
- Li, R.; Cui, L.; Li, J.; Zhao, A.; Fu, H.; Wu, Y.; Zhang, L.; Kong, L.; Chen, J. Spatial and temporal variation of particulate matter and gaseous pollutants in China during 2014–2016. Atmos. Environ. 2017, 161, 235–246. [Google Scholar] [CrossRef]
- Song, C.; Wu, L.; Xie, Y.; He, J.; Chen, X.; Wang, T.; Lin, Y.; Jin, T.; Wang, A.; Liu, Y.; et al. Air pollution in China: Status and spatiotemporal variations. Environ. Pollut. 2017, 227, 334–347. [Google Scholar] [CrossRef] [PubMed]
- Lelieveld, J.; Evans, J.; Fnais, M.; Giannadaki, D.; Pozzer, A. The contribution of outdoor air pollution sources to premature mortality on a global scale. Nature 2015, 525, 367–371. [Google Scholar] [CrossRef] [PubMed]
- Sun, Z.; Yang, L.; Bai, X.; Du, W.; Shen, G.; Fei, J.; Wang, Y.; Chen, A.; Chen, Y.; Zhao, M. Maternal ambient air pollution exposure with spatial-temporal variations and preterm birth risk assessment during 2013–2017 in Zhejiang Province, China. Environ. Int. 2020, 133, 105242. [Google Scholar] [CrossRef] [PubMed]
- Mao, M.; Zhang, X.; Yin, Y. Particulate matter and gaseous pollutions in three metropolises along the Chinese Yangtze River: Situation and Implications. Int. J. Environ. Res. Public Health 2018, 15, 1102. [Google Scholar] [CrossRef]
- Guo, X.R.; Wu, H.K.; Chen, D.S.; Ye, Z.L.; Shen, Y.Q.; Liu, J.F.; Cheng, S.Y. Estimation and prediction of pollutant emissions from agricultural and construction diesel machinery in the Beijing-Tianjin-Hebei (BTH) region, China. Environ. Pollut. 2020, 260, 10. [Google Scholar] [CrossRef]
- Ma, X.; Jia, H.; Sha, T.; An, J.; Tian, R. Spatial and seasonal characteristics of particulate matter and gaseous pollution in China: Implications for control policy. Environ. Pollut. 2019, 248, 421–428. [Google Scholar] [CrossRef]
- Van der A, R.J.; Mijling, B.; Ding, J.; Koukouli, M.E.; Liu, F.; Li, Q.; Mao, H.; Theys, N. Cleaning up the air: Efectiveness of air quality policy for SO2 and NOx emissions in China. Atmos. Chem. Phys. 2017, 17, 1775–1789. [Google Scholar] [CrossRef]
- Hu, M.; Wang, Y.; Wang, S.; Jiao, M.; Huang, G.; Xia, B. Spatialtemporal heterogeneity of air pollution and its relationship with meteorological factors in the Pearl River Delta China. Atmos. Environ. 2021, 254, 118415. [Google Scholar] [CrossRef]
- Zhang, Q.; Zheng, Y.; Tong, D.; Shao, M.; Wang, S.; Zhang, Y.; Xu, X.; Wang, J.; He, H.; Liu, W.; et al. Drivers of improved PM2.5 air quality in China from 2013 to 2017. Proc. Natl. Acad. Sci. USA 2019, 116, 24463–24469. [Google Scholar] [CrossRef]
- Li, K.; Jacob, D.J.; Liao, H.; Qiu, Y.; Shen, L.; Zhai, S.; Bates, K.H.; Sulprizio, M.P.; Song, S.; Lu, X.; et al. Ozone pollution in the North China Plain spreading into the late-winter haze season. Proc. Natl. Acad. Sci. USA 2021, 118, e2015797118. [Google Scholar] [CrossRef] [PubMed]
- Naeem, W.; Kim, J.; Lee, Y.G. Spatiotemporal variations in the air pollutant NO2 in some regions of Pakistan, India, China, and Korea, before and after COVID-19, based on ozone monitoring instrument data. Atmosphere 2022, 13, 986. [Google Scholar] [CrossRef]
- Graham, F.F.; Kim, A.H.M.; Baker, M.G.; Fyfe, C.; Hales, S. Associations between meteorological factors, air pollution and Legionnaires’ disease in New Zealand: Time series analysis. Atmos. Environ. 2023, 296, 119572. [Google Scholar] [CrossRef]
- Baltaci, H.; Akkoyunlu, B.O.; Arslan, H.; Yetemen, O.; Ozdemir, E.T. The infuence of meteorological conditions and atmospheric circulation types on PM10 levels in western Turkey. Environ. Monit. Assess. 2019, 191, 466. [Google Scholar] [CrossRef]
- Li, L.; Qian, J.; Ou, C.Q.; Zhou, Y.X.; Guo, C.; Guo, Y. Spatial and temporal analysis of Air Pollution Index and its timescale-dependent relationship with meteorological factors in Guangzhou, China, 2001–2011. Environ. Pollut. 2014, 190, 75–81. [Google Scholar] [CrossRef] [PubMed]
- Wang, X.; Wang, K.; Su, L. Contribution of Atmospheric Difusion Conditions to the Recent Improvement in Air Quality in China. Sci. Rep. 2016, 6, 36404. [Google Scholar]
- Zhang, R.; Wang, G.; Guo, S.; Zamora, M.L.; Ying, Q.; Lin, Y.; Wang, W.; Hu, M.; Wang, Y. Formation of urban fne particulate matter. Chem. Rev. 2015, 115, 3803–3855. [Google Scholar] [CrossRef]
- Ming, L.L.; Jin, L.; Li, J.; Fu, P.Q.; Yang, W.Y.; Liu, D.; Zhang, G.; Wang, Z.F.; Li, X.D. PM2.5 in the Yangtze River Delta, China: Chemical compositions, seasonal variations, and regional pollution events. Environ. Pollut. 2017, 223, 200–212. [Google Scholar] [CrossRef]
- Zhang, G.; Xu, H.; Qi, B.; Du, R.; Gui, K.; Wang, H.; Jiang, W.; Liang, L.; Xu, W. Characterization of atmospheric trace gases and particulate matter in Hangzhou, China. Atmos. Chem. Phys. 2018, 18, 1705–1728. [Google Scholar] [CrossRef]
- Ma, T.; Duan, F.; He, K.; Qin, Y.; Tong, D.; Geng, G.; Liu, X.; Li, H.; Yang, S.; Ye, S.; et al. Air pollution characteristics and their relationship with emissions and meteorology in the Yangtze River Delta region during 2014–2016. J. Environ. Sci. 2019, 83, 8–20. [Google Scholar] [CrossRef]
- Zhou, W.; Wu, X.; Ding, S.; Ji, X.; Pan, W. Predictions and mitigation strategies of PM2.5 concentration in the Yangtze River Delta of China based on a novel nonlinear seasonal grey model. Environ. Pollut. 2021, 276, 116614. [Google Scholar] [CrossRef]
- Ashbaugh, L.L.; Malm, W.C.; Sadeh, W.Z. A residence time probability analysis of sulfur concentrations at Grand Canyon National Park. Atmos. Environ. 1985, 19, 1263–1270. [Google Scholar] [CrossRef]
- The Global Data Assimilation System (GDAS). Available online: https://www.ncei.noaa.gov/access/metadata/landing-page/bin/iso?id=gov.noaa.ncdc:C00379 (accessed on 3 April 2025).
- Polissar, A.V.; Hopke, P.K.; Poirot, R.L. Atmospheric aerosol over Vermont: Chemical composition and sources. Environ. Sci. Technol. 2001, 35, 4604–4621. [Google Scholar] [CrossRef] [PubMed]
- Dimitriou, K.; Kassomenos, P. Three year study of tropospheric ozone with back trajectories at a metropolitan and a medium scale urban area in Greece. Sci. Total Environ. 2015, 502, 493–501. [Google Scholar] [CrossRef] [PubMed]
- Zhang, H.; Cheng, S.; Wang, X.; Yao, S.; Zhu, F. Continuous monitoring, compositions analysis and the implication of regional transport for submicron and fine aerosols in Beijing, China. Atmos. Environ. 2018, 195, 30–45. [Google Scholar] [CrossRef]
- Mao, M.; Zhou, Y.; Zhang, X. Evaluation of MERRA-2 Black Carbon Characteristics and Potential Sources over China. Atmosphere 2023, 14, 1378. [Google Scholar] [CrossRef]
- Hsu, Y.K.; Holsen, T.M.; Hopke, P.K. Comparison of hybrid receptor models to locate PCB sources in Chicago. Atmos. Environ. 2003, 37, 545–562. [Google Scholar] [CrossRef]
- Wang, Y.Q.; Zhang, X.Y.; Draxler, R.R. TrajStat: GIS-based software that uses various trajectory statistical analysis methods to identify potential sources from long-term air pollution measurement data. Environ. Modell. Softw. 2009, 24, 938–939. [Google Scholar] [CrossRef]
- Liu, B.; Wu, J.; Zhang, J.; Wang, L.; Yang, J.; Liang, D.; Dai, Q.; Bi, X.; Feng, Y.; Zhang, Y.; et al. Characterization and source apportionment of PM2.5 based on error estimation from EPA PMF 5.0 model at a medium city in China. Environ. Pollut. 2017, 222, 10–22. [Google Scholar] [CrossRef]
- Mao, M.; Rao, L.; Jiang, H.; He, S.; Zhang, X. Air Pollutants in Metropolises of Eastern Coastal China. Int. J. Environ. Res. Public Health 2022, 19, 15332. [Google Scholar] [CrossRef]
- Li, X.; Abdullah, L.C.; Sobri, S.; Said, M.S.M.; Hussain, S.A.; Aun, T.P.; Hu, J. Long-term spatiotemporal evolution and coordinated control of air pollutants in a typical mega-mountain city of Cheng-Yu region under the “dual carbon” goal. J. Air Waste Manag. Assoc. 2023, 73, 649–678. [Google Scholar] [CrossRef] [PubMed]
- Zhang, Y.; Zhou, R.; Chen, J.; Gao, X.; Zhang, R. Spatiotemporal characteristics and infuencing factors of Air pollutants over port cities of the Yangtze River Delta. Air Qual. Atmos. Health 2023, 16, 1587–1600. [Google Scholar] [CrossRef]
- Tian, D.; Fan, J.; Jin, H.; Mao, H.; Geng, D.; Hou, S. Characteristic and spatiotemporal variation of air pollution in Northern China based on correlation analysis and clustering analysis of five air pollutants. J. Geophys. Res. Atmos. 2020, 125, e2019JD031931. [Google Scholar] [CrossRef]
- Shen, F.Z.; Ge, X.L.; Hu, J.L.; Nie, D.Y.; Tian, L.; Chen, M.D. Air pollution characteristics and health risks in Henan Province, China. Environ. Res. 2017, 156, 625–634. [Google Scholar] [CrossRef]
- Air Quality Online Monitoring and Analysis Platform. Available online: https://www.aqistudy.cn/ (accessed on 3 April 2025).
- Baudic, A.; Gros, V.; Sauvage, S.; Locoge, N.; Sanchez, O.; Sarda-Esteve, R.; Kalogridis, C.; Petit, J.E.; Bonnaire, N.; Baisnee, D.; et al. Seasonal variability and source apportionment of volatile organic compounds (VOCs) in the Paris megacity (France). Atmos. Chem. Phys. 2016, 16, 11961–11989. [Google Scholar] [CrossRef]
- Tao, T.; Shi, Y.; Gilbert, K.M.; Liu, X. Spatiotemporal variations of air pollutants based on ground observation and emission sources over 19 Chinese urban agglomerations during 2015–2019. Sci. Rep. 2022, 12, 4293. [Google Scholar] [CrossRef]
- Zhao, X.L.; Zhou, W.Q.; Han, L.J. Human activities and urban air pollution in Chinese mega city: An insight of ozone weekend effect in Beijing. Phys. Chem. Earth 2019, 110, 109–116. [Google Scholar] [CrossRef]
- Wang, Y.H.; Hu, B.; Ji, D.S.; Liu, Z.R.; Tang, G.Q.; Xin, J.Y.; Zhang, H.X.; Song, T.; Wang, L.L.; Gao, W.K.; et al. Ozone weekend effects in the Beijing-Tianjin-Hebei metropolitan area, China. Atmos. Chem. Phys. 2014, 14, 2419–2429. [Google Scholar] [CrossRef]
- Zou, Y.; Charlesworth, E.; Yan, X.L.; Deng, X.J.; Li, F. The weekday/weekend ozone differences induced by the emissions change during summer and autumn in Guangzhou, China. Atmos. Environ. 2019, 199, 114–126. [Google Scholar] [CrossRef]
- Li, B.; Shi, X.; Liu, Y.; Lu, L.; Wang, G.; Thapa, S.; Sun, X.; Fu, D.; Wang, K.; Qi, H. Long-term characteristics of criteria air pollutants in megacities of Harbin-Changchun megalopolis, Northeast China: Spatiotemporal variations, source analysis, and meteorological effects. Environ. Pollut. 2020, 267, 115441. [Google Scholar] [CrossRef]
- Pang, X.; Lu, Y.; Wang, B.; Wu, H.; Shi, K.; Li, J.; Xing, B.; Chen, L.; Wu, Z.; Dai, S.; et al. One-year spatiotemporal variations of air pollutants in a major chemical-industrypark in the Yangtze River Delta, China by 30 miniature air quality monitoring stations. Front. Environ. Sci. 2022, 10, 1026842. [Google Scholar] [CrossRef]
- Ministry of Environmental Protection (MEP). Ambient Air Quality Standards, GB3095-2012; MEP: Beijing, China, 2012; pp. 1–6.


| Year | AQI | PM2.5 (µg/m3) | PM10 (µg/m3) | SO2 (µg/m3) | NO2 (µg/m3) | CO (mg/m3) | 8h O3 (µg/m3) | Substandard Ratio b | |
|---|---|---|---|---|---|---|---|---|---|
| Annual | 2019 | 83.4 ± 33.5 | 39.6 ± 21.7 | 71.8 ± 37.2 | 8.3 ± 3.0 | 39.9 ± 16.8 | 0.9 ± 0.2 | 104.6 ± 54.4 | 28.2% |
| 2023 | 74.1 ± 32.1 | 29.3 ± 18.4 | 56.3 ± 37.4 | 7.8 ± 1.7 | 31.6 ± 17.2 | 0.8 ± 0.2 | 105.0 ± 46.6 | 17.5% | |
| Spring | 2019 | 82.8 ± 30.4 | 41.5 ± 16.4 | 79.2 ± 25.0 | 8.9 ± 2.4 | 41.5 ± 10.2 | 0.8 ± 0.2 | 115.9 ± 47.9 | 23.9% |
| 2023 | 82.3 ± 29.7 | 30.6 ± 11.7 | 73.1 ± 47.2 | 8.3 ± 1.5 | 29.8 ± 11.9 | 0.7 ± 0.1 | 122.0 ± 40.7 | 10.9% | |
| Summer | 2019 | 90.6 ± 41.5 | 26.3 ± 10.5 | 46.3 ± 16.4 | 6.4 ± 1.5 | 25.8 ± 7.9 | 0.7 ± 0.2 | 143.1 ± 53.0 | 39.1% |
| 2023 | 76.6 ± 39.4 | 17.5 ± 8.2 | 30.4 ± 13.1 | 6.5 ± 0.9 | 19.0 ± 5.9 | 0.7 ± 0.1 | 127.3 ± 49.4 | 23.9% | |
| Autumn | 2019 | 77.8 ± 28.3 | 34.2 ± 15.9 | 74.2 ± 44.2 | 8.5 ± 3.3 | 43.5 ± 17.5 | 0.9 ± 0.2 | 104.6 ± 45.4 | 20.9% |
| 2023 | 70.0 ± 26.8 | 27.5 ± 15.8 | 51.0 ± 26.9 | 8.0 ± 1.4 | 37.1 ± 15.9 | 0.9 ± 0.2 | 106.2 ± 41.5 | 19.8% | |
| Winter | 2019 | 82.2 ± 31.3 | 56.6 ± 27.8 | 87.9 ± 41.9 | 9.3 ± 3.6 | 49.9 ± 19.0 | 1.1 ± 0.2 | 53.5 ± 22.2 | 28.9% |
| 2023 | 67.3 ± 29.3 | 41.6 ± 24.9 | 70.7 ± 36.4 | 8.4 ± 1.9 | 40.7 ± 22.1 | 0.9 ± 0.3 | 63.6 ± 20.4 | 15.6% |
| Meteorological Parameters | Year | Total | Spring | Summer | Autumn | Winter |
|---|---|---|---|---|---|---|
| T (°C) | 2019 | 17.4 | 16.7 | 27.4 | 19.4 | 6.0 |
| 2023 | 17.8 | 17.7 | 28.2 | 19.5 | 5.9 | |
| Tmax (°C) | 2019 | 21.8 | 21.8 | 31.5 | 24.0 | 9.8 |
| 2023 | 22.7 | 22.9 | 32.5 | 24.6 | 10.9 | |
| Tmin (°C) | 2019 | 13.6 | 12.1 | 23.9 | 15.4 | 2.9 |
| 2023 | 13.7 | 13.2 | 24.7 | 15.2 | 1.9 | |
| RH (%) | 2019 | 72.1 | 65.0 | 74.6 | 72.1 | 76.6 |
| 2023 | 70.5 | 63.2 | 76.1 | 73.2 | 69.4 | |
| WS (m/s) | 2019 | 2.0 | 2.1 | 2.2 | 1.9 | 1.9 |
| 2023 | 2.0 | 2.4 | 1.9 | 1.8 | 1.9 | |
| Pre (mm) | 2014 | 1030.5 | 158.1 | 441.1 | 178.5 | 252.8 |
| 2015 | 1266.0 | 179 | 737.9 | 194.2 | 154.9 |
| Station | Description | PM2.5 | PM10 | SO2 | NO2 | CO | 8h O3 |
|---|---|---|---|---|---|---|---|
| urban district | |||||||
| HX | Huang Xiang | 29.3 | 65.3 | 7.7 | 39.8 | 0.9 | 105.0 |
| CZ | Cao Zhang | 29.5 | 55.8 | 7.8 | 34.5 | 0.9 | 101.2 |
| DT | Dong Ting | 30.8 | 58.1 | 8.5 | 35.8 | 0.9 | 105.8 |
| WZ | Wang Zhuang | 29.3 | 55.8 | 7.1 | 35.3 | 0.9 | 105.4 |
| YQ | Yang Qiao | 29.0 | 57.9 | 7.7 | 31.9 | 0.9 | 105.5 |
| the north shore of Taihu Lake | |||||||
| XL | Xue Lang | 27.0 | 54.9 | 6.7 | 24.8 | 0.8 | 110.3 |
| QT | Qi Tang | 27.9 | 50.8 | 7.4 | 24.6 | 0.8 | 109.3 |
| RX | Rong Xiang | 28.3 | 49.8 | 9.8 | 25.9 | 0.8 | 107.0 |
| PM2.5 | − | 1 > R ≥ 0.5 | ||||||||||
| PM10 | 0.86 ** | − | 0.5 > R ≥ 0.25 | |||||||||
| SO2 | 0.62 ** | 0.69 ** | − | 0.25 > R ≥ 0 | ||||||||
| NO2 | 0.67 ** | 0.72 ** | 0.63 ** | − | 0 > R ≥ −0.25 | |||||||
| CO | 0.80 ** | 0.62 ** | 0.47 ** | 0.56 ** | − | –0.25 > R ≥ −0.5 | ||||||
| 8h O3 | −0.11 * | 0.00 | 0.09 | −0.25 ** | −0.24 ** | − | −0.5 > R ≥ −1 | |||||
| T | −0.49 ** | −0.41 ** | −0.32 ** | −0.49 ** | −0.46 ** | 0.65 ** | − | |||||
| Tmax | −0.42 ** | −0.30 ** | −0.21 ** | −0.40 ** | −0.43 ** | 0.72 ** | 0.98 ** | − | ||||
| Tmin | −0.54 ** | −0.51 ** | −0.43 ** | −0.56 ** | −0.47 ** | 0.52 ** | 0.97 ** | 0.91 ** | − | |||
| WS | −0.33 ** | −0.30 ** | −0.34 ** | −0.50 ** | −0.38 ** | −0.03 | 0.15 ** | 0.12 * | 0.19 ** | − | ||
| RH | −0.08 | −0.34 ** | −0.51 ** | −0.13 * | 0.18 ** | −0.45 ** | −0.04 | −0.15 ** | 0.09 | 0.00 | − | |
| Pre | −0.20 ** | −0.28 ** | −0.31 ** | −0.18 ** | −0.04 | −0.20 ** | 0.05 | −0.01 | 0.12 * | 0.15 ** | 0.42 ** | − |
| PM2.5 | PM10 | SO2 | NO2 | CO | 8h O3 | T | Tmax | Tmin | WS | RH | Pre |
Disclaimer/Publisher’s Note: The statements, opinions and data contained in all publications are solely those of the individual author(s) and contributor(s) and not of MDPI and/or the editor(s). MDPI and/or the editor(s) disclaim responsibility for any injury to people or property resulting from any ideas, methods, instructions or products referred to in the content. |
© 2025 by the authors. Licensee MDPI, Basel, Switzerland. This article is an open access article distributed under the terms and conditions of the Creative Commons Attribution (CC BY) license (https://creativecommons.org/licenses/by/4.0/).
Share and Cite
Mao, M.; Wu, X.; Zhang, Y. Spatiotemporal Patterns and Regional Transport Contributions of Air Pollutants in Wuxi City. Atmosphere 2025, 16, 537. https://doi.org/10.3390/atmos16050537
Mao M, Wu X, Zhang Y. Spatiotemporal Patterns and Regional Transport Contributions of Air Pollutants in Wuxi City. Atmosphere. 2025; 16(5):537. https://doi.org/10.3390/atmos16050537
Chicago/Turabian StyleMao, Mao, Xiaowei Wu, and Yahui Zhang. 2025. "Spatiotemporal Patterns and Regional Transport Contributions of Air Pollutants in Wuxi City" Atmosphere 16, no. 5: 537. https://doi.org/10.3390/atmos16050537
APA StyleMao, M., Wu, X., & Zhang, Y. (2025). Spatiotemporal Patterns and Regional Transport Contributions of Air Pollutants in Wuxi City. Atmosphere, 16(5), 537. https://doi.org/10.3390/atmos16050537