Abstract
PM2.5 concentrations in major port cities in the Republic of Korea, such as Incheon and Busan, are as serious as those in land-based metropolises, such as Seoul, and fine dust generated in port cities is mainly emitted from ships. To identify the specific substances influencing local air quality, the occurrence and effects of high concentrations of PM2.5 at the ports of Incheon and Busan were analyzed. To analyze the effects of improving air quality based on the Republic of Korea’s port and ship-related reduction measures, we calculated an emissions forecast for 2025 following the implementation/non-implementation of these measures and analyzed all impacts using the WRF-SMOKE-CMAQ modeling system. The ratio of ionic components constituting PM2.5 at the ports of Incheon and Busan was generally high in nitrate composition; however, the ratio of sulfate was high on high PM2.5 concentration days. When implementing measures to reduce emissions related to ports and ships, forecasted PM2.5 and SO2 emissions showed substantial decreases in port areas as well as nearby land and sea areas. The associated decrease in the PM2.5 concentration was highly influential in reducing the concentration of sulfate.
1. Introduction
The concentrations of PM2.5 in the major port cities of the Republic of Korea, including Incheon and Busan, are as severe as those in large metropolitan areas, like Seoul [1]. Air pollutants emitted from ships have been identified as a major contributor to air pollution in these port cities [2]. Ships typically use bunker C oil, a fuel with a high sulfur content; this usage results in high emissions of air pollutants, such as PM2.5, sulfur oxides (SOX), and nitrogen oxides (NOX), due to the combustion of low-grade fuel [3]. SOX and NOX are transformed into secondary particulate matter, such as sulfate and nitrate, through oxidative reactions, including photochemical processes [4]. In port cities with high ship traffic, the sulfur content in marine fuels leads to elevated SOX concentrations, and both primary emissions and secondary formation of fine particulate matter contribute to PM2.5 levels comparable to those in inland megacities [5]. According to [6], ship emissions in coastal areas account for approximately 5–20% of ambient sulfate and 5–30% of sulfur dioxide (SO2) concentrations in adjacent regions. Additionally, on a global scale, emissions from ships contribute an estimated 5–8% of total SOX and around 15% of total NOX emissions, with larger port areas showing a higher contribution to local PM2.5 concentrations [7]. The issue of air pollution in port areas has thus emerged as an important environmental concern worldwide.
Prior to 2020, bunker C oil used in ships contained approximately 3.5% sulfur; this content is significantly higher than the sulfur content of diesel fuel used in standard passenger vehicles (0.001%), making it a primary contributor to air pollution in port areas [8]. In response to this issue, the International Maritime Organization (IMO) implemented a global regulation known as “IMO 2020”, which came into effect in 2020. This regulation designated worldwide Emission Control Areas (ECAs) and imposed strict limits on the sulfur content in marine fuels to mitigate air pollution in port regions [9]. The Republic of Korea adopted the IMO 2020 regulation as part of its national strategy to improve air quality in port areas. This strategy included tightening the permissible sulfur content in ship fuel from 3.5 to 0.5%, along with additional policies aimed at reducing air pollutant emissions from ships and ports. These measures are subject to periodic review and enhancement to ensure effective air quality management in port cities. Evaluating the effectiveness of such policies requires an assessment of changes in air pollutant concentrations resulting from emission reductions, as well as an analysis of their broader environmental impacts. Identifying the specific substances that have the most influence on air quality in port areas is particularly essential. Accordingly, we sought to investigate the occurrence of high PM2.5 concentrations in the Incheon and Busan Port areas of the Republic of Korea. Furthermore, we sought to assess the impact of emission reduction policies for ships and ports on PM2.5 concentrations using the Community Multiscale Air Quality (CMAQ) model, a chemical transport modeling system.
2. Methods
2.1. Model Description
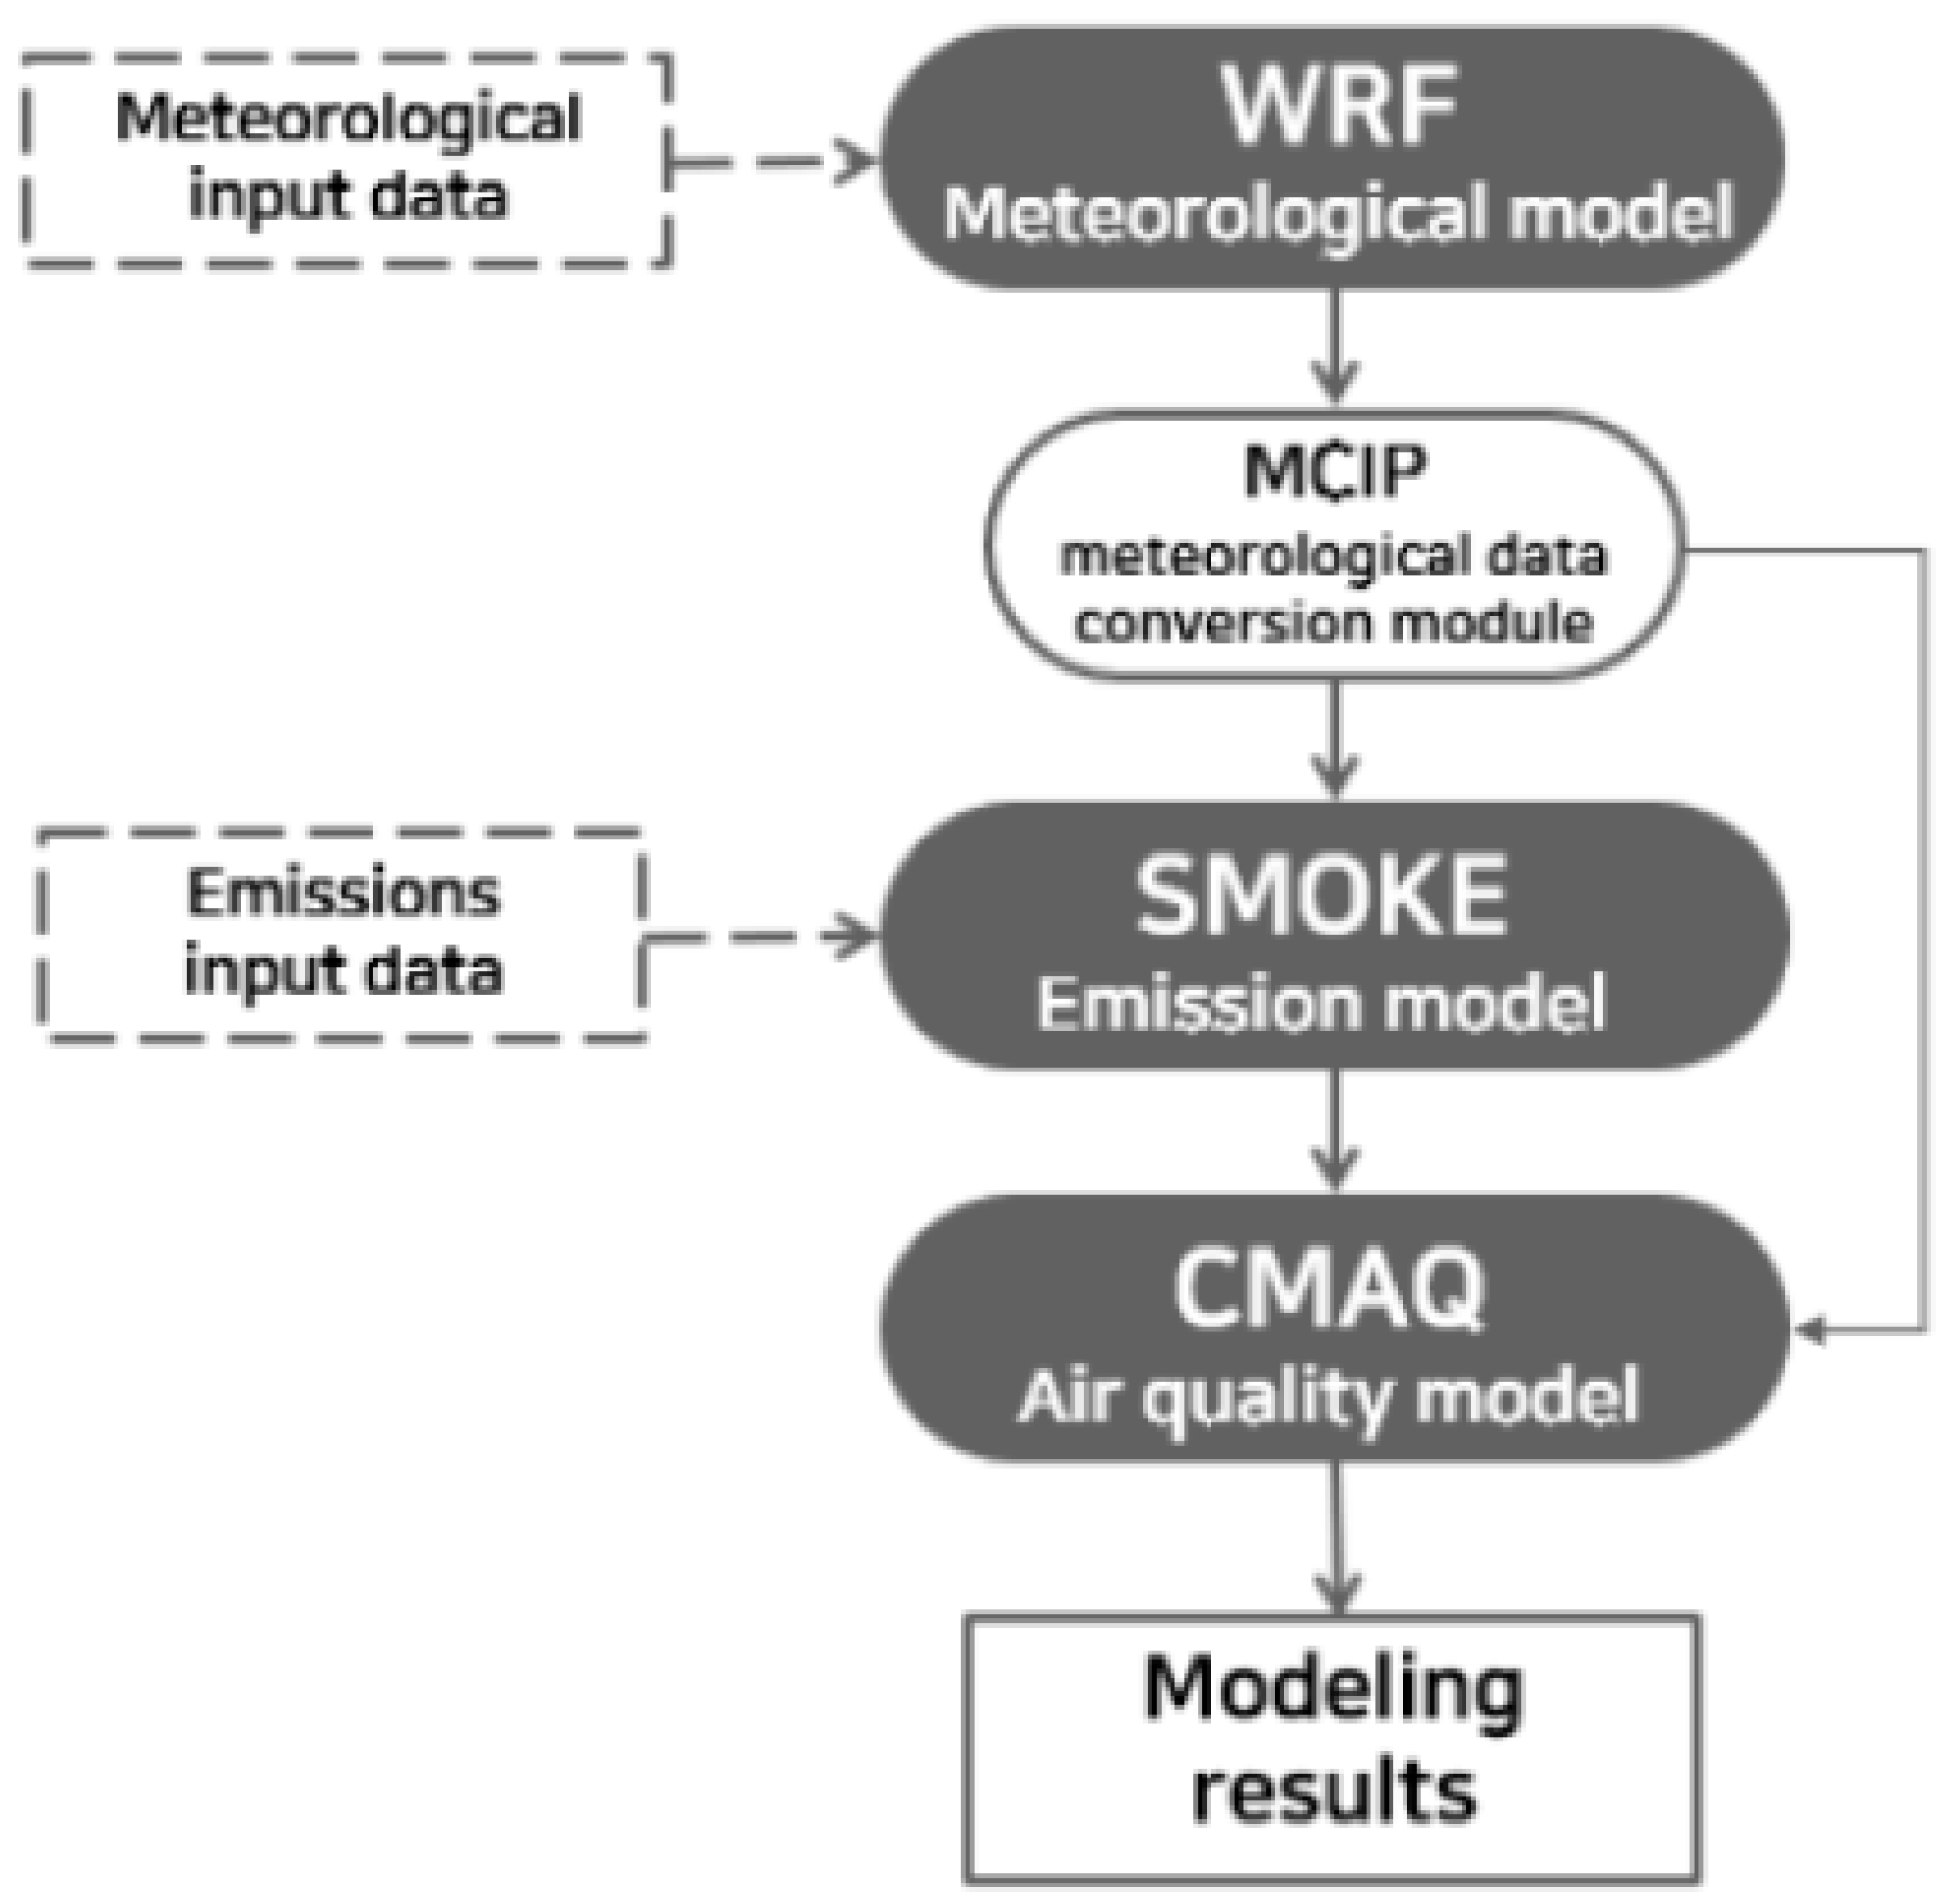
This study employed the Weather Research and Forecasting (WRF v3.6, National Center for Atmospheric Research, Boulder, CO, USA), the Sparse Matrix Operator Kernel Emissions (SMOKE v3.5, Community Modeling and Analysis System Center, Chapel Hill, NC, USA), and the Community Multiscale Air Quality models (CMAQ v5.0.2, U.S. Environmental Protection Agency, Research Triangle Park, NC, USA) to conduct air quality predictions and analyses (Figure 1).

Figure 1.
Flowchart of the WRF-SMOKE-CMAQ modeling system.
Meteorological input data for the WRF model were obtained from the Final Analysis (FNL) dataset provided by the National Centers for Environmental Prediction (NCEP), with a spatial resolution of 1° × 1° and a temporal interval of 6 h. The observational data assimilation tool OBSGRID was applied to enhance the accuracy of meteorological simulations.
For air quality simulations, emission inventories were configured by domain. In Domain 01, emissions were derived from the Intercontinental Chemical Transport Experiment Phase B (INTEX-B), which includes East Asia. Projected emission estimates for the year 2025 were utilized for Domains 02 and 03.
The chemical mechanism applied in the CMAQ model was SAPRC-99 (Statewide Air Pollution Research Center 99, University of California, Riverside, CA, USA). To improve the simulation accuracy of NOX emissions from ships and other sources, an option was implemented to reduce HNO3 formation by accounting for diurnal reactions involving OH radicals and nocturnal NOX oxidation processes [10]. Details on the model input data and configuration options used in this study are summarized in Table 1.

Table 1.
Modeling options and details.
Among the seasons during which high concentrations of fine particulate matter frequently occur in the Republic of Korea, March—characterized by both elevated PM2.5 levels and high ship traffic—was selected as the study period. The modeling domains were constructed using a one-way nesting approach, gradually increasing spatial resolution from the continental to the regional scale. Domain 1 covers East Asia with a 27 × 27 km grid, Domain 2 covers the Korean Peninsula with a 9 × 9 km grid, and Domain 3 focuses on the port regions with a 3 × 3 km grid (Figure 2) [11]. The innermost domain (Domain 3) was configured to center on major ports in the Republic of Korea.
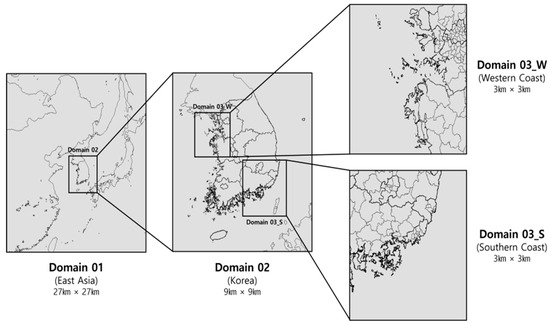
Figure 2.
Modeling domains at 27, 9, and 3 km horizontal resolutions.
The WRF–CMAQ modeling system used in this study has been widely validated in prior research. [12] conducted a comprehensive performance evaluation of CMAQ, highlighting its strengths in simulating key PM components, such as sulfate and ammonium. Additionally, [13] demonstrated improved model performance through the implementation of aerosol indirect effects in the two-way coupled WRF–CMAQ system, showing enhanced predictions for cloud-related processes and PM composition. These references confirm the suitability of the selected model configuration for assessing emission scenario impacts on air quality.
2.2. Emissions Inventory and Scenarios
Emission inventory data were based on the 2016 national emissions dataset from the Republic of Korea’s Clean Air Policy Support System (CAPSS). To evaluate the model performance and assess the impacts of the port emission reduction policies, four modeling scenarios were developed:
- (1)
- Base Scenario, using CAPSS 2016 emissions;
- (2)
- Business As Usual (BAU) Scenario, simulating the projected 2025 air quality assuming no implementation of port emission reduction measures;
- (3)
- Reduction Scenario 1;
- (4)
- Reduction Scenario 2, with both incorporating different levels of emission control strategies for ports.
The emission rates used in the Base and BAU Scenarios are presented in Table 2.
Table 2.
BAU emission results for port emission sources (unit: ton/year).
To estimate emissions for the Reduction and BAU Scenarios, source-specific reduction rates were reviewed based on the implementation of relevant policies, and the corresponding reduction factors were applied to each emission source. Details of the applied reduction rates are summarized in Table 3.
Table 3.
Emission ratio by air pollutants following estimated reductions in port emissions.
2.3. Modeling Performance Evaluation Methodology
The performance of the air quality modeling was quantitatively evaluated using statistical indicators by comparing the simulation results with observed PM2.5 concentrations. Observational data were obtained from the Songnim-dong station in Incheon and the Gwangbok-dong station in Busan, both located near major port areas. Key performance metrics included the correlation coefficient (R), Normalized Mean Bias (NMB), and Normalized Mean Error (NME) for photochemical model evaluations [14].
3. Results and Discussion
3.1. Modeling Performance
Table 4.
Statistics of CMAQ model results—PM2.5.
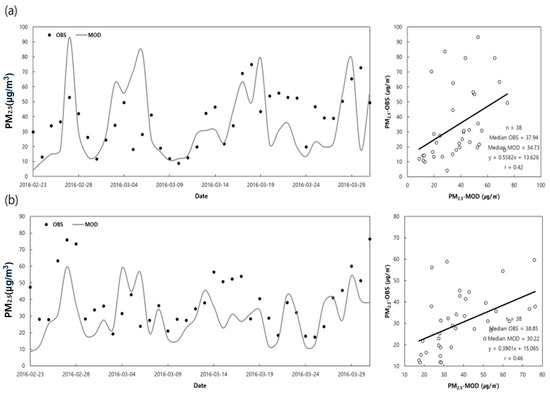
Figure 3.
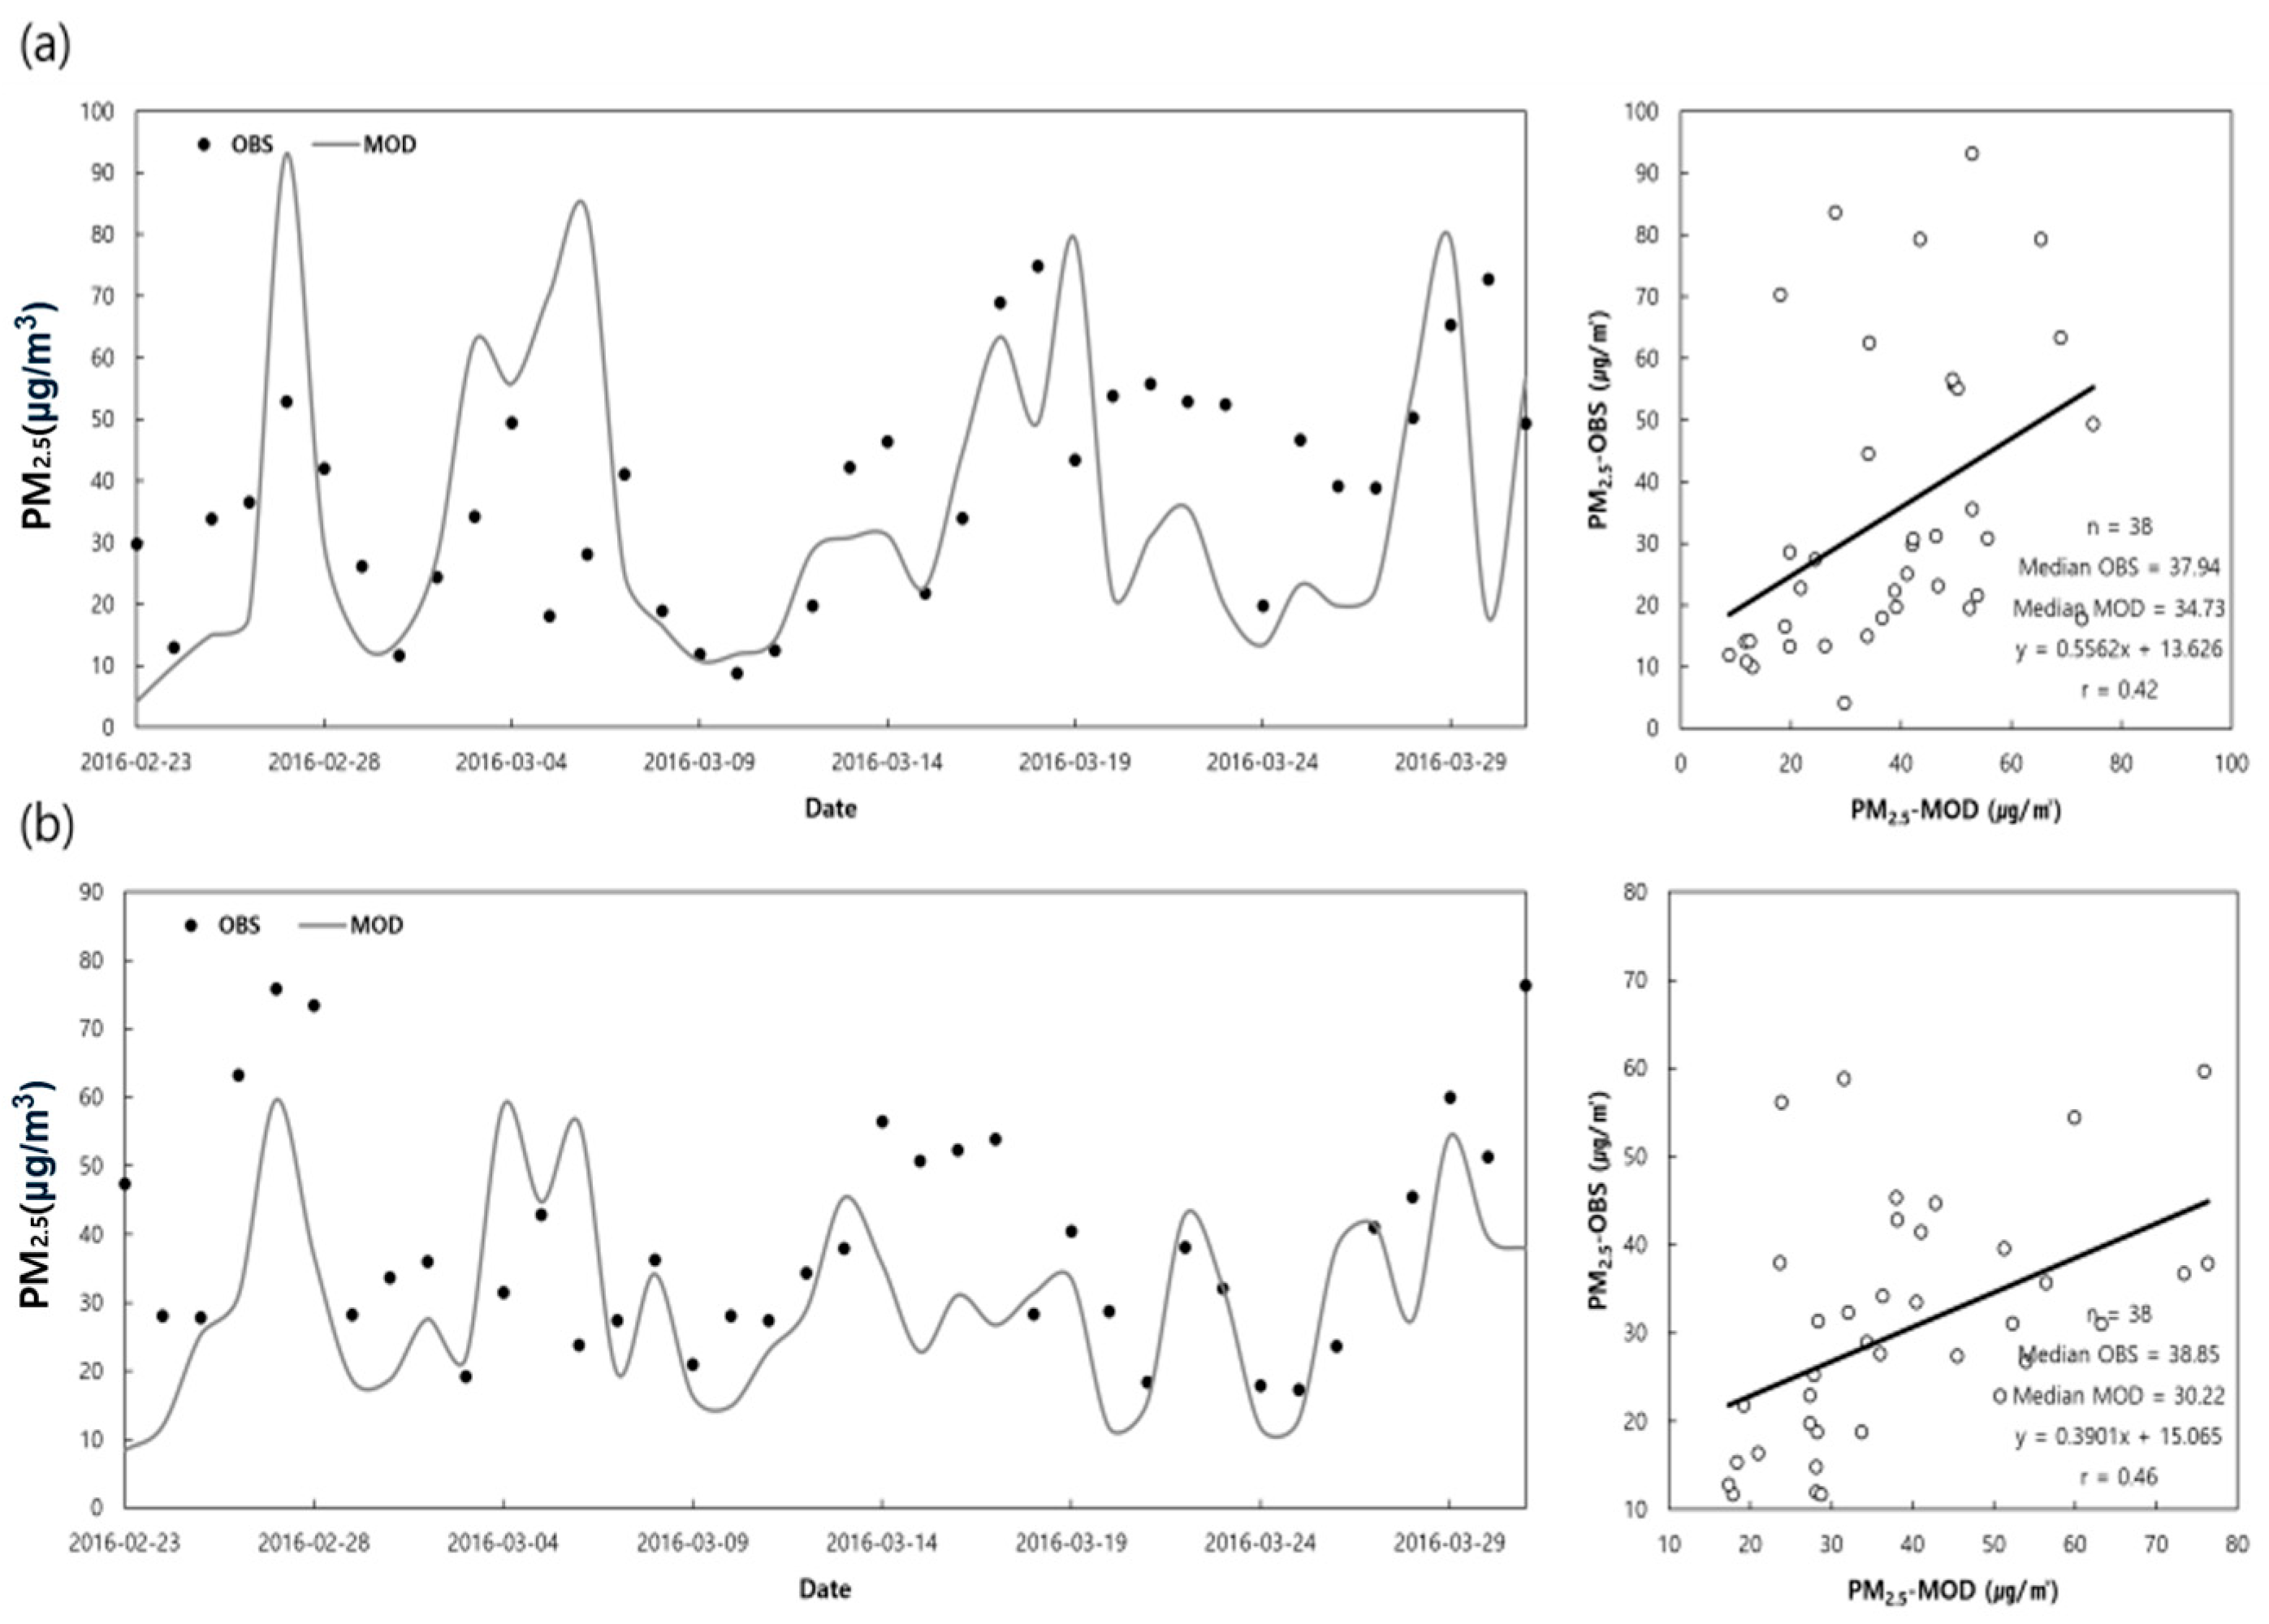
Time series and scatter plot of daily PM2.5 concentrations at the ports of (a) Incheon and (b) Busan.
In Songnim-dong, Incheon, the modeled average PM2.5 concentration (34.73 μg/m3) was slightly lower than the observed value (37.94 μg/m3). The calculated statistics were as follows: R = 0.70, NMB = −8.47%, and NME = 46.55%. While the NME slightly exceeded the goal threshold (≤35%), it remained within the acceptable criteria (≤50%) suggested by [14], indicating reasonable model performance.
In Gwangbok-dong, Busan, the observed average PM2.5 concentration was 38.85 μg/m3, while the modeled value was 30.22 μg/m3, reflecting a noticeable underestimation. Nevertheless, the model reproduced the overall temporal trend well, with the following statistics: R = 0.76, NMB = −22.21%, and NME = 34.97%. Both bias and error metrics met the recommended performance benchmarks, confirming the model’s reliability for scenario-based analysis. While the statistical indicators confirm that the model meets established performance benchmarks, the noticeable gap in average concentrations in Busan suggests potential uncertainty arising from factors such as ammonia (NH3) emission estimates and regional pollutant transport. These limitations have been noted in the manuscript to aid reader interpretation and transparency.
These results demonstrate that the model simulations were conducted with sufficient accuracy for both meteorological and emission inputs, and the applied emission scenarios were reasonably reflected in the model outputs.
3.2. BAU Scenario
The projected air quality for major Republic of Korea port areas in March 2025 was assessed under the BAU scenario, which assumes no implementation of emission reduction measures related to ports and ships. Figure 4 illustrates the daily average PM2.5 concentrations for the Incheon and Busan Port regions under the BAU scenario. The simulated monthly average PM2.5 concentrations for March were 35.53 μg/m3 at Incheon Port and 32.35 μg/m3 at Busan Port. Compared to the 2016 Base Scenario, a slight decrease of 0.12 μg/m3 is observed in Incheon, whereas Busan shows an increase of 5.59 μg/m3.

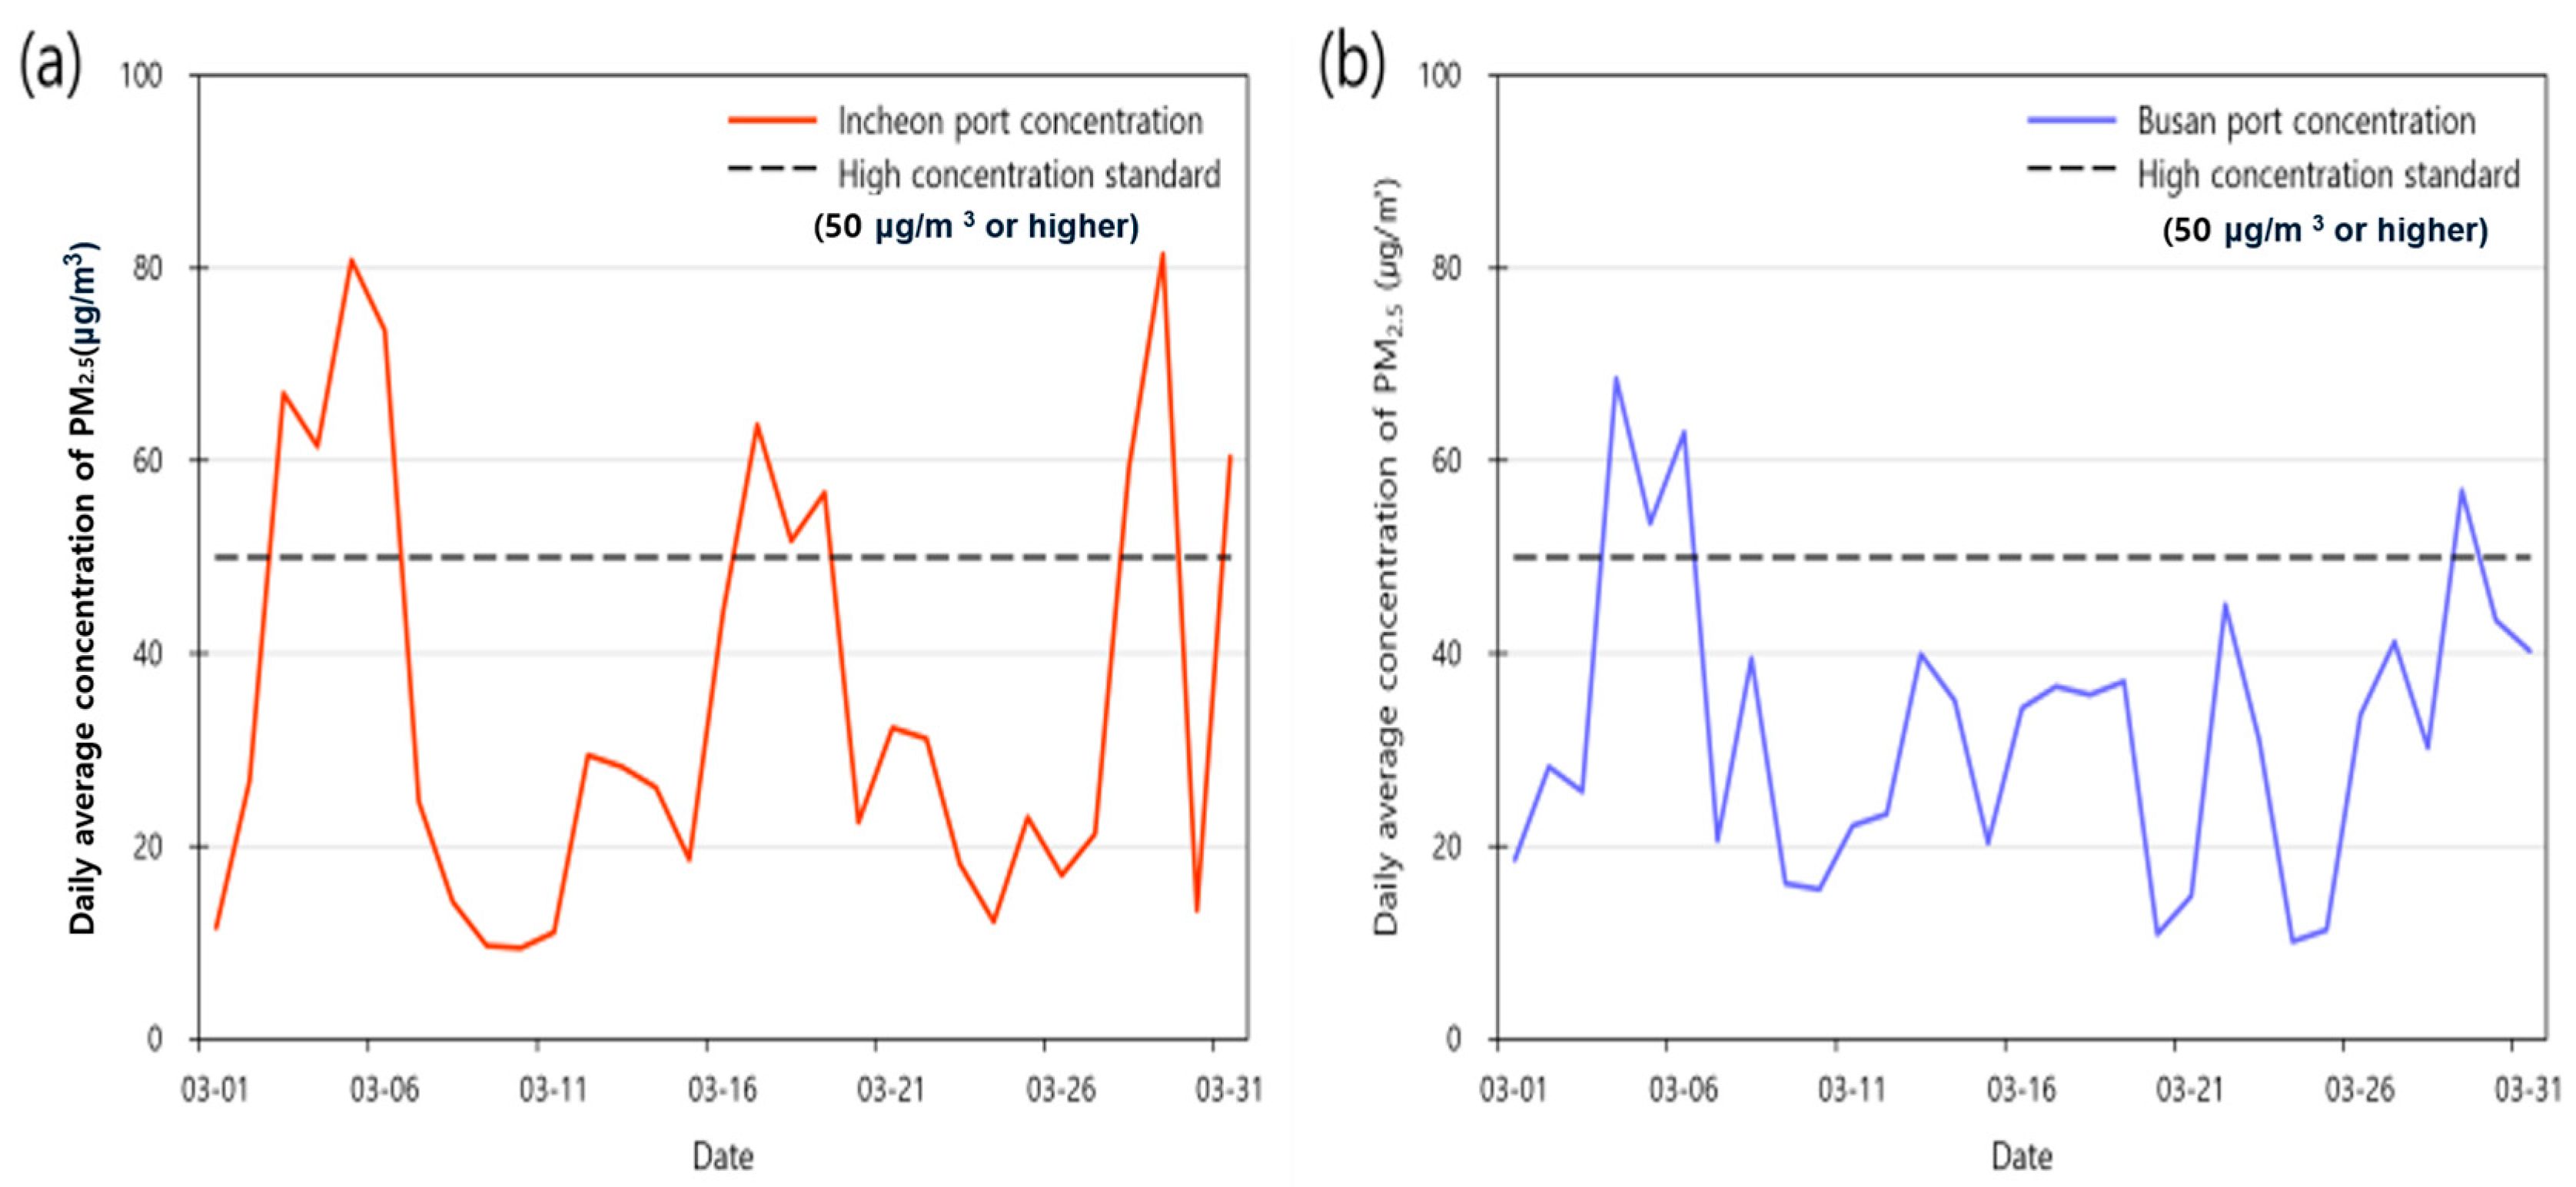
Figure 4.
Daily average concentrations of PM2.5 at the ports of (a) Incheon and (b) Busan according to the 2025 BAU scenario.
The number of days exceeding the Korean daily PM2.5 air quality standard of 35 μg/m3 was 11 days in Incheon and 14 days in Busan.
3.3. Major Ionic Species During High-Concentration PM2.5 Events
The ionic composition of PM2.5 in port areas was analyzed by focusing on sulfate, nitrate, and ammonium, which are the dominant components by mass concentration. Under the BAU Scenario for March 2025, the average ionic composition in Incheon Port was 8.42% ammonium, 9.56% sulfate, and 16.54% nitrate. In Busan Port, the corresponding values were 7.43% ammonium, 9.34% sulfate, and 14.31% nitrate. In both port regions, nitrate accounted for the largest proportion of the PM2.5 ionic species.
An examination of 2025 projected port-related emissions revealed that NOX emissions (8108 tons/year) in Incheon were approximately 4.63 times greater than SOX emissions (1751 tons/year). Similarly, in Busan, NOX emissions (66,671 tons/year) were 3.17 times higher than SOX emissions (21,052 tons/year). This disparity in emission levels may contribute to the relatively higher share of nitrate observed in the PM2.5 composition. However, the final concentration of secondary components is also influenced by atmospheric chemical processes, such as the preferential reaction of sulfate precursors with ammonia.
Additionally, the ionic composition of PM2.5 was analyzed for high-concentration days, defined as days with a daily average PM2.5 concentration exceeding 50 μg/m3 [15] (Table 5). In Incheon Port, 10 high-PM2.5 days were identified, among which sulfates dominated on day 7 and nitrate on day 3. In Busan Port, sulfate was the dominant component on all four high-PM2.5 days.
Table 5.
PM2.5 component proportions during high concentration episodes at Incheon and Busan ports.
3.4. Benefits of Port Emission Controls (S1 and S2)
To assess the air quality improvement expected in 2025 from implementing domestic emission reduction measures for ships and ports, the results of Reduction Scenarios I and II were compared with the BAU Scenario. Ships showed the largest emission reductions among all emission sources, with significant decreases in PM2.5 and SOX emissions.
The domain-specific monthly average improvements in PM2.5 and SO2 concentrations are shown in Figure 5 and Figure 6. Under Reduction Scenario I, which applies only fuel sulfur content regulations for ships, the monthly average PM2.5 reduction in the Incheon Port domain was estimated to range from 0.03 to 4.29 μg/m3. In the southern coastal domain, this reduction was estimated to range from 0.04 to 12.30 μg/m3. The number of days exceeding the daily PM2.5 air quality standard was estimated to remain unchanged in Incheon (11 days), whereas in Busan, an estimated decrease from 14 (BAU) to 6 days was observed. The monthly average PM2.5 concentrations were estimated to decrease by 1.81 μg/m3 (5.08%) in Incheon and 7.96 μg/m3 (24.60%) in Busan compared to BAU.
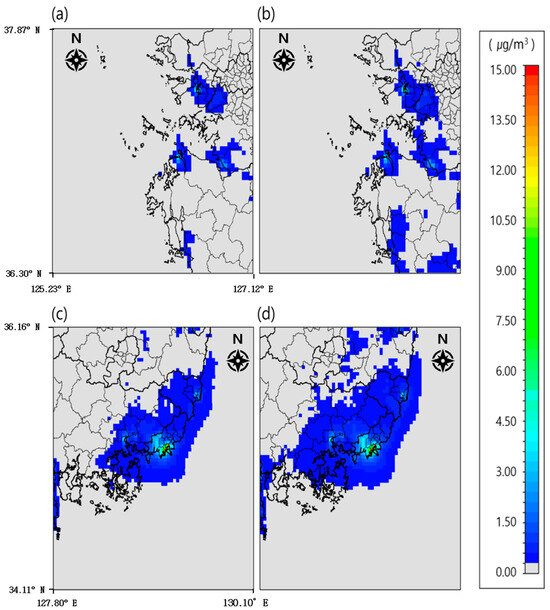
Figure 5.
Monthly average PM2.5 air quality improvement results based on reduction scenarios. (a) Reduction Scenario I (western coast); (b) Reduction Scenario II (western coast); (c) Reduction Scenario I (southern coast); (d) Reduction Scenario II (southern coast).
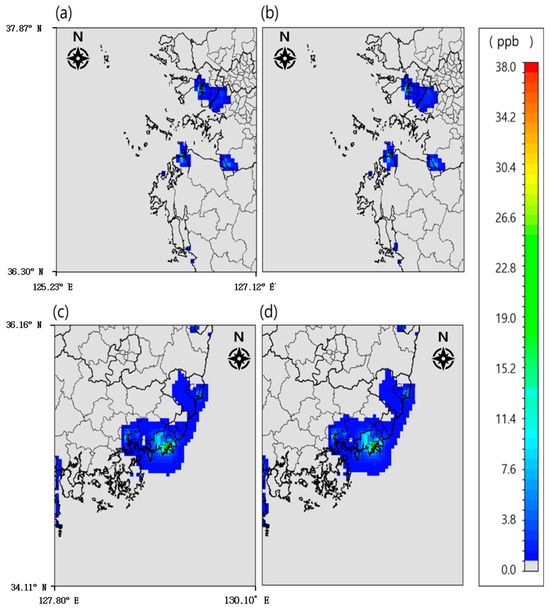
Figure 6.
Monthly average SO2 air quality improvement results based on reduction scenarios. (a) Reduction Scenario I (western coast); (b) Reduction Scenario II (western coast); (c) Reduction Scenario I (southern coast); (d) Reduction Scenario II (southern coast).
Under Reduction Scenario II, which applies both port and ship-related reduction measures, the estimated monthly average PM2.5 decrease ranged from 0.03 to 4.96 μg/m3 in the western coastal domain and from 0.04 to 14.17 μg/m3 in the southern coastal domain, showing greater reductions than Scenario I. Regarding the number of days exceeding the PM2.5 standard, Incheon again was estimated to demonstrate no change (11 days), whereas an estimated decrease to 4 days was observed in Busan—10 fewer than the BAU and 2 fewer than Scenario I—indicating a more substantial improvement. The monthly average PM2.5 concentrations were estimated to decrease by 2.11 μg/m3 (5.93%) in Incheon and 9.15 μg/m3 (28.29%) in Busan compared to the BAU. Furthermore, the spatial extent of the concentration decrease in Reduction Scenario II was broader than that observed in Scenario I.
The reduction in the number of days exceeding the daily air quality standard for PM2.5 (35 μg/m3) is not only a regulatory benchmark but also a critical factor in mitigating adverse public health effects. Fewer exceedance days are associated with reduced exposure to hazardous particulate matter, potentially lowering the incidence of respiratory and cardiovascular diseases, especially among vulnerable populations in port-adjacent areas.
Under Reduction Scenario I, the monthly average SO2 concentration decrease was up to 11.2 ppb in the western coastal domain (Incheon inner port grid) and up to 34.7 ppb in the southern coastal domain. Compared to the BAU Scenario, the estimated monthly average SO2 reductions were 4.5 ppb (40.58%) in Incheon Port and 26.0 ppb (68.98%) in Busan Port.
For Reduction Scenario II, the monthly average SO2 improvements increased slightly, with a maximum of 12.1 ppb in the western coastal domain and 37.4 ppb in the southern coastal domain. The corresponding reductions relative to BAU were 4.8 ppb (43.71%) for Incheon Port and 28.0 ppb (74.32%) for Busan Port.
Both reduction scenarios demonstrated clear decreases in SO2 concentrations focused around the port areas. Unlike PM2.5, the spatial extent of the SO2 emission reduction was similar between the two scenarios. This similarity can be attributed to the atmospheric behavior of the pollutants: PM2.5 is largely composed of secondary particles, has a longer atmospheric residence time, and is prone to long-range transport [16], resulting in a wider impact area. In contrast, SO2 has a relatively short atmospheric lifetime of approximately 1 to 2 days, leading to a more localized impact. While SO2 generally has a short atmospheric lifetime (approximately 1 to 2 days), and thus tends to exert more localized impacts, its transformation products, such as sulfate, may still contribute to long-range transport under favorable meteorological conditions. Several studies have highlighted the significance of the transboundary transport of PM2.5 and SIA from China to Korea during high pollution episodes [17,18,19,20].
We conducted air quality modeling under both the BAU and Reduction Scenarios based on changes in emissions from port-related sources. As a result, significant improvements in air quality were projected in areas surrounding ports. However, the simulation results for PM2.5 concentrations in the Incheon and Busan domains also showed noticeable projected concentration decreases over adjacent land and sea regions, indicating that emission reductions from port sources can positively influence air quality within both port areas as well as nearby regions.
Table 6 summarizes the PM2.5 concentration reductions for major ports—Incheon, Pyeongtaek-Dangjin, Busan, and Ulsan—within the western and southern coastal domains. Overall, projected emission reductions from ships and port activities led to projected improvements in air quality across all targeted port areas. Notably, the policy of reducing sulfur content in marine fuels from 3.5 to 0.5% alone yielded substantial improvements in air quality.
Table 6.
Monthly average concentration and reduction rate by reduction scenario.
Among the major ports, Busan Port exhibited the largest projected reduction in PM2.5 concentrations. This result is attributable to the port’s scale, as Busan is the largest port in the Republic of Korea and has ship traffic and cargo throughput more than twice that of other ports, making it more susceptible to emissions from port and ship sources.
The order of projected PM2.5 concentration reduction across ports was Busan > Incheon > Ulsan > Pyeongtaek-Dangjin. Generally, ports with higher activity levels showed larger reductions due to larger emission volumes and reduction amounts. However, despite Ulsan Port experiencing higher ship traffic and cargo throughput than Incheon, the improvement in air quality was less substantial. This result was likely due to Ulsan’s characteristics as a major industrial city, where stationary sources such as manufacturing processes dominate emissions, thereby limiting the relative impact of reductions in ship and port-related sources [21].
3.5. Analysis of Sulfate Concentration Changes
To assess the pollutant concentration reduction rates expected in 2025 from implementing domestic emission reduction measures for ships and ports, the results of Reduction Scenarios I and II were compared with the BAU Scenario. Ships showed the largest reduction in emissions among all sources, with significant decreases in PM2.5 and SOX emissions.
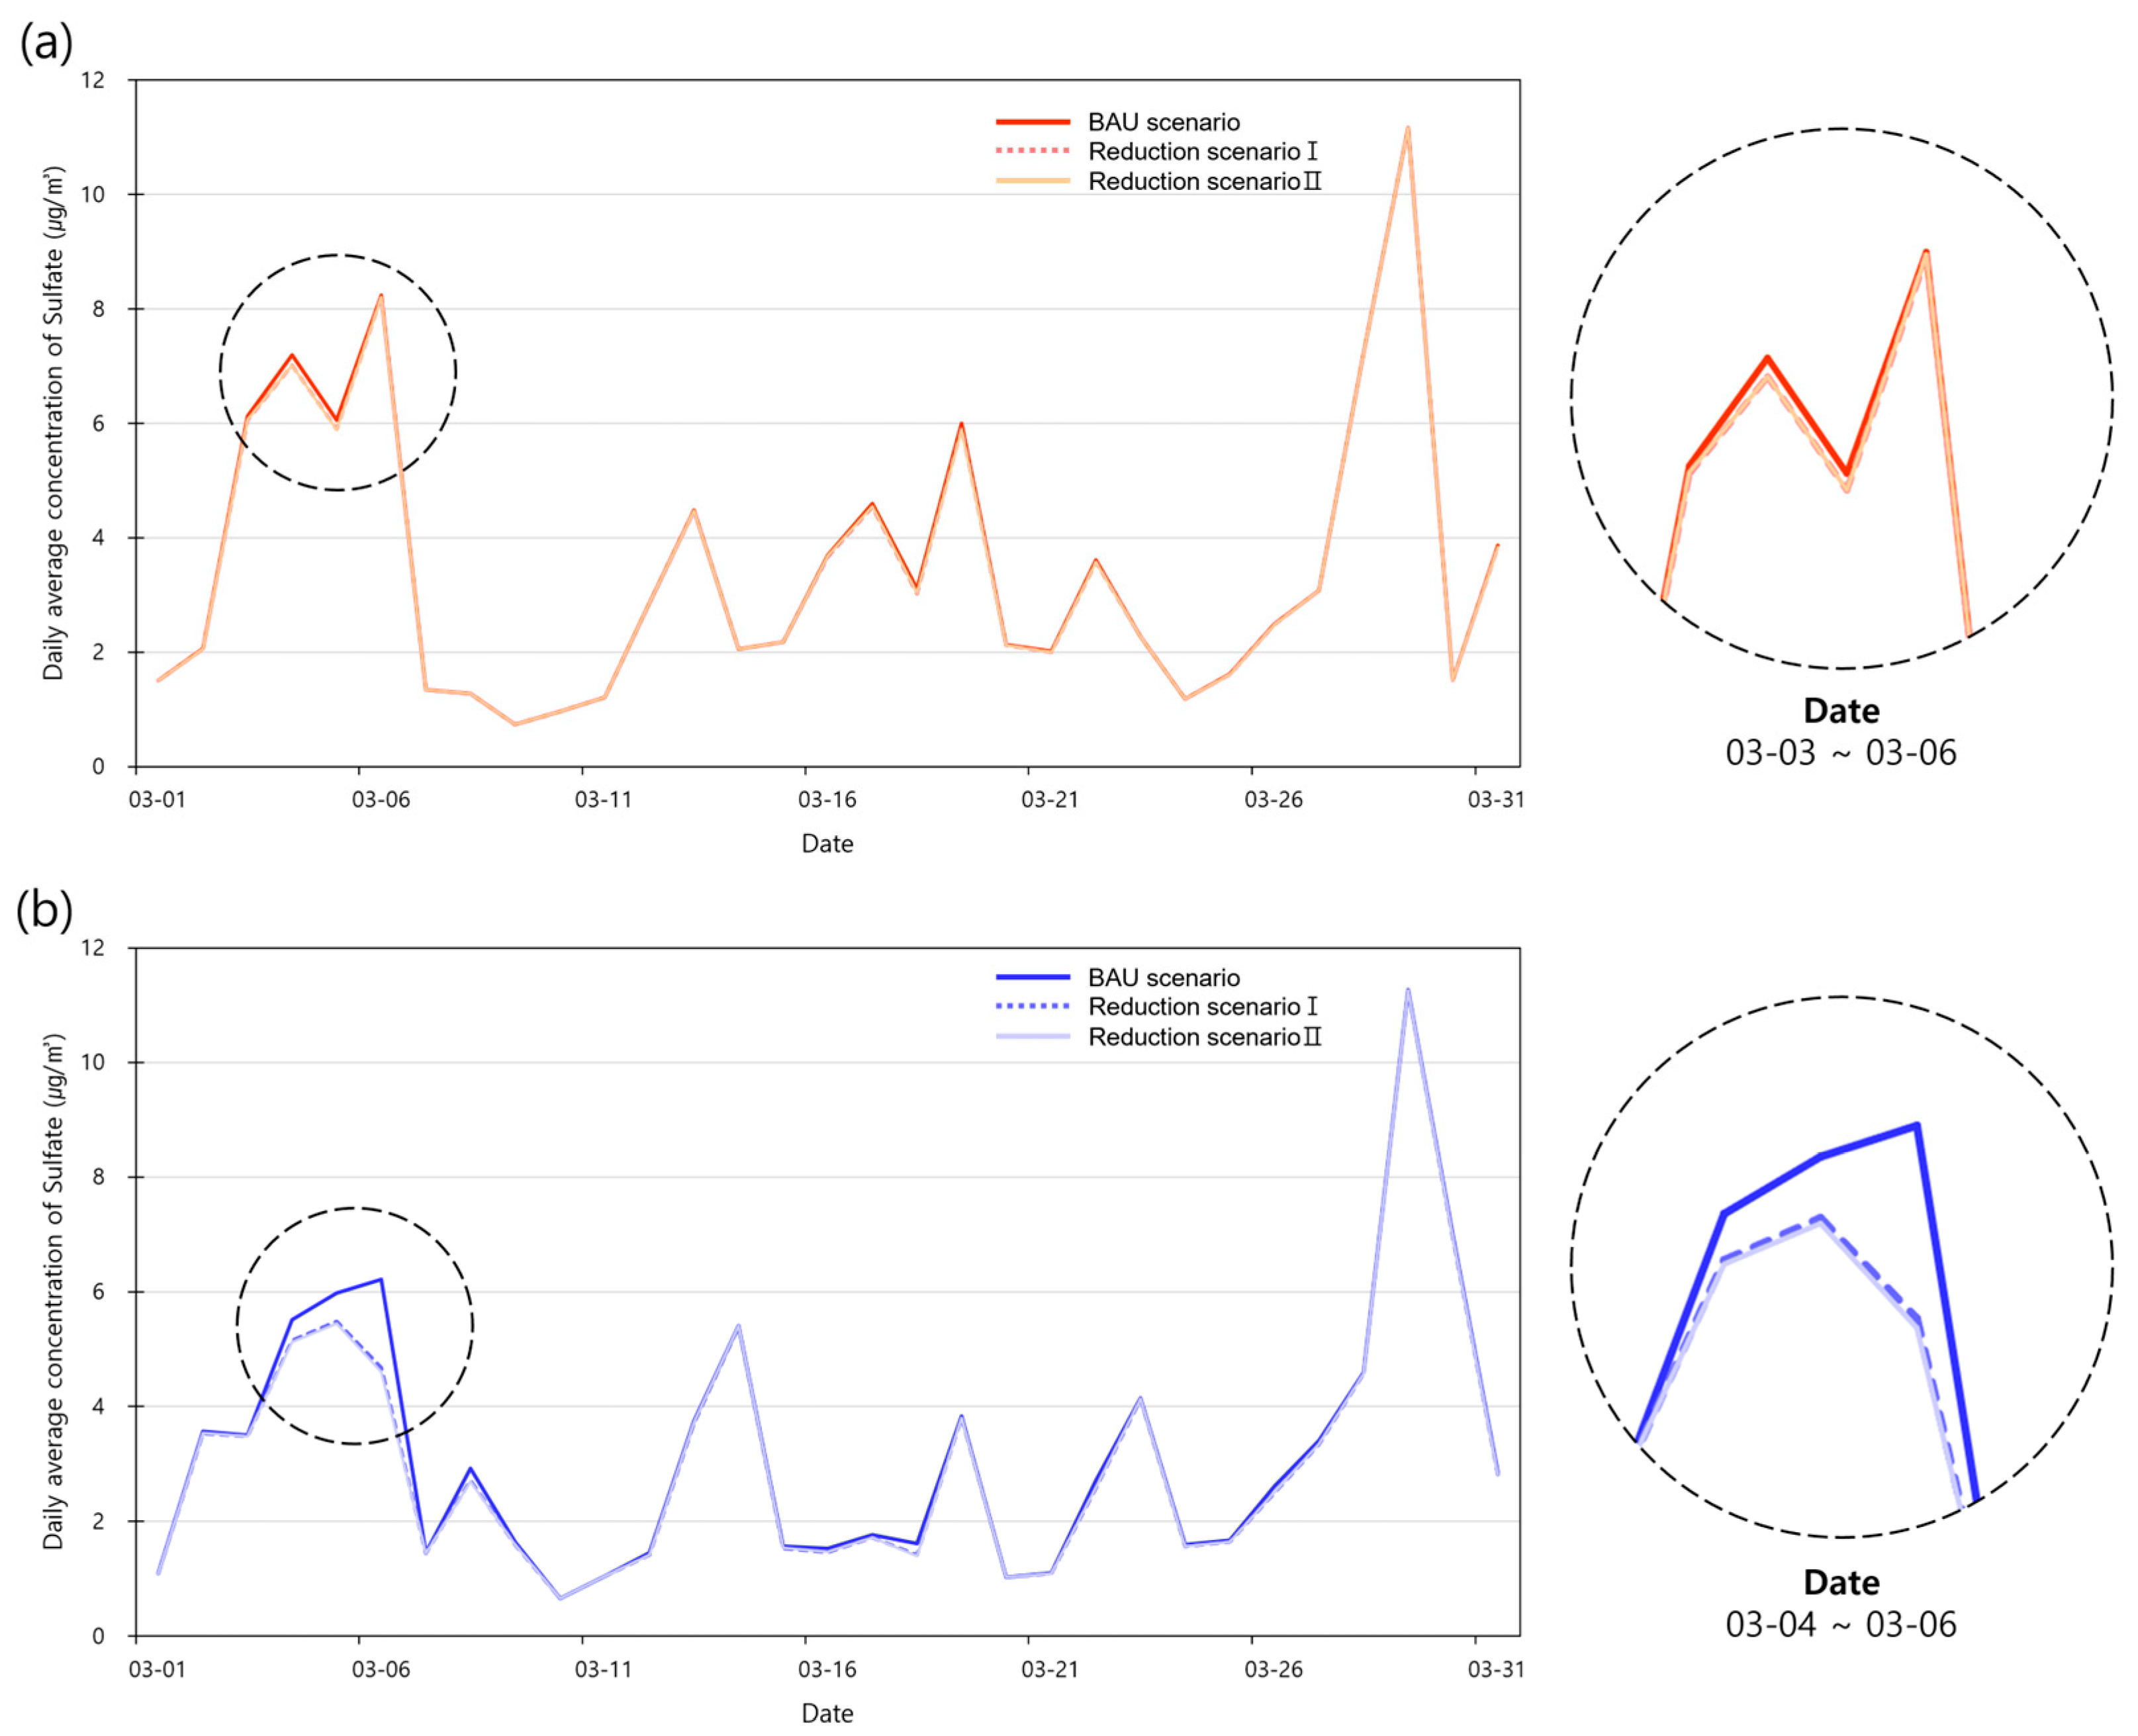
In this study, significant improvements in PM2.5 and SO2 concentrations in port areas were confirmed following the implementation of emission reduction measures related to ships and port activities. Accordingly, the impact of the sulfate reduction on PM2.5 concentrations in port regions was analyzed. Figure 7 presents a comparison of daily average sulfate concentrations under each 2025 scenario.
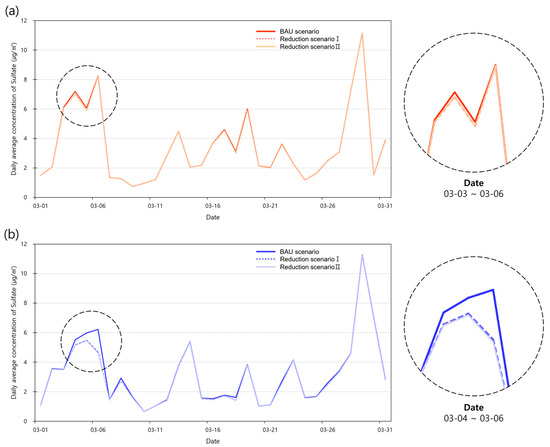
Figure 7.
Daily average concentration of sulfate in (a) Incheon Port and (b) Busan Port according to 2025 scenarios (BAU and Reduction I and II). In Incheon port, the date with the largest reduction in concentration was March 4 (Reduction Scenario I: 0.183 μg/m3 decrease; Reduction Scenario II: 0.184 μg/m3 decrease). In Busan Port, the date with the largest reduction in concentration was March 6 (Reduction Scenario I: 1.536 μg/m3 decrease; Reduction Scenario II: 1.612 μg/m3 decrease).
Changes in projected sulfate concentrations were compared with those of other major ionic species, namely nitrate and ammonium (Table 7). Overall, projected sulfate concentrations decreased across both port regions during the specified periods. In contrast, projected nitrate concentrations showed a slight increase in most periods, whereas projected ammonium concentrations generally decreased.
Table 7.
Daily average concentrations of sulfate, nitrate, and ammonium under the BAU scenario and concentration changes under the two reduction scenarios at the ports of Incheon and Busan.
An increase in projected nitrate concentrations was observed under Reduction Scenario I, whereas in Reduction Scenario II, nitrate levels were estimated to either decrease or show only minor increases. This discrepancy can be attributed to the policy applied in Reduction Scenario I—strengthening the sulfur content regulation of marine fuel from 3.5% to 0.5%—having targeted reductions in SOX, PM10, and PM2.5 emissions, without addressing NOX emissions. As a result, projected NOX concentrations remained largely unaffected, limiting the overall impact on air quality. Notably, on March 6 in Busan Port, a significant reduction in the estimated sulfate concentration was observed, and in general, periods with large decreases in sulfate levels were associated with more pronounced increases in nitrate levels. This behavior is closely related to the chemical interactions involving ammonia (NH3), sulfuric acid (H2SO4), and nitric acid (HNO3).
H2SO4, a key precursor of sulfate, reacts preferentially with atmospheric NH3 to form particulate compounds, such as (NH4)2SO4 and NH4HSO4, which then reach thermodynamic equilibrium in the atmosphere. Once the available NH3 is consumed in forming sulfate, any remaining NH3 reacts with HNO3 to produce nitrate [22,23,24]. Accordingly, under both Reduction Scenarios I and II—where projected SOX emissions were significantly reduced compared to BAU—the NH3 available for nitrate formation increased due to the limited formation of sulfate, leading to elevated estimated nitrate concentrations during those periods. These findings highlight that SOX reduction policies alone may lead to unintended side effects, such as increased nitrate formation due to excess atmospheric ammonia. Therefore, future emission reduction strategies should consider incorporating ammonia (NH3) controls as part of an integrated approach to effectively reduce secondary particulate matter concentrations in port areas.
The formation and removal of sulfate are influenced by several key physical processes, including aerosol processes (AERO), cloud processes and aqueous chemistry (CLDS), dry deposition (DDEP), horizontal advection (HADV), horizontal diffusion (HDIF), vertical diffusion (VDIF), and vertical advection (ZADV) [25].
During the study period, the estimated reduction in sulfate concentrations resulting from decreased port emissions appeared to be largely attributed to a decline in cloud processes (CLDSs). The CLDS term represents oxidation within cloud water, aqueous-phase chemical reactions, in-cloud transformation, and wet deposition [26]. Sulfate precursors, such as atmospheric sulfuric acid (H2SO4), are generated through both gas-phase reactions between SO2 and OH radicals and the aqueous-phase conversion of SO2 within cloud droplets [27,28,29]. Under the reduction scenarios, decreased SOX emissions led to a reduction in available SO2 for cloud-phase reactions, thereby resulting in a substantial decrease in sulfate formation.
Patterns in sulfate concentration changes can contribute to high PM2.5 episodes due to several factors, such as enhanced formation through active reactions with ammonia (NH3) or the influx of external air masses containing elevated sulfate levels [22,30]. These drivers vary depending on seasonal characteristics, highlighting the importance of detailed, context-specific analyses. Because this study focused on the month of March, which is associated with high ship traffic, further investigations are required to assess high PM2.5 episodes in port areas on a monthly or seasonal basis.
4. Conclusions
In this study, we analyzed the characteristics of high PM2.5 concentrations in the Republic of Korea’s major port areas, focusing on Incheon and Busan, which are classified as large-scale ports. To assess the effectiveness of emission reduction measures implemented since 2020, we estimated 2025 emission inventories under both the Business As Usual (BAU) Scenario and two reduction scenarios. Air quality simulations were conducted using the WRF-SMOKE-CMAQ modeling system.
An ionic composition analysis of PM2.5 revealed that although nitrate was the dominant species in the monthly averages during the study period, sulfate accounted for a higher proportion on high PM2.5 days. This pattern reflects the important role of ship emissions, particularly under high-pollution conditions, as NOX emissions in both Incheon and Busan were 3–4 times higher than SOX emissions. This dynamic resulted in an overall nitrate dominance, whereas high concentrations of sulfate during peak pollution episodes highlight the specific impact of ship-related SOX emissions.
Under Reduction Scenario I, which applied only the marine fuel sulfur regulation (3.5 to 0.5%), and Reduction Scenario II, which incorporated additional port-related emission controls, notable improvements in air quality were estimated. In Incheon Port, estimated PM2.5 concentrations saw small decreases under both reduction scenarios (approximately 5–6%), whereas estimated SO2 concentrations decreased more substantially (approximately 41–44%). In Busan Port, the improvements were more pronounced, with estimated PM2.5 reductions ranging between approximately 25 and 28% and estimated SO2 reductions ranging between approximately 69 and 74%.
Among the major ports, Busan showed the largest reduction in PM2.5 concentrations, followed by Incheon, Ulsan, and Pyeongtaek-Dangjin. For SO2, the improvement order was Busan > Incheon > Pyeongtaek-Dangjin > Ulsan. Although Ulsan has high ship traffic, its pollutant reduction rate was relatively limited due to dominant emissions from stationary sources, such as industrial complexes. Therefore, to ensure effective air quality management in Ulsan and its surroundings, reduction strategies targeting industrial processes, energy facilities, and manufacturing sectors should be integrated. Further research is required to evaluate source-specific contributions to air pollution, including detailed emission inventories and source apportionment studies.
Our findings confirm that even a single policy measure, such as lowering the sulfur content in marine fuels, could result in meaningful reductions in both PM2.5 and SO2 concentrations. This result suggests that focusing air quality management efforts on bunker C oil used in ships could be highly effective for improving air quality in port areas. Additionally, substantial improvements were projected in port zones as well as adjacent inland areas; this projection can be explained by the long atmospheric residence time and secondary formation characteristics of PM2.5, which allow for long-range transport. However, since the analysis was limited to a single month (March), the influence of long-range transport and seasonal variability may not have been fully captured, which introduces certain limitations in the generalization of the results. In future studies, we plan to conduct three-month simulations for each season to enable a more comprehensive and generalized analysis.
The estimated SOX reduction also led to a slight increase in nitrate concentrations. This finding can be explained by changes in ammonia (NH3) chemistry: with lower SOX emissions, less H2SO4 is formed, leaving more residual NH3 available to react with HNO3, thereby increasing nitrate formation. Accordingly, integrating NH3 reduction strategies into future port emission control policies may further enhance PM2.5 reduction effectiveness.
A limitation of this study is the absence of statistical evaluation for individual SIA components due to the lack of available observational data. As a result, while a model-based analysis of sulfate and nitrate behavior under emission scenarios was included, the results may have limited reliability compared to the PM2.5 evaluation. Future work should aim to incorporate direct observational comparisons for these components.
Author Contributions
Conceptualization, Y.S. and K.-H.H.; methodology, M.-S.K.; software, M.-S.K.; validation, K.-H.H., Y.S. and M.-S.K.; forma l analysis, M.-S.K.; investigation, J.-H.K.; resources, J.-H.K.; data curation, M.-S.K.; writing—original draft preparation, M.-S.K.; writing—review and editing, K.-H.H.; visualization, M.-S.K.; supervision, K.-H.H.; project administration, Y.S.; funding acquisition, Y.S. All authors have read and agreed to the published version of the manuscript.
Funding
This research received no external funding.
Institutional Review Board Statement
Not applicable.
Informed Consent Statement
Not applicable.
Data Availability Statement
The data presented in this study are available on request from the corresponding author. The data are not publicly available due to concerns related to the sensitive nature of the information.
Acknowledgments
The authors would like to express their sincere gratitude to the Ministry of Oceans and Fisheries of Korea for their valuable support. The meteorological input data used for the WRF model were obtained from the Final Operational Global Analysis (FNL) dataset provided by the National Centers for Environmental Prediction (NCEP). The emission inventory data used in the SMOKE–CMAQ modeling were sourced from the Clean Air Policy Support System (CAPSS) developed and managed by the National Institute of Environmental Research (NIER), Republic of Korea.
Conflicts of Interest
The authors declare no conflicts of interest.
References
- Kim, M.-J.; Baek, K.-M.; Heo, J.-B.; Cheong, J.-P.; Baek, S.-O. Concentrations, health risks, and sources of hazardous air pollutants in Seoul-Incheon, a megacity area in Korea. Air Qual. Atmos. Health 2021, 14, 873–893. [Google Scholar] [CrossRef]
- Zhao, T.-T.; Pham, T.-H.; Lee, H.-S. An study on estimating cargo handling equipment emission in the Port of Incheon. J. Korea Port Econ. Assoc. 2020, 36, 21–38. [Google Scholar] [CrossRef]
- Korea Maritime Institute (KMI). Establishment of the Measures for Fine Dust in Port Cities, KMI Trend Analysis. 2017, Vol. 28. Available online: https://www.kmi.re.kr/web/trebook/view.do?rbsIdx=273&page=31&idx=30 (accessed on 27 April 2025).
- Ali, M.; Hussain, I.; Mehmud, I.; Umair, M.; Hu, S.; Sharif, H.M.A. Recent Breakthroughs and Advancements in NOX and SOX Reduction using Nanomaterials-Based Technologies: A State-of-the-Art Review. Nanomaterials 2021, 11, 3301. [Google Scholar] [CrossRef]
- Windell, L.C. The Impact of Changing Shipping Emissions on the Atmospheric Deposition of Trace Elements and Sulfur to the Western English Channel and Coastal Zone. Pearl. Available online: https://pearl.plymouth.ac.uk/gees-theses/183 (accessed on 27 April 2025).
- Capaldo, K.; Corbett, J.J.; Kasibhatla, P.; Fischbeck, P.; Pandis, S.N. Effects of ship emissions on sulphur cycling and radiative climate forcing over the ocean. Nature 1999, 400, 743–746. [Google Scholar] [CrossRef]
- Eyring, V.; Köhler, H.W.; Van Aardenne, J.; Lauer, A. Emissions from international shipping: 1. The last 50 years. J. Geophys. Res. Atmos. 2005, 110. [Google Scholar] [CrossRef]
- Son, Y.K. A Study on Improvement Measurement on the Management of Air Pollution Matter from Ships; Korea Marimine & Ocean University: Busan, Republic of Korea, 2018; Available online: http://www.dcollection.net/handler/kmo (accessed on 27 April 2025).
- International Maritime Organization (IMO). Study on Effects of the Entry into Force of the Global 0.5% Fuel Oil Sulphur Content Limit on Human Health, Marine Environment Projection, MEPC 70/INF.34. 2016. Available online: https://edocs.imo.org/FinalDocuments/English/MEPC70-INF.34(E).docx (accessed on 27 April 2025).
- Park, H.; Cho, S. The effects of NH3 emission reduction on secondary inorganic aerosols evaluated by CMAQ. J. Korean Soc. Atmos. Environ. 2020, 36, 375–387. [Google Scholar] [CrossRef]
- National Institute of Environmental Research (NIER). Air Quality Modeling Guidelines; National Institute of Environmental Research (NIER), 2013; ISBN 978-89-6558-173-1. Available online: https://ecolibrary.me.go.kr/nier/#/search/detail/5568384 (accessed on 27 April 2025).
- Eder, B.; Yu, S. A performance evaluation of the 2004 release of Models-3 CMAQ. Atmos. Environ. 2006, 40, 4811–4824. [Google Scholar] [CrossRef]
- Yu, S.; Mathur, R.; Pleim, J.; Wong, D.; Gilliam, R.; Alapaty, K.; Zhao, C.; Liu, X. Aerosol indirect effect on the grid-scale clouds in the two-way coupled WRF–CMAQ: Model description, development, evaluation and regional analysis. Atmos. Chem. Phys. 2014, 14, 11247–11285. [Google Scholar] [CrossRef]
- Emery, C.; Liu, Z.; Russell, A.G.; Odman, M.T.; Yarwood, G.; Kumar, N. Recommendations on statistics and benchmarks to assess photochemical model performance. J. Air Waste Manag. Assoc. 2016, 67, 582–598. [Google Scholar] [CrossRef]
- Ministry of Environment (MOE). Special Measures to Respond to High Concentrations of Fine Dust (‘19.12~’20.3); Ministry of Environment: Sejong, Republic of Korea, 2019. Available online: https://spprmc.inha.ac.kr/spprmc/10824/subview.do;jsessionid=17FDD4B887F5FFED9352406730F1EFBF?enc=Zm5jdDF8QEB8JTJGYmJzJTJGc3Bwcm1jJTJGMjc1NiUyRjEzNzQyNSUyRmFydGNsVmlldy5kbyUzRg%3D%3D (accessed on 27 April 2025).
- Han, S.H.; Kim, Y.P. Long-term Trends of the Concentrations of Mass and Chemical Composition in PM2.5 over Seoul. J. Korean Soc. Atmos. Environ. 2015, 31, 143–156. [Google Scholar]
- Choi, J.; Park, R.J.; Lee, H.M.; Lee, S.; Jo, D.S.; Jeong, J.I.; Henze, D.K.; Woo, J.H.; Ban, S.J.; Lee, M.D.; et al. Impacts of local vs. trans-boundary emissions from different sectors on PM2.5 exposure in South Korea during the KORUS-AQ campaign. Atmos. Environ. 2019, 203, 196–205. [Google Scholar] [CrossRef]
- Jordan, C.E.; Crawford, J.H.; Beyersdorf, A.J.; Eck, T.F.; Halliday, H.S.; Nault, B.A.; Chang, L.S.; Park, J.; Park, R.; Lee, G.; et al. Investigation of factors controlling PM2.5 variability across the South Korean Peninsula during KORUS-AQ. Elem. Sci. Anthr. 2020, 8, 28. [Google Scholar] [CrossRef] [PubMed]
- Tang, B.; Saide, P.E.; Gao, M.; Carmichael, G.R.; Stanier, C.O. WRF-Chem quantification of transport events and emissions sensitivity in Korea during KORUS-AQ. Elem. Sci. Anthr. 2023, 11, 00096. [Google Scholar] [CrossRef]
- Bae, C.; Kim, B.-U.; Kim, H.C.; Yoo, C.; Kim, S. Long-Range Transport Influence on Key Chemical Components of PM2.5 in the Seoul Metropolitan Area, South Korea, during the Years 2012–2016. Atmosphere 2019, 11, 48. [Google Scholar] [CrossRef]
- Lee, H.W.; Won, G.M.; Jung, W.S.; Oh, E.J.; Kim, M.S.; Do, W.G. A numerical simulation of air pollutant concentration considering land and sea breeze in Ulsan area. J. Korean Environ. Sci. Soc. 2002, 11, 933–943. [Google Scholar] [CrossRef]
- Seoul Institute of Health & Environment (SIHE). Chemical Characteristics of Fine Dust(PM2.5) at Seoul in 2019; Seoul Institute of Health & Environment: Seoul, Republic of Korea, 2020; ISBN 979-11-6599-098-5. [Google Scholar] [CrossRef]
- Pinder, R.W.; Dennis, R.L.; Bhave, P.V. Observable indicators of the sensitivity of PM2.5 nitrate to emission reductions—Part I: Derivation of the adjusted gas ratio and applicability at regulatory-relevant time scales. Atmos. Environ. 2007, 42, 1275–1286. [Google Scholar] [CrossRef]
- Wang, M.; Xiao, M.; Bertozzi, B.; Marie, G.; Rörup, B.; Schulze, B.; Bardakov, R.; He, X.C.; Shen, J.; Scholz, W.; et al. Synergistic HNO3–H2SO4–NH3 upper tropospheric particle formation. Nature 2022, 605, 483–489. [Google Scholar] [CrossRef]
- Zhang, Q.; Xue, D.; Liu, X.; Gong, X.; Gao, H. Process analysis of PM2.5 pollution events in a coastal city of China using CMAQ. J. Environ. Sci. 2018, 79, 225–238. [Google Scholar] [CrossRef]
- Liu, P.; Zhang, Y.; Yu, S.; Schere, K.L. Use of a process analysis tool for diagnostic study on fine particulate matter predictions in the U.S.–Part II: Analyses and sensitivity simulations. Atmos. Pollut. Res. 2010, 2, 61–71. [Google Scholar] [CrossRef]
- Park, S.S.; Cho, S.Y.; Kim, S.J. Chemical characteristics of water soluble components in fine particulate matter at a Gwangju area. Korean Chem. Eng. Res. 2009, 48, 20–26. [Google Scholar]
- Cefalì, A.M. Systems and Technologies for the Implementation of Proficiency Tests Applied to Gaseous Micropollutants. Ph.D. Thesis, University of Milano-Bicocca, Milan, Italy, 2024. Available online: https://boa.unimib.it/retrieve/22152f64-1542-43bd-b778-2274b61d1b5f/phd_unimib_755646.pdf (accessed on 27 April 2025).
- Williams, J.; Metzer, S.; Remy, S.; Huijnen, V.; Flemming, J. An Evaluation of the Regional Distribution and Wet Deposition of Secondary INORGANIC Aerosols and Their Gaseous Precursors in IFS-COMPO Cycle 49R1; European Geosciences Union: Vienna, Austria, 2024. [Google Scholar]
- Xie, F.; Su, Y.; Tian, Y.; Shi, Y.; Zhou, X.; Wang, P.; Yu, R.; Wang, W.; He, J.; Xin, J.; et al. The shifting of secondary inorganic aerosol formation mechanisms during haze aggravation: The decisive role of aerosol liquid water. Atmos. Chem. Phys. 2023, 23, 2365–2378. [Google Scholar] [CrossRef]


Disclaimer/Publisher’s Note: The statements, opinions and data contained in all publications are solely those of the individual author(s) and contributor(s) and not of MDPI and/or the editor(s). MDPI and/or the editor(s) disclaim responsibility for any injury to people or property resulting from any ideas, methods, instructions or products referred to in the content. |
© 2025 by the authors. Licensee MDPI, Basel, Switzerland. This article is an open access article distributed under the terms and conditions of the Creative Commons Attribution (CC BY) license (https://creativecommons.org/licenses/by/4.0/).