Article

Automatic Detection of Whistler Waves in the Top-Side Ionosphere: The WhISPER Technique

by
Dario Recchiuti
1,2,*,
Roberto Battiston
1,3,
Giulia D’Angelo
2,4,
Emanuele Papini
2,
Coralie Neubüser
1,3,
William Jerome Burger
1,3 and
Mirko Piersanti
2,4,5
1
Department of Physics, University of Trento, 38123 Trento, Italy
2
National Institute of Astrophysics—IAPS, 00133 Rome, Italy
3
TIFPA—Trento Insitute for Fundamental Physics and Applications, 38123 Trento, Italy
4
Department of Physical and Chemical Sciences, University of L’Aquila, 67100 L’Aquila, Italy
5
INFN—Sezione di Roma “Tor Vergata”, 00133 Rome, Italy
*
Author to whom correspondence should be addressed.
Atmosphere 2025, 16(5), 522; https://doi.org/10.3390/atmos16050522
Submission received: 31 March 2025 / Revised: 21 April 2025 / Accepted: 27 April 2025 / Published: 29 April 2025

Abstract

:
We introduce the Whistler Identification by Spectral Power Estimation and Recognition (WhISPER) algorithm, a novel automated technique for detecting whistler waves in the top side of the Earth’s ionosphere. WhISPER is the first step towards a comprehensive system designed to accumulate and analyze a large dataset of whistler observations, which has been developed to advance our understanding of whistler generation and propagation. Unlike conventional image-correlation-based techniques, WhISPER identifies whistlers based on their energy content, enhancing computational efficiency. This work presents the results of applying WhISPER to four years (2019–2022) of top-side ionospheric magnetic field data. A statistical analysis of over 800,000 detected whistlers reveals a strong correlation with lightning activity and (as expected) higher occurrence rates during local summer months. The presented results demonstrate the excellent performance of the WhISPER technique in identifying whistler events.

1. Introduction

Whistlers, as an invaluable natural resource for diagnosing the entire circumterrestrial space, have played a significant role in upper atmospheric and space physics since the pioneering works by Storey (1953) [1], Helliwell et al. (1956) [2], and Smith et al. (1960) [3]. Primarily employed to determine plasma density [4,5,6], whistlers have proven to be versatile tools for exploring the Earth’s magnetosphere and ionosphere. Notable applications include measuring ionosphere–plasmasphere coupling [7], the discovery of the plasmapause [8], and the development of an empirical model of equatorial electron density in the magnetosphere [9]. Recent studies have also suggested that whistler waves can efficiently accelerate electrons in the outer radiation belt [10,11], potentially leading to electron precipitation into the upper atmosphere [12,13].
Despite decades of investigations, whistler-mode wave particle interactions remain an active area of research, and the importance of whistlers on radiation belt electron losses is still debated [14,15]. Moreover, their effects on the terrestrial electromagnetic environment are not entirely understood, with several unresolved questions remaining [16]. Large-scale data analysis of whistlers represents the most promising approach to address these open scientific problems. Given the variability of the geomagnetic environment, collecting a statistically significant number of “clean” events can take weeks or even years [17,18,19]. As manual identification of such events is a time-consuming and inefficient process, automatic detection tools are an essential requirement for this type of analysis [20].
The major challenge in implementing automatic signal detection methods lies in distinguishing the signal of interest from background noise [19,20]. Furthermore, the non-stationary nature of whistler waves, characterized by rapidly varying frequencies, poses a significant challenge to accurate feature extraction using conventional spectral analysis techniques [21]. Several whistler detection techniques leverage their falling tone frequency pattern in a time-frequency spectrum (see e.g., Figure 1 in [22], Figure 1 in [23] or Figure 2a in [24], reporting typical Very-Low-Frequency (VLF) records of a whistler in time-frequency spectra). The Automatic Whistler Detector (AWD) method [22] pioneered this type of detection technique. This method is based on image correlation between a time-frequency spectrum obtained using Short Time Fourier Transforms (STFTs) and a model whistler (the model whistler is generated by the Bernard approximation [25]). Following this approach, several recognition methods have been proposed (e.g., [26,27,28]), employing different image processing and noise removal techniques in the attempt to improve the effectiveness of the method. While these methods have demonstrated significant value, they are not without limitations. Specifically, they are susceptible to image noise and exhibit reduced accuracy in noisy environmental conditions [18].
In recent years, deep learning methods based on Convolutional Neural Networks (CNNs) have also been explored [20,29]. However, while offering potential for automated whistler detection, the deep architectures employed by these methods preclude a clear understanding of the specific criteria and decision-making processes employed in whistler identification. Furthermore, such methods require substantial computational resources and time (e.g., in [30], the authors employed a system with an NVIDIA Corporation GV100GL GPU with a memory size of 32 GB; in [20], the authors utilized an NVIDIA TITAN V GPU and required 3.2 h of training for a dataset of 1038 spectrograms).
In this study, we present the newly developed WhISPER algorithm for whistler detection, which bypasses time-frequency spectra image generation and analysis, thereby eliminating the requirement for GPU computations and resulting in exceptional computational efficiency. By analyzing approximately four years (2019–2022) of magnetic field data from the first satellite of the China Seismo-Electromagnetic Satellite (CSES) constellation, we conducted a statistical study of whistler occurrences, revealing their spatial and temporal distribution within the middle-to-low latitude (from −40 ° to 40 ° ), top-side ionosphere.
The manuscript is organized as follows: Section 2 describes the data and methods employed in this analysis; Section 3 presents the results of applying the WhISPER technique; finally, Section 4 provides a discussion of the results and presents the key conclusions drawn from this study.

2. Data and Methods

In the present study, we used data from CSES-01, the first satellite of the CSES (China Seismo-Electromagnetic Satellite) constellation. The CSES mission is a collaboration between the China National Space Administration (CNSA) and the Italian Space Agency (ASI), which aims to obtain global data of the electromagnetic field, plasma, and energetic particles in the top-side ionosphere and inner Van Allen radiation belts [31].
CSES-01 was launched on a Sun-synchronous quasi-polar orbit (with an altitude of 507 km) on 2 February 2018 [32]. Its payloads include a plasma analyser package (PAP), a Langmuir probe (LAP), the High-Energy Particle Package (HEPP) and High-Energy Particle Detector (HEPD), a tri-band beacon (TBB), a search coil magnetometer (SCM), an electric field detector (EFD), a high-precision magnetometer (HPM), and a global navigation satellite system occultation receiver (GOR). All payloads are planned to work continuously in the region between −65 ° and 65 ° of latitude [32]. The present study is based on EFD and SCM vector data. The observation data are organized into ascending (nocturnal) and descending (diurnal) orbits separately, with each half orbit (hereafter semiorbit) lasting approximately 34 min.

2.1. Search Coil Magnetometer

The Search Coil Magnetometer (SCM) is a three-axis search coil magnetometer that measures varying magnetic fluxes across the multiple frequency bands detailed in Table 1 [33].
Since frequency range of whistlers rarely exceeds 20 kHz [22,34], we focused on the Extreme-Low-Frequency (ELF) band. In such band, SCM provides (1) magnetic field waveform data sampled at 10.24 kHz and expressed in nTand (2) Power Spectral Density (PSD) data expressed in nT 2 Hz 1 . PSD data are obtained with a STFT in 400 ms length windows. The frequency range extends from f M I N 200 Hz to f M A X 2200 Hz, with a frequency resolution of ∼2.5 Hz, resulting in a total of ∼801 frequency bins.

2.2. Electric Field Detector

Electric Field Detector (EFD) measures the electric potentials of four spherical sensors, located at the end of four 4.5 m long booms, relative to the spacecraft potential [35], and derives the electric field in the frequency bands detailed in Table 2 [36]. Consistent with the SCM analysis, we focus on the ELF band. In this band, EFD provides electric field waveform data, sampled at 5 kHz and expressed inmV/m; PSD data, presented as the square root of the power spectral density (mV/m Hz 1 / 2 ). PSD data are derived via STFT using 409.6 ms length windows. The frequency range extends from DC to f M A X 2200 Hz (since ELF band for EFD also includes the Ultra-Low-Frequency band), with a frequency resolution of ∼2.44 Hz, resulting in a total of ∼1024 frequency bins.

2.3. Geomagnetic Activity Data

Geomagnetic activity at mid/low latitudes (between −40 ° and 40 ° ) is typically characterized by the SYM-H index [37], which reflects the intensity of the symmetric ring current [38]. Therefore, to assess the impact of geomagnetic activity on whistler detection, we utilized SYM-H data to categorize monitored days for the whistler detection as quiet, disturbed, or stormy, following the methodology outlined in [39]. Briefly, for each day within the period from January 2019 to December 2022, an average SYM-H value ( SYM H ¯ ) is calculated. The day is then classified as follows:
D Q : SYM H ¯ [ 10 nT , 10 nT ]
D D : SYM H ¯ [ 40 nT , 10 nT ]
D S : otherwise
where D Q , D D , and D S represent quiet, disturbed, and stormy days, respectively. Data for this analysis were obtained from the OMNI database (https://cdaweb.gsfc.nasa.gov/index.html, accessed 3 September 2024), which serves as a comprehensive compilation of solar wind data, interplanetary magnetic-field data, solar and geomagnetic indices, and energetic particle fluxes [40].

2.4. Detection Algorithm

WhISPER directly utilizes PSD data provided by the satellite to enhance computational speed. Given the typical duration of whistler waves (see, e.g., [41]) their presence should manifest as an enhanced PSD across a broad frequency range within the temporal window (TW) employed for both EFD and SCM PSD calculation. Specifically, to explicitly illustrate the expected enhancement, the WhISPER technique leverages the Integrated PSD (IPSD), defined as follows:
I P S D i = j M I N j M A X P S D i f j
where i = x , y , z represents the electric or magnetic field component and f j is the frequency corresponding to bin index j. The inclusion of frequency f j as a weighting factor emphasizes the initial, high-frequency portion of whistler waveforms. As detailed in Section 2.1 and Section 2.2, the upper frequency bin index j M A X is equal to 801 for SCM and to 1024 for EFD. Regarding the lower-frequency bin index j M I N , it was set to 1 for SCM and 30 for EFD. This distinction arises from the EFD-ELF data’s inclusion of frequencies starting from DC, therefore including the long-term trend constituting the ionospheric background and peculiar low-frequncy ionospheric signals characterized by high PSD, such as Schumann resonances (SR, ∼6–30 Hz, [42]) and the first Power Line Harmonic Radiation (PLHR, 50–60 Hz, [43]). Consequently, the summation for EFD data starts from ∼73 Hz, equivalent to j M I N = 30 . The necessity of excluding low-frequency components from the summation is demonstrated in Figure 1, which compares the IPSD calculated using j M I N = 1 (Panel 1a) and j M I N = 30 (Panel 1b) for EFD-ELF data recorded on 18 August 2020. As shown in Figure 1a, a small peak emerges in the IPSD at approximately 05:50 UT, observable in both the X and Y components. The removal of the lowest frequency components, as shown in Figure 1b, greatly emphasizes this peak, showing how the long-term trend (due to the satellite’s motion along its orbit) and low-frequency noise (primarily below 60 Hz, as discussed before) hinder the detection of this peak.
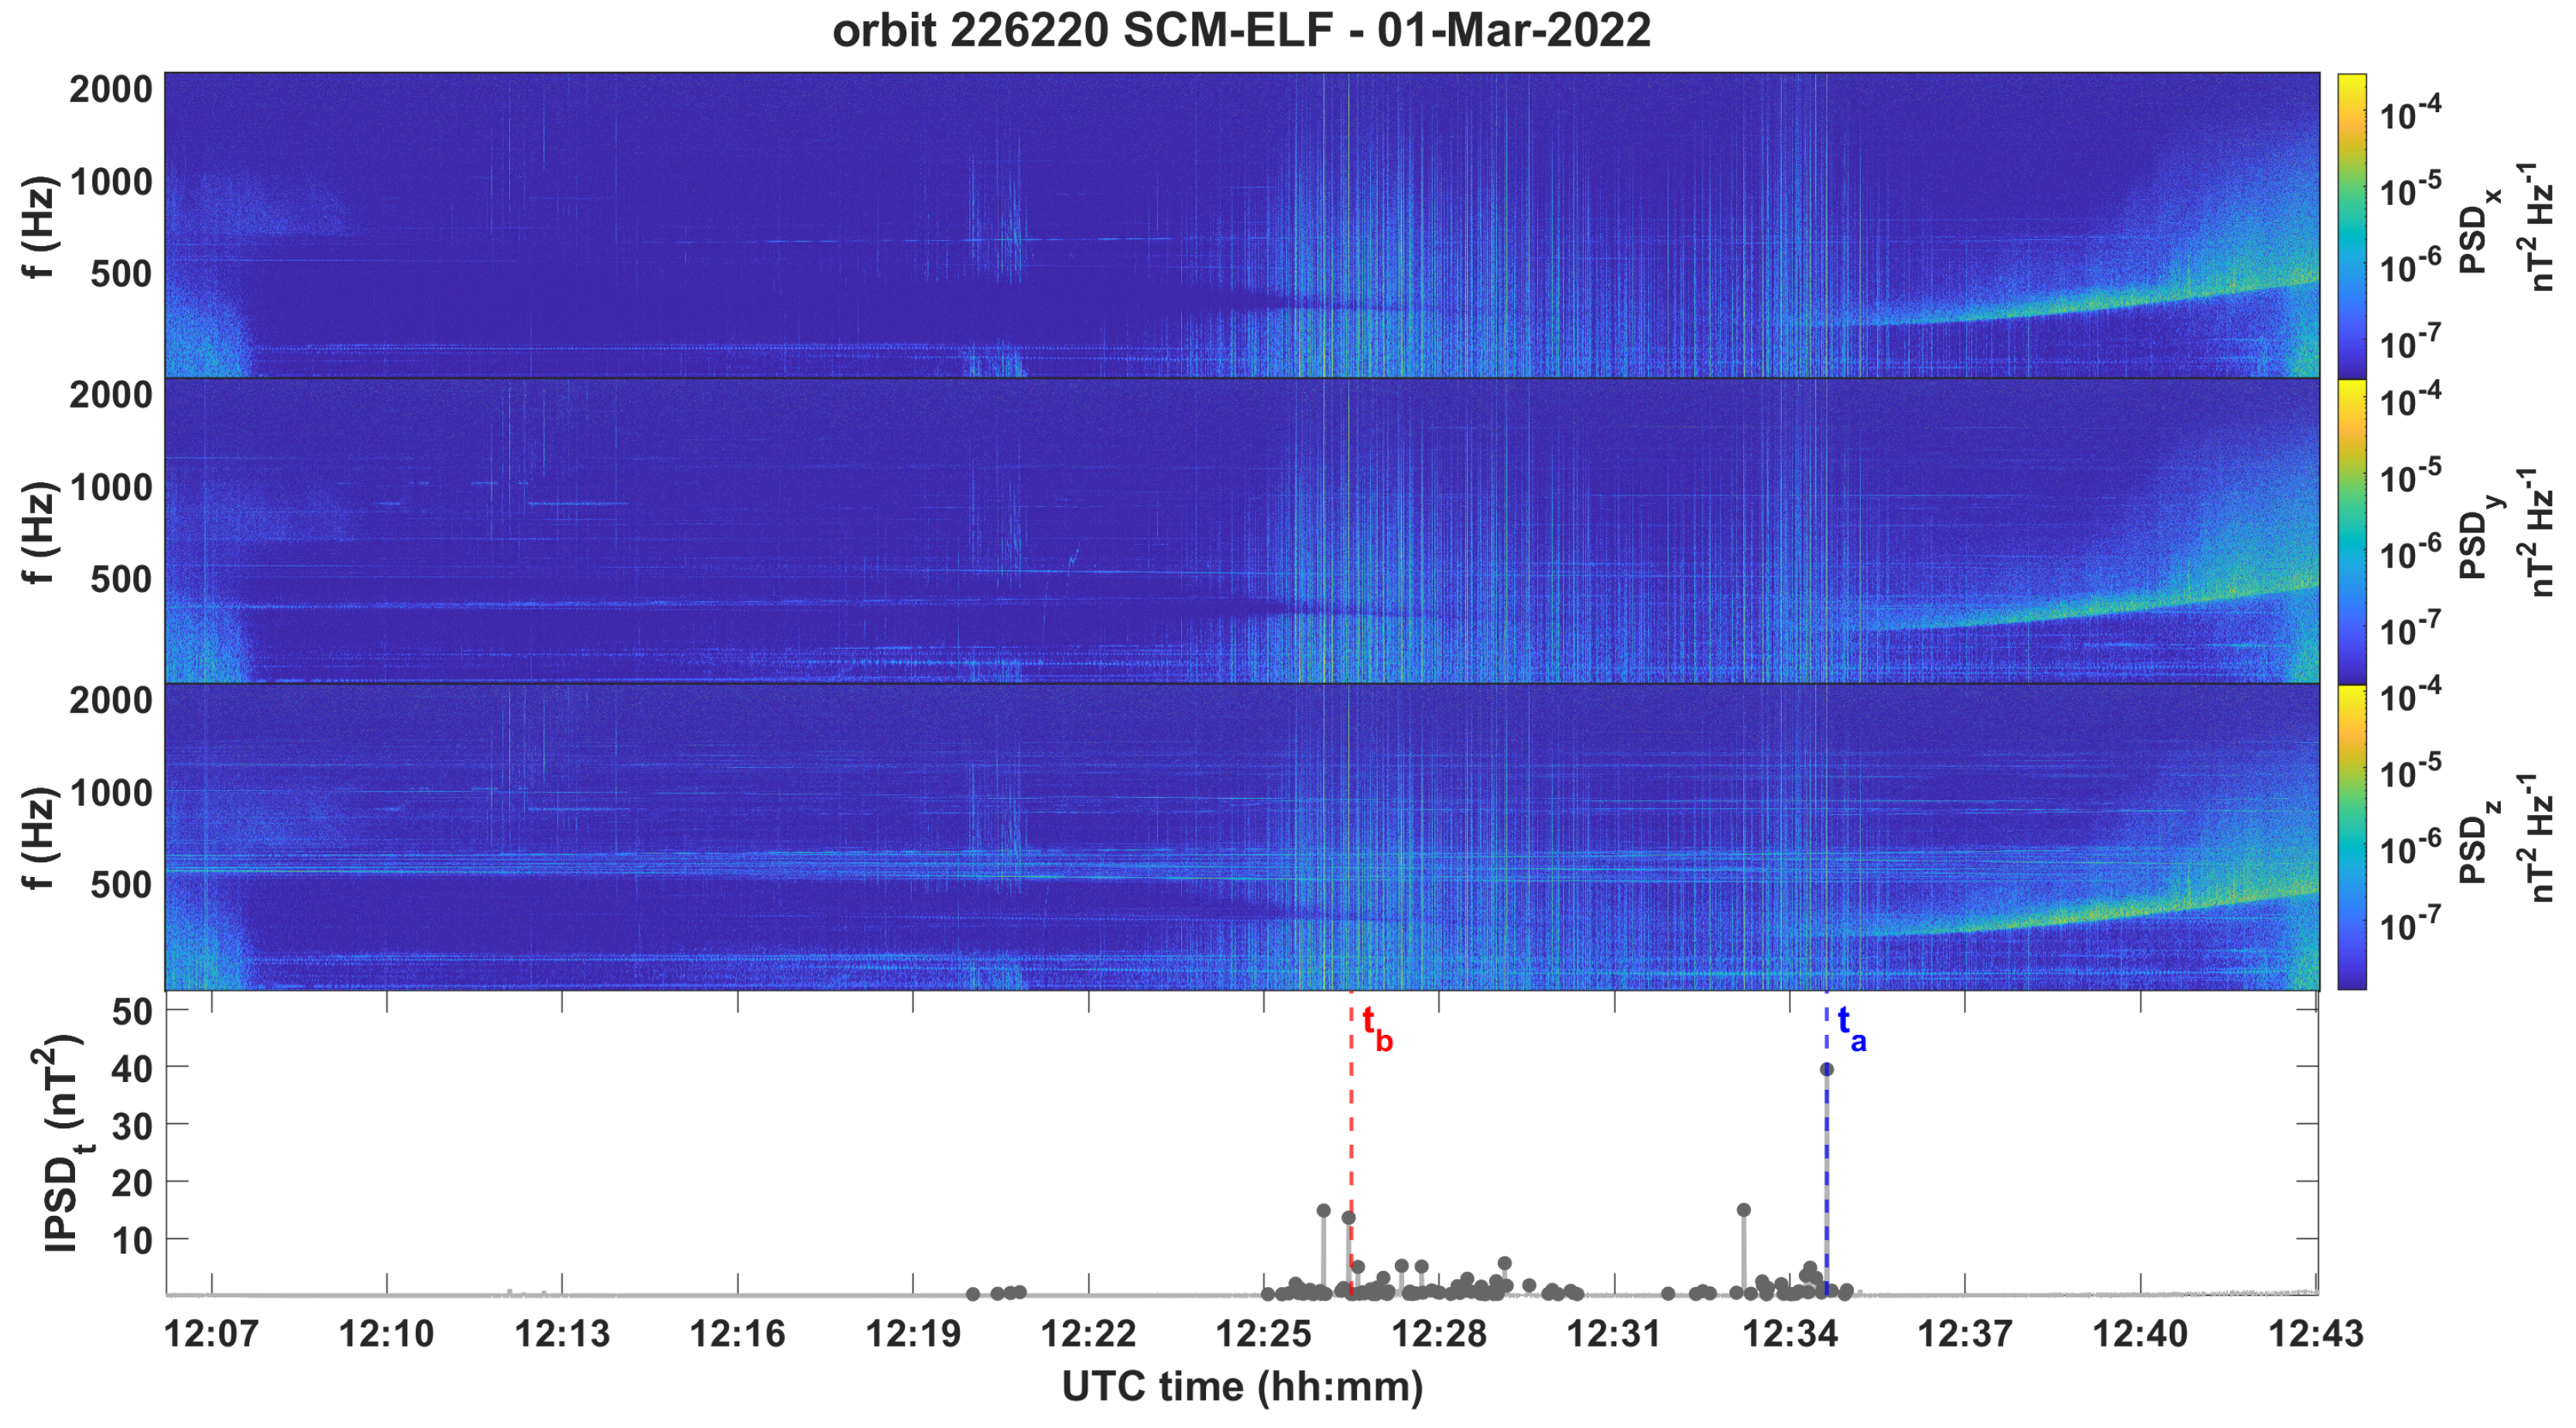
The identification of peaks within the IPSD forms the foundational step of WhISPER. Figure 2 (top three panels) illustrates SCM-ELF PSD data from the diurnal semiorbit 226220 (1 March 2022), with the X, Y, and Z magnetic field components (from top to bottom) visualized as time-frequency spectrograms. The bottom panel presents the total Integrated Power Spectral Density ( IPSD t ), obtained by summing IPSD x , IPSD y and IPSD z , with local maxima (grey dots) identified using the MATLAB R2024a built-in function “findpeaks”. Vertical dashed lines highlight the most prominent peak (blue), detected at t a = 12:34:37.973 UT, and a representative minor peak (red), identified at t b = 12:26:29.495 UT.
As observed in the top three panels of Figure 2, no discernible whistler signature is evident within the spectrograms, apparently suggesting the absence of whistler waves at the identified IPSD peaks locations. However, this may be attributed to the limited temporal resolution inherent in the satellite’s PSD data. To confirm the presence of whistler waves associated with detected IPSD peaks, we investigated the signal waveform and performed high-resolution time-frequency spectrograms within a 2 s time window centered on each peak. Specifically, we calculated a STFT by sliding an analysis window of length N data points over the signal with no overlapping and performing a discrete Fourier transform (DFT) on each windowed segment. The window length N was set to 32 for EFD and 64 for SCM, resulting in frequency resolutions of 156.25 Hz and 160 Hz for electric and magnetic field data, respectively. The time resolution was approximately 6 ms both for SCM and EFD.
Figure 3 illustrates waveforms (left panels) and spectrograms (right panels) for the most prominent IPSD peak, detected at t a (blue dashed line in Figure 2). In the left panels, a vertical dashed line marks the detection time ( t a ). As from left panels, the algorithm accurately identifies the onset of an oscillatory signal with a maximum amplitude of approximately 0.5 nT in all three components. The spectrograms (right panels) clearly reveal a typical whistler signature, characterized by the distinctive falling tone frequency chirped structure. The signal duration is approximately 0.5 s and the maximum frequency is ∼3.8 kHz.
Figure 4 presents waveforms and spectrograms associated with a representative minor IPSD peak, detected at t b (red dashed line in Figure 2). As in the previous case, the local maximum in the IPSD is temporally aligned with the onset of a whistler wave. In fact, even if the maximum signal amplitude reaches approximately 0.05 nT (Y and Z components, left panels) and both the waveforms and the corresponding spectrograms (right panels) exhibit higher noise levels than those shown in Figure 3 (here, the signal-to-noise ratio SNR is ∼ 10 2 , a value notably lower than the ∼ 10 3 observed in the previous case), the characteristic falling tone structure associated with whistlers remains clearly discernible (right panels). The X component is characterized by smaller amplitude of the waveform and a noisier spectrum with respect to Y and Z, suggesting a circular polarization for the whistler wave on the YZ plane. The duration and frequency range of this event are comparable to the previous case.
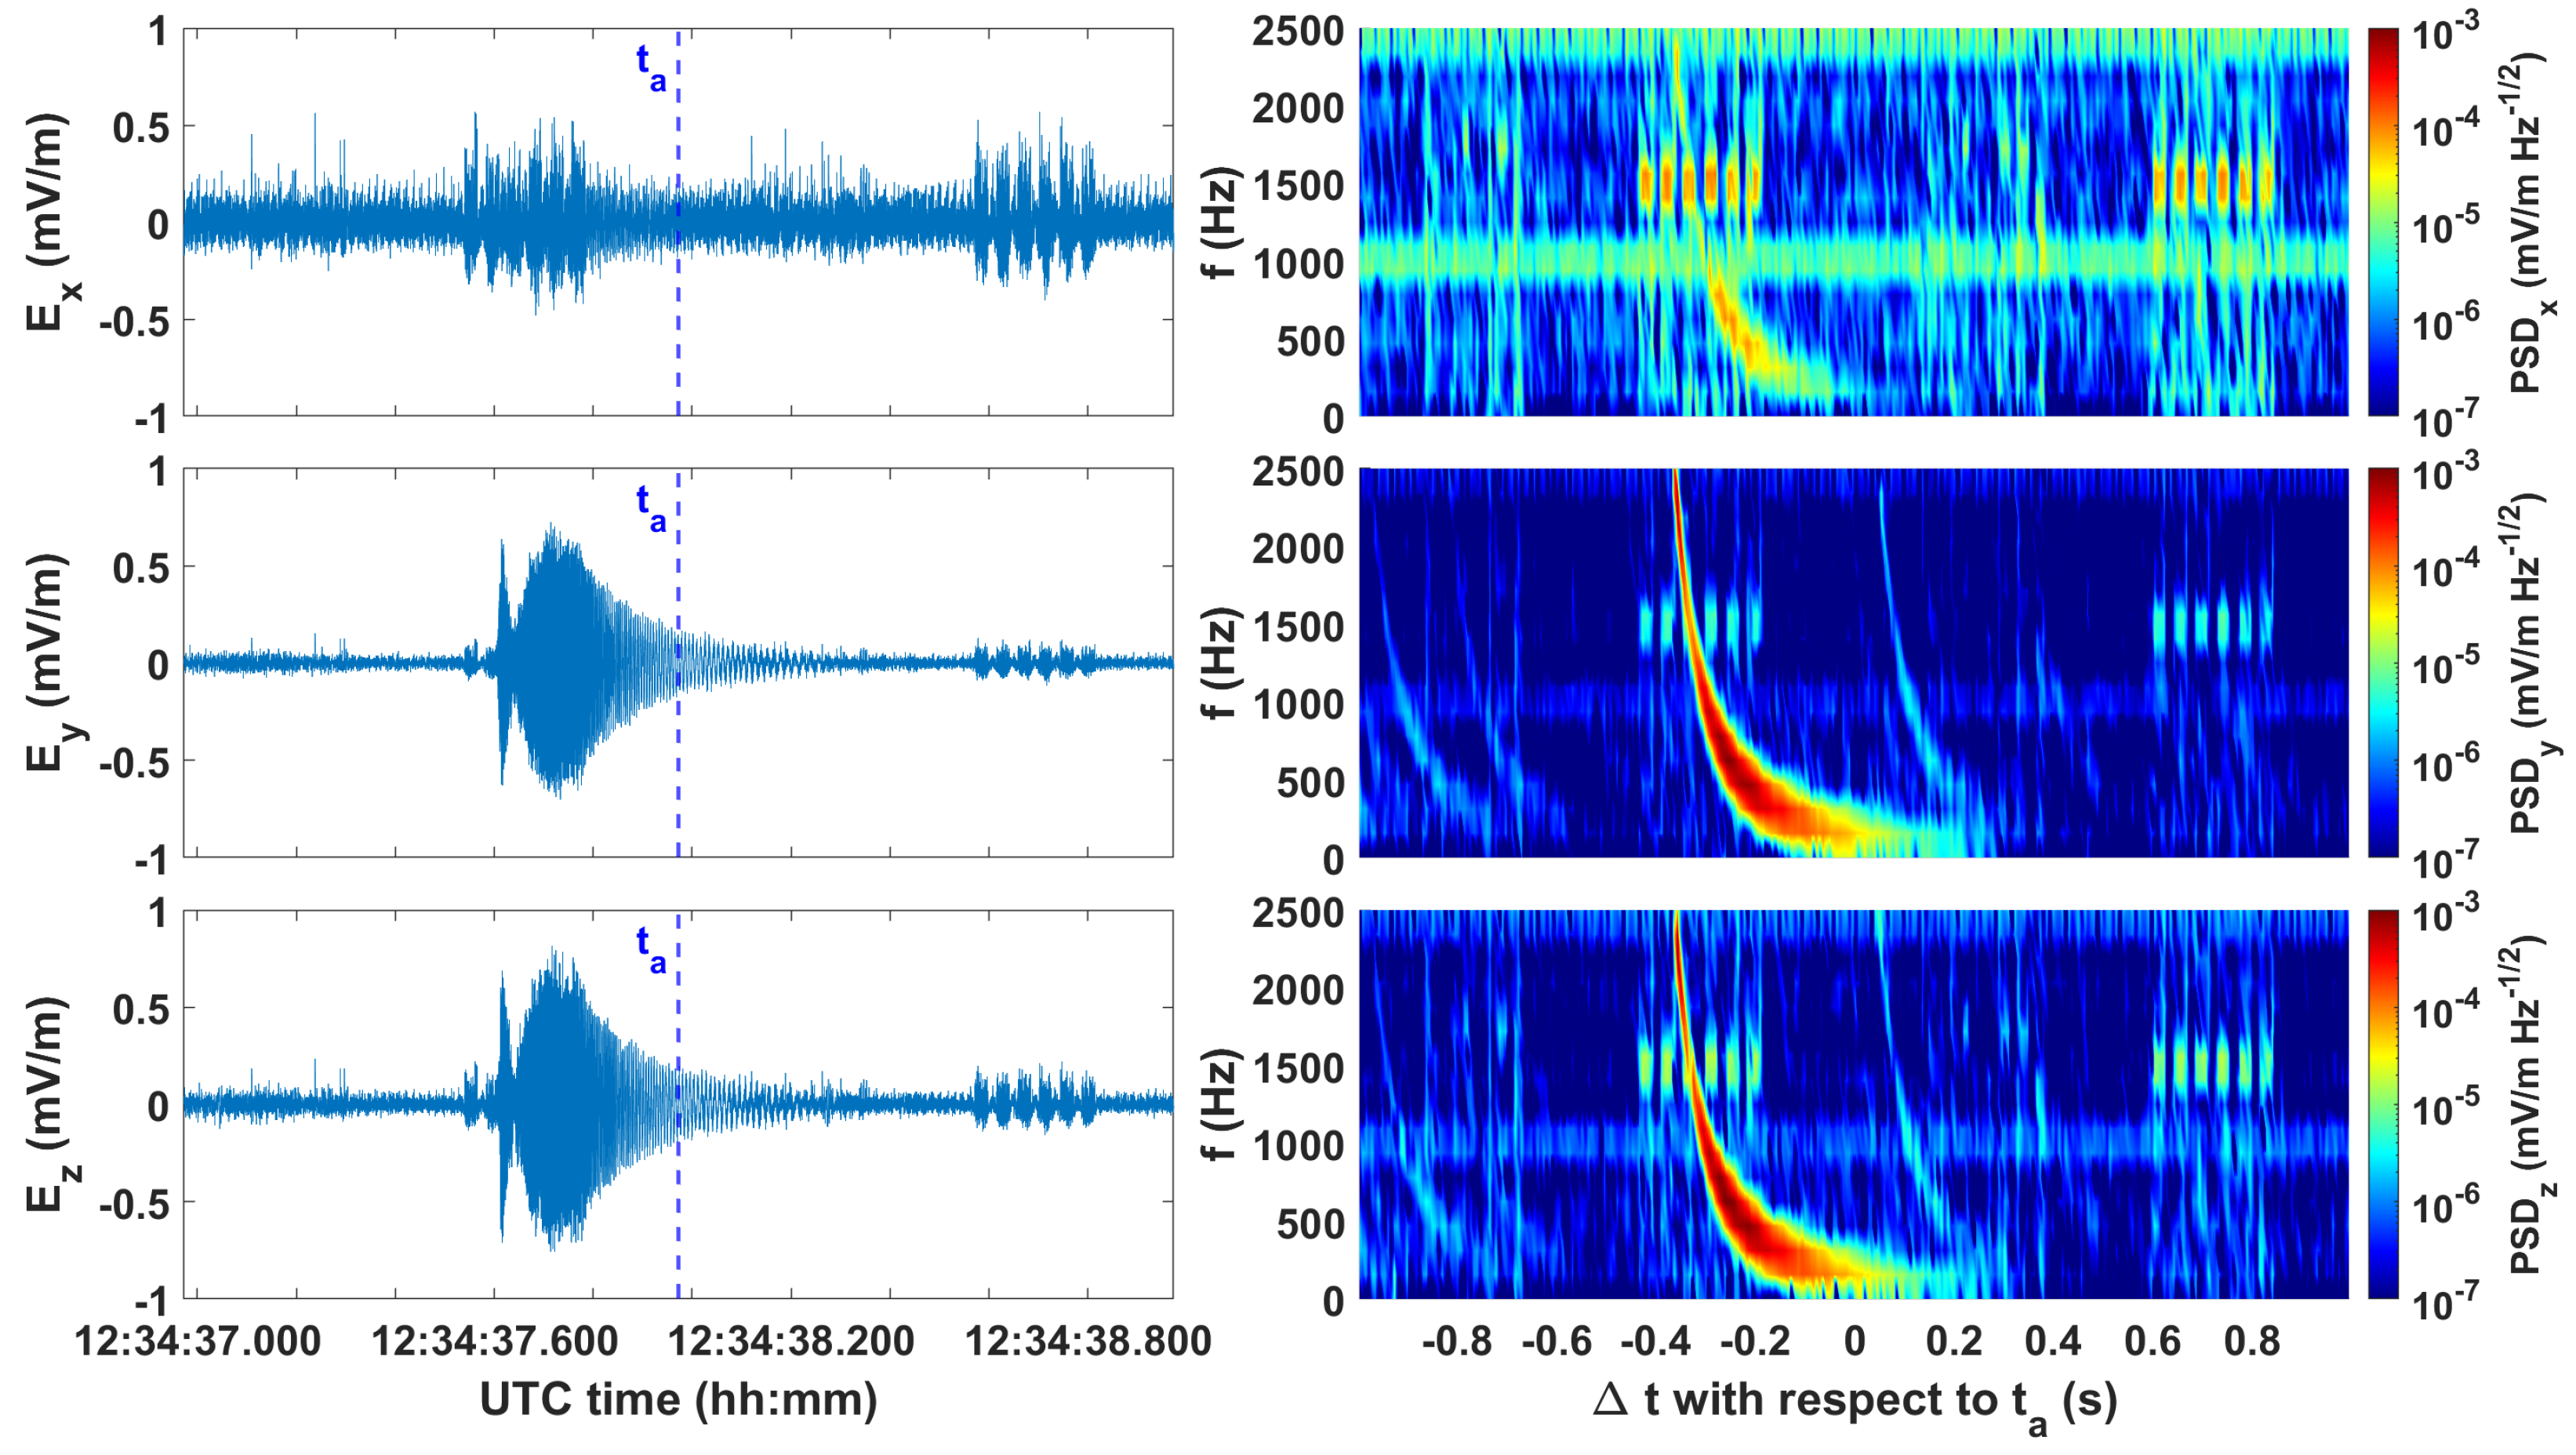
Electric field observations acquired during the same semiorbit are depicted in Figure 5. Spectrograms and IPSD t exhibit a high noise level in the central portion of the orbit, coinciding with the satellite’s passage over low-latitude regions (usually in the range between −30 ° and 30 ° , corresponding to the yellowish central part of spectrograms in Figure 5). The noise affecting EFD observations is attributed to mechanical friction induced by the vibration of boom-B, which is more pronounced at low latitudes, during summer and daylight due to increased photoionization (see [35] and references therein).
Particularly for diurnal semiorbits as the one illustrated in Figure 5, despite the IPSD calculation for EFD commencing from J M I N = 30, the yellowish part of the spectrograms corresponds to a wide region of enhanced IPSD t . This broad enhancement can complicate the identification of well-defined IPSD peaks. Hence, to verify the presence of a whistler wave also in the electric field data, we examined the electric field waveforms within narrow time windows (≃2 s) centered around t a and t b (blue and red dashed lines, respectively, in Figure 2). To mitigate noise, prior to STFT, noise reduction techniques were applied to the electric field data. This preprocessing phase included detrending to remove ionospheric long-term trend (due to satellite’s motion along its trajectory) and a high-pass filter with a cutoff frequency of f c o = 60 Hz to suppress low-frequency disturbances, which primarily affect frequencies below f c o (as previously discussed). This process was implemented using the built-in “detrend” and “highpass” functions in MATLAB R2024a.
As for Figure 6 and Figure 7 showing waveforms (left panels) and spectrograms (right panels) computed around t a and t b , respectively, despite the preprocessing, in both cases, waveforms and spectrograms exhibit significant noise levels characterized by beats at approximately 1.5 kHz. In addition, two continuous bands at ≃1 kHz and ≃2.2 kHz are observed (particularly in the X component). As explained in [44,45], the 1 kHz signal corresponds to plasmaspheric hiss, while the ≃2.2 kHz signal could be the second harmonic of the same signal.
In the case of the largest SCM IPSD peak corresponding to the blue dashed line at t a whose electric field waveforms and spectrograms are shown in Figure 6, the characteristic whistler signature is still clearly discernible in the Y and Z components (SNR∼ 10 2 , central and bottom right panels), while it is partially concealed by the noise in the X component (SNR∼1, top right panel). Figure 7 shows electric field waveforms (left panels) and spectrograms (right panels) corresponding to the representative minor peaks identified at t b (red dashed line in Figure 2). In this case, the whistler signature is almost completely obscured by noise (SNR below 10 1 ).
A comparison between Figure 3 and Figure 6 showing the waveforms and spectrograms computed around t a for magnetic and electric observations, respectively, reveals the well-known lack of synchronization between SCM and EFD, which is due to differences in hardware and software implementations between the two instruments [46,47].
These findings highlight significant challenges associated with utilizing electric field data for whistler studies. In practice, only the most prominent events are discernible in electric field observations, and they are partially concealed by the noise. Given the primary objective of this study to develop a computationally efficient whistler detection technique for the top-side ionosphere, the final stages of the WhISPER algorithm were optimized specifically for SCM observations. Indeed, as demonstrated in Figure 5, Figure 6 and Figure 7, EFD data exhibit higher noise levels (SNR is reduce by a factor of ∼ 10 2 ) and require extensive preprocessing to reveal clear whistler signatures, which significantly impact computational efficiency. The development of techniques for EFD data cleansing and the implementation of a precise synchronization mechanism between EFD and SCM for a joint magnetic and electric field analysis, essential to determine all the characteristics of detected the whistler waves, will be addressed in a forthcoming paper (hereafter Part 2).

2.5. Selection Thresholds

To validate the identification of IPSD peaks as a method for whistler detection within the top-side ionosphere, we performed a detailed visual analysis of 1346 spectrograms, generated using the methodology detailed in the preceding section. The validation process was conducted on 1346 local maxima identified within the IPSD t of SCM-ELF data. These maxima were selected from randomly chosen diurnal and nocturnal semiorbits, spanning various years, seasons, and geomagnetic conditions, to rigorously evaluate the efficacy of WhISPER across diverse scenarios. For each identified local maximum, the following quantities were computed:
  • peak amplitude: IPSD t [ nT 2 ];
  • peak prominence: P r , which is a measure of how much the peak stands out relative to other peaks [ nT 2 ];
  • peak prominence-to-amplitude ratio: R [dimensionless];
  • peak width: W, expressed as a multiple of the temporal window (TW) employed for SCM PSD calculations (400 ms).
The selection is applied to the total IPSD in order to take into account enhancements in a single or multiple component(s). To filter out signals with characteristics inconsistent with whistler waves, we applied the following selection criteria to these quantities:
  • IPSD t > T 1 ;
  • P r > T 2 ;
  • R = P r IPSD t > T 3 ;
  • W < T 4 · TW.
Condition 1 imposes a threshold, T 1 , on IPSD t , selecting only local maxima whose peak amplitude exceeds this threshold. This condition excludes low-energy peaks, filtering out very faint signals. Conditions 2 and 3 impose thresholds T 2 and T 3 , respectively on P r and R, filtering out peaks located within regions of broad spectral enhancement, which are inconsistent with typical whistler wave characteristics. Condition 4 restricts peak width, retaining only local maxima with extents consistent with the typical temporal duration of whistlers.
To determine the optimal threshold parameters ( T 1 , T 2 , T 3 , T 4 ) that accurately select all and only peaks associated with whistler waves, three distinct parameter sets were evaluated, utilizing visual inspection of spectrograms from the subset of 1346 randomly chosen local maxima. The first parameter set was derived from an analysis of the peak identified at t b (red dashed line in Figure 2), which was characterized by IPSD t = 0.31 nT 2 , P r = 0.28 nT 2 , R = 0.87 , and W = 1.21 TW. As illustrated in Figure 4, a clear whistler wave is associated with this peak, despite its low amplitude waveform (<0.1 nT) and increased spectrogram noise (SNR is reduce by a factor∼10) relative to the largest IPSD peak (shown in Figure 3). Consequently, the first parameter set was configured to identify events similar to that shown in Figure 4, specifically T 1 = 0.28 nT 2 , T 2 = 0.25 nT 2 , T 3 = 0.5 , and T 4 = 2 . The second and third parameter sets were chosen to provide varying degrees of selection stringency. Specifically, the second set applies more stringent thresholds with respect to Set 1, while the third set utilizes less stringent thresholds with respect to Set 1. The values for all three parameter sets are detailed in Table 3.
The validation results for the three parameter sets are presented in Table 4, which details the following classification outcomes:
  • P (actual positive): spectrograms visually classified as containing whistler waves;
  • N (actual negative): spectrograms visually classified as not containing whistler waves;
  • TP (true positive): events confirmed as whistlers by the visual inspection and correctly classified as whistlers by WhISPER;
  • FN (false negative): events confirmed as whistlers by the visual inspection but incorrectly classified as non-whistlers by WhISPER;
  • FP (false positive): events confirmed as non-whistlers by the visual inspection but incorrectly classified as whistlers by WhISPER;
  • TN (true negative): events confirmed as non-whistlers by the visual inspection and correctly classified as non-whistlers by WhISPER.
The comparative performance of the parameter sets, as detailed in Table 4, indicates that Sets 1 and 3 achieve a high true positive count. However, Set 3 exhibits a poor performance in detecting true negatives. Conversely, Set 2 excels in true positive detection but exhibits a significantly elevated false negative rate. To quantify the accuracy of each parameter set, we employed the metric ACC k = TP k + TN k P k + N k , where k = 1 , 2 , 3 denotes the Parameter Set. Set 1 demonstrated superior accuracy, achieving ACC 1 96 % , compared to ACC 2 42 % and ACC 3 92 % for Sets 2 and 3, respectively. Accuracy and other important metrics utilized for the evaluation of the three parameter sets are reported in Table 5. As evident from the table, Parameter Set 2 demonstrates excellent performance in True Negative Rate (TNR) but exhibits a low True Positive Rate (TPR). Conversely, Parameter Set 3 shows the opposite trend, while Parameter Set 1 achieves outstanding performance in both TPR and TNR.

3. Results

Although the generation and propagation mechanisms of whistlers are relatively well understood, the location and extent of lightning source region for the observed whistlers remain uncertain [48]. Moreover, the geophysical conditions governing whistler occurrence are poorly understood [49,50]. These uncertainties make whistler events difficult to predict, hindering a quantitative understanding of their propagation and ionospheric impact. Addressing these limitations requires a comprehensive statistical analysis of an extensive event dataset. Here, we present the results of a statistical investigation of whistler wave occurrence, derived from CSES-01 observations between 1 January 2019 and 31 December 2022. This study concentrates on whistler occurrence rates, with a detailed analysis of whistler wave characteristics, including duration, dispersion parameter, polarization, and propagation direction, to be presented in Part 2.
In light of the findings presented in the previous sections, WhISPER was applied to SCM-ELF data using Parameter Set 1 to maximize accuracy. Restricting the whistler search to a latitudinal range of −40° to 40° and considering a total of 1290 days of CSES-01 data (due to some missing data in the database, last access: 3 September 2024), corresponding to 35,964 semiorbits, WhISPER identified 860,623 whistler events.
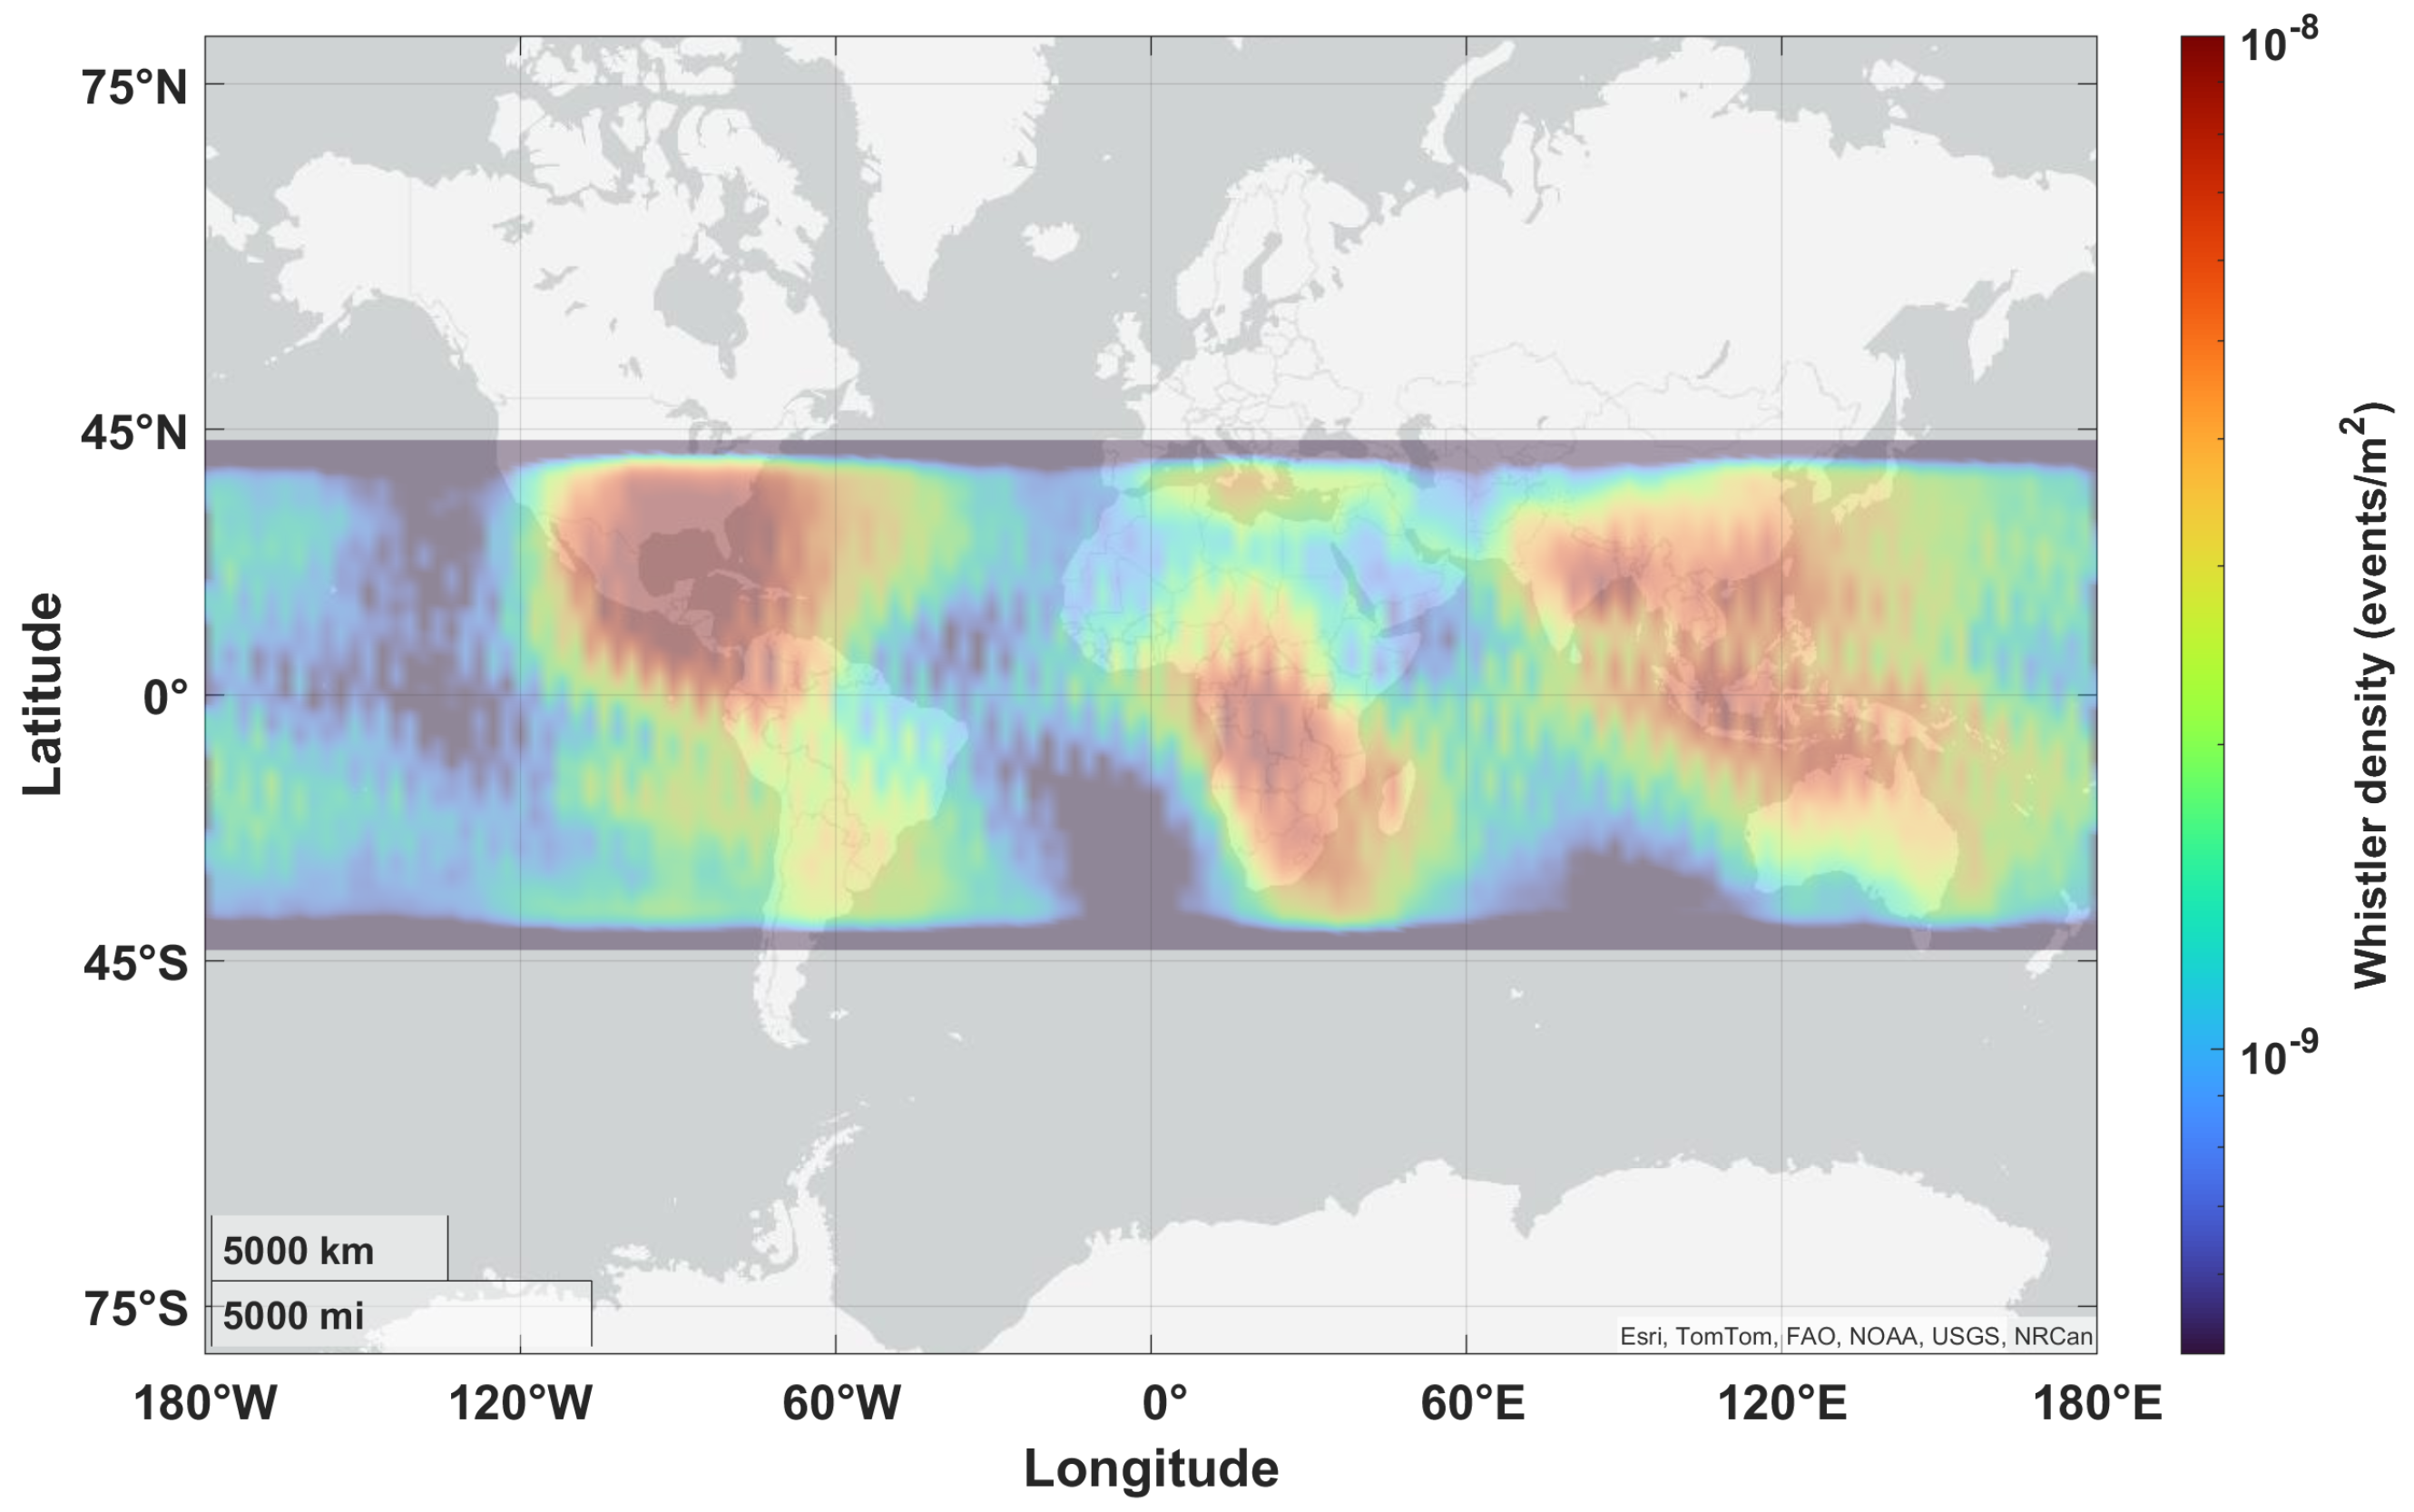
Figure 8 presents the geographical distribution of detected whistlers with color scale indicating the number of whistlers per m 2 . Although whistlers are observed globally, higher densities are concentrated in central America, western central Africa, and parts of southeast Asia.
To investigate potential seasonal variations in the geographical distribution of whistlers, we decomposed the whistler dataset obtained with WhISPER into four seasonal periods: (a) from March to May; (b) from June to August; (c) from September to November; and (d) from December to February. Figure 9 illustrates the geographical distribution of whistlers across each seasonal period. Observational evidence in Figure 9 shows a clear seasonal modulation of whistler density, characterized by increased densities during local summer. This is manifested as higher densities from June to August in the Northern Hemisphere (panel b) and from December to February in the Southern Hemisphere (panel d). The equinoctial months exhibit a similar distribution pattern (panels a and c).
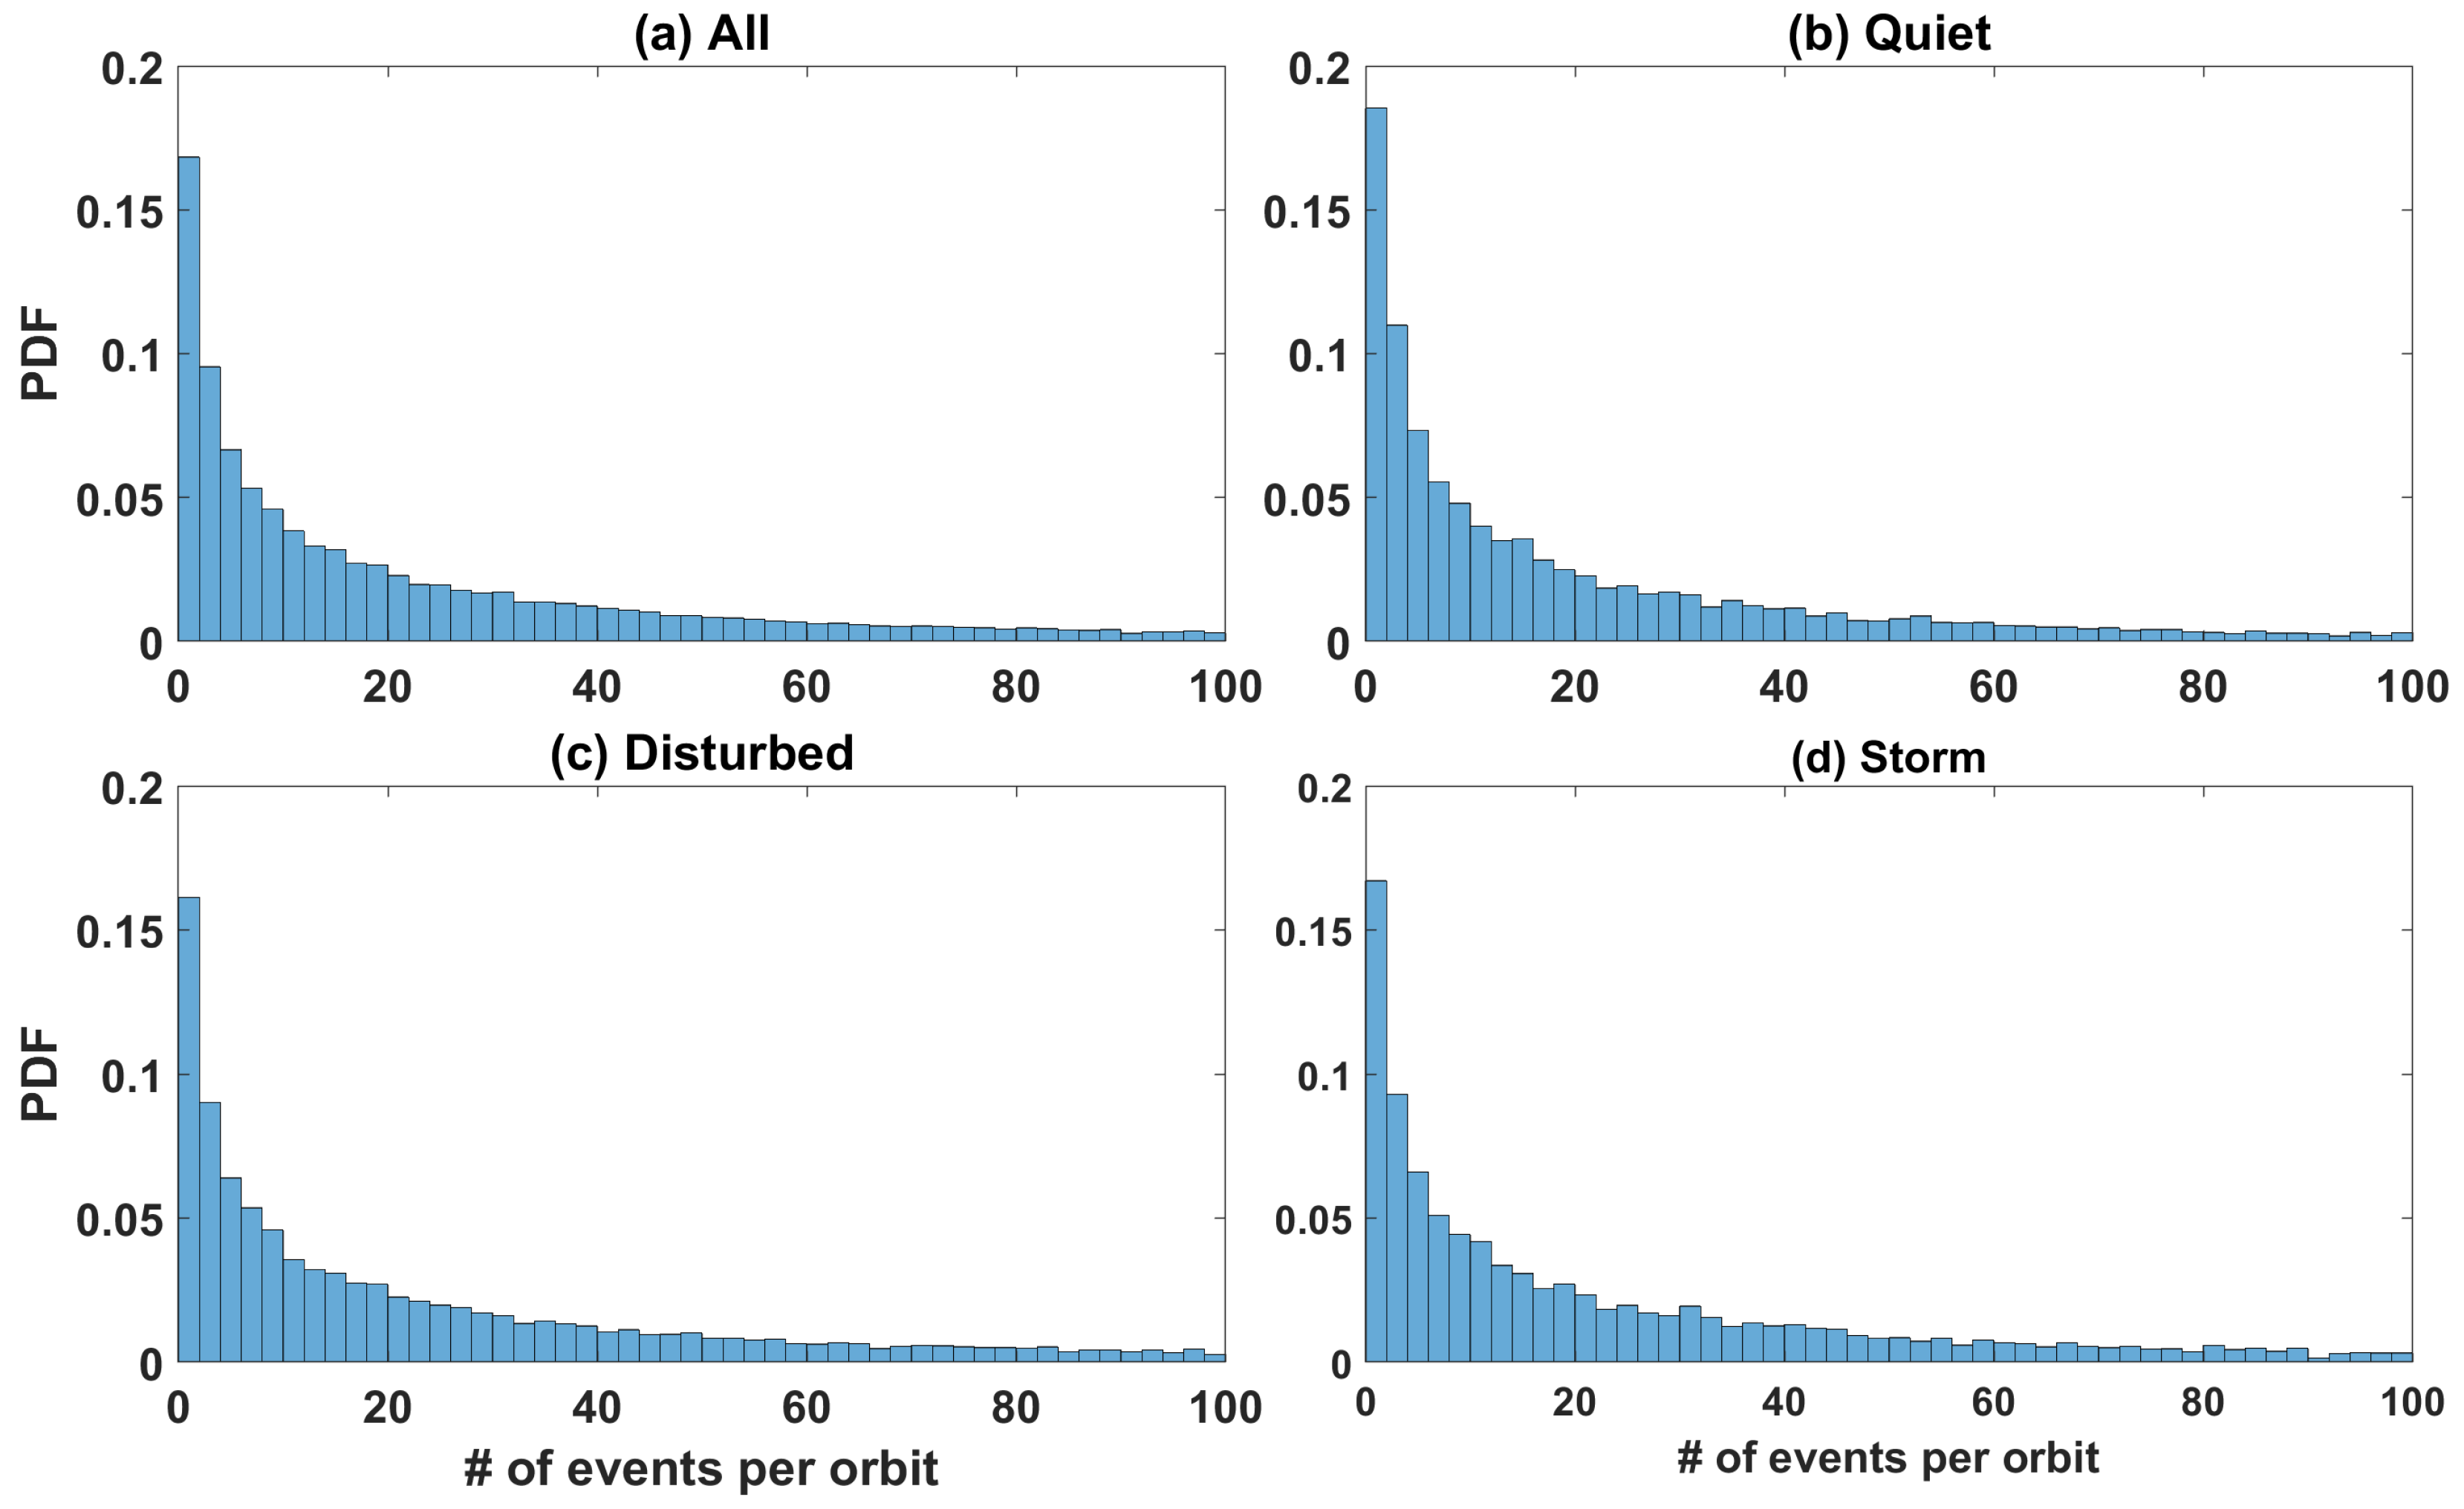
To investigate the potential influence of solar activity on whistler occurrence in the top-side ionosphere, we analyzed the distribution of whistler events during quiet, disturbed, and stormy geomagnetic days, according to what is reported in Section 2.3. Figure 10 illustrates the Probability Distribution Function (PDF) of the number of detected whistlers per semiorbit for (a) all days, (b) quiet days, (c) disturbed days, and (d) stormy days. The PDFs exhibit similar decay patterns suggesting that whistler occurrence is not significantly affected by variations in geomagnetic activity at middle-low latitude (from 40 ° to 40 ° ).
In addition, a comparative analysis of diurnal and nocturnal observations demonstrates a higher whistler detection rate during nighttime, as illustrated in Figure 11, which presents the average number of detected whistlers per semiorbit for diurnal and nocturnal observations. The WhISPER algorithm identifies an average of 12.86 whistlers per diurnal semiorbit and 34.98 whistlers per nocturnal semiorbit.

4. Discussion and Conclusions

A new technique called WhIPSER was developed for the automatic detection of whistler waves in the top-side ionosphere. The algorithm detected 860,623 whistlers over a period of 1290 days from 2019 to 2022. Detected events exhibit higher density in three primary geographical regions (Figure 8): central America, western central Africa, and parts of southeast Asia. In addition, our analysis reveals a pronounced seasonal variation in event occurrence (Figure 9), a negligible dependence on solar activity (Figure 10), and a significantly higher occurrence rate during nighttime (Figure 11).
The reliability and robustness of the proposed technique were validated through visual inspection of a randomly selected event subset, demonstrating an accuracy of approximately 96%, using Parameter Set 1. Additional key performance metrics (Table 5) demonstrate excellent results, including an F 1 score score of 98%, a True Positive Rate of 96%, a True Negative Rate of 94%, and a Positive Predictive Value of 99%. Correspondingly, the False Negative Rate and False Positive Rate are low, at 4% and 6%, respectively. This performance surpasses that reported in prior research; for example, Harid et al. [20] reported a detection accuracy of 92.14 % and Ali Ahmad et al. [28] reported a mis-detection rate (i.e., False Negative) of 25.07%.
Table 4 and Table 5 further illustrate two significant strengths of WhISPER: its interpretability and adaptability. Indeed, the performance metrics used to evaluate the algorithm are dependent on parameters T 1 , T 2 , T 3 and T 4 , which are directly related to the signal’s intrinsic characteristics, such as its energy content (here considered in the IPSD) and duration (selected by T 4 ). The elevated false negative rate observed with Parameter Set 2 results from the application of excessively restrictive parameters, leading to the exclusion of a significant portion of signals that are indeed whistlers. Conversely, the high false positive rate obtained with Set 3 indicates insufficiently stringent parameter selection, resulting in the erroneous inclusion of faint signatures misidentified as whistler waves. However, the parameters offer significant flexibility and can be tailored to meet diverse research goals. For instance, to maximize the detection of all potential whistlers, a parameter set similar to Set 3 (which exhibits the highest True Positive Rate) can be employed, acknowledging the associated increase in false positives. Conversely, for the stringent selection of only clear and intense whistlers and the minimization of false positives, a parameter set akin to Set 2 (which demonstrates the highest True Negative Rate) can be utilized, despite the potential exclusion of many whistlers with low-amplitude waveforms. For general applications, Set 1, which demonstrates high performance in both True Positive and True Negative Rates (96% and 94% respectively), represents the optimal choice.
Given the focus on mid-to-low latitude regions (between −40 ° and 40 ° ), the observed whistlers are characterized by short durations, generally below 0.5 s. This is due to the fact that the signal duration is directly proportional to the propagation path length from the wave source to the observation point [28]. Indeed, the spatial distribution of the detected whistlers (Figure 8) aligns with the global lightning stroke density as recorded by the World-Wide Lightning Location Network (see Figure 2 in [51], Figure 4 in [52], Figures 17 and 18 in [53]). These results corroborate the findings reported in [54], which indicated that the most probable source regions for whistlers detected by the DEMETER satellite (orbiting in the top-side ionosphere at approximately 700 km) are located directly beneath the satellite’s trajectory. The only notable discrepancy between the lightning and whistler distribution patterns is the reduced whistler occurrence over the Amazon region, despite the high lightning activity. This disparity may be attributed to the significant impact of South Atlantic Anomaly (SAA) on whistler propagation. Indeed, consistent with our findings, Němec et al. [55] reported a reduced whistler occurrence at the longitudes of the SAA in DEMETER data compared to Van Allen Probes observations.
Furthermore, the observed seasonal patterns, characterized by increased activity during local summer months (Figure 9), align with findings from previous studies on lightning distribution. Specifically, Collier et al. (2006) [49] reported an increase in lightning flash density over southern Africa during the local summer months (from December to February); Holle et al. (2016) [56] observed a similar seasonal pattern in the United States, with 64% of annual cloud-to-ground lightning flashes occurring in the local summer (between June and August); Dowdy and Kuleshov (2014) [57] found a peak in ground flash density in Australia during the warm season (from November to April). Additionally, the whistler detection is not significantly influenced by geomagnetic conditions, as evident by the similar PDFs of whistler per semiorbit during different geomagnetic periods (Figure 10), indicating the neutral atmospheric origin of the detected signals [58]. The observed higher detection rate of whistlers during nighttime (Figure 11) is in agreement with previous studies on whistler occurrence, which report that whistlers are predominantly a nighttime phenomenon (see, e.g., [59]).
The presented results, consistent with established literature on lightning and whistler occurrence, provide further validation for the WhISPER technique’s efficacy in detecting whistlers from magnetic field data at ionospheric altitudes (∼500 km). Beyond its exceptional detection accuracy, interpretability, and adaptability, a key advantage of this technique is its computational efficiency. Since high-resolution spectrograms are utilized solely for validation, whistler identification can be performed using only PSD data, directly provided by the satellite. Consequently, the comprehensive whistler search from 2019 to 2022 was completed in approximately 70 h on a standard laptop (CPU: AMD Ryzen 5 7530U, RAM: 8 GB), yielding an average processing time of approximately 7 s per semiorbit. This level of computational efficiency and speed is, to our knowledge, unmatched by any other existing automated whistler detection procedure. As a benchmark, the AWD technique detailed in [22] required a processing time of 5 to 10 min for each hour of data on a 3 GHz PC, indicating that WhISPER is approximately 25–50 times faster.
To the best of our knowledge, this study presents the first extensive detection of whistlers using top-side ionosphere data. Indeed, previous detection or analysis methods have primarily relied on ground-based observations [20,22,59,60] or satellite data from other regions of the circumterrestrial space [28,41,61,62] or documented a significantly lower number of detected events in the top-side ionosphere (e.g., in [63] the authors identified hundreds of whistlers using DEMETER satellite data).
Furthermore, the high sampling frequency of SCM enables the generation of clearer spectrograms compared to previous studies, such as those utilizing burst-mode data sampled at 250 Hz from Swarm satellite Absolute Scalar Magnetometers [64] or those conducted in noisier environments (e.g., [22]). Consequently, spectrograms and waveforms derived from SCM data (such as those shown in Figure 3) enable highly precise determination of whistler characteristics, including amplitude, duration, and frequency range. The comprehensive and detailed characterization of whistler wave characteristics, including dispersion, direction of propagation, and the subsequent derivation of electron density, will be detailed in Part 2. Indeed, the WhISPER technique is proposed as a foundational component of a new system designed to advance our understanding of whistler physics and ionospheric dynamics. It enables rapid and efficient detection of whistlers, facilitating the collection of large datasets for in-depth studies. This technique represents a significant advancement in the field of whistler detection, offering key advantages over previous methods, including high detection accuracy, computational efficiency, interpretability, and adaptability. Moreover, with appropriate modifications, the technique can be adapted for analyzing electric and magnetic field data from other Low Earth Orbit (LEO) satellites and various sources in the near-Earth space, extending its utility beyond ionospheric studies.

Author Contributions

Conceptualization, D.R. and M.P.; methodology, D.R.; software, D.R.; validation, D.R., G.D. and E.P.; formal analysis, D.R.; investigation, D.R. and M.P.; resources, D.R., G.D., C.N. and W.J.B.; data curation, D.R.; writing—original draft preparation, D.R.; writing—review and editing, M.P., R.B., E.P. and G.D.; visualization, D.R.; supervision, M.P. and R.B.; project administration, M.P. and R.B.; funding acquisition, M.P. and R.B. All authors have read and agreed to the published version of the manuscript.

Funding

This research was funded by the Ministero dell’Università e della Ricerca with the project PRIN2022 n° 2022ZBBBRY, CUP E53D23004560006. In addition, it is partially supported by MAECI program SW-CSES CUP E63C24000230006, year 2024.

Institutional Review Board Statement

Not applicable.

Informed Consent Statement

Not applicable.

Data Availability Statement

CSES satellite data are freely available at the LEOS repository (www.leos.ac.cn, accessed on 3 September 2024); SYM-H data are freely available at the NASA Cdaweb repository (https://cdaweb.gsfc.nasa.gov/index.html accessed on 3 September 2024). Results can be reproduced using standard free analysis packages. Methods are fully described.

Acknowledgments

The authors kindly acknowledge N. Papitashvili and J. King at the National Space Science Data Center of the Goddard Space Flight Center for the use permission of OMNI data and the NASA CDAWeb team for making these data available. The authors thank the Italian Space Agency for the financial support under the contract ASI “LIMADOU scienza+” n ° 2021-18-H1. This study was carried out within the Space It Up project funded by the Italian Space Agency, ASI, and the Ministry of University and Research, MUR, under contract n. 2024-5-E.0—CUP n. I53D24000060005.

Conflicts of Interest

The authors declare no conflicts of interest.

Abbreviations

The following abbreviations are used in this manuscript:
AWDAutomatic Whistler Detector
ASIItalian Space Agency
CNNConvolutional Neural Network
CNSAChina National Space Administration
CSESChina Seismo-Electromagnetic Satellite
DFTDiscrete Fourier Transform
EFDElectric Field Detector
ELFExtreme Low Frequency
GORGNSS Occultation Receiver
HEPDHigh-Energy Particle Detector
HEPPHigh-Energy Particle Package
HPMHigh Precision Magnetometer
IPSDIntegrated Power Spectral Density
LAPLangumir Probe
LEOLow Earth Orbit
PAPPlasma Analyser Package
PLHRPower Line Harmonic Radiation
PSDPower Spectral Density
SCMSearch Coil Magnetometer
SRSchumann Resonances
SAASouth Atlantic Anomaly
SNRSignal-to-Noise Ratio
STFTShort-Time Fourier Transform
TBBTri-Band Beacon
TWTemporal Window
VLFVery Low Frequency
WhISPERWhistler Identification by Spectral Power Estimation and Recognition

References

  1. Storey, L. An investigation of whistling atmospherics. Philos. Trans. R. Soc. London Ser. A Math. Phys. Sci. 1953, 246, 113–141. [Google Scholar]
  2. Helliwell, R.; Crary, J.; Pope, J.; Smith, R. The “nose” whistler—A new high-latitude phenomenon. J. Geophys. Res. 1956, 61, 139–142. [Google Scholar] [CrossRef]
  3. Smith, R.; Helliwell, R.; Yabroff, I. A theory of trapping of whistlers in field-aligned columns of enhanced ionization. J. Geophys. Res. 1960, 65, 815–823. [Google Scholar] [CrossRef]
  4. Carpenter, D.L. Electron-density variations in the magnetosphere deduced from whistler data. J. Geophys. Res. 1962, 67, 3345–3360. [Google Scholar] [CrossRef]
  5. Park, C. Some features of plasma distribution in the plasmasphere deduced from Antarctic whistlers. J. Geophys. Res. 1974, 79, 169–173. [Google Scholar] [CrossRef]
  6. Tarcsai, G.; Szemeredy, P.; Hegymegi, L. Average electron density profiles in the plasmasphere between L = 1.4 and 3.2 deduced from whistlers. J. Atmos. Terr. Phys. 1988, 50, 607–611. [Google Scholar] [CrossRef]
  7. Park, C.G. Whistler observations of the interchange of ionization between the ionosphere and the protonosphere. J. Geophys. Res. (1896-1977) 1970, 75, 4249–4260. [Google Scholar] [CrossRef]
  8. Carpenter, D.L. Whistler evidence of a ‘knee’ in the magnetospheric ionization density profile. J. Geophys. Res. 1963, 68, 1675–1682. [Google Scholar] [CrossRef]
  9. Carpenter, D.; Anderson, R. An ISEE/whistler model of equatorial electron density in the magnetosphere. J. Geophys. Res. Space Phys. 1992, 97, 1097–1108. [Google Scholar] [CrossRef]
  10. Horne, R.B.; Thorne, R.M.; Glauert, S.A.; Albert, J.M.; Meredith, N.P.; Anderson, R.R. Timescale for radiation belt electron acceleration by whistler mode chorus waves. J. Geophys. Res. Space Phys. 2005, 110, 1–10. [Google Scholar] [CrossRef]
  11. Thorne, R.; Li, W.; Ni, B.; Ma, Q.; Bortnik, J.; Chen, L.; Baker, D.; Spence, H.E.; Reeves, G.; Henderson, M.; et al. Rapid local acceleration of relativistic radiation-belt electrons by magnetospheric chorus. Nature 2013, 504, 411–414. [Google Scholar] [CrossRef] [PubMed]
  12. Li, W.; Shen, X.C.; Ma, Q.; Capannolo, L.; Shi, R.; Redmon, R.; Rodriguez, J.; Reeves, G.; Kletzing, C.; Kurth, W.; et al. Quantification of energetic electron precipitation driven by plume whistler mode waves, plasmaspheric hiss, and exohiss. Geophys. Res. Lett. 2019, 46, 3615–3624. [Google Scholar] [CrossRef]
  13. Ma, Q.; Li, W.; Zhang, X.J.; Bortnik, J.; Shen, X.C.; Connor, H.; Boyd, A.; Kurth, W.; Hospodarsky, G.; Claudepierre, S.; et al. Global survey of electron precipitation due to hiss waves in the Earth’s plasmasphere and plumes. J. Geophys. Res. Space Phys. 2021, 126, e2021JA029644. [Google Scholar] [CrossRef]
  14. Thorne, R.; Horne, R.; Meredith, N. Comment on “On the origin of whistler mode radiation in the plasmasphere” by Green et al. J. Geophys. Res.-ALL Ser. 2006, 111, A09210. [Google Scholar] [CrossRef]
  15. Záhlava, J.; Němec, F.; Santolík, O.; Kolmašová, I.; Hospodarsky, G.; Parrot, M.; Kurth, W.; Kletzing, C. Lightning contribution to overall whistler mode wave intensities in the plasmasphere. Geophys. Res. Lett. 2019, 46, 8607–8616. [Google Scholar] [CrossRef]
  16. Gołkowski, M.; Harid, V.; Hosseini, P. Review of controlled excitation of non-linear wave-particle interactions in the magnetosphere. Front. Astron. Space Sci. 2019, 6, 2. [Google Scholar] [CrossRef]
  17. Hwang, J.A.; Lee, D.Y.; Lyons, L.; Smith, A.; Zou, S.; Min, K.; Kim, K.H.; Moon, Y.J.; Park, Y. Statistical significance of association between whistler-mode chorus enhancements and enhanced convection periods during high-speed streams. J. Geophys. Res. Space Phys. 2007, 112, A09213. [Google Scholar] [CrossRef]
  18. Li, Y.; Yuan, J.; Cao, J.; Liu, Y.; Huang, J.; Li, B.; Wang, Q.; Zhang, Z.; Zhao, Z.; Han, Y.; et al. Spaceborne Algorithm for Recognizing Lightning Whistler Recorded by an Electric Field Detector Onboard the CSES Satellite. Atmosphere 2023, 14, 1633. [Google Scholar] [CrossRef]
  19. Wang, Z.; Yi, J.; Yuan, J.; Hu, R.; Peng, X.; Chen, A.; Shen, X. Lightning-generated Whistlers recognition for accurate disaster monitoring in China and its surrounding areas based on a homologous dual-feature information enhancement framework. Remote Sens. Environ. 2024, 304, 114021. [Google Scholar] [CrossRef]
  20. Harid, V.; Liu, C.; Pang, Y.; Alvina, A.J.; Golkowski, M.; Hosseini, P.; Cohen, M. Automated large-scale extraction of whistlers using mask-scoring regional convolutional neural network. Geophys. Res. Lett. 2021, 48, e2021GL093819. [Google Scholar] [CrossRef]
  21. Barbarino, G.; Cicone, A. Stabilization and variations to the adaptive local iterative filtering algorithm: The fast resampled iterative filtering method. Numer. Math. 2024, 156, 395–433. [Google Scholar] [CrossRef]
  22. Lichtenberger, J.; Ferencz, C.; Bodnár, L.; Hamar, D.; Steinbach, P. Automatic whistler detector and analyzer system: Automatic whistler detector. J. Geophys. Res. Space Phys. 2008, 113, A12201. [Google Scholar] [CrossRef]
  23. Suarjaya, I.M.A.D.; Putri, D.P.S.; Tanaka, Y.; Purnama, F.; Bayupati, I.P.A.; Linawati; Kasahara, Y.; Matsuda, S.; Miyoshi, Y.; Shinohara, I. Deep Learning Model Size Performance Evaluation for Lightning Whistler Detection on Arase Satellite Dataset. Remote Sens. 2024, 16, 4264. [Google Scholar] [CrossRef]
  24. Záhlava, J.; Němec, F.; Pinçon, J.L.; Santolík, O.; Kolmašová, I.; Parrot, M. Whistler influence on the overall very low frequency wave intensity in the upper ionosphere. J. Geophys. Res. Space Phys. 2018, 123, 5648–5660. [Google Scholar] [CrossRef]
  25. Bernard, L. A new nose extension method for whistlers. J. Atmos. Terr. Phys. 1973, 35, 871–880. [Google Scholar] [CrossRef]
  26. Stanford. The Stanford VLF Group Automated Detection of Whistlers for the TARANIS Spacecraft. Overview of the Project. Available online: https://vlfstanford.ku.edu.tr (accessed on 8 September 2024).
  27. Dharma, K.S.; Bayupati, I.; Buana, P.W. Automatic Lightning Whistler Detection Using Connected Component Labeling Method. J. Theor. Appl. Inf. Technol. 2014, 66, 638–645. [Google Scholar]
  28. Ali Ahmad, U.; Kasahara, Y.; Matsuda, S.; Ozaki, M.; Goto, Y. Automatic detection of lightning whistlers observed by the plasma wave experiment onboard the Arase satellite using the OpenCV library. Remote Sens. 2019, 11, 1785. [Google Scholar] [CrossRef]
  29. Konan, O.J.; Mishra, A.K.; Lotz, S. Machine learning techniques to detect and characterise whistler radio waves. arXiv 2020, arXiv:2002.01244. [Google Scholar]
  30. Ran, Z.; Lu, C.; Hu, Y.; Yang, D.; Sun, X.; Zhima, Z. Automatic Detection of Quasi-Periodic Emissions from Satellite Observations by Using DETR Method. Remote Sens. 2024, 16, 2850. [Google Scholar] [CrossRef]
  31. Picozza, P.; Battiston, R.; Ambrosi, G.; Bartocci, S.; Basara, L.; Burger, W.; Campana, D.; Carfora, L.; Casolino, M.; Castellini, G.; et al. Scientific goals and in-orbit performance of the high-energy particle detector on board the CSES. Astrophys. J. Suppl. Ser. 2019, 243, 16. [Google Scholar] [CrossRef]
  32. Shen, X.; Zhang, X.; Yuan, S.; Wang, L.; Cao, J.; Huang, J.; Zhu, X.; Piergiorgio, P.; Dai, J. The state-of-the-art of the China Seismo-Electromagnetic Satellite mission. Sci. China Technol. Sci. 2018, 61, 634–642. [Google Scholar] [CrossRef]
  33. Cao, J.; Zeng, L.; Zhan, F.; Wang, Z.; Wang, Y.; Chen, Y.; Meng, Q.; Ji, Z.; Wang, P.; Liu, Z.; et al. The electromagnetic wave experiment for CSES mission: Search coil magnetometer. Sci. China Technol. Sci. 2018, 61, 653–658. [Google Scholar] [CrossRef]
  34. Walker, A. The theory of whistler propagation. Rev. Geophys. 1976, 14, 629–638. [Google Scholar] [CrossRef]
  35. Diego, P.; Huang, J.; Piersanti, M.; Badoni, D.; Zeren, Z.; Yan, R.; Rebustini, G.; Ammendola, R.; Candidi, M.; Guan, Y.B.; et al. The Electric Field Detector on Board the China Seismo Electromagnetic Satellite—In-Orbit Results and Validation. Instruments 2021, 5, 1. [Google Scholar] [CrossRef]
  36. Huang, J.; Lei, J.; Li, S.; Zeren, Z.; Li, C.; Zhu, X.; Yu, W. The Electric Field Detector (EFD) onboard the ZH-1 satellite and first observational results. Earth Planet. Phys. 2018, 2, 469–478. [Google Scholar] [CrossRef]
  37. Lakhina, G.S.; Tsurutani, B.T. Geomagnetic storms: Historical perspective to modern view. Geosci. Lett. 2016, 3, 1–11. [Google Scholar] [CrossRef]
  38. Iyemori, T. Storm-time magnetospheric currents inferred from mid-latitude geomagnetic field variations. J. Geomagn. Geoelectr. 1990, 42, 1249–1265. [Google Scholar] [CrossRef]
  39. Recchiuti, D.; D’Angelo, G.; Papini, E.; Diego, P.; Cicone, A.; Parmentier, A.; Ubertini, P.; Battiston, R.; Piersanti, M. Detection of electromagnetic anomalies over seismic regions during two strong (MW > 5) earthquakes. Front. Earth Sci. 2023, 11, 1152343. [Google Scholar] [CrossRef]
  40. King, J.; Papitashvili, N. Solar wind spatial scales in and comparisons of hourly Wind and ACE plasma and magnetic field data. J. Geophys. Res. Space Phys. 2005, 110, A02104. [Google Scholar] [CrossRef]
  41. Svenningsson, I.; Yordanova, E.; Khotyaintsev, Y.V.; André, M.; Cozzani, G.; Steinvall, K. Whistler waves in the quasi-parallel and quasi-perpendicular magnetosheath. J. Geophys. Res. Space Phys. 2024, 129, e2024JA032661. [Google Scholar] [CrossRef]
  42. Sentman, D.D. Schumann resonances. In Handbook of Atmospheric Electrodynamics; CRC Press: Boca Raton, FL, USA, 2017; Volume I, pp. 267–295. [Google Scholar]
  43. Karslı, H.; Dondurur, D. A mean-based filter to remove power line harmonic noise from seismic reflection data. J. Appl. Geophys. 2018, 153, 90–99. [Google Scholar] [CrossRef]
  44. Tsurutani, B.T.; Park, S.A.; Falkowski, B.J.; Lakhina, G.S.; Pickett, J.S.; Bortnik, J.; Hospodarsky, G.; Santolik, O.; Parrot, M.; Henri, P.; et al. Plasmaspheric hiss: Coherent and intense. J. Geophys. Res. Space Phys. 2018, 123, 10-009. [Google Scholar] [CrossRef]
  45. Malaspina, D.M.; Ripoll, J.F.; Chu, X.; Hospodarsky, G.; Wygant, J. Variation in plasmaspheric hiss wave power with plasma density. Geophys. Res. Lett. 2018, 45, 9417–9426. [Google Scholar] [CrossRef]
  46. Zhima, Z.; Zhou, B.; Zhao, S.; Wang, Q.; Huang, J.; Zeng, L.; Lei, J.; Chen, Y.; Li, C.; Yang, D.; et al. Cross-calibration on the electromagnetic field detection payloads of the China Seismo-Electromagnetic Satellite. Sci. China Technol. Sci. 2022, 65, 1415–1426. [Google Scholar] [CrossRef]
  47. Yang, D.; Zhima, Z.; Wang, Q.; Huang, J.; Wang, X.; Zhang, Z.; Zhao, S.; Guo, F.; Cheng, W.; Lu, H.; et al. Stability validation on the VLF waveform data of the China-Seismo-Electromagnetic Satellite. Sci. China Technol. Sci. 2022, 65, 3069–3078. [Google Scholar] [CrossRef]
  48. Collier, A.B.; Delport, B.; Hughes, A.R.; Lichtenberger, J.; Steinbach, P.; Öster, J.; Rodger, C. Correlation between global lightning and whistlers observed at Tihany, Hungary. J. Geophys. Res. Space Phys. 2009, 114, A07210. [Google Scholar] [CrossRef]
  49. Collier, A.; Hughes, A.R.W.; Lichtenberger, J.; Steinbach, P. Seasonal and diurnal variation of lightning activity over southern Africa and correlation with European whistler observations. In Annales Geophysicae; Copernicus Publications: Göttingen, Germany, 2006; Volume 24, pp. 529–542. [Google Scholar]
  50. Collier, A.B.; Lichtenberger, J.; Clilverd, M.A.; Rodger, C.; Steinbach, P. Source region for whistlers detected at Rothera, Antarctica. J. Geophys. Res. Space Phys. 2011, 116, A03219. [Google Scholar] [CrossRef]
  51. Kaplan, J.O.; Lau, K.H.K. World wide lightning location network (WWLLN) global lightning climatology (WGLC) and time series, 2022 update. Earth Syst. Sci. Data 2022, 14, 5665–5670. [Google Scholar] [CrossRef]
  52. Bitzer, P.M. Global distribution and properties of continuing current in lightning. J. Geophys. Res. Atmos. 2017, 122, 1033–1041. [Google Scholar] [CrossRef]
  53. Rodger, C.; Werner, S.; Brundell, J.B.; Lay, E.H.; Thomson, N.R.; Holzworth, R.H.; Dowden, R. Detection efficiency of the VLF World-Wide Lightning Location Network (WWLLN): Initial case study. In Annales Geophysicae; Copernicus GmbH: Göttingen, Germany, 2006; Volume 24, pp. 3197–3214. [Google Scholar]
  54. Delport, B.; Collier, A.; Steinbach, J.L.P.; Parrot, M. Correlating fractional hop whistlers detected on DEMETER with WWLLN lightning. In Proceedings of the 56th Annual Conference of the South African Institute of Physics, Pretoria, South Africa, 4–8 July 2011. [Google Scholar]
  55. Němec, F.; Santolík, O.; Hospodarsky, G.; Hajoš, M.; Demekhov, A.; Kurth, W.; Parrot, M.; Hartley, D. Whistler mode quasiperiodic emissions: Contrasting Van Allen Probes and DEMETER occurrence rates. J. Geophys. Res. Space Phys. 2020, 125, e2020JA027918. [Google Scholar] [CrossRef]
  56. Holle, R.L.; Cummins, K.L.; Brooks, W.A. Seasonal, monthly, and weekly distributions of NLDN and GLD360 cloud-to-ground lightning. Mon. Weather Rev. 2016, 144, 2855–2870. [Google Scholar] [CrossRef]
  57. Dowdy, A.J.; Kuleshov, Y. Climatology of lightning activity in Australia: Spatial and seasonal variability. Aust. Meteorol. Oceanogr. J. 2014, 64, 103–108. [Google Scholar] [CrossRef]
  58. Helliwell, R.A. Whistlers and Related Ionospheric Phenomena; Courier Corporation: North Chelmsford, MA, USA, 2014. [Google Scholar]
  59. Laaspere, T.; Morgan, M.; Johnson, W. Some results of five years of whistler observations from Labrador to Antarctica. Proc. IEEE 1963, 51, 554–568. [Google Scholar] [CrossRef]
  60. Kumar, S.; Anil, D.; Kishore, A.; Ramachandran, V. Whistlers observed at low-latitude ground-based VLF facility in Fiji. J. Atmos. Sol.-Terr. Phys. 2007, 69, 1366–1376. [Google Scholar] [CrossRef]
  61. Sonwalkar, V.; Carpenter, D.; Bell, T.; Spasojević, M.; Inan, U.; Li, J.; Chen, X.; Venkatasubramanian, A.; Harikumar, J.; Benson, R.; et al. Diagnostics of magnetospheric electron density and irregularities at altitudes< 5000 km using whistler and Z mode echoes from radio sounding on the IMAGE satellite. J. Geophys. Res. Space Phys. 2004, 109, A11212. [Google Scholar]
  62. Zhang, H.; Zhong, Z.; Lu, J.; Wang, M.; Yi, Y.; Tang, R.; Deng, X. Statistical Properties of Whistler-mode Waves in the Dayside Terrestrial Space: MMS Observations. Astrophys. J. 2024, 969, 14. [Google Scholar] [CrossRef]
  63. Fiser, J.; Chum, J.; Diendorfer, G.; Parrot, M.; Santolík, O. Whistler intensities above thunderstorms. In Annales Geophysicae; Copernicus Publications: Göttingen, Germany, 2010; Volume 28, pp. 37–46. [Google Scholar]
  64. Coïsson, P.; Hulot, G.; Vigneron, P.; Deram, P.; Léger, J.M.; Jager, T. 0+ whistlers in the ELF band recorded by Swarm satellites used to reconstruct the ionosphere below the satellite height. In Proceedings of the Geophysical Research Abstracts, EGU General Assembly 2019, Vienna, Austria, 7–12 April 2019; Volume 21. [Google Scholar]
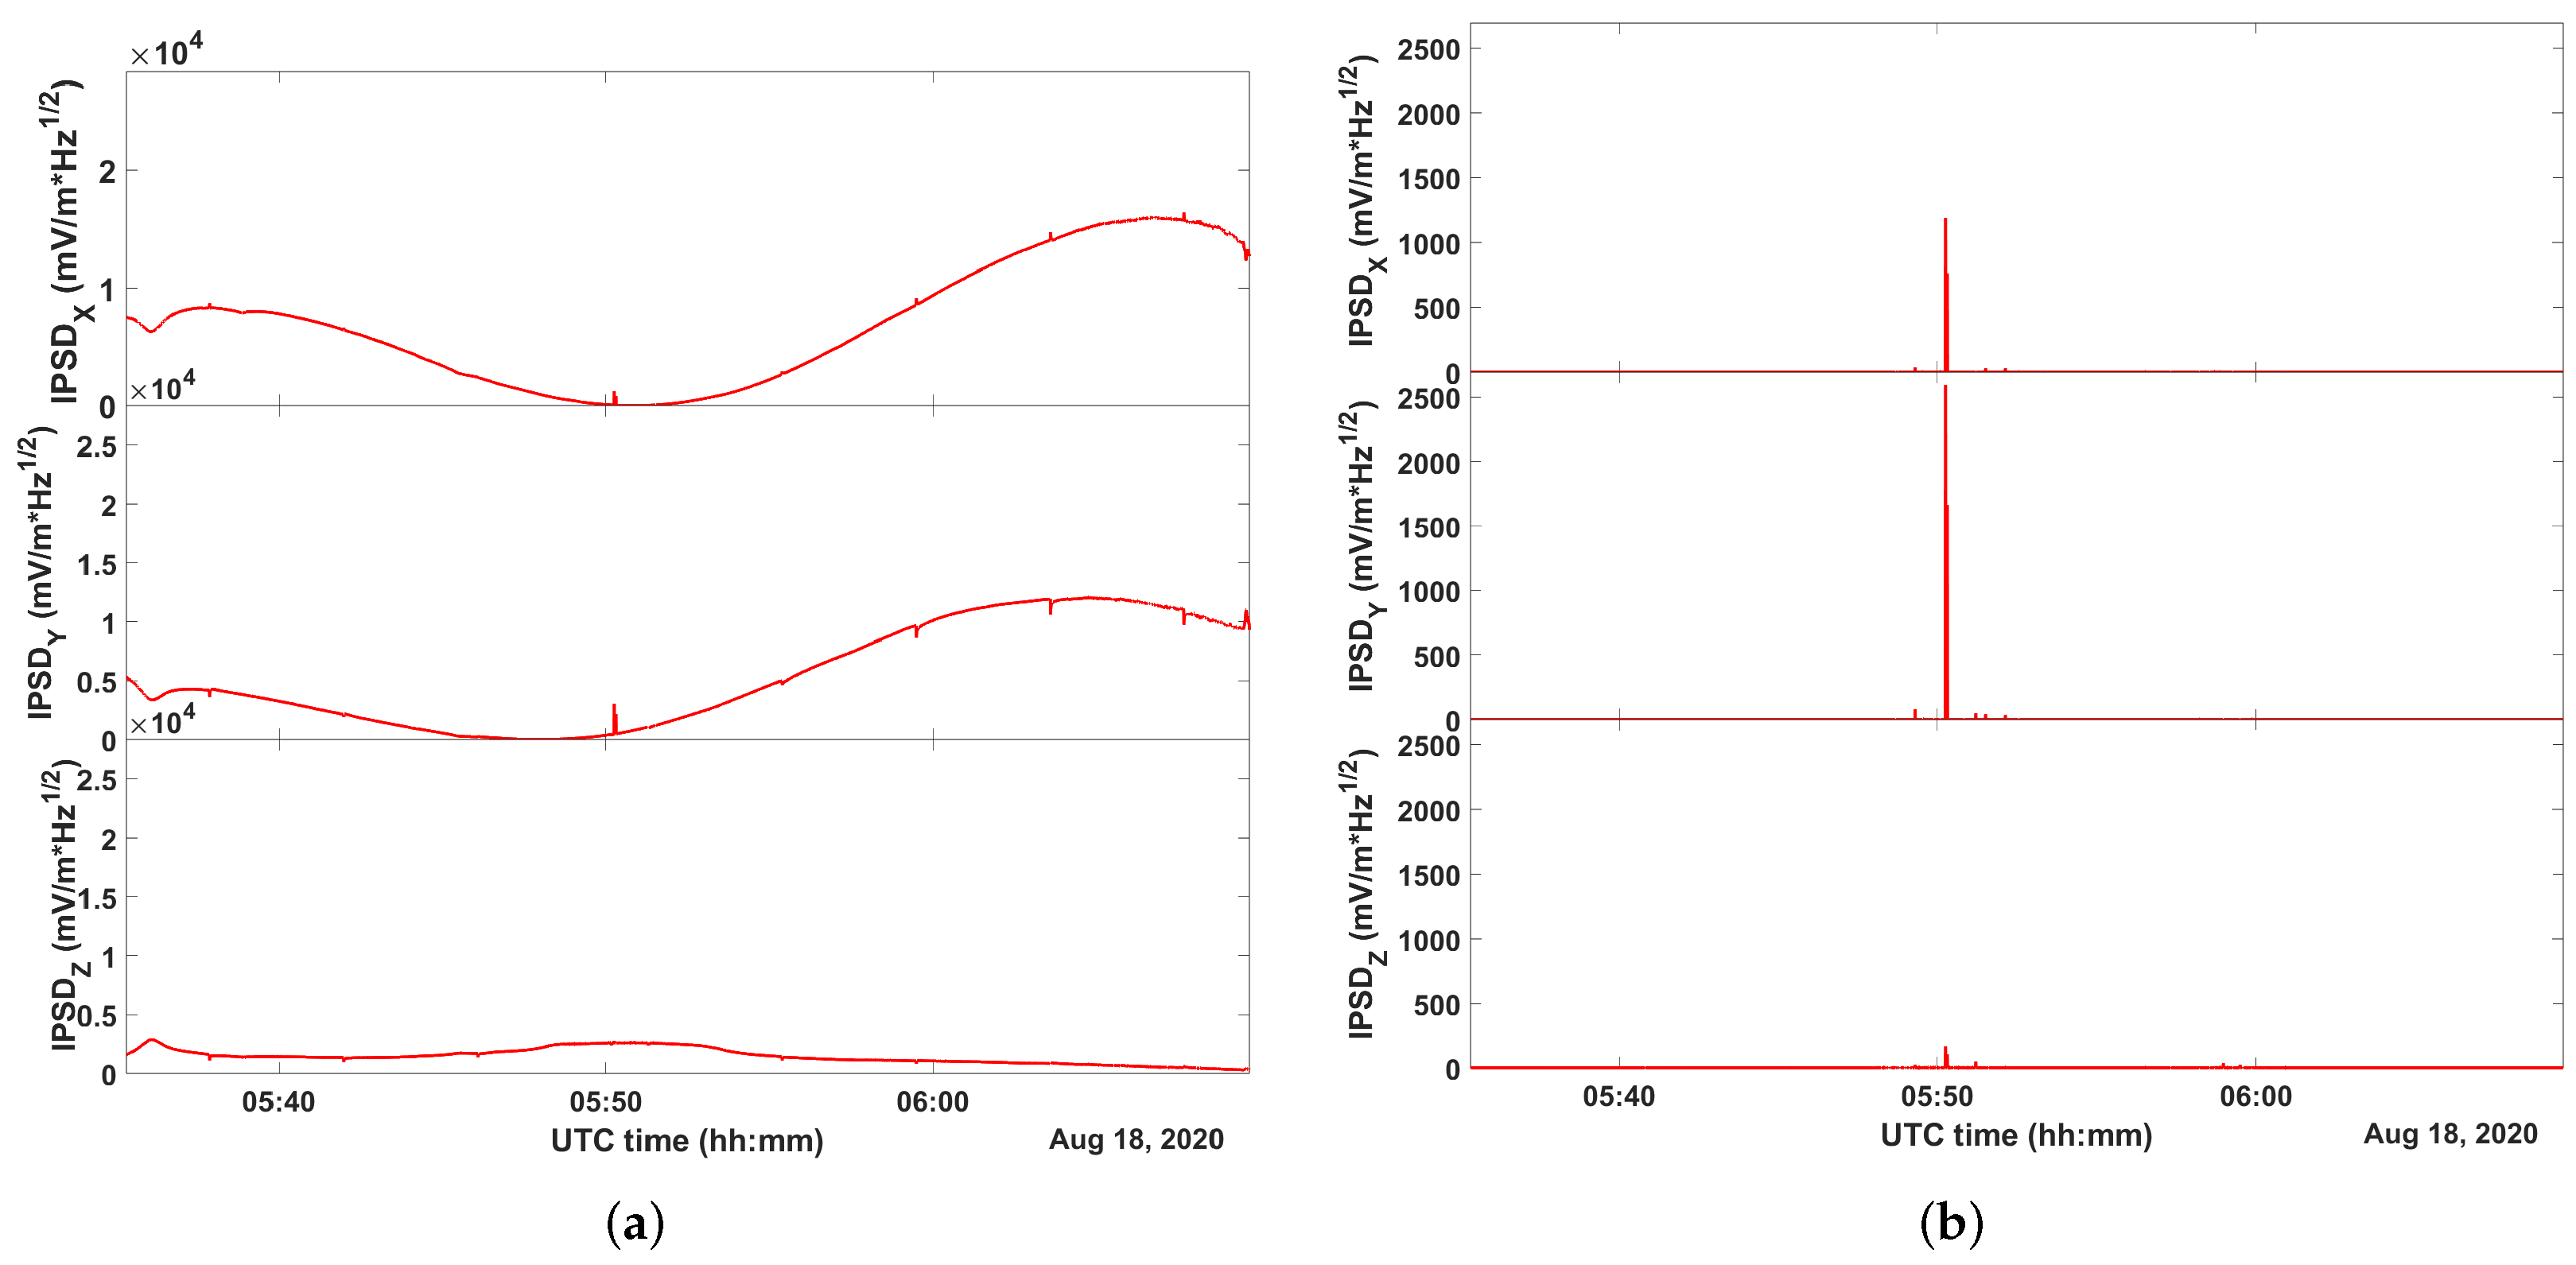
Figure 1. Effect of removing the lowest frequency components in EFD-ELF IPSD. (a) IPSD calculated using j M I N = 1 . (b) IPSD calculated using j M I N = 30 .
Atmosphere 16 00522 g001
Figure 2. Spectrograms of SCM-ELF observations (X, Y, and Z components from top to bottom in the top three panels) and IPSD t (bottom panel). Local maxima are highlighted by grey dots. Vertical dashed lines highlight the most prominent peak identified at t a (blue) and a representative minor peaks identified at t b (red).
Atmosphere 16 00522 g002
Figure 3. Magnetic field waveforms (left panels) and spectrograms (right panels) within a 2 s window centered on t a (blue dashed line, corresponding to the largest IPSD peak in Figure 2). The top to bottom panels correspond to the X, Y, and Z components, respectively.
Atmosphere 16 00522 g003
Figure 4. Magnetic field waveforms (left panels) and spectrograms (right panels) within a 2 s window centered on t b (red dashed line, corresponding to the minor representative peak in Figure 2). The top to bottom panels correspond to the X, Y, and Z components, respectively.
Atmosphere 16 00522 g004
Figure 5. Spectrograms of EFD-ELF observations (X, Y, and Z components from top to bottom in the top three panels) and IPSD t (bottom panel).
Atmosphere 16 00522 g005
Figure 6. Electric field waveforms (left panels) and spectrograms (right panels) within a 2 s window centered on t a (blue dashed line, corresponding to the largest SCM IPSD peak in Figure 2). The top to bottom panels correspond to the X, Y, and Z components, respectively.
Atmosphere 16 00522 g006
Figure 7. Electric field waveforms (left panels) and spectrograms (right panels) within a 2 s window centered on t b (red dashed line, corresponding to the minor representative peak in Figure 2). The top to bottom panels correspond to the X, Y, and Z components, respectively.
Atmosphere 16 00522 g007
Figure 8. Geographical distribution of whistler density.
Atmosphere 16 00522 g008
Figure 9. Geographical distribution of whistler density during (a) March, April, and May; (b) June, July, and August; (c) September, October, and November; (d) December, January, and February.
Atmosphere 16 00522 g009
Figure 10. PDF of detected whistlers per semiorbit during (a) all days, (b) quiet days, (c) disturbed days, (d) stormy days.
Atmosphere 16 00522 g010
Figure 11. Average number of detected whistler per semiorbit for diurnal and nocturnal semiorbits.
Atmosphere 16 00522 g011
Table 1. Characteristics of SCM frequency bands.
BandSampling Frequency (Hz)Frequency Range (Hz)
ULF102410–200
ELF 1.024 · 10 4 200–2200
VLF 5.12 · 10 4 2.2 · 10 3 2 · 10 4
Table 2. Characteristics of CSES-01 EFD frequency bands.
BandSampling Frequency (Hz)Frequency Range (Hz)
ULF125 D C –16
ELF 5 · 10 3 6–2200
VLF 5 · 10 4 1.8 · 10 3 2 · 10 4
HF 10 7 1.8 · 10 4 3.5 · 10 6
Table 3. The three sets of treshold parameters.
T 1 ( nT 2 ) T 2 ( nT 2 ) T 3 T 4 (TW)
Set 10.290.250.52
Set 20.90.60.652
Set 30.10.050.33
Table 4. Confusion matrix for the three parameter sets.
Total Population
P + N = 1346
Set 1Set 2Set 3
P
1232
TP
1180
FN
52
TP
453
FN
779
TP
1232
FN
0
N
114
FP
7
TN
107
FP
4
TN
110
FP
113
TN
1
Table 5. Metrics used for the evaluation of the three parameter sets.
MetricsSet 1Set 2Set 3
Accuracy
ACC = TP + TN P + N
0.960.420.92
True Positive Rate
TPR = TP P
0.960.371
False Negative Rate
FNR = FN P
0.040.630
False Positive Rate
FPR = FP N
0.060.040.99
True Negative Rate
TNR = TN N
0.940.960.01
Positive Predictive Value
PPV = TP TP + FP
0.990.990.92
False Omission Rate
FOR = FN TN + FN
0.330.880
False Discovery Rate
FDR = FP TP + FP
0.010.010.08
Negative Predicted Value
NPV = TN TN + FN
0.670.121
F 1   score
F 1 = 2 TP 2 TP + FP + FN
0.980.540.96
Disclaimer/Publisher’s Note: The statements, opinions and data contained in all publications are solely those of the individual author(s) and contributor(s) and not of MDPI and/or the editor(s). MDPI and/or the editor(s) disclaim responsibility for any injury to people or property resulting from any ideas, methods, instructions or products referred to in the content.