
Optimizing Livestock By-Products Storage to Reduce Ammonia and Greenhouse Gas Emissions Using Biochar and Wood Vinegar

 ,
, 
Abstract
1. Introduction
2. Materials and Methods
2.1. Incubation Experiments
2.2. Gas Production Measurements
2.3. Statistical Analysis
3. Results
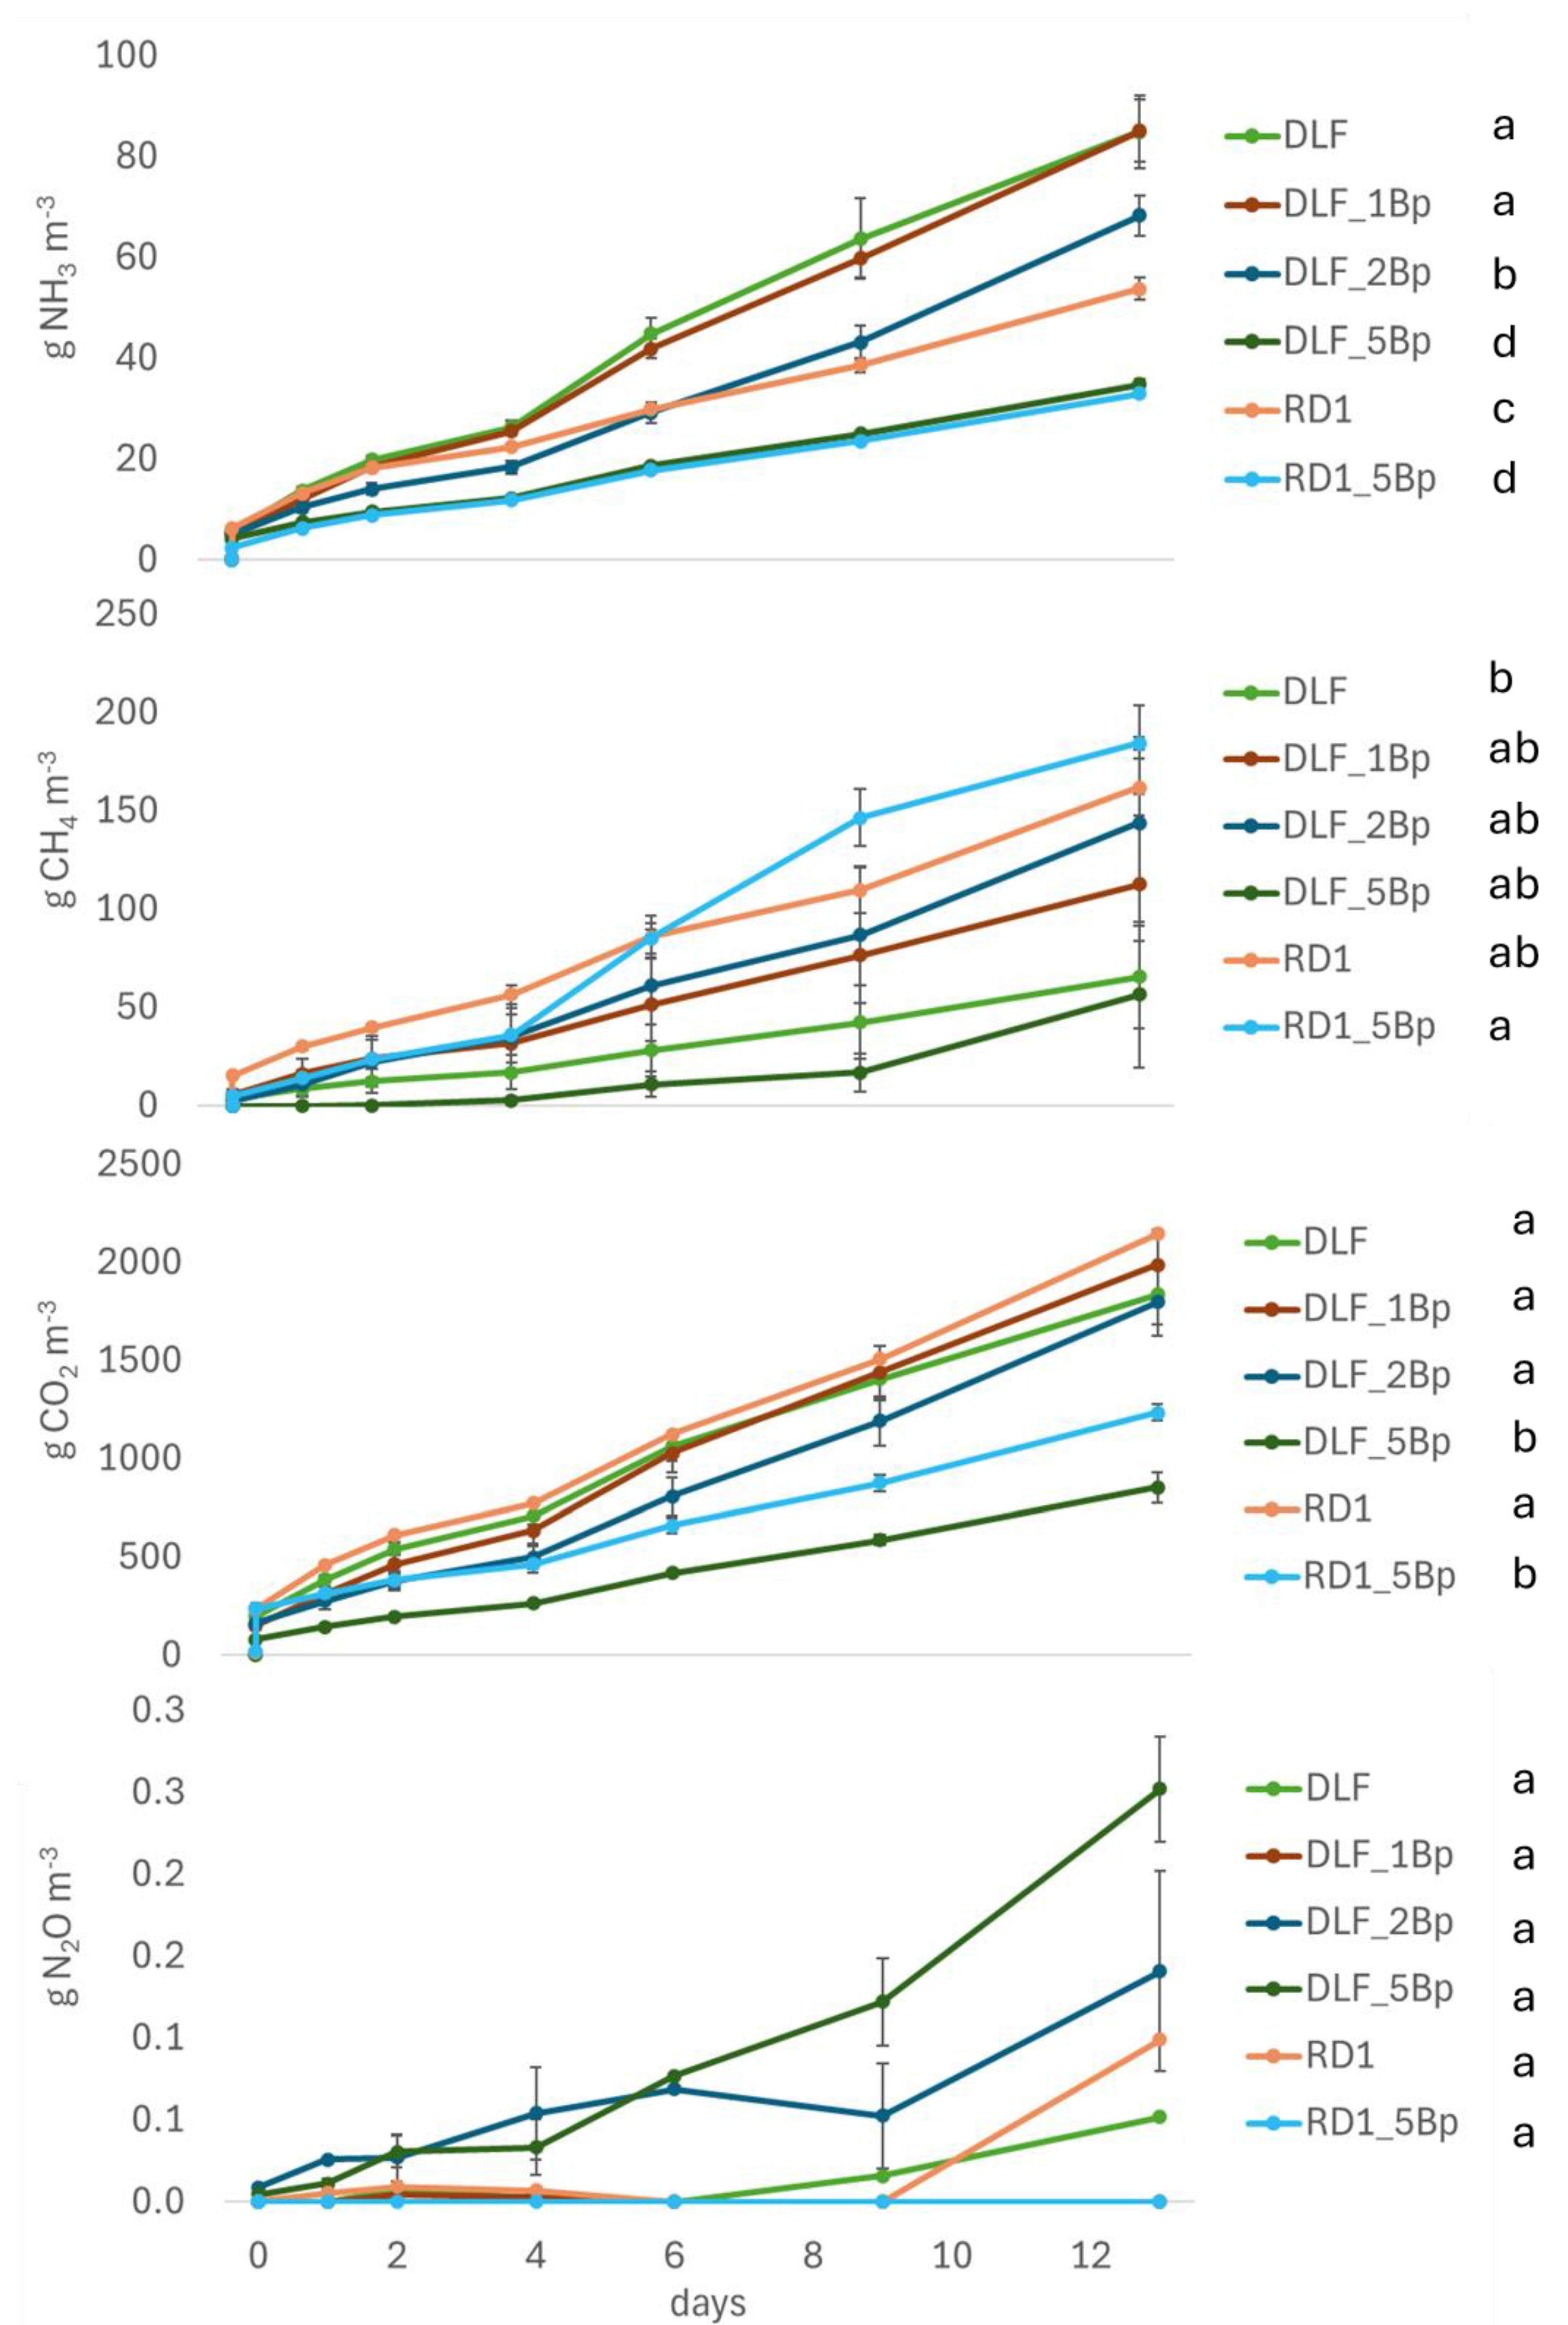
3.1. Incubation 1
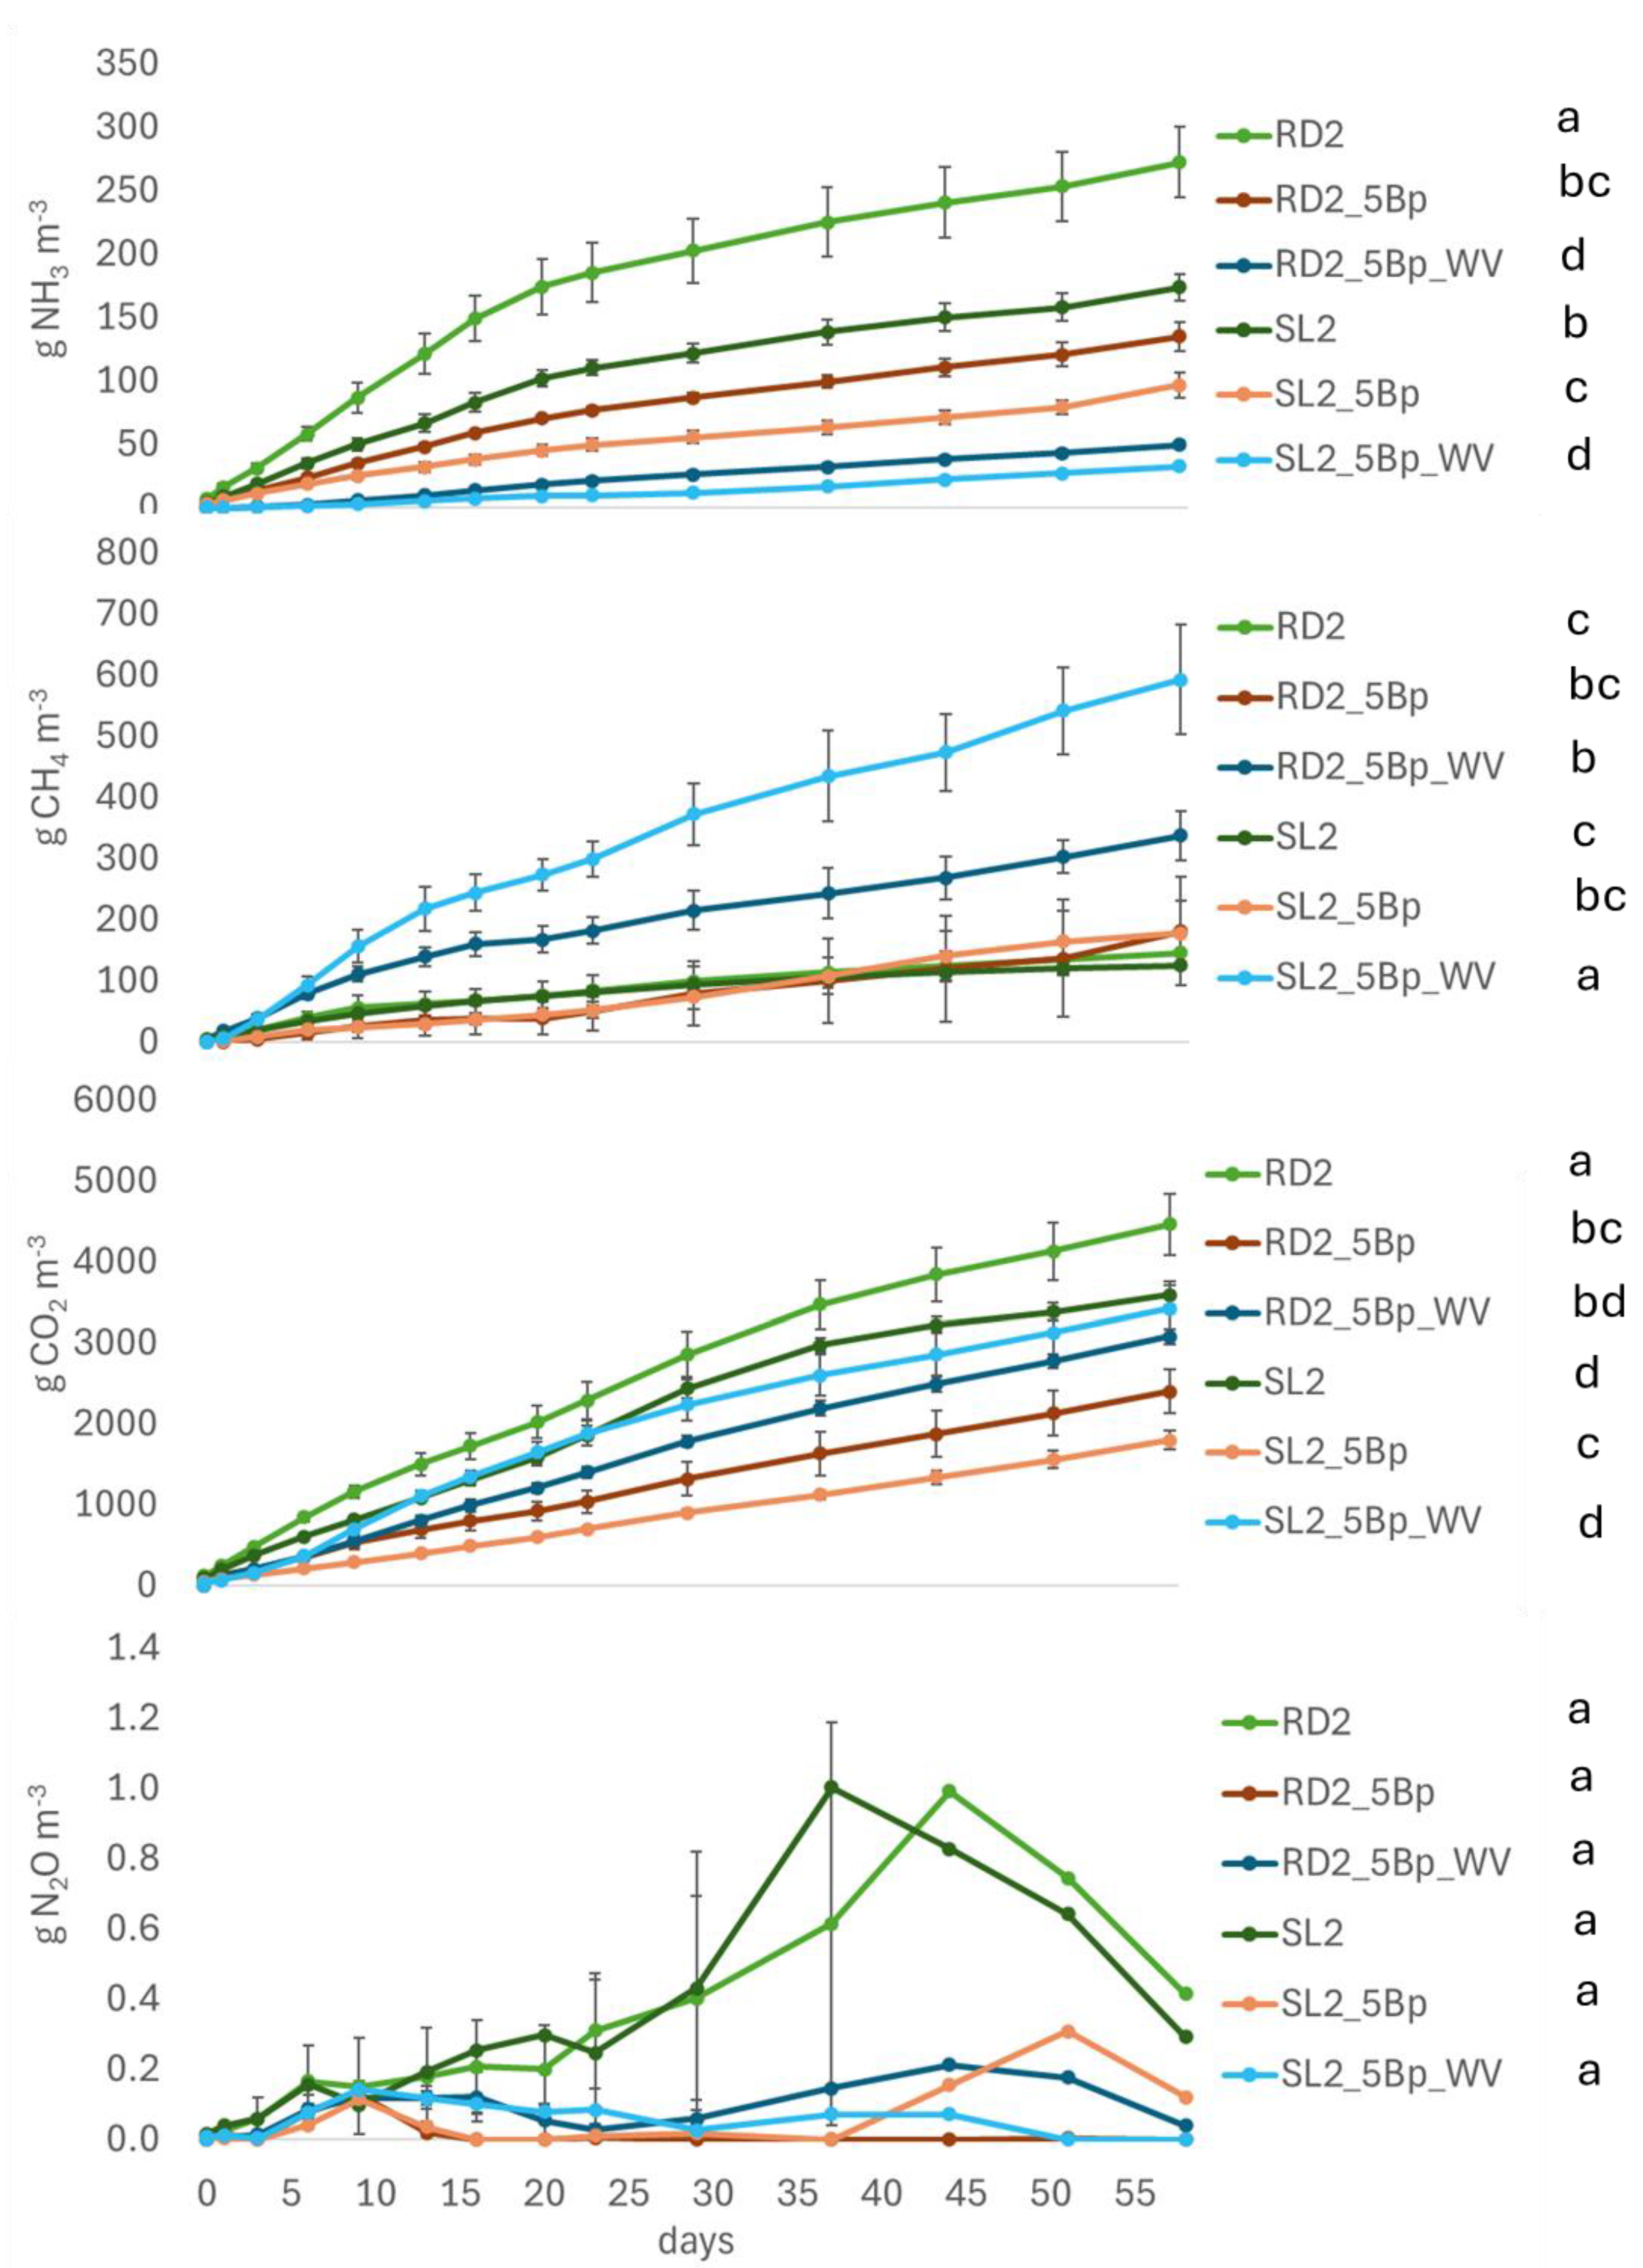
3.2. Incubation 2
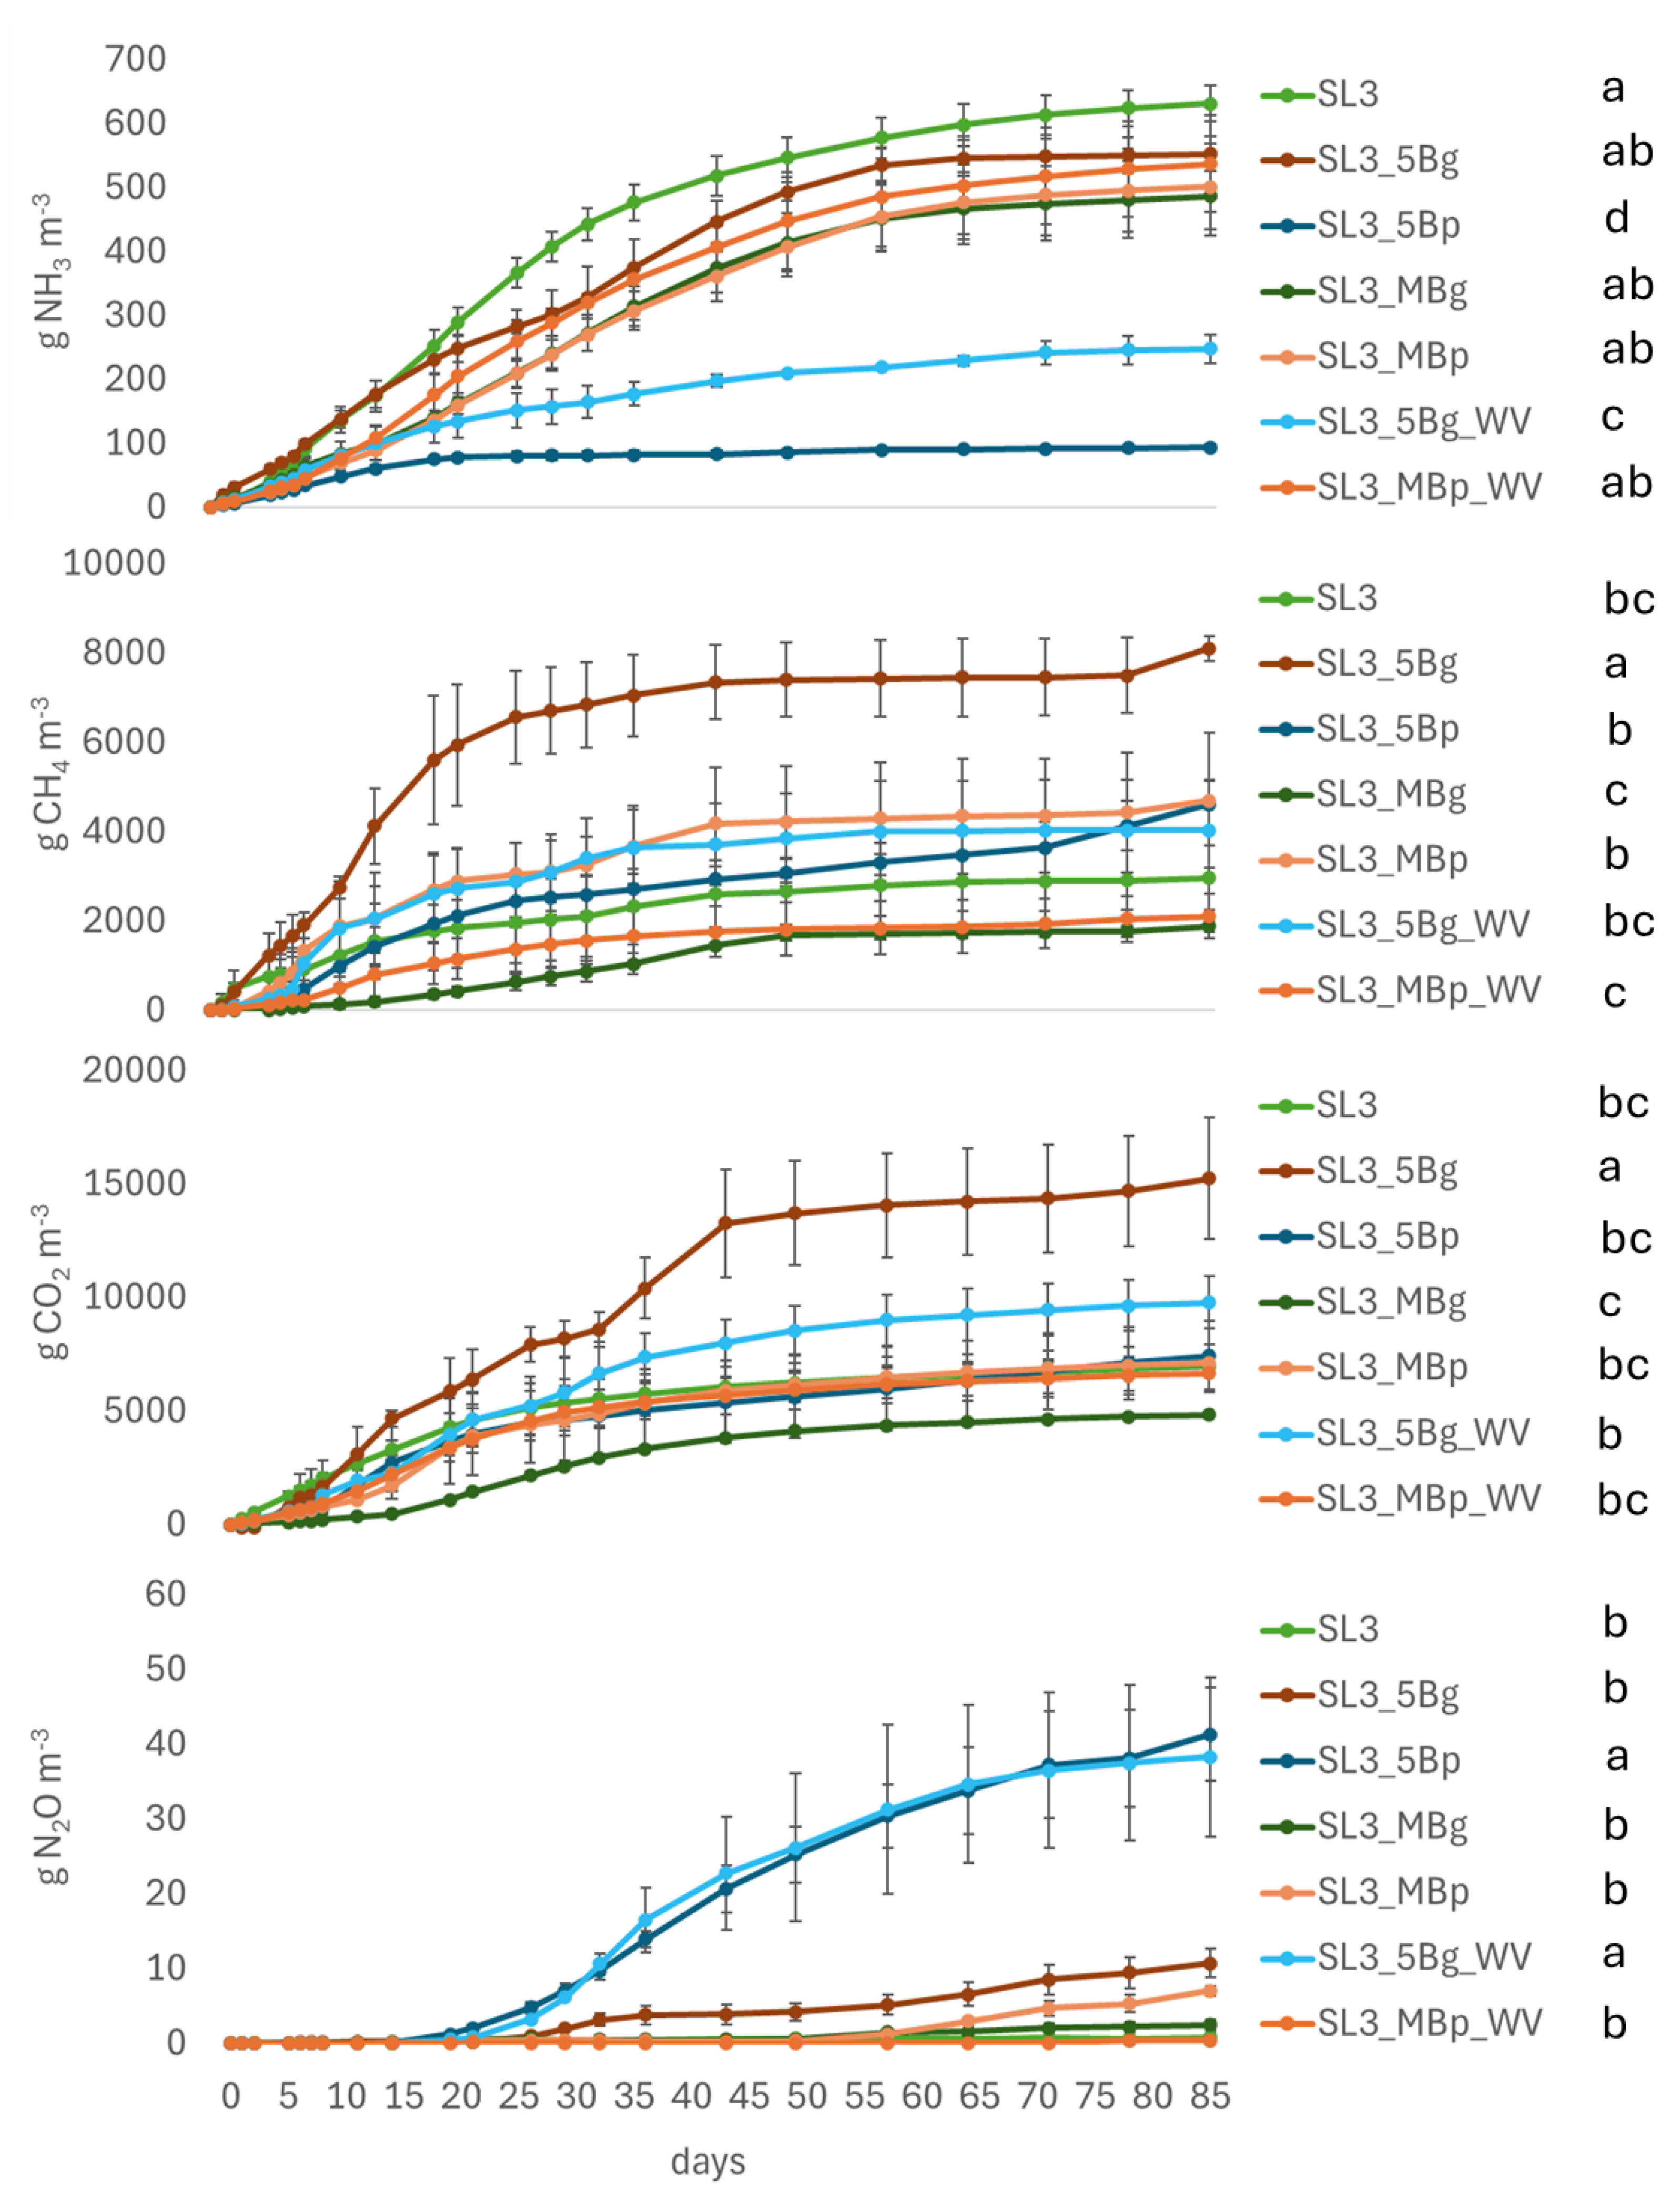
3.3. Incubation 3
3.4. pH Variations
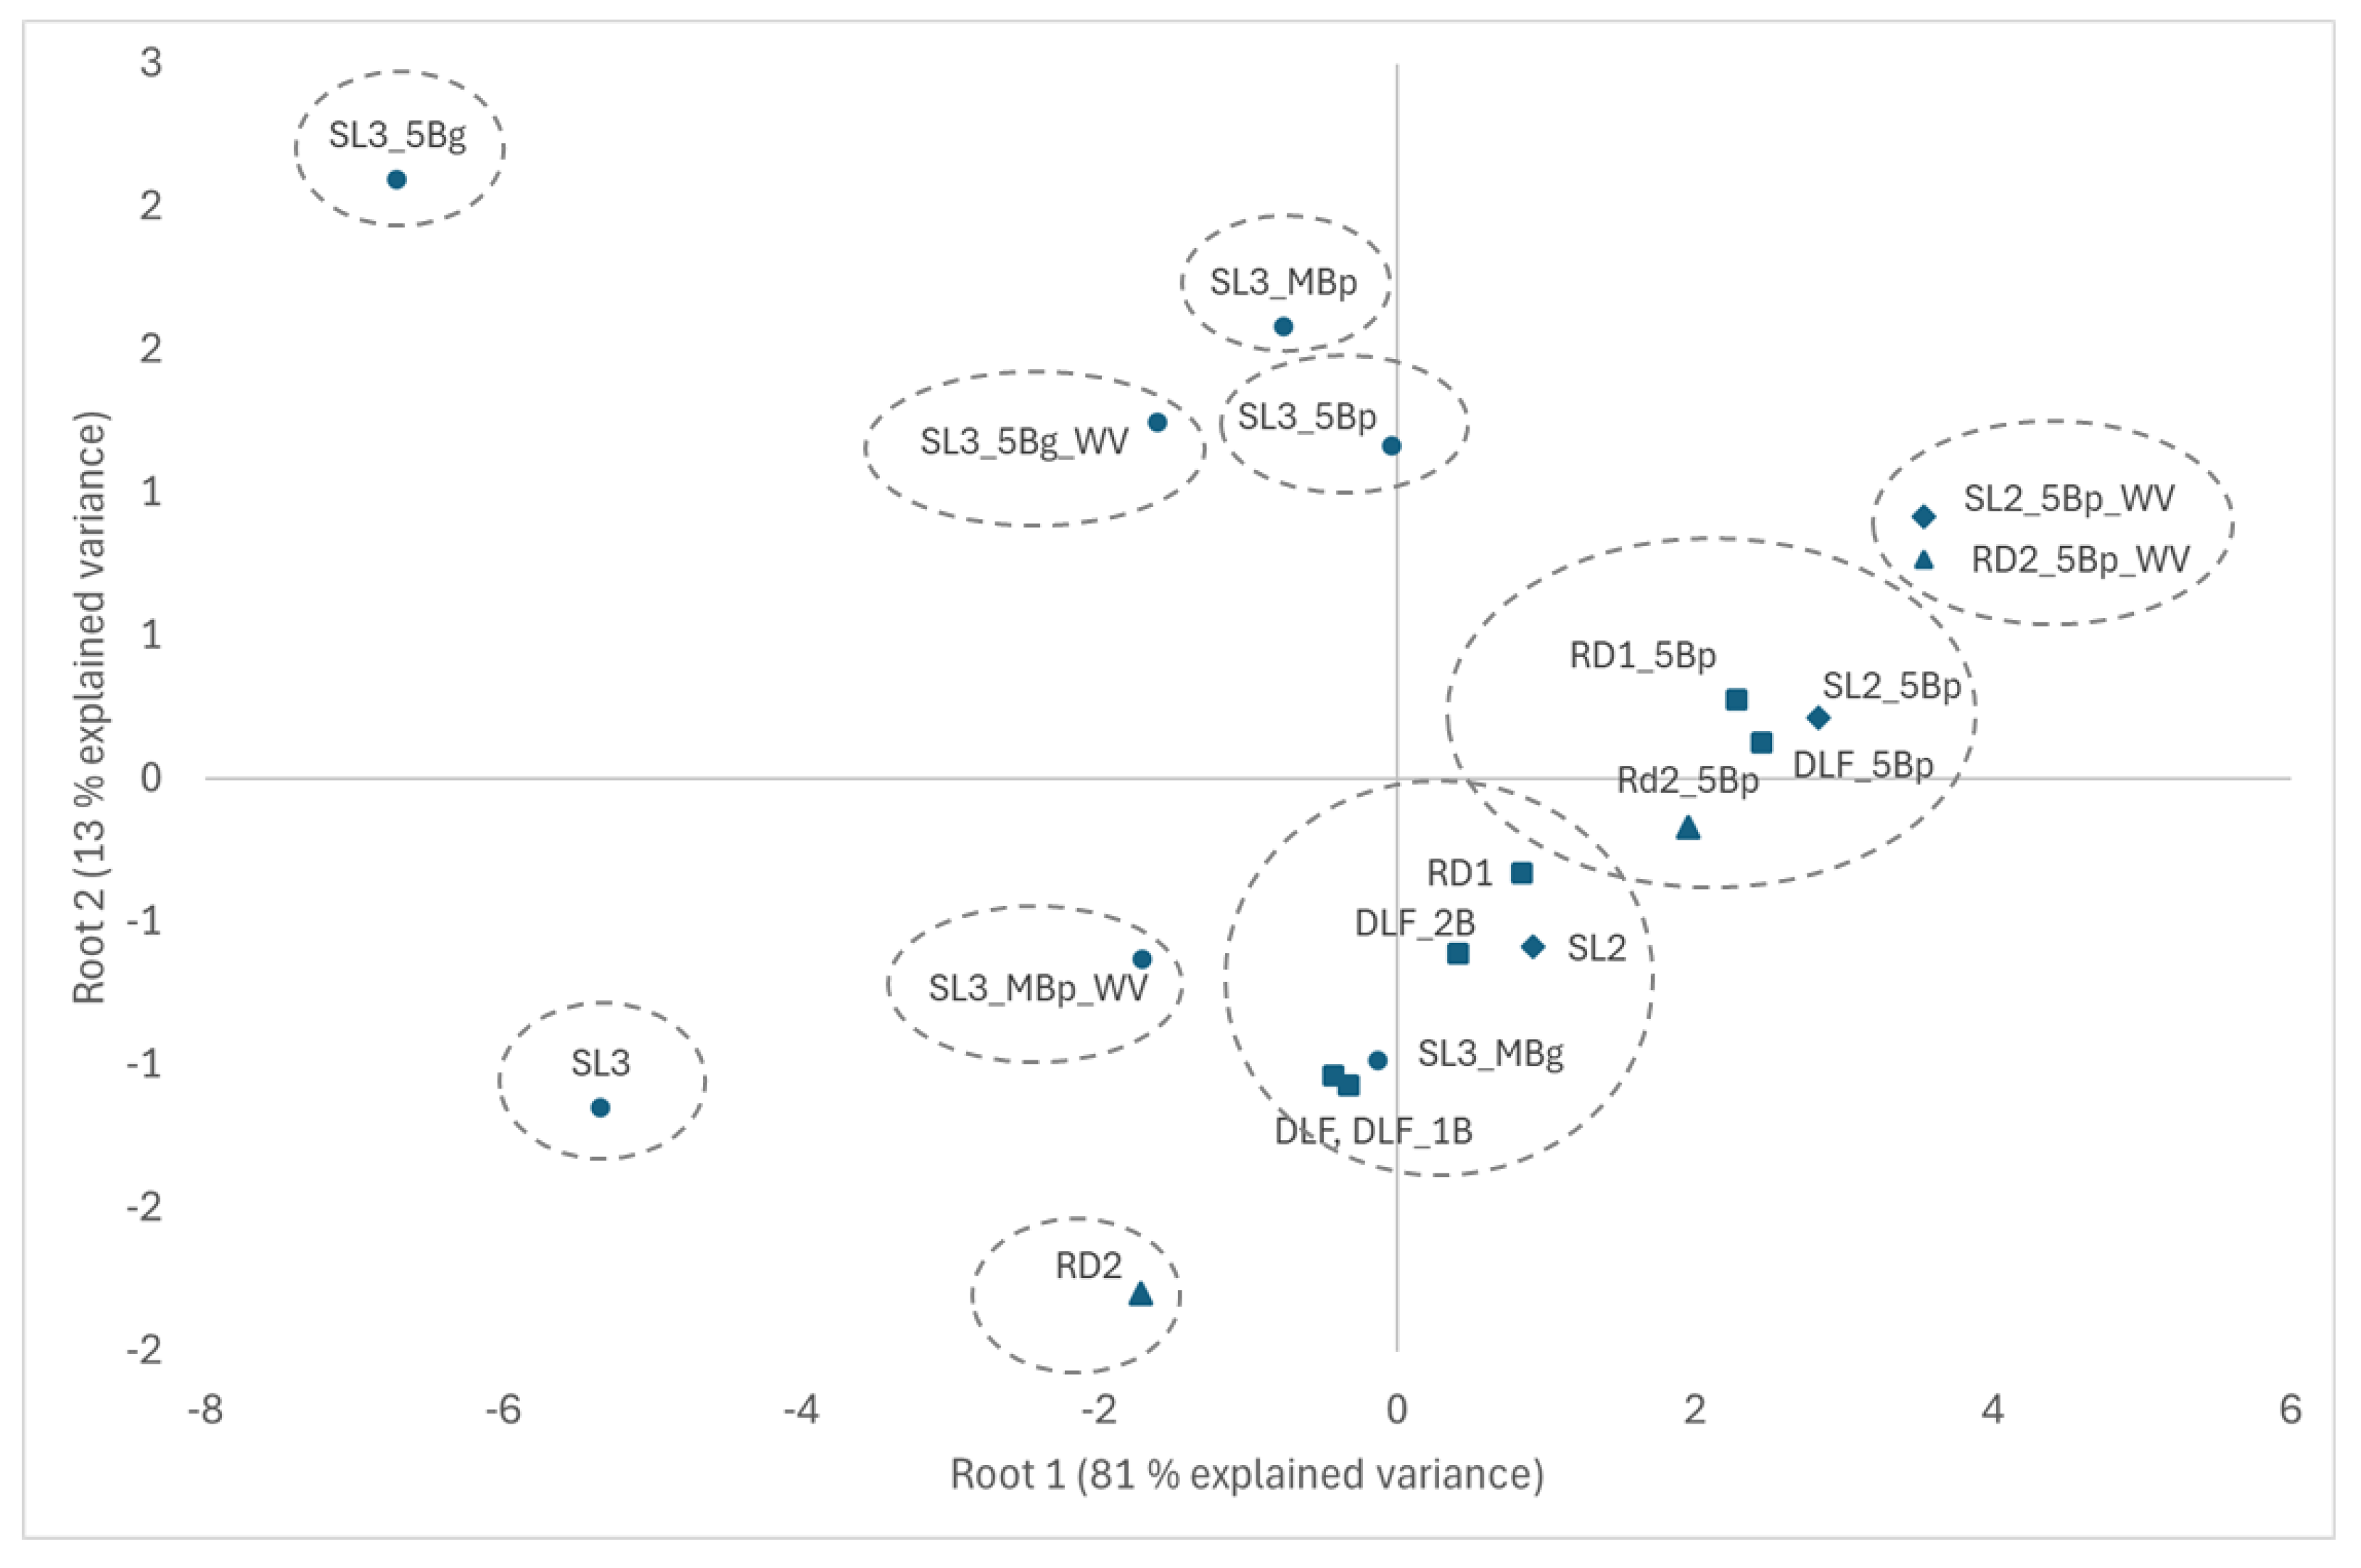
3.5. Discriminant Function Analysis
4. Discussion
Author Contributions
Funding
Institutional Review Board Statement
Informed Consent Statement
Data Availability Statement
Conflicts of Interest
Abbreviations
| NH3 | Ammonia |
| CH4 | Methane |
| CO2 | Carbon dioxide |
| N2O | Nitrous oxide |
| GHG | Greenhouse gas |
| N | Nitrogen |
| PM | Particulate matter |
| NVZs | Nitrate vulnerable zones |
| OM | Organic matter |
| C | Carbon |
| C org | Organic C |
| TN | Total nitrogen |
| N-NH4 | Ammonium |
| H:Corg | Hydrogen carbon ratio |
| Ac. acid | Acetic acid |
| ANOVA | Analysis of variance |
| DFA | Discriminant function analysis |
References
- Nugrahaeningtyas, E.; Lee, J.S.; Park, K.H. Greenhouse gas emissions from livestock: Sources, estimation, and mitigation. J. Anim. Sci. Technol. 2024, 66, 1083–1098. [Google Scholar] [CrossRef]
- Gerber, P.J.; Steinfeld, H.; Henderson, B.; Mottet, A.; Opio, C.; Dijkman, J.; Falcucci, A.; Tempio, G. Tackling Climate Change Through Livestock: A Global Assessment of Emissions and Mitigation Opportunities; Food and Agriculture Organization of the United Nations (FAO): Rome, Italy, 2013; pp. 1–115. [Google Scholar]
- Gavrilova, O.; Leip, A.; Dong, H.; MacDonald, J.D.; Gomez Bravo, C.A.; Amon, B.; Barahona Rosales, R.; del Prado, A.; Oy-hantçabal, W.; van der Weerden, T.J.; et al. Chapter 10: Emissions from Livestock and Manure Management. In 2019 Refinement to the 2006 IPCC Guidelines for National Greenhouse Gas Inventories, Volume 4: Agriculture, Forestry and Other Land Use; IPCC National Greenhouse Gas Inventories Programme; Intergovernmental Panel on Climate Change (IPCC): Geneva, Switzerland, 2019. [Google Scholar]
- Groenestein, C.M.; Hutchings, N.J.; Haenel, H.D.; Amon, B.; Menzi, H.; Mikkelsen, M.H.; Misselbrook, T.H.; van Bruggen, C.; Kupper, T.; Webb, J. Comparison of ammonia emissions related to nitrogen use efficiency of livestock production in Europe. J. Clean. Prod. 2019, 211, 1162–1170. [Google Scholar] [CrossRef]
- Sutton, M.A.; Howard, C.M.; Erisman, J.W.; Billen, G.; Bleeker, A.; Grennfelt, P.; van Grinsven, H.; Grizzetti, B. The European Nitrogen Assessment: Sources, Effects and Policy Perspectives; Cambridge University Press: Cambridge, UK, 2011. [Google Scholar]
- ISPRA (Italian Institute for Environmental Protection and Research). Rapporto Rifiuti Speciali e Gestione degli Effluenti Zootecnici; ISPRA: Rome, Italy, 2023.
- Ogbuewu, I.P.; Odoemenam, V.U.; Omede, A.A.; Durunna, C.S.; Emenalom, O.O.; Uchegbu, M.C.; Ifeanyi Charles, O.; Iloeje, M.U. Livestock waste and its impact on the environment. Sci. J. Rev. 2012, 1, 17–32. [Google Scholar]
- Francioli, D.; Schulz, E.; Lentendu, G.; Wubet, T.; Buscot, F.; Reitz, T. Mineral vs. organic amendments: Microbial community structure, activity and abundance of agriculturally relevant microbes are driven by long-term fertilization strategies. Front. Microbiol. 2016, 7, 1446. [Google Scholar] [CrossRef] [PubMed]
- Zavattaro, L.; Bechini, L.; Grignani, C.; Van Evert, F.K.; Mallast, J.; Spiegel, H.; Sandén, T.; Pecio, A.; Giráldez Cervera, J.V.; Guzmán, G.; et al. Agronomic effects of bovine manure: A review of long-term European field experiments. Eur. J. Agron. 2017, 90, 127–138. [Google Scholar] [CrossRef]
- Bhunia, S.; Bhowmik, A.; Mallick, R.; Mukherjee, J. Agronomic efficiency of animal-derived organic fertilizers and their effects on biology and fertility of soil: A review. Agronomy 2021, 11, 823. [Google Scholar] [CrossRef]
- Möller, K. Effects of anaerobic digestion on soil carbon and nitrogen turnover, N emissions, and soil biological activity. A review. Agron. Sustain. Dev. 2015, 35, 1021–1041. [Google Scholar] [CrossRef]
- Carraro, G.; Tonderski, K.; Enrich-Prast, A. Solid-liquid separation of digestate from biogas plants: A systematic review of the techniques’ performance. J. Environ. Manage. 2024, 356, 120585. [Google Scholar] [CrossRef]
- Kupper, T.; Häni, C.; Neftel, A.; Kincaid, C.; Bühler, M.; Amon, B.; VanderZaag, A. Ammonia and greenhouse gas emissions from slurry storage-A review. Agric. Ecosyst. Environ. 2020, 300, 106963. [Google Scholar] [CrossRef]
- Petersen, S.O.; Sommer, S.G. Ammonia and nitrous oxide interactions: Roles of manure organic matter management. Anim. Feed Sci. Technol. 2011, 166, 503–513. [Google Scholar] [CrossRef]
- Scotto di Perta, E.; Giudicianni, P.; Mautone, A.; Grottola, C.M.; Cervelli, E.; Ragucci, R.; Pindozzi, S. An Effective bio-char application for reducing nitrogen emissions from buffalo digestate storage tank. Appl. Sci. 2024, 14, 6456. [Google Scholar] [CrossRef]
- Cao, X.; Mašek, O.; Cross, A. Biochar for ammonia removal: Mechanisms, key parameters and application. Environ. Pollut. 2020, 266, 115185. [Google Scholar]
- Sanchez-Monedero, M.A.; Cayuela, M.L.; Roig, A.; Jindo, K.; Mondini, C.; Bolan, N.J.B.T. Role of biochar as an additive in organic waste composting. Bioresour. Technol. 2018, 247, 1155–1164. [Google Scholar] [CrossRef]
- Fryda, L.; Visser, R. Biochar for Soil Improvement: Evaluation of Biochar from Gasification and Slow Pyrolysis. Agriculture 2015, 5, 1076–1115. [Google Scholar] [CrossRef]
- Sommer, S.G.; Clough, T.J.; Balaine, N.; Hafner, S.D.; Cameron, K.C. Transformation of organic matter and the emissions of methane and ammonia during storage of liquid manure as affected by acidification. J. Environ. Qual. 2017, 46, 514–521. [Google Scholar] [CrossRef]
- Wang, X.; Liu, X.; Wang, Z.; Sun, G.; Li, J. Greenhouse gas reduction and nitrogen conservation during manure composting by combining biochar with wood vinegar. J. Environ. Manag. 2022, 324, 116349. [Google Scholar] [CrossRef] [PubMed]
- Regueiro, I.; Gómez-Muñoz, B.; Lübeck, M.; Hjorth, M.; Jensen, L.S. Bio-acidification of animal slurry: Efficiency, stability and the mechanisms involved. Bioresour. Technol. Rep. 2022, 19, 101135. [Google Scholar]
- Holly, M.A.; Larson, R.A.; Powell, J.M.; Ruark, M.D.; Aguirre-Villegas, H. Greenhouse gas and ammonia emissions from digested and separated dairy manure during storage and after land application. Agric. Ecosyst. Environ. 2017, 239, 410–419. [Google Scholar] [CrossRef]
- Lee, C.; Hristov, A.N.; Cassidy, T.; Heyler, K. Nitrogen isotope fractionation and origin of ammonia nitrogen volatilized from cattle manure in simulated storage. Atmosphere 2011, 2, 256–270. [Google Scholar] [CrossRef]
- Misselbrook, T.; Hunt, J.; Perazzolo, F.; Provolo, G. Greenhouse gas and ammonia emissions from slurry storage: Impacts of temperature and potential mitigation through covering (pig slurry) or acidification (cattle slurry). J. Environ. Qual. 2016, 45, 1520–1530. [Google Scholar] [CrossRef]
- Rodhe, L.K.; Ascue, J.; Willén, A.; Persson, B.V.; Nordberg, Å. Greenhouse gas emissions from storage and field application of anaerobically digested and non-digested cattle slurry. Agric. Ecosyst. Environ. 2015, 199, 358–368. [Google Scholar] [CrossRef]
- Baral, K.R.; Jégo, G.; Amon, B.; Bol, R.; Chantigny, M.H.; Olesen, J.E.; Petersen, S.O. Greenhouse gas emissions during storage of manure and digestates: Key role of methane for prediction and mitigation. Agric. Syst. 2018, 166, 26–35. [Google Scholar] [CrossRef]
- Ahlberg-Eliasson, K.; Westerholm, M.; Isaksson, S.; Schnürer, A. Anaerobic digestion of animal manure and influence of organic loading rate and temperature on process performance, microbiology, and methane emission from digestates. Front. Energy Res. 2021, 9, 740314. [Google Scholar] [CrossRef]
- Silva, I.; Lapa, N.; Ribeiro, H.; Duarte, E. Pig Slurry Anaerobic Digestion: The Role of Biochar as an Additive Towards Biogas and Digestate Improvement. Appl. Sci. 2025, 15, 1037. [Google Scholar] [CrossRef]
- Akdeniz, N. A Systematic Review of Biochar Use in Animal Waste Composting. Waste Manag. 2019, 88, 291–300. [Google Scholar] [CrossRef]
- Baral, K.R.; McIlroy, J.; Lyons, G.; Johnston, C. The Effect of Biochar and Acid Activated Biochar on Ammonia Emissions During Manure Storage. Environ. Pollut. 2023, 317, 120815. [Google Scholar] [CrossRef]
- Maurer, D.L.; Koziel, J.A.; Kalus, K.; Andersen, D.S.; Opalinski, S. Pilot-Scale Testing of Non-Activated Biochar for Swine Manure Treatment and Mitigation of Ammonia, Hydrogen Sulfide, Odorous VOCs, and Greenhouse Gas Emissions. Sustainability 2017, 9, 929. [Google Scholar] [CrossRef]
- Wong, J.W.C.; Webber, J.B.W.; Ogbonnaya, U.O. Characteristics of Biochar Porosity by NMR and Study of Ammonium Ion Adsorption. J. Anal. Appl. Pyrolysis 2019, 143, 104687. [Google Scholar] [CrossRef]
- Brewer, C.E.; Schmidt-Rohr, K.; Satrio, J.A.; Brown, R.C. Characterization of biochar from fast pyrolysis and gasification systems. Environ. Prog. Sustain. Energy 2009, 28, 386–396. [Google Scholar] [CrossRef]
- Yu, L.; Tang, J.; Zhang, R.; Wu, Q.; Gong, M. Effects of Biochar Application on Soil Methane Emission at Different Soil Moisture Levels. Biol. Fertil. Soils 2013, 49, 119–128. [Google Scholar] [CrossRef]
- Wang, Q.; Awasthi, M.K.; Ren, X.; Zhao, J.; Li, R.; Wang, Z.; Wang, M.; Chen, H.; Zhang, Z. Combining Biochar, Zeolite and Wood Vinegar for Composting of Pig Manure: The Effect on Greenhouse Gas Emission and Nitrogen Conservation. Waste Manag. 2018, 74, 221–230. [Google Scholar] [CrossRef] [PubMed]
- Wu, Q.; Zhang, S.; Hou, B.; Zheng, H.; Deng, W.; Liu, D.; Tang, W. Study on the Preparation of Wood Vinegar from Biomass Residues by Carbonization Process. Bioresour. Technol. 2015, 179, 98–103. [Google Scholar] [CrossRef] [PubMed]
- Dai, K.; Wen, J.-L.; Zhang, F.; Zeng, R.J. Valuable Biochemical Production in Mixed Culture Fermentation: Fundamentals and Process Coupling. Appl. Microbiol. Biotechnol. 2017, 101, 6575–6586. [Google Scholar] [CrossRef] [PubMed]
- Hua, D.; Fan, Q.; Zhao, Y.; Xu, H.; Chen, L.; Si, H.; Li, Y. Continuous anaerobic digestion of wood vinegar wastewater from pyrolysis: Microbial diversity and functional genes prediction. Front. Bioeng. Biotechnol. 2020, 8, 923. [Google Scholar] [CrossRef]
- Bakshi, S.; Banik, C.; Laird, D.A. Quantification and Characterization of Chemically- and Thermally-Labile and Recalcitrant Biochar Fractions. Chemosphere 2018, 194, 247–255. [Google Scholar] [CrossRef]


| Livestock By-Products | pH | C org (%) | TN (%) | N-NH4 (%) | ||
|---|---|---|---|---|---|---|
| Raw digestate inc. 1 (RD1) | 8.1 | 53.1 | 8.79 | 2.73 | ||
| Raw digestate inc. 2 (RD2) | 8.3 | 76.1 | 12.6 | 6.5 | ||
| Digestate 1 liquid fraction (DLF) | 8.4 | n.d. | 13.9 | 3.31 | ||
| Slurry inc. 2 (SL2) | 8.2 | 66.6 | 13.7 | 4.9 | ||
| Slurry inc. 3 (SL3) | 7.1 | 40.2 | 9.8 | 3.97 | ||
| Treatments | pH | C org (%) | TN (%) | N-NH4 (%) | Bulk Density (kg L−1) | H:Corg |
| Biochar—pyrolysis (Bp) | 10.2 | 51.5 | 0.985 | 0.02 | 0.361 | 0.37 |
| Biochar—gasification (Bg) | 12.0 | 69.1 | 1.02 | <0.001 | 0.204 | 0.19 |
| pH | Ac. acid (%) | Total phenols (g kg−1) | Total polyphenols (g kg−1) | Bulk Density (kg L−1) | Heavy metals (mg kg−1) | |
| Wood vinegar (WV) | 3.15 | 2.45 | 2.9 | 16 | 1.05 | <1 |
| Incubation 1 Treatments | Labels |
|---|---|
| Raw digestate | RD1 |
| Raw digestate covered with 5 cm biochar from pyrolysis | RD1_5Bp |
| Digestate liquid fraction | DLF |
| Digestate liquid fraction covered with 1 cm biochar from pyrolysis | DLF_1Bp |
| Digestate liquid fraction covered with 2 cm biochar from pyrolysis | DLF_2Bp |
| Digestate liquid fraction covered with 5 cm biochar from pyrolysis | DLF_5Bp |
| Incubation 2 Treatments | Labels |
|---|---|
| Raw digestate | RD2 |
| Raw digestate covered with 5 cm biochar from pyrolysis | RD2_5Bp |
| Raw digestate covered with 5 cm biochar from pyrolysis activated with wood vinegar | RD2_5Bp_WV |
| Slurry | SL2 |
| Slurry covered with 5 cm biochar from pyrolysis | SL2_5Bp |
| Slurry covered with 5 cm biochar from pyrolysis activated with wood vinegar | SL2_5Bp_WV |
| Incubation 3 Treatments | Labels |
|---|---|
| Slurry | SL3 |
| Slurry covered with 5 cm biochar from pyrolysis | SL3_5Bp |
| Slurry covered with 5 cm biochar from gasification | SL3_5Bg |
| Slurry mixed with biochar from pyrolysis | SL3_MBp |
| Slurry mixed with biochar from gasification | SL3_MBg |
| Slurry covered with 5 cm biochar from gasification activated with wood vinegar | SL2_5Bg_WV |
| Slurry mixed with biochar from pyrolysis activated with wood vinegar | SL2_MBp_WV |
| NH3 | CH4 | CO2 | N2O | pH Initial | pH Final | |
|---|---|---|---|---|---|---|
| DLF vs. RD | 58 * | −60 n.s. | −14 n.s. | −47 n.s. | 4 * | n.d. |
| RD vs. SL | 56 * | 17 n.s. | 24 * | 41 n.s. | 3 * | −2 n.s. |
| Cover 5Bp (DLF) | −59 * | −13 n.s. | −53 * | 384 n.s. | n.d. | n.d. |
| Cover 5Bp (RD) | −39 * | 14 n.s. | −42 * | n.d. | n.d. | n.d. |
| Cover 5Bp (SL) | −44 * | 42 n.s. | −50 * | −59 n.s. | 2 * | −6 * |
| Cover 5Bp vs. MBp (SL) | −81 * | −2 n.s. | 4 n.s. | 485 * | n.d. | n.d. |
| Cover 5Bg vs. MBg (SL) | 13 n.s. | 329 * | 214 * | 326 n.s. | n.d. | n.d. |
| MBp (SL) | −21 n.s. | 59 n.s. | 3 n.s. | 706 n.s. | 2 * | 4 n.s. |
| MBg (SL) | −23 n.s. | −36 n.s. | −30 n.s. | 188 n.s. | 14 * | 1 n.s. |
| 5Bp vs. 5Bg (SL cover) | −83 * | −43 * | −51 * | 285 * | n.d. | n.d. |
| MBp vs. MBg (SL mixture) | 3 n.s. | 149 * | 47 n.s. | 180 n.s. | −11 * | 2 n.s. |
| Wood vinegar (RD cover Bp) | −63 * | 86 n.s. | 28 n.s. | n.d. | −4 * | −5 n.s. |
| Wood vinegar (SL cover Bp) | −66 * | 231 * | 90 * | n.d. | −3 * | −6 n.s. |
| Wood vinegar (SL cover Bg) | −55 * | −50 * | 18 * | 257 * | n.d. | n.d. |
| Wood vinegar (SL mixed Bp) | 7 n.s. | −55* | −7 n.s. | −94 n.s. | 0 n.s. | −1 n.s. |
Disclaimer/Publisher’s Note: The statements, opinions and data contained in all publications are solely those of the individual author(s) and contributor(s) and not of MDPI and/or the editor(s). MDPI and/or the editor(s) disclaim responsibility for any injury to people or property resulting from any ideas, methods, instructions or products referred to in the content. |
© 2025 by the authors. Licensee MDPI, Basel, Switzerland. This article is an open access article distributed under the terms and conditions of the Creative Commons Attribution (CC BY) license (https://creativecommons.org/licenses/by/4.0/).
Share and Cite
Lagomarsino, A.; Verga, E.; Valagussa, M.; Rispoli, S.; Rocchi, F.; Becagli, C.; Tosca, A. Optimizing Livestock By-Products Storage to Reduce Ammonia and Greenhouse Gas Emissions Using Biochar and Wood Vinegar. Atmosphere 2025, 16, 509. https://doi.org/10.3390/atmos16050509
Lagomarsino A, Verga E, Valagussa M, Rispoli S, Rocchi F, Becagli C, Tosca A. Optimizing Livestock By-Products Storage to Reduce Ammonia and Greenhouse Gas Emissions Using Biochar and Wood Vinegar. Atmosphere. 2025; 16(5):509. https://doi.org/10.3390/atmos16050509
Chicago/Turabian StyleLagomarsino, Alessandra, Edoardo Verga, Massimo Valagussa, Stefano Rispoli, Filippo Rocchi, Claudia Becagli, and Alberto Tosca. 2025. "Optimizing Livestock By-Products Storage to Reduce Ammonia and Greenhouse Gas Emissions Using Biochar and Wood Vinegar" Atmosphere 16, no. 5: 509. https://doi.org/10.3390/atmos16050509
APA StyleLagomarsino, A., Verga, E., Valagussa, M., Rispoli, S., Rocchi, F., Becagli, C., & Tosca, A. (2025). Optimizing Livestock By-Products Storage to Reduce Ammonia and Greenhouse Gas Emissions Using Biochar and Wood Vinegar. Atmosphere, 16(5), 509. https://doi.org/10.3390/atmos16050509