Article

Carbon Neutrality and Resilient Districts, a Common Strategy in European Union Countries in 2050

by
Modeste Kameni Nematchoua
1,2,*,
Minoson Sendrahasina Rakotomalala
2 and
Sigrid Reiter
3
1
Department of Physic, Faculty of Sciences, University of Yaounde I, Yaounde P.O. Box 337, Cameroon
2
Institute for the Management of Energy (IME), University of Antananarivo, P.O. Box 566, Antananarivo 101, Madagascar
3
LEMA, UEE, ArGEnCo Department, University of Liège, 4000 Liège, Belgium
*
Author to whom correspondence should be addressed.
Atmosphere 2025, 16(5), 508; https://doi.org/10.3390/atmos16050508
Submission received: 24 March 2025 / Revised: 18 April 2025 / Accepted: 23 April 2025 / Published: 28 April 2025
(This article belongs to the Section Climatology)

Abstract

:
Confronted with the climate emergency, reducing CO2 emissions has become a priority for all nations of the world because the follow-up of humanity depends on it. Most European Union (EU) member states have pledged to cut their net greenhouse gas emissions by at least 55% by 2030 and reach full carbon neutrality by 2050, using 1990 as the baseline year. Despite this common effort, there is still a lack of effective decision-making on carbon neutrality strategies applied throughout the life cycle of a building in all EU countries. A common strategy is proposed in this study to fill this gap in the literature. The building sector is a real lever for reducing the carbon footprint and saving energy. Currently, the methodology for achieving large-scale carbon neutrality is well established. However, there is only a limited number of experts worldwide who have mastered this technology, making it challenging to develop a standardized approach for all nations. The absence of extensive, regular, and consistent data on carbon emissions has considerably hindered the understanding of the root causes of climate change at both the building and neighborhood levels. Is it not it time to break this barrier? With this in mind, this study was carried out with the intention of proposing a common method to achieve carbon neutrality at the neighborhood scale in European Union countries. The most significant parameters having a direct impact on carbon emissions have facilitated the adaptation of the three types of neighborhood in the different capitals of the EU countries, in particular, local building materials, microclimate, the energy mix of each country, and the mode of daily transport. The life cycle assessment of the three districts was conducted using the Plaides LCAv6.25.3 tool in combination with Meteonorm software version 8.2.0, considering a 100-year lifespan for the buildings. In addition, the cost of the various environmental impacts is assessed based on the monetary indicators for European Committee for Standardization indicators method. The main results showed that the distribution of carbon dioxide is 73.3% higher in urban areas than in sustainable neighborhoods and 39.0% higher in urban districts than in rural districts. Nearly zero emissions in the next decade are again possible by applying the scenario involves global warming combined with the complete (100%) renovation of all buildings and the transition to 100% electric vehicles along with the use of solar panels. This strategy makes it possible to reduce between 90.1% and 99.9% of the emission rate in residential districts regarding EU countries.

1. Introduction

Since 2008, European Union nations have made a substantial commitment to gradually phase out fossil fuels, which significantly contribute to atmospheric pollution, in favor of renewable energy sources that are more environmentally friendly. In line with this, the 2015 Paris Agreement and numerous other intergovernmental accords were signed with the goal of achieving carbon neutrality by 2050. However, the climate emergency demands urgent and decisive action in the short term, as recent climate projections suggest that global temperatures could exceed the 2 °C limit set by the Paris Agreement [1,2]. Addressing carbon neutrality at the neighborhood level is therefore critical, as local urban environments are responsible for a substantial share of energy consumption and greenhouse gas emissions and offer a practical scale for implementing decarbonization strategies tailored to specific social and spatial contexts. In recent years, most European Union countries have made considerable strides toward a less carbon-intensive and more climate-friendly model. From 1990 to 2018, all EU nations collectively reduced their greenhouse gas emissions by nearly 25% [1]. Despite this significant achievement, emissions must be further cut by 55% by 2030 compared to 1990 levels and reach net-zero by 2050 to avoid the catastrophic impacts of climate change [1,2]. The current trajectory, especially after the Ukraine war, may jeopardize these goals. According to the latest assessments, the emissions peak must be reached this year, followed by annual reductions of over 7.6%—a level only briefly achieved during the 2020 COVID-19 lockdowns [3]. To accelerate progress, the EU has adopted ambitious frameworks such as the European Green Deal, the Fit for 55 package, and the National Energy and Climate Plans (NECPs) [2,3,4]. However, these policies must be translated into actionable and scalable interventions at the urban scale, particularly in the building and mobility sectors. The World Green Building Council highlights that all new buildings must be net-zero by 2030, with all buildings—including existing ones—reaching net-zero by 2050 [5]. Engineers and experts have proposed energy codes and design strategies, but large knowledge gaps remain—particularly on how to scale up these efforts from buildings to neighborhoods while adapting them to local urban, social, and climatic conditions [6]. Despite growing interest in urban decarbonization, there is currently no unified approach for evaluating and achieving carbon neutrality at the neighborhood scale across the EU. Existing methods often focus on individual buildings or cities without considering the full life cycle of carbon emissions or the influence of local energy mixes and infrastructure. This research fills this gap by proposing a common modeling strategy—tested on three Belgian case studies and extended across EU countries—to assess the feasibility and impact of achieving net-zero emissions at the neighborhood level. Accordingly, this paper addresses the following key research questions: (1) How can a unified, life cycle-based strategy be developed for neighborhood-level carbon neutrality in EU countries? (2) What is the influence of national energy mixes and local contexts on emissions reduction potential? (3) How can renewable energy integration and building retrofits support the EU’s carbon goals? This study is organized into seven main sections: (a) an experimental study was conducted in various neighborhoods, initially located in Belgium, to gather the necessary data for modeling; (b) these three districts were replicated in different EU countries, taking into account their energy mix, climatic conditions, construction materials, and transportation systems; (c) the CO2 emission rates and associated costs were assessed for each country; (d) using the IPCC RCP 4.5 scenario, emissions for 2050 were projected; (e) photovoltaic systems (PVs) were installed in each neighborhood, and emissions were recalculated; (f) all buildings were retrofitted, PV systems and electric vehicles were added, and heat pumps were installed to further reduce emissions and costs; (g) a comparative analysis was carried out to evaluate the effectiveness of the proposed strategy across EU regions.

2. A Review

It is widely acknowledged that net-zero emission buildings rely on renewable energy to replace electricity from the grid, which is predominantly generated by fossil fuels, in order to offset the annual carbon emissions associated with their operations [7,8]. Conversely, zero-carbon buildings are designed to be highly energy-efficient and rely entirely on renewable energy sources generated on-site. Research focused on carbon neutrality in the building sector is gaining momentum [9], yet the existing literature remains limited and lacks more practical tools and objective decision-making frameworks that can regularly identify decarbonization opportunities throughout the entire life cycle of a construction project [10]. A study by Ray [11] on German apartments constructed between the 1950s and 1970s found that (a) reaching low carbon would necessitate an important PV system, estimated to be 60% bigger than the conventional optimal system, and (b) under current conditions, it is more economically viable to invest in wind energy rather than solar power in certain EU countries [12,13]. In another study, Kennedy and Sgouridis [14] identified various emission categories to explain the transition to neutral and low-carbon urban centers. In 2021, research by Nematchoua et al. [15] examined the impact of the electricity mix on CO2 emissions and found that replacing coal with photovoltaic panels could reduce up to 48% of the total operational carbon emissions from the World Trade Center. The literature highlights two main strategies for attaining carbon neutrality: the first concentrates on policies and strategies that minimize carbon dioxide emissions, whereas the second focuses on technologies dedicated to extracting carbon from the atmosphere. In 2021, Chen [16] explained that between 1850 and 2022, the global average CO2 concentration increased from 285 to 419 ppm. As a result, the global average air temperature was expected to rise by 0.9 to 1.3 °C. Without effective strategies to mitigate CO2 emissions, the level of CO2 in the atmosphere will keep increasing. In 2019, Maximillian et al. [17] and later in 2022, Yang et al. [18] indicated that the increase in global temperature is causing significant damage to human living environments, including ocean acidification, floods, droughts, forest fires, and loss of biodiversity. In 2015, several countries agreed to implement a strategy aimed at limiting the global temperature increase to remain below 1.5 °C, as specified in the Paris Agreement (see Modeste et al. [19,20]). In 2021, Chen [16] mentioned that 124 nations had pledged to reach net-zero carbon emissions between 2050 and 2060. To achieve the objectives outlined in the Paris Agreement and foster sustainable development, it is advised to not only decrease carbon dioxide emissions but also to capture it from the atmosphere, aiming for negative carbon emissions or net-zero carbon through various technological, environmental, and economic measures.
Achieving net-zero carbon requires not only reducing CO2 emissions but also removing CO2 from the atmosphere through various economic and social measures. Carbon neutrality, which refers to achieving net-zero carbon emissions, can be reached by balancing the total CO2 emitted by a region, nation, organization, material, or individual over a defined period through carbon removal strategies or offsets. To reach this goal, the Intergovernmental Panel on Climate Change (IPCC) emphasizes the necessity of reducing fossil fuel use, increasing reliance on renewable energy, and improving energy efficiency.
The use of fossil fuels has significantly increased global CO2 concentrations, especially in 2020, and is a major contributor to climate change [21]. This is why, in 2021, Li et al. [22] highlighted that, without effective policies and initiatives implemented by various countries, the deteriorating environmental conditions will continue to have a severe impact on future generations. While the Paris Climate Agreement encouraged global efforts to achieve carbon neutrality, it is evident that each region, city, and country adopts different approaches, initiatives, and measures to reduce carbon emissions [23,24]. For instance, Zhao et al. [23] indicated that the Chinese government aims to hit peak carbon emissions by 2030 and attain carbon neutrality by 2060, working towards net-zero CO2 emissions. Despite the growing body of literature on carbon neutrality and net-zero buildings, current approaches often lack comprehensive life cycle integration, objective decision-making frameworks, and adaptability to different regional energy contexts. Many studies focus on individual components—such as energy efficiency or renewable supply—without offering a holistic assessment that incorporates both technological and environmental constraints. Furthermore, existing methods rarely offer practical tools that stakeholders can apply throughout a project’s life cycle to assess decarbonization pathways. This work aims to bridge these gaps by proposing an integrated, life cycle-based framework that combines environmental analysis with adaptable decision-making tools, providing a more practical and scalable approach to achieving carbon neutrality in the building sector.

3. Methodology

In this section, we outline and justify our choices regarding the initial neighborhoods studied, the assumptions made concerning life cycle assessment (LCA), the analysis tools adopted, and other instruments used in this study.
LCA is a highly effective technique for determining the environmental impact of a product system throughout its entire life cycle [25]. The LCA process begins with defining the goals and scope, followed by creating a life cycle inventory, conducting a life cycle impact assessment, and concluding with the interpretation and presentation of the results [26]. LCA is extensively applied in different carbon-neutral systems to objectively measure greenhouse gases and their related impacts on climate change [27].
To conduct this study, we followed these steps: (i) Initial model selection: We chose an initial neighborhood, whose environmental impacts (greenhouse gases) were analyzed using the LCA method. This neighborhood served as a benchmark for comparison. (ii) Analysis software: We utilized a specialized software suite for dynamic thermal analysis and LCA, specifically tailored to building- and neighborhood-scale evaluations (Pleiades LCA, IZUBA company, Paris, France). (iii) Scenario development: We defined several scenarios by varying specific parameters to assess different outcomes. (iv) Scenario analysis and comparison: Finally, we analyzed the different scenarios and compared them to the initial model to draw meaningful conclusions.

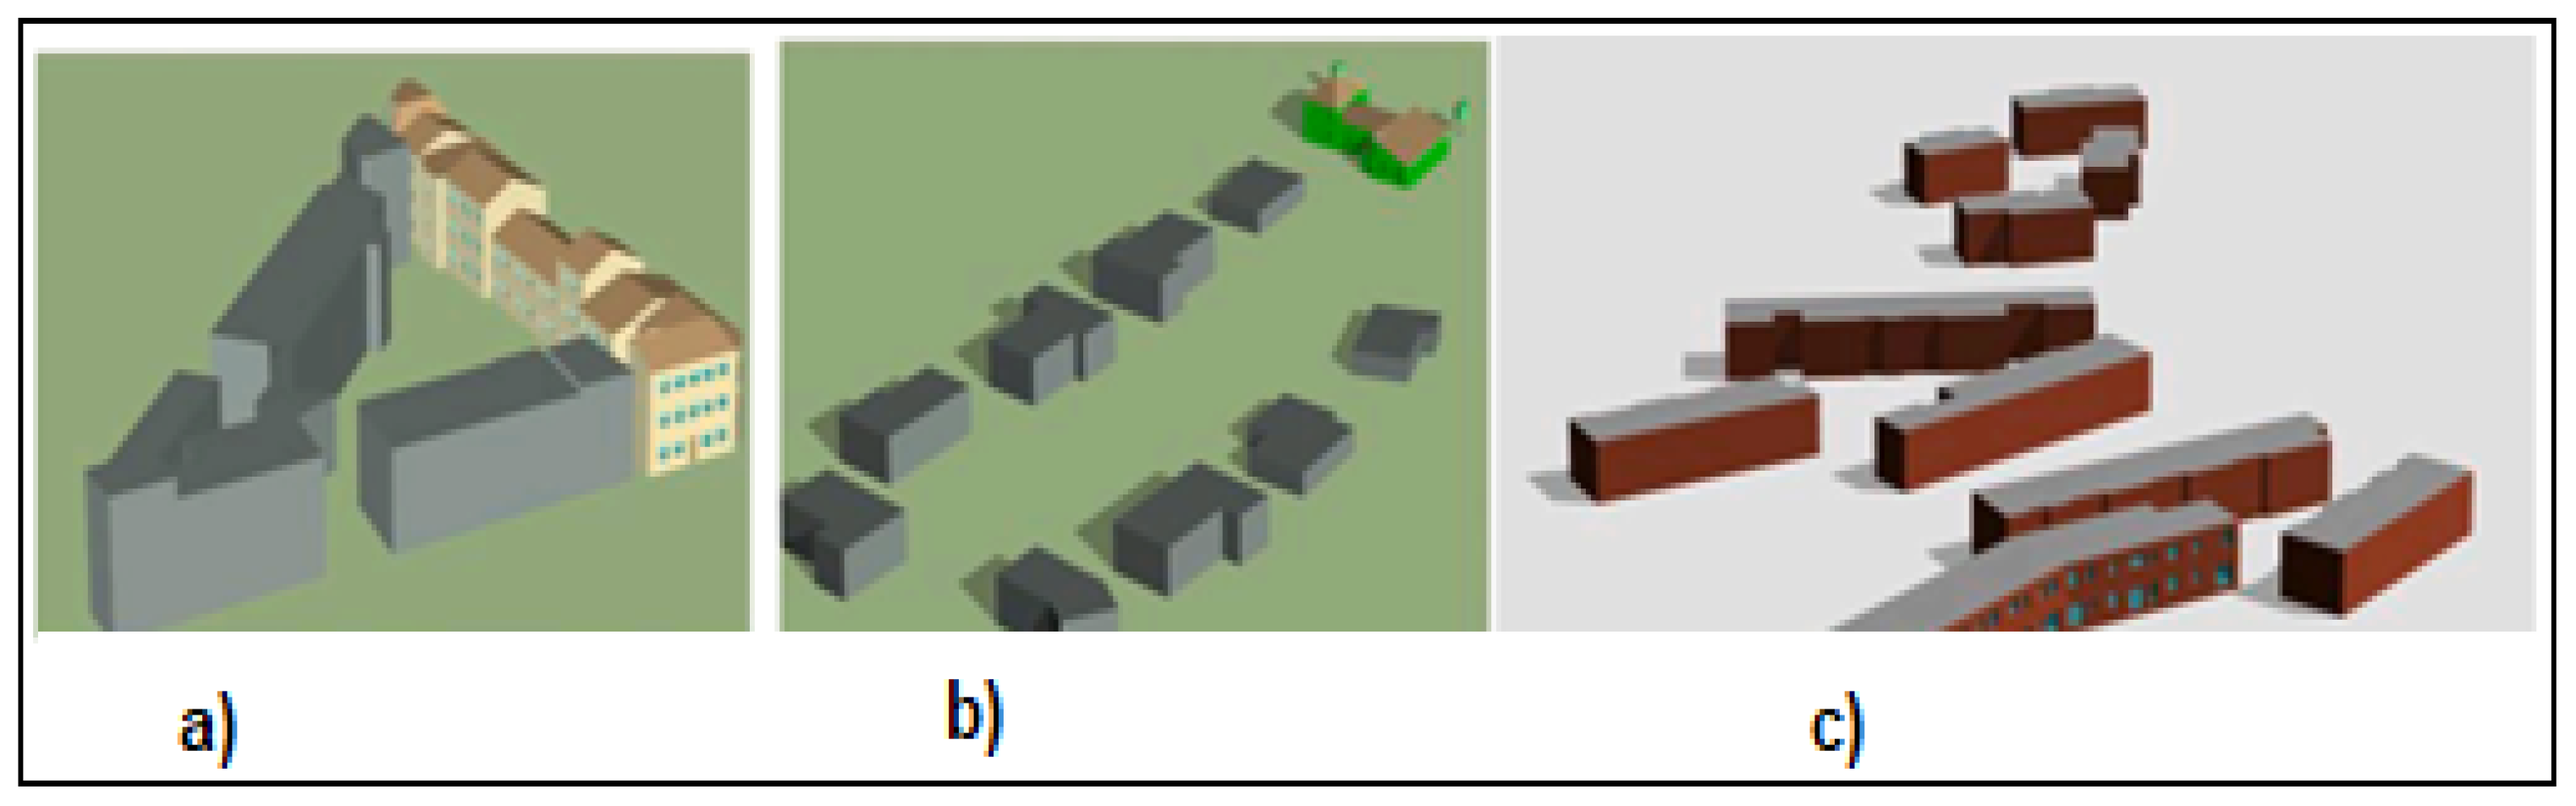
3.1. District Selection

To ground our study in real-world scenarios, we decided to base our analysis on concrete cases. This approach allowed for us to model three existing districts according to their precise layouts and subsequently apply a range of virtual parameters.
The first district selected is Sart-Tilman, an eco-district in Liège, Belgium, located in the Wallonia region. This district was chosen due to its temperate climate, characterized by a long cold season each year, and its proximity to the University of Liège. Additionally, its recent construction makes it an ideal candidate for analysis.
The second district is an urban block in Saint Léonard, Liège, specifically at Maghin Street, which will be referred to as the Maghin neighborhood. The third district is a rural block located in Neupre, also in Wallonia, and will be called the Neupre neighborhood. These three neighborhoods, all situated within the province of Liège, were selected for their distinct characteristics, providing a variety of contexts for our study.

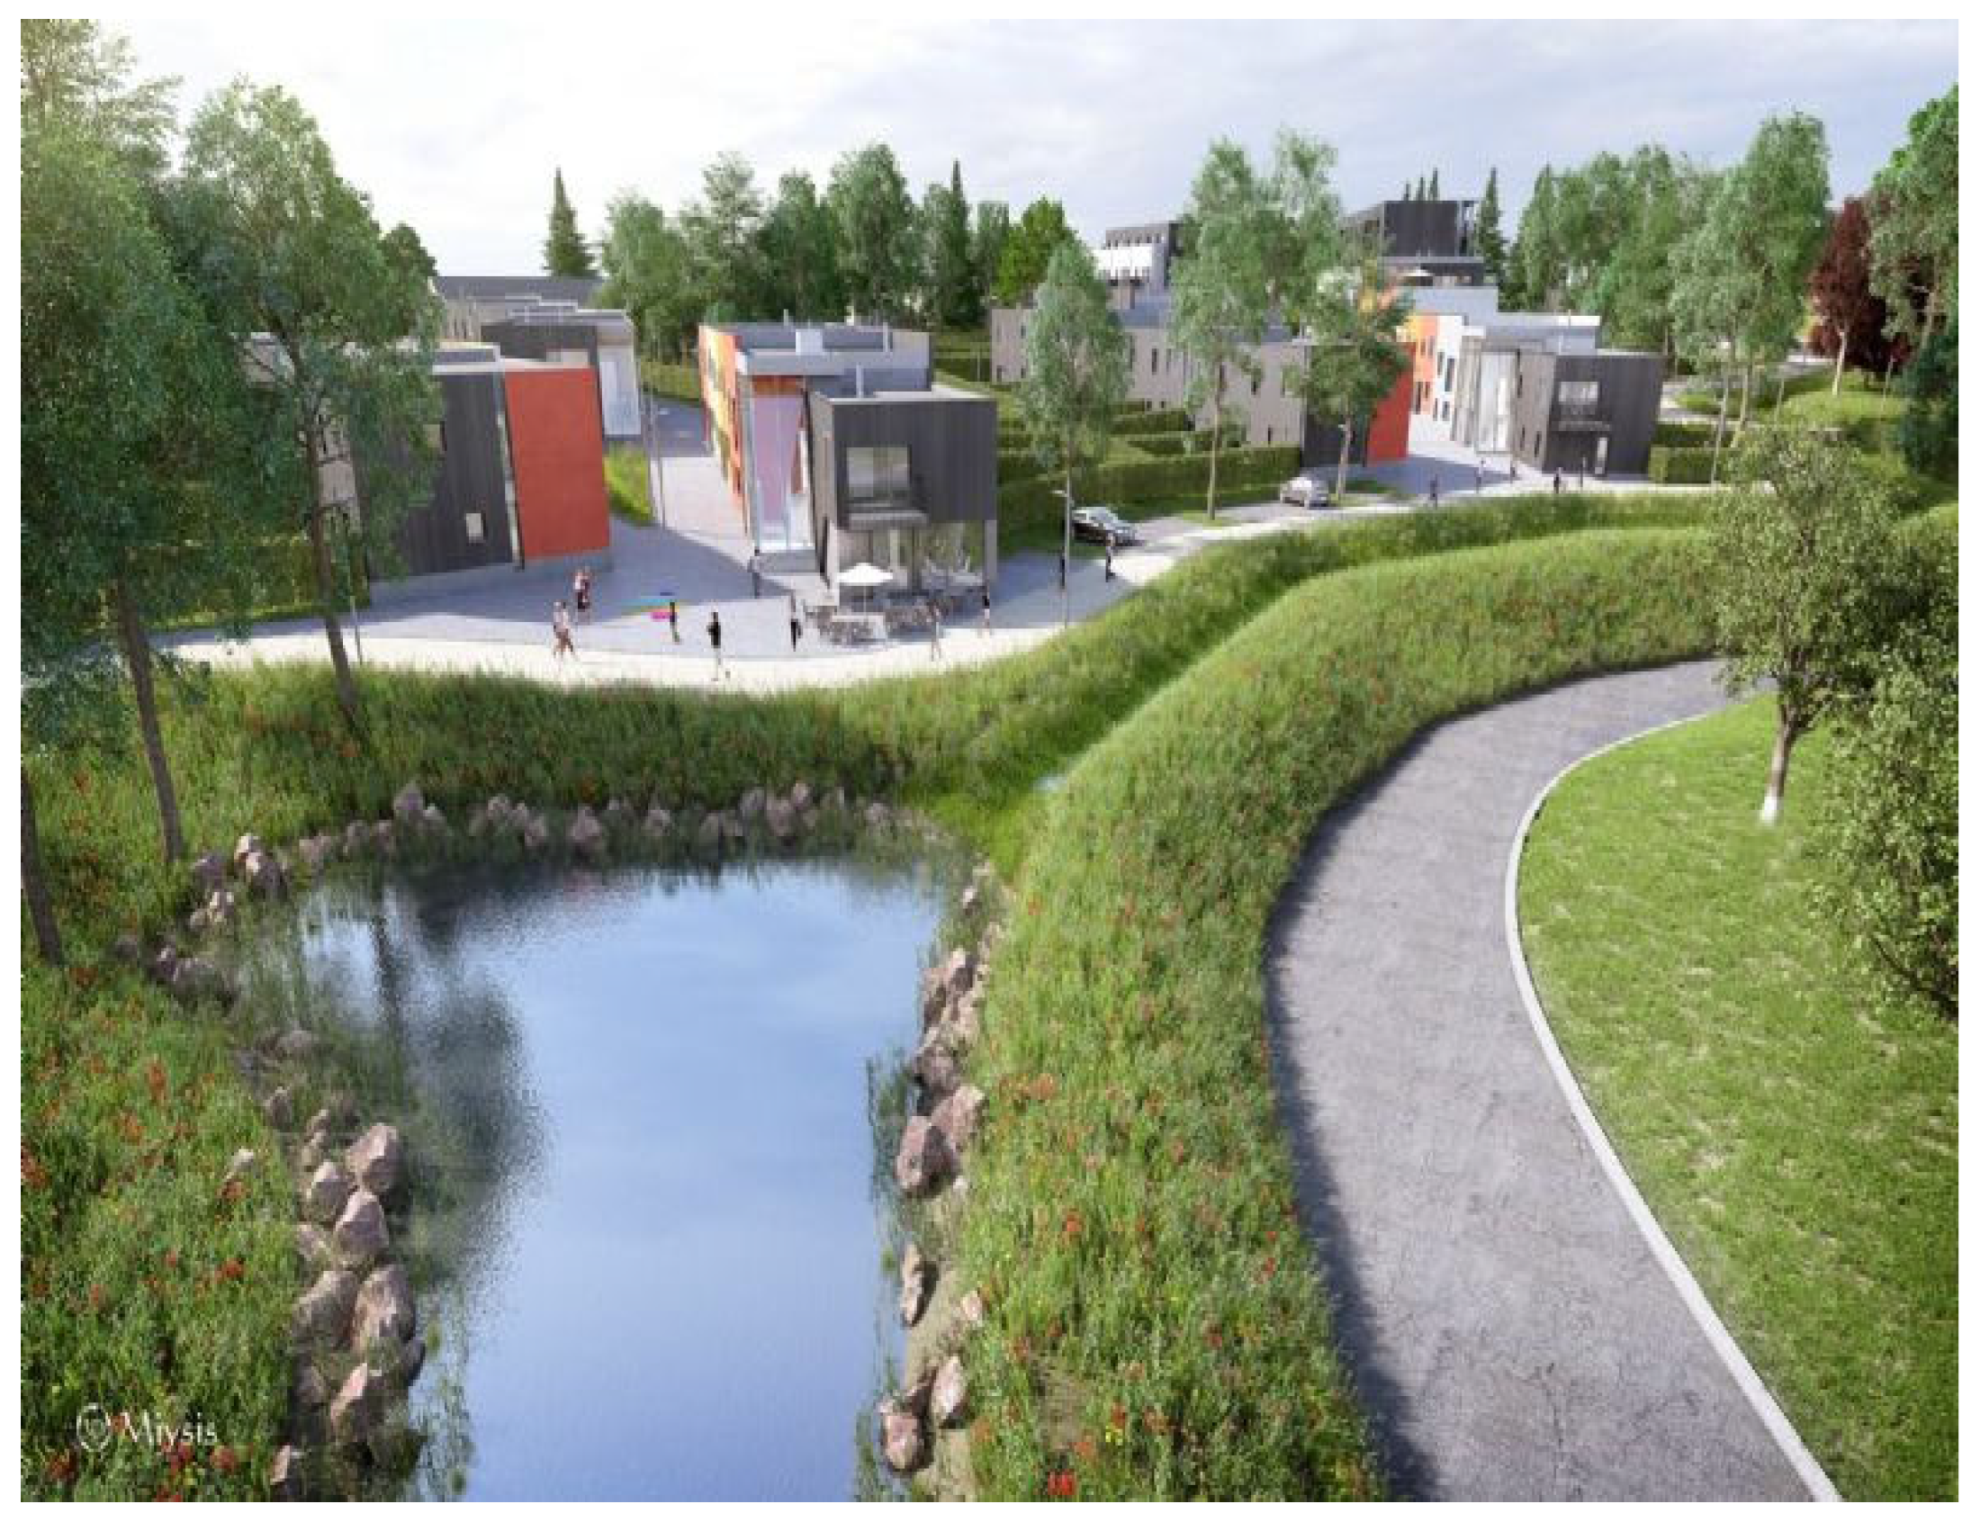
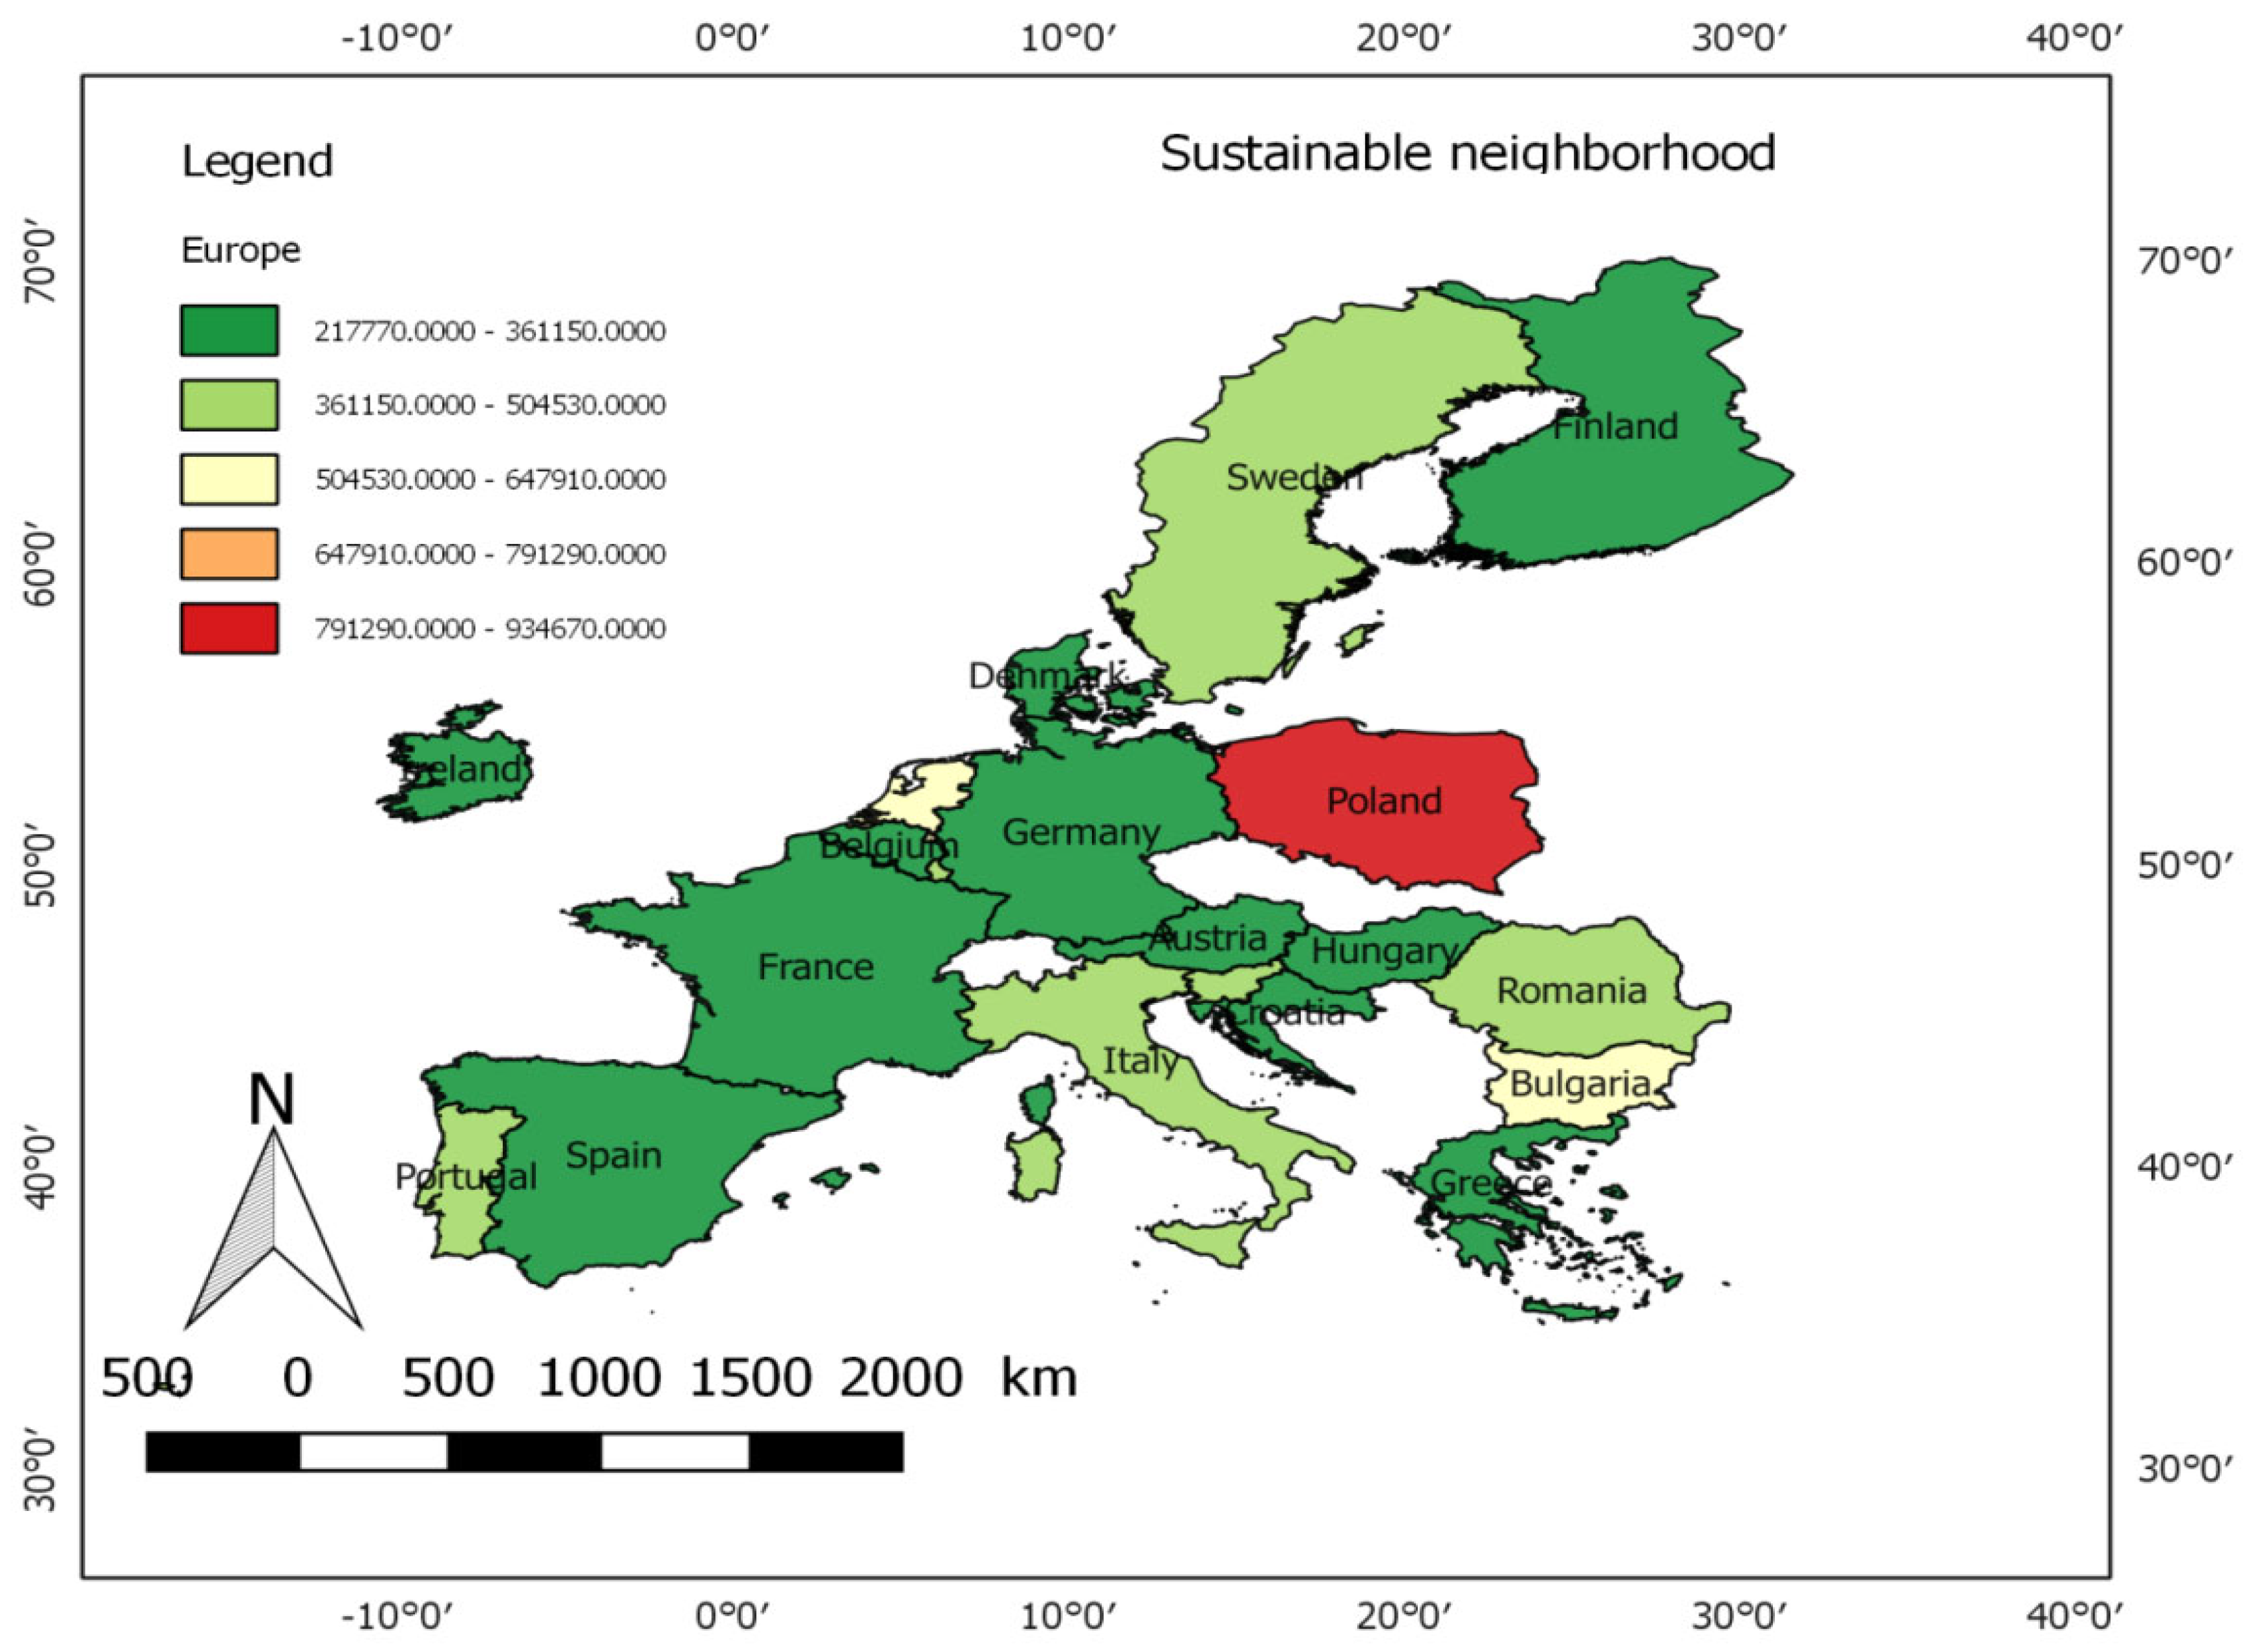
3.1.1. Sustainable Neighborhood, a Case of Sart-Tilman City

The sustainable community is positioned south of Liège city. Well-connected to the city center by public transport, the neighborhood benefits from its proximity to the University of Liège. It offers a variety of building types, including apartment complexes and semi-detached single-family homes. The neighborhood also serves multiple functions: while the majority of the built surface is dedicated to housing, there are spaces allocated for commercial activities, professional offices, and small businesses.
Altogether, the area comprises 40 compact apartments, 45 more spacious units, 11 two-family homes, and 6 other functional spaces (such as shops and businesses). Private parking is available close to the buildings, and the ground-floor units include private gardens.
The district closely follows the standards established by the sustainable district guidelines published by the University of Liège. Over 40% of the housing units are attached, and the site has a density of 40 dwellings per hectare. The outdoor spaces have been thoughtfully designed, with more than 30% dedicated to “green” or “blue” surfaces. Additionally, the site incorporates separate management for rainwater and wastewater (see Figure 1).
The selection of functional unit was vital for this research. We chose to focus specifically on the residential portion of the neighborhood. To systematically evaluate the environmental effects, we computed the impacts based on three separate functional units.
This district was modeled within the context of a suburban area near the downtown of every country being studied.
Key technologies identified in sustainable neighborhood design include the following: (a) Compact buildings with optimal orientation, taking into account the sun’s path to maximize natural light and heat. (b) Thick, thermally insulated walls with air sealing to minimize heat loss. (c) Double-glazing with high thermal performance, or triple-glazing, designed to significantly reduce energy loss. (d) Solar shading solutions, high-inertia materials for interior walls, and intensive night ventilation systems to naturally cool the buildings. (e) Efficient ventilation systems that ensure optimal air quality while reducing energy consumption. (f) A high-performance heating system integrated with a smart thermostat to optimize energy use. (g) The installation of PV panels to generate electricity, harnessing renewable energy from the sun.

3.1.2. Urban Neighborhood: Maghin

The urban neighborhood studied is located in the city center of Liège, a region that underwent rapid urbanization during the 20th century. This district comprises a mix of residential buildings surrounding shopping centers and office spaces, covering a total area of 8726 m2. The buildings in this area share similar shapes and structures, offering a consistent architectural style across the district. Details about the characteristics of this neighborhood are summarized in Table 1.
For this study, we replicated this neighborhood layout in the downtown areas of the capital cities of each country studied. Most buildings in this district have at least two floors, with a variety of geometric shapes. The buildings range in design, with some having two, three, or four facades, and varying living areas, as illustrated in Figure 2.

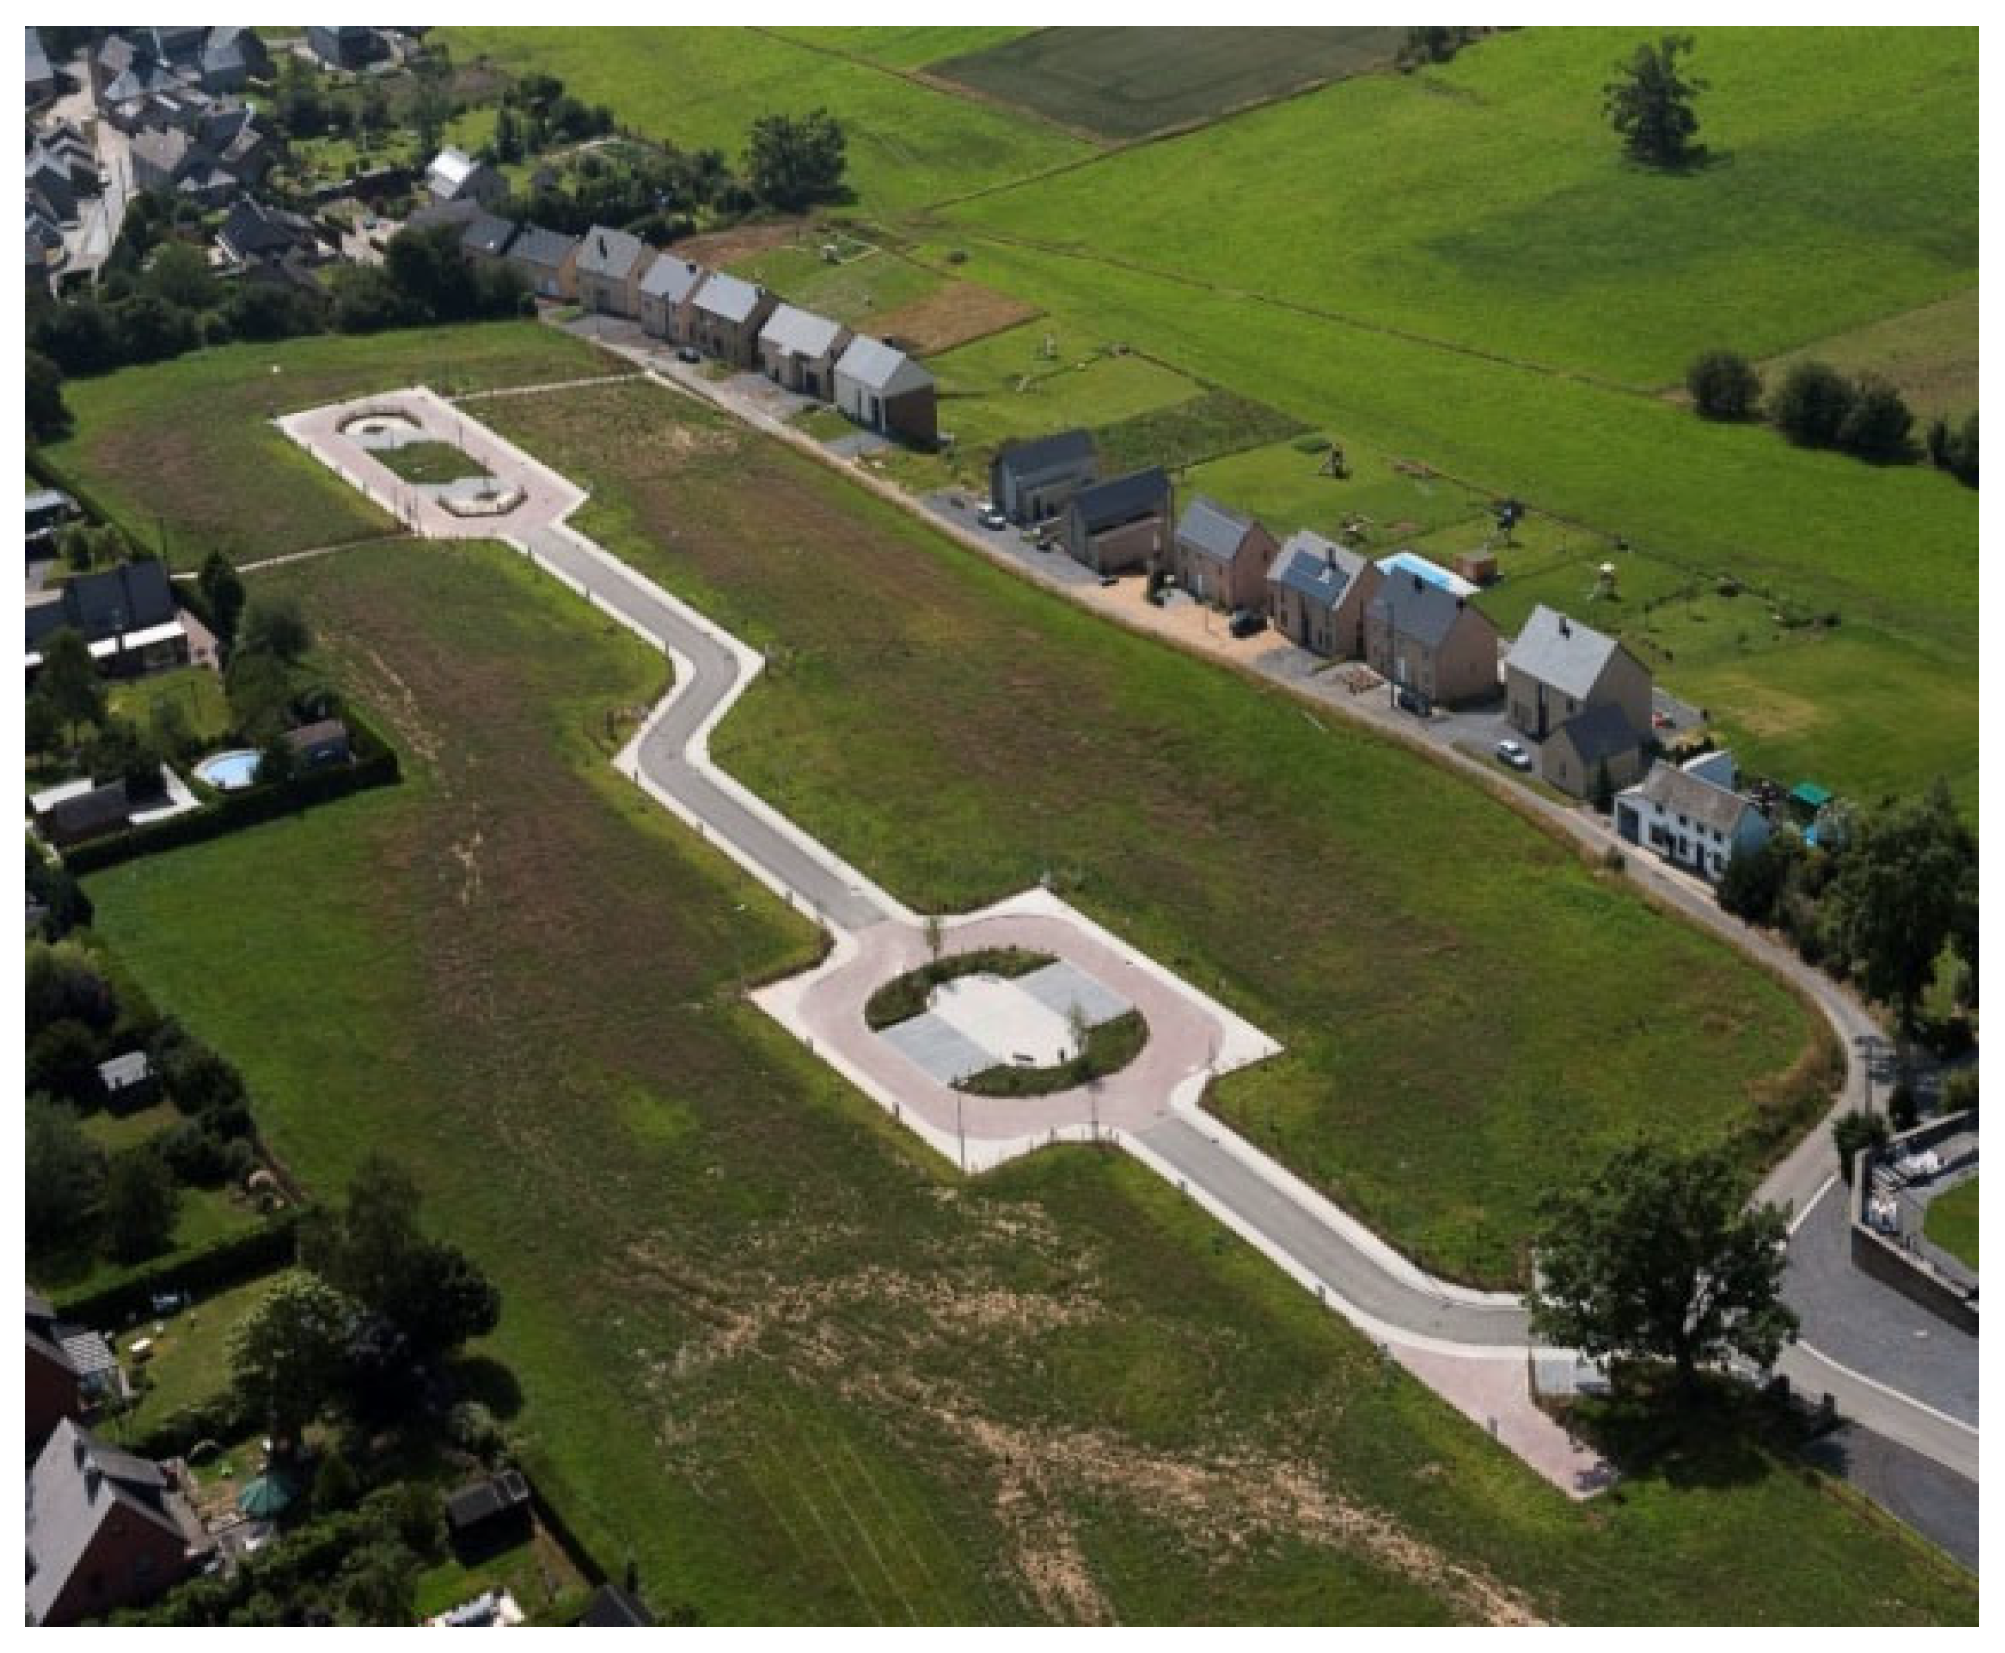
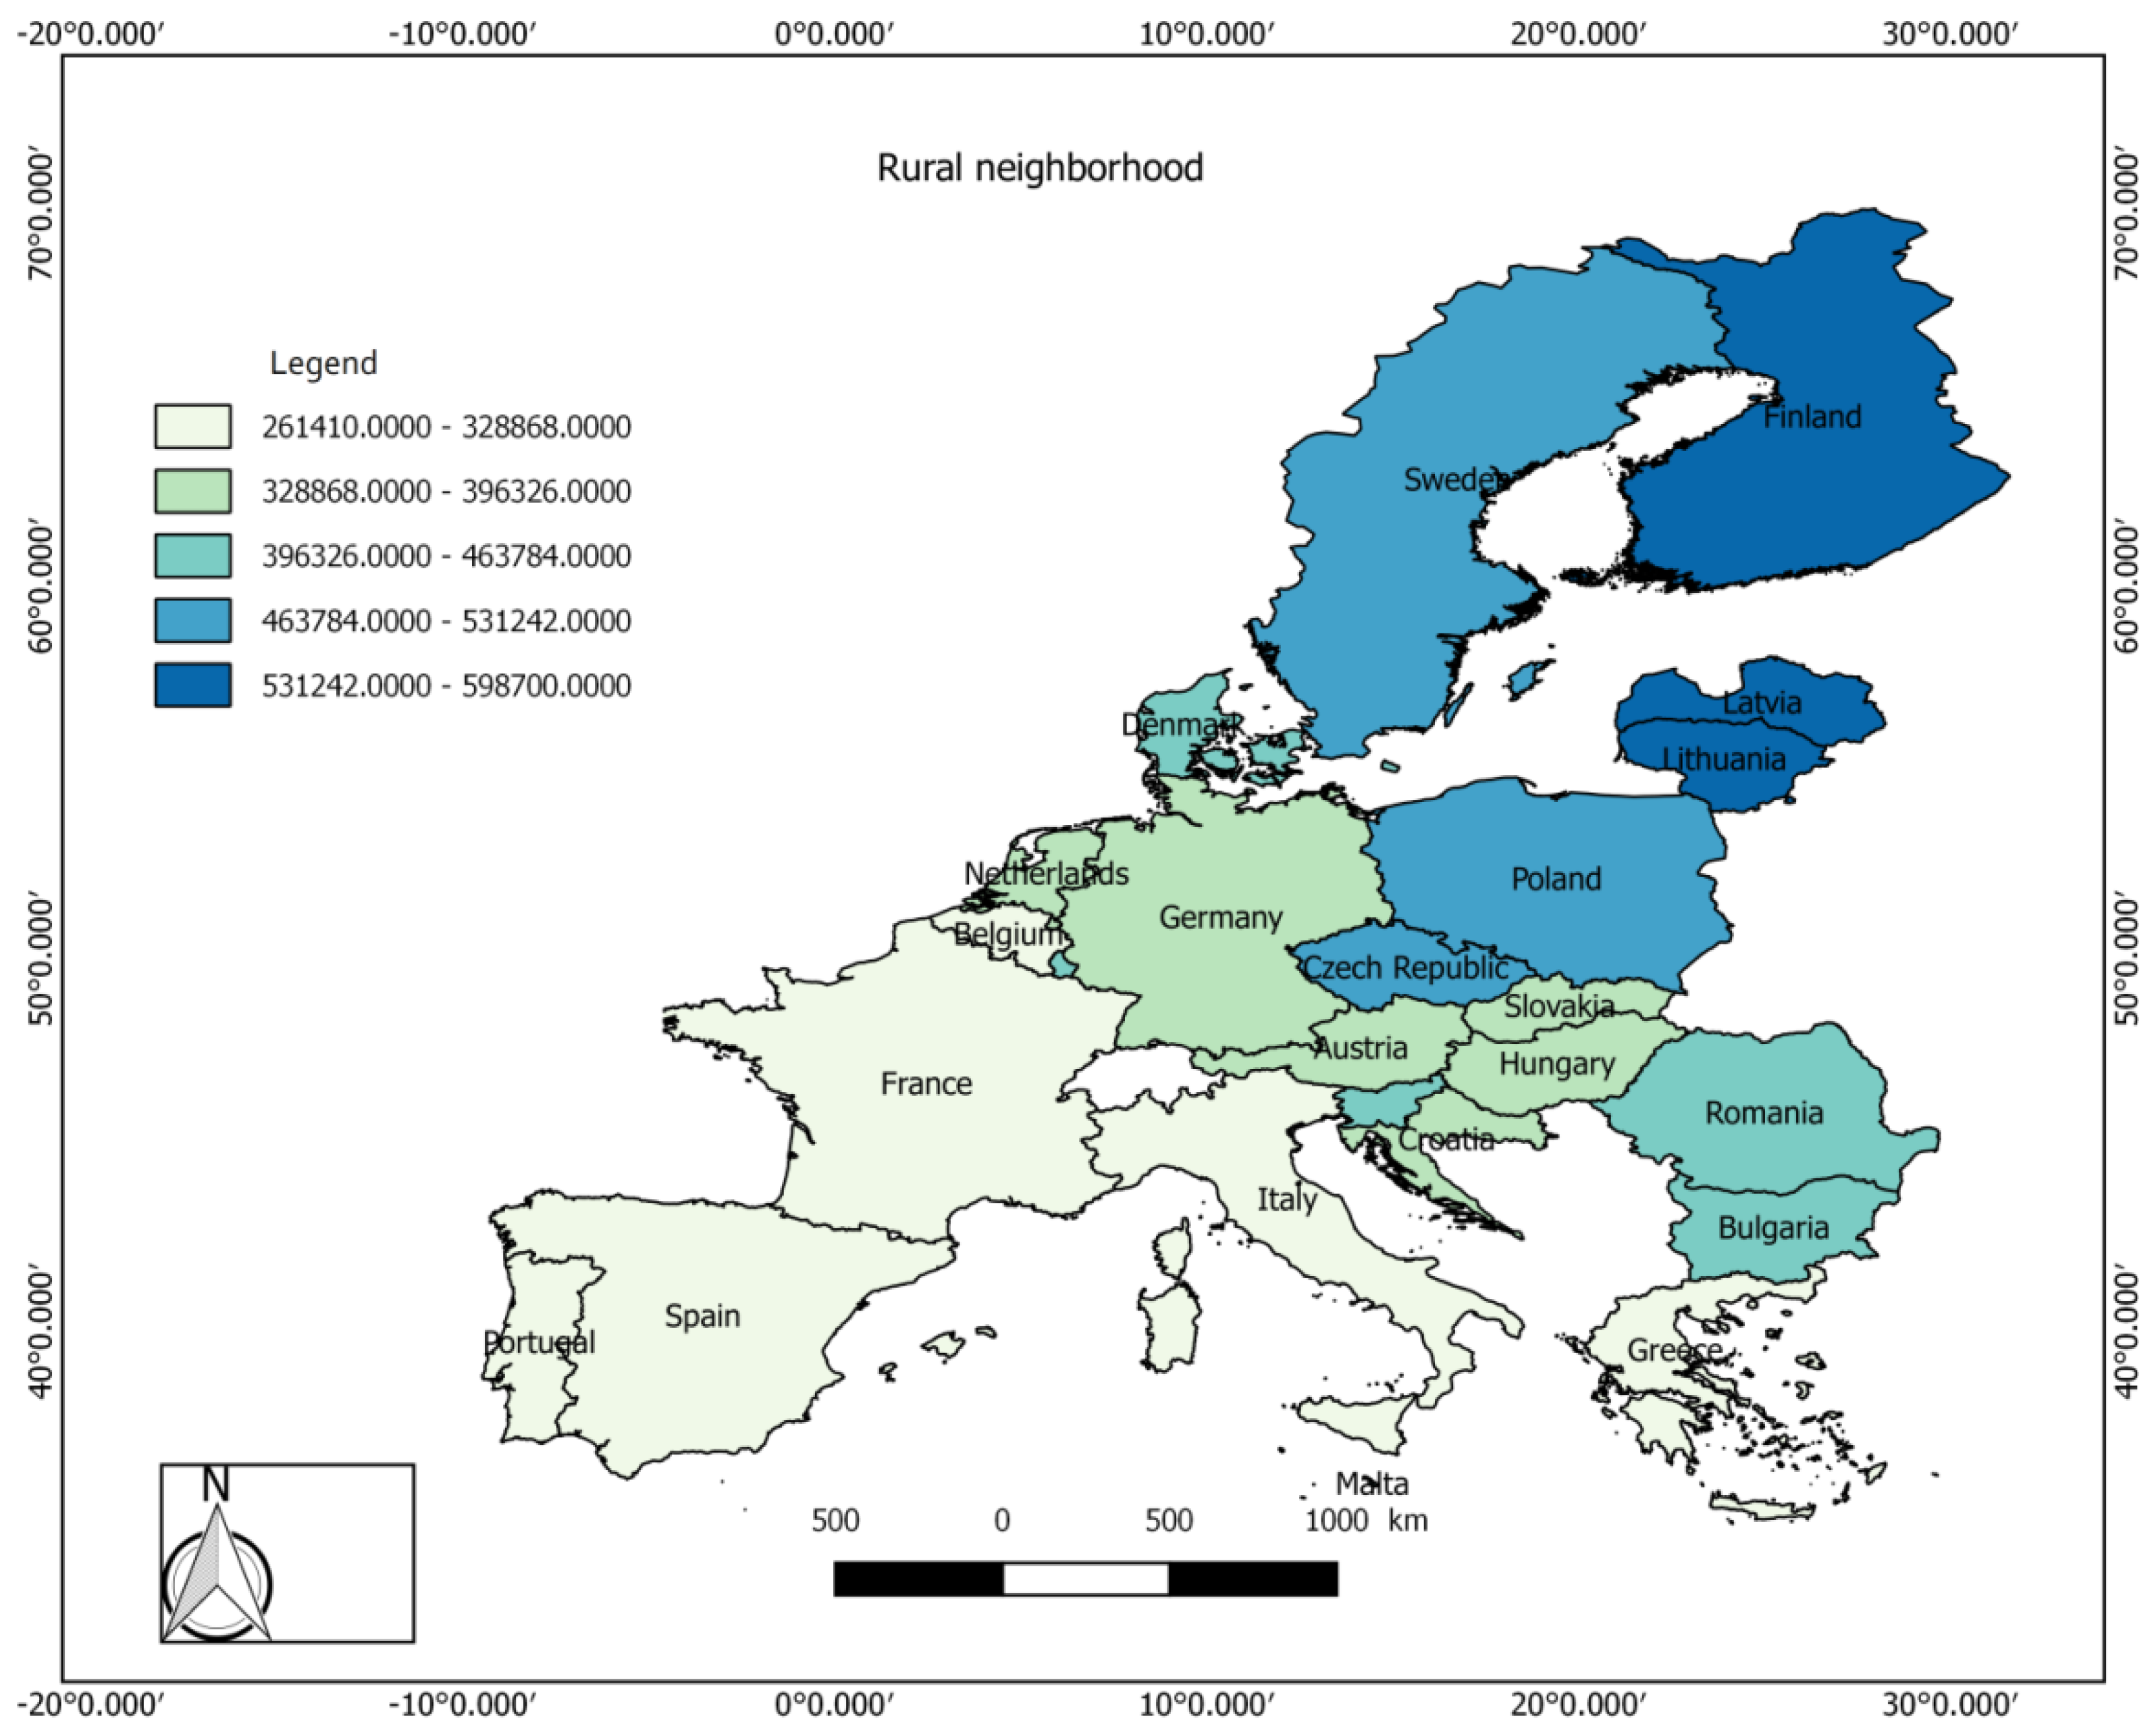
3.1.3. Rural Neighborhood in Neupre

The rural neighborhood covers a total area of 19,457 m2. It is primarily composed of residential buildings, with the total number of accommodations being three times fewer than in the urban district. This neighborhood lacks highways, and public transportation is limited to bus services. The buildings along both sides of the street are mostly aged, with many having been constructed between the 17th and 19th centuries.
For the purposes of this study, the author modelled this district to represent areas located in the northern part of the cities of all the different place studied, as shown in Figure 3.
In this study, the author adapted the built space occupied by each district to reflect conditions in different European Union countries. As part of a sensitivity analysis, and based on a recent World Bank report, the living area per inhabitant was considered to vary between 30 and 50 m2 across these countries.
As shown, the rural district has a lower population density compared to the urban and eco-neighborhoods. Notably, although 40 buildings are available in the rural district, only 30 people reside there, indicating a significant number of unoccupied buildings. The different environmental costs are calculated as detailed in the Table 2.

3.2. Design Modelling and Assumptions

The modeling of the different neighborhoods used in this study is illustrated in Figure 4. To ensure an equitable comparison of environmental impacts (i.e., energy demand and greenhouse gas emissions), we carefully selected the best locations for adapting these three neighborhoods in each country, using an appropriate functional unit.
The selection of capital cities was deliberate; past studies have demonstrated that, in the majority of countries, the capital is the most densely populated city and plays a major role in energy consumption and carbon emissions.
For each country, we analyzed the key factors influencing energy consumption and carbon emissions, including the composition of energy sources, regional climate, common construction materials, the nation’s stage of development, the average living space per inhabitant, and cultural habits affecting occupant behavior in their homes. The modeling of these different districts is presented in Figure 4.
To ensure consistency in the analysis, several assumptions were made regarding the socio-political context, energy mix, climate data, building materials, and occupant behavior across all studied countries.
(a)
War and Peace Assumption: We acknowledge that a country’s carbon emissions can vary significantly between wartime and peacetime. To maintain consistency, we assumed that all studied countries were in a state of peace, with no ongoing wars or conflicts affecting energy consumption or emissions.
(b)
Energy Mix Consideration: The energy mix varies between countries, influencing overall carbon emissions and energy demand. To account for this variability, we used data from the International Energy Agency (IEA).
(c)
Climate Data Collection: To evaluate the climatic conditions of each country, we used the latest version of the Meteonorm software suite. This tool provides reliable climate data by accessing an American satellite database, using the geographical coordinates of each city. The Meteonorm database covers 6200+ cities and 8325+ weather stations worldwide. This software has been validated by researchers globally and has contributed to several scientific publications.
(d)
Transportation and Mobility Assumptions: The daily transportation patterns of occupants were simulated based on each country’s geolocation. The software applied standardized data, assuming 80% of daily mobility concentration for all countries; a home-to-shop distance of 1000 m; a home-to-public transport network distance of 500 m; a home-to-work distance between 5000 m and 20,000 m; a 5-day workweek, with travel occurring 47 weeks per year; and the main modes of public transport being trams, buses, and metro systems. Occupants were assumed to be in good health, with standardized activity patterns across different neighborhood categories.
(e)
Water and Waste Assumptions: For water consumption, we assumed a water system efficiency of 80%. Regarding waste generation, we estimated that each person produces 0.8 to 1.2 kg of waste per day.
(f)
Embodied Energy Calculation

3.3. Database

For this study, the environmental data used to assess the two selected environmental impacts were sourced from the Swiss-based Ecoinvent database, a globally recognized leader in environmental impact data. Ecoinvent is known for its methodological transparency and comprehensive life cycle inventory (LCI) data (Ecoinvent LCI Database, 2021). Each material dataset in Ecoinvent provides a detailed life cycle inventory.
This research focuses on evaluating two key environmental impacts across the three studied neighborhood types: life cycle energy demand and life cycle greenhouse gas (GHG) emissions.
However, the methodology developed in this study could be extended to analyze additional environmental indicators in future research.

3.4. Simulation Software

3.4.1. Process

All the communities analyzed were simulated for several weeks. The timeframe of the modeling process for the applied neighborhoods in various European Union research projects was three weeks.

3.4.2. Components

In this study, we employed the Pleiades LCA software suite as our primary simulation tool. The interface of version 4.19 of the Pleiades program comprised six components, namely: Database, Designer, Architectural Modeling, Publisher, Outcomes, and Life Cycle Assessment. Each component served a distinct purpose. This simulation software is widely acknowledged for its capability to evaluate the environmental effects over the entire life cycle at the district scale; it has also been the core analytical tool in numerous other scientific investigations [29]. The Designer module functioned as the graphical input system. Specifically, its purpose was to outline the complete structure of a building, depict various solar obstructions, and determine as well as specify all the elements of walls, glazing, rooftops, etc. The Editor component enabled us to perform multiple thermal and dynamic evaluations of the structure [30]. The function of the LCA program was to examine diverse ecological consequences at both the architectural and district levels based on the findings generated by the Designer.
Meteonorm was characterized as a climatic database containing meteorological records for solar energy applications at any location worldwide [31,32]. Over the past decade, Meteonorm tool has been extensively utilized in various studies related to evaluating outdoor environmental conditions [33]. The latest edition, “Meteonorm 8.2”, was implemented in this research. It incorporates updated weather and atmospheric turbidity data along with enhanced functionalities. Concerning the reliability of datasets, certain parameters such as temperature and solar radiation underwent multiple verification procedures. Consequently, the root mean square error (RMSE) for interpolating monthly radiation and temperature measurements was determined to be 7% and 1.2 °C, respectively [15].

3.5. Scenarios

To align with the target of achieving carbon neutrality and net-zero energy by 2050, we developed and analyzed multiple scenarios.
(1)
Initial Scenario
In this scenario, we assumed the following occupancy patterns: Daytime (7:00 a.m.–6:00 p.m.): building occupancy concentration at 25%. Nighttime (7:00 p.m.–6:00 a.m.): occupancy concentration at 100%. Occupancy Density: Maghin Islet (Urban): 4 occupants per 100 m2. Neupre District (Rural): 2 occupants per 100 m2.
Occupant Activity: All inhabitants were considered sedentary (1 MET). To facilitate dynamic thermal simulation, we defined three thermal zones instead of detailing individual rooms for each apartment: day zone, night zone, and hallways.
Thermal Comfort and Heating Set Points: Statistical analysis of meteorological data guided the heating set point temperatures for different zones:
  • Day Zone:
    22:00–07:00: 16 °C
    07:00–22:00: 19 °C
  • Night Zone:
    22:00–07:00: 18 °C
    07:00–22:00: 16 °C
The day zone was assumed To be in use during the daytime and vacant at night, while the night zone followed the opposite pattern. A temperature of 18 °C was considered sufficient for sleep.
Internal Heat Gains from Electrical Equipment: The heat dissipation inside the buildings was primarily attributed to electrical equipment usage, which varied throughout the day. Peak demand periods: 07:00–10:00 in the morning; 18:00–21:00 in the evening; heat dissipation: 5.7 W/m2.
Lighting, Ventilation, and Heating Parameters: For lighting levels, we adhered to standard guidelines: Nighttime (10:00 p.m.–5:00 a.m.): maintained below 100 lux to support sleep. Daytime (6:00 a.m.–10:00 p.m.): set above 250 lux to accommodate peak work hours.
The daytime area was in use during the day and unoccupied at night, while the nighttime area was occupied at night and unoccupied during the day. An indoor temperature of 18 °C was deemed suitable for sleeping.
Internal heat gains primarily resulted from electrical equipment, with higher values during periods of increased occupant activity and equipment use.
Occupancy density was set at 0.033 inhabitants/m2, equating to one occupant per 30 m2.
(2)
Ventilation and Air-Tightness Parameters
Each thermal zone was assigned specific ventilation parameters: Air-tightness: Infiltration rate: 0.25 vol/h through walls. Although new building standards limit air infiltration to 0.6 vol/h, we applied stricter air-tightness criteria typical of passive buildings, ensuring it was a focal point during study and implementation.
Ventilation system: Standard flow rate: 0.3 volume/h, dual-flow mechanical ventilation system with regulation, integrated with a heat exchanger offering 85% efficiency, active from mid-June to early September.
Heating and Hot Water Systems: Domestic hot water (DHW) and space heating were supplied By a typical condensing gas heater with 92% performance (using lower heating value). Heat distribution systems: Ground floor: Radiant heated floors; First floor: Radiators.
Where applicable, default settings from the simulation software were utilized.
(3)
Scenario Analysis
(1) Initial Scenario: The baseline scenario maintained the original lighting, ventilation, and heating settings, as well as occupancy rates described above.
(2) Second Scenario—Introduction of Photovoltaic (PV) Panels: The three neighborhoods retained their initial configurations. Installed mono-crystalline PV panels covering one-third of each building’s roof. Panel orientation was adjusted based on each country’s geographical location: In the Northern Hemisphere, panels were oriented southward at an optimal angle of 35–37°.
(3) Third Scenario—Comprehensive Renovation and Green Transportation.
Conducted extensive renovations in urban and rural neighborhoods, constructing a sustainable district with eco-friendly materials.
  • Renovation measures included insulating attics, walls, and floors; installing high-efficiency heating systems in countries with temperate climates.
  • Solar PV panels were installed on all building roofs.
  • All public and private transportation was assumed to be fully sustainable.
  • A new simulation was carried out, producing new insight.

3.6. Building/Neighborhood Data

Throughout the simulations, the modeling tool provided some standard information. It was possible to access all the data associated with the building’s structure and the components involved in thermal assessments and/or energy usage. These data were then complemented with more detailed LCA information, including data on waste, transportation, energy, and water.
The energy information was analyzed using the Belgian energy composition in the software, which includes 52.0% nuclear, 27.0% natural gas, 17.0% renewable sources, and 4.0% coal (International Panel on Climate Change, IPCC 2021). The energy production system employed was a natural gas condensing boiler with 92.0% efficiency based on lower heating value (PCI). The heat energy source was the natural gas boiler, and the energy used for domestic hot water was also provided by the natural gas boiler. Regarding waste management, the selective sorting approach was taken into account (Less of waste.wallonie.be). This sorting is regarded as 90.0% effective for glass waste and 75.0% for paper and cardboard, with these quantities being considered recycled instead of sent to landfills. According to Belgian data, 40% of the 1500 g of daily household waste per person is incinerated with an 85% efficiency rate. The distances to the disposal sites are 10 km to the landfill, 100 km to the incineration facility, and 50 km to the recycling center. The expected service life of window frames is considered to be 30 years, coatings last for 15 years, and the overall service life of the equipment is projected at 20 years.

3.7. Cost

Both environmental effects were transformed into financial costs, enabling their comparison. The cost estimation is based on the Global method monetize approach, updated in 2017 [28], and derived from earlier models by De Nocker et al. [30]. This methodology [28] assigns monetary values to each environmental indicator for three regions: western Europe, Belgium, and the rest of the world. It is important to note that the margin of error for these values is minimal. Table 3 below shows a comparison between GHG found in this study and those in another research. Overall, the environmental cost is predominantly concentrated in the operational phase (71.1%). The maintenance cost is estimated to account for approximately 3.7% of the total environmental cost. These findings confirm the results found by Trigaux et al. [31].
In this study, a life cycle assessment (LCA) is conducted following a cradle-to-grave approach, considering all key phases associated with the environmental performance of carbon-neutral neighborhoods. The system boundaries include the production phase (raw material extraction, manufacturing, and transportation of building materials), the construction phase (on-site energy use and equipment), the operational phase (energy consumption for heating, cooling, ventilation, lighting, and water use over a 50-year lifespan), maintenance and replacement of components (such as windows and HVAC systems), and the end-of-life phase (demolition, transportation, and waste treatment). The operational data were simulated using Pleiades software v6.25.3 and meteorological data from Meteonorm. Elements excluded from the boundaries include occupant behavioral variations, land use change impacts, and external infrastructure. The functional unit used for analysis is one square meter of conditioned floor area over a 50-year lifetime, enabling consistent comparisons across scenarios and locations.
Justification of Assumptions: In this study, several key assumptions were made to ensure the feasibility and coherence of the life cycle assessment (LCA). First, the energy mix was assumed to transition progressively towards renewable sources by 2050, in alignment with EU-wide goals outlined in the European Green Deal and the Fit for 55 package. This assumption was based on current policy trajectories and expected shifts in energy infrastructure investments. Additionally, the average building orientation was assumed to be a standard north–south alignment, given the general tendency of urban development in the study areas. This simplification was made to avoid complex site-specific geometries, while still capturing the typical climatic conditions for residential buildings in Europe. Furthermore, usage patterns were standardized based on available national data on residential heating and cooling behaviors, assuming an average occupancy rate of 2.5 persons per dwelling, which is in line with EU averages [20]. Finally, socio-demographic variations, which might influence energy consumption patterns, were generalized across the sample, given that detailed local data were unavailable. While these assumptions help streamline the modeling process, they are aligned with the existing literature and are deemed reasonable given the scope of this study.

4. Results

This section presents the most important results obtained in this study, as shown in the different subsections below.

4.1. Validation of Results

Here, we verify the scale of our findings. To do so, we compare these findings with those available in the academic literature. Lotteau et al. [27] conducted a comprehensive review of the current state of knowledge regarding LCA at the neighborhood level, as illustrated in Table 3.
They observed a fluctuation in carbon levels ranging from 11 to 123 kgeqCO2/m2 of floor area per year, and primary energy use varying from 20.5 to 461.2 kWh/m2 of floor area per year. In contrast, this study yielded a range of carbon levels from 7.50 to 35.10 kgeqCO2/m2 of floor area per year. We find that our values (refer to Table 4) align closely with the intervals suggested by Lotteau et al. [27]. Therefore, our results are within a reasonable order of magnitude. However, it is important to note that this comparison does not confirm the absolute accuracy of our findings.

4.2. Simulation of Initial Neighborhoods

4.2.1. Environmental Impact Analysis

Once, the LCA of each single building in every neighborhood has been completed, the results must be aggregated and all the impacts emanating from the neighborhood added. Here, we go to a higher scale. In the same way, as we did for the buildings, we fill in some key data about the site.
To start, we are required to specify the energy mix used for electricity consumed by public lighting. Naturally, we apply the same energy mix as the one used for the buildings. The transportation distances from the factory to the site, and from the site to the waste management centers, are also consistent with those previously indicated for the buildings [34].
For the base case, we assume the absence of rainwater harvesting systems to evaluate their impact later. Thus, no rainwater is initially directed through a separate drainage system. Our analysis includes underground systems for potable water and wastewater. We account for the environmental effects of their construction and losses. After a brief survey, we estimate that there are 1200 m of pipes for drinking water and the same amount for wastewater. Drinking water pipes are made from 50% polyethylene and 50% ductile iron, with estimated losses of 15%. Polyethylene pipes have a lifespan of 75 years, with maintenance needed every 40 years. Cast iron pipes have a service life of 100 years, requiring maintenance every 50 years. For the wastewater system, the losses are estimated at 3%, with a lifespan of 75 years and maintenance after 40 years.
By making the LCA of every single district located in the different EU, the results grouped in Figure 5, Figure 6 and Figure 7 were obtained. In fact, the data collected in the experiments on Belgian neighborhoods as detailed in the previous paragraphs allowed for us to carry out LCA of the initial neighborhood, and then the standard parameters were used in the case of each country as found in the literature. For example, in the Ecoinvent database, most of the EU materials of construction are given. The climate of each of the regions of the EU countries was downloaded using the Meteonorm software suite as described above; the energy mix of each of the EU countries and the electricity mix of each of the cities studied can be found on the site of the IEA, the transport mode of each country is standard, etc.
It was found that the carbon emission varied from 217,770.0 to 934,670.0 kgCO2·year, with an average of 384,106.190 kgCO2·year in the sustainable neighborhood; between 389,220.0 kgCO2·year and 773,390.0 kgCO2·year, with an average of 591,015.4 kgCO2·year, in the urban district; and from 261,410.0 to 598,700.0 kgCO2·year, with an average of 402,205.7 kgCO2·year in the rural neighborhood (see Figure 5, Figure 6 and Figure 7). These results showed that carbon emission is the highest in an urban neighborhood, and the lowest in a sustainable neighborhood. In fact, the concentration of carbon dioxide produced in the sustainable neighborhoods per year is 35% lower than this generated in the urban neighborhoods. In addition, this one is 31.9% lower in the rural neighborhoods than in the urban neighborhoods [35].
It is very interesting to notice that Poland produced 4.4 times more carbon dioxide than France, 3.4 times more carbon dioxide than Belgium, and 2.7 times more than Germany. Table 4. Shows the quantity of carbon and energy per living and floor area in the three districts.

4.2.2. Environmental Cost Analysis

As explained in the previous paragraph, the unit of the environmental cost for each European Union region was given in Reference [36] (Global method monetize).
For calculating environmental cost in 2050, we evaluated the environmental impacts in 2050 according to the IPCC scenario; then, we converted the different environmental quantity by cost by using the formula mentioned in the Table 2 (example 1 kgCO2eq = EUR 0.05).
The carbon emission cost varied between EUR 10,888.5 and 26,733.5 in sustainable neighborhoods; from EUR 16,461.0 to 38,669.5 in urban neighborhoods; and between EUR 13,070.5 and 29,935 in a rural neighborhood. Globally, as shown in Figure 8 and Figure 9, the carbon dioxide cost is 35% higher in urban than sustainable neighborhoods, and 32% higher in urban than rural neighborhoods. Regarding these results, we concluded that the carbon emission cost was the highest in an urban neighborhood, and the lowest in the sustainable neighborhood.

4.3. Prediction in 2050

4.3.1. Environmental Impact Analysis

Figure 10 shows the prediction in 2050 of carbon emissions of the two studied neighborhoods. The carbon output levels of the districts are projected to range between 43,780.0 and 502,670.0 kgCO2 in sustainable areas, and between 346,380.0 and 713,070.0 kgCO2 in urban areas. These findings suggest that the carbon emission density will increase by 25% to 40% by 2050 in both neighborhood types, compared to the current reported average values. By 2050, the carbon emission density from urban neighborhoods is expected to be 77.0% higher than that of sustainable neighborhoods.
It was determined that the carbon emissions of the neighborhoods situated in Poland, Lithuania, Latvia, and Luxembourg were the highest in Europe. The quantity was roughly 45% greater than the average CO2 emissions in the neighborhoods of other EU nations.

4.3.2. Environmental Cost Analysis

Figure 11 shows the carbon emission cost in 2050; it is interesting to notice that this cost varied between EUR 2189.0 and 25,133.5 in the sustainable district, and from EUR 17,319.0 to 35,653.5 in an urban district. The average cost of carbon in the different countries is 13,419.9 and 27,538.7 in sustainable and urban neighborhoods, respectively. This means that if no measures were taken to limit the evolution of the climate, in 2050, the carbon cost would be expected to be 105.2% higher in the urban than in the sustainable districts. The carbon cost would increase to 30.2% in sustainable district and 6.8% in the urban district in the next decade (2050), compared to the concentration obtained currently.

4.4. Mitigation Strategies: Impacts of Photovoltaic Panel

4.4.1. Environmental Impact Analysis

In the order to reduce the quantity of CO2 emissions and energy demand coming from fossil fuel, we decided to apply PV panels in an urban and rural neighborhoods, as detailed in Section 3.5.
In Figure 12, we see the variation in CO2 concentration before and after installing PV panels in the different countries. Globally after installing PV panels, the CO2 emission decreases on average to 29.3% in both districts, or only 14.8% in the urban district and up to 43.9% in the rural.

4.4.2. Environmental Cost Analysis

It was noticed that the cost of carbon emission and energy demand varied after applying PV panels in the rural and urban districts, as shown in Figure 13. Globally, this cost decreases on average to 15.9% in an urban neighborhood, or to 14.2% in Austria, 13.5% in Belgium, 13.9% in Croatia, 6.7% in Finland, 91.0% in Germany, 25.3% in Greece, 4.3% in Ireland, 13.2% in France, and 12.9% in Italy. In addition, the carbon cost decreases to 44.6% in the rural district, or, for example, 53.4% in Belgium, 61.2% in Bulgaria, 58.8% in Croatia, 96.8% in Finland, 48.05% in France, 56.6% in Ireland, 67.3% in Sweden, and 14.3% in Poland.

4.5. Mitigation Strategies: Mixed Scenario

In this subsection, we implemented a mixed mitigation scenario that combines three main actions: (i) extensive renovation of all buildings (100%), (ii) full electrification of vehicles, and (iii) integration of photovoltaic (PV) systems for renewable energy supply. As illustrated in Figure 14, the application of this integrated scenario would allow for a 90.1% reduction in total carbon emissions across all neighborhoods by 2050 compared to the reference year (2020). When disaggregated by neighborhood type, the average reduction in CO2 emissions is 96.7% in urban areas and 83.3% in rural areas. This highlights a clear disparity in decarbonization potential, largely attributed to differences in building density, public transport availability, and energy infrastructure. The mitigation impact is more significant in urban settings, where compact urban form, higher building efficiency, and greater PV yield per square meter contribute to deeper emission cuts. To better visualize these differences, a comparative summary of CO2 reductions and environmental impact between scenarios and neighborhood types has been included in the updated Results Section (see Figure 14). From a policy and planning perspective, this scenario demonstrates that a holistic decarbonization strategy—combining energy efficiency, transport electrification, and renewable energy generation—is crucial to achieving net-zero targets at the local level. The findings support the need for tailored policy incentives and infrastructure investments that account for the specific characteristics of both urban and rural neighborhoods. This integrated approach could significantly contribute to achieving the goals of the EU Green Deal and complying with the Paris Agreement by helping stabilize global temperature increases around 1.5 °C. Our results suggest that implementing such strategies at the neighborhood scale could serve as a replicable model for low-carbon urban development throughout the European Union.
In addition, more than 90% of the environmental cost is expected to be reduced in 2050 by applying this scenario in urban and rural neighborhoods.

5. Discussion

The first part of this section is constituted of an analysis and comparison of results; the second section shows some adaptions, then policies, and finally limitations.

5.1. Analysis and Comparison

5.1.1. Confrontation Between Environmental Impacts from Initial Districts

Let us take a look at the “greenhouse effect” impact on the sustainable neighborhoods. Overall, we note the dominant presence of the occupancy phase, which accounts for approximately 93% of greenhouse gas (GHG) emissions. Within this phase, transportation is the leading contributor, responsible for 46% of emissions. Following this, heating and domestic hot water (DHW) together contribute to 24% of emissions, while waste management during the use phase represents 15% of emissions. Emissions due to household waste management are comparable to those due to DHW production (15% of use phase emissions) [36,37]:
  • Emissions due to heating represent only two-thirds of emissions due to the production of DHW.
  • Emissions resulting from the movement of inhabitants make up nearly half of the emissions during the use phase. These features are primarily due to the fact that the excellent thermal efficiency of our structures significantly lowers their heating needs. Now, when we examine the “primary energy requirement” impact, the use phase remains dominant (96% of the overall energy demand), mainly because it includes mobility and waste disposal.
We can thus observe the substantial contribution of the mobility aspect and the domestic waste management aspect in life cycle assessment (LCA) at the neighborhood scale.
On the other hand, the results showed an average concentration of carbon estimated to 58.6 kgCO2/m2·year in the sustainable district; 133.8 kgCO2/m2·year in the rural district; and 219.5 kgCO2/m2·year in the urban neighborhood. This mean dioxide carbon distribution is 73.3% higher in urban than a sustainable neighborhood, and 39.0% higher in the urban than rural neighborhoods. We deduce that the concentration of carbon dioxide is the highest in the urban and lowest in sustainable neighborhoods. This may be because of the strong population concentration in urban region and the dense flux of transportation. Because of the increasing urban population and also the amount of time people spend in buildings, nowadays, buildings are responsible for majority of CO2 emissions that impact climate change. At the neighborhood scale, one strategy for adapting to new climate change is to develop resilient designs able to resist to the natural disasters and simultaneously minimizing the effect on the natural environment. Additionally, mitigation could be reach by integrating decentralized energy systems for districts; however, this option required a significant initial cost.

5.1.2. Confrontation Between Environmental Impacts from Future Districts

The construction industry is acknowledged as one of the most resource-demanding sectors, particularly in terms of natural resources, especially fossil fuels. It generates significant environmental consequences simultaneously. In many European Union nations, the building sector is accountable for 35% of greenhouse gas emissions [38] and 50% of total material extractions [39]. Building materials, such as heating and cooling systems, insulation type, building shape, orientation, and density have a significant impact on greenhouse gas emissions [37]. With reasonably built densities and occupancy rates, the sustainable districts represented an interesting alternative to more rapidly reach the net-zero energy and neutral carbon target because of the adaption of this type of neighborhood to the new climate.
If no action is taken to limit the increase in air temperature, in 2050, dioxide carbon is expected to increase between 25 and 40% in sustainable and urban neighborhoods. The carbon emission concentration is expected to be 77.0% higher in urban neighborhoods than in sustainable neighborhoods, and around 35% lower in sustainable than more conventional neighborhoods met in the European Union. This is a big problem because this situation will affect human health. The concentration of carbon dioxide is the highest in urban and lowest in sustainable neighborhoods for many reasons: the urban districts are denser in population, it is difficult to control urban mobility, building materials are not adapted to the new climate, the waste treatment process is not fully controlled, and electricity production source is a fossil in the majority. This is not the case in sustainable districts. This work presents the influence of the energy mix on the quantity of carbon dioxide produced at the neighborhood level; this is very significant because it can help us know the climate variation in the future. This conclusion confirms the advice of Nick et al. [40], who suggested that in each country, the energy mix has a huge impact on CO2 generated.
Our study reveals that the carbon emission levels are notably high in Poland, Bulgaria, and Romania. These findings were not unexpected, as it is well known that over 70% of the energy consumed in these countries is derived from fossil fuels, such as oil, coal, and others. Conversely, in countries like Denmark, Sweden, and Finland, the emission rates are lower, likely due to the extensive use of renewable energy sources. Additionally, in Germany, France, Italy, and Belgium, the levels of greenhouse gas emissions are relatively moderate, which could be attributed to the fact that heating and electricity are predominantly produced using gas, nuclear, and renewable energy sources. Table 5 illustrates the projected rise in carbon and energy costs by 2050. Neighborhoods can implement various cost-effective strategies to help mitigate carbon emissions, such as shading building facades, utilizing energy-efficient lighting, walking or cycling to work, carpooling, and promoting the use of public transportation.

5.1.3. Confrontation of Environmental Impacts After Applying PV Panels

As explained in the last section, after applying PV panels on the building roofs in urban and rural neighborhoods, the CO2 emission decreased to 29.3% in both districts. This result is very important: this means that we could reduce more than a quarter of CO2 emissions in some cities located in EU countries just by using PV panels. The implications are direct on environmental cost; so, we noticed that dioxide carbon cost decreases up to 15.9% and 44.6% in urban and rural neighborhoods, respectively. This conclusion confirms the results of research carried out by Ciobanu et al. [41], who found that fossil energy has a huge, positive impact on environmental damage, whereas renewable energy such as PV showed a negative impact on environmental damage and could be one of the solution to mitigate environmental hazards.
In EU countries, the part of renewable energy in energy consumption increased from 9.6% by 2004 to 22.1% by 2020, thus exceeding the EU target, which was to reach up to 20% of the renewable in the energy mix in most of the EU countries in 2020 [42]. This result is appreciated, although a lot needs to be done to significantly reduce the rate of carbon emitted. The increase in renewable in energy mix in 2020 was partly prompted by the decrease in the consumption of fossil fuels because of the COVID-19 pandemic. So, the new EU target for 2030 is set to reach up to 32% of renewable energy. To properly understand the different variations in the dioxide carbon rate produced in each country, the share of renewable energy (solar energy + wind energy + hydraulic, etc.) in the energy mix must first by analyzed for each EU country. We noticed that in 2020, renewable energy represented up to 60.1% of the energy mix in Sweden, 43.8% in Finland, and 42.1% in Latvia. In contrast, it was only 10.7% in Malta, 11.07% in Luxembourg, and 13.0% in Belgium [42]. The big difference comes from the endowment of natural resources such as the sun, wind, sea, etc. It was very interesting to notice that from 2004 to 2020, seventeen countries in the EU have at least doubled their share of renewable energy in the energy mix. In Poland, renewable energy only contributes to 10% of the energy mix, which is why the percentage of CO2 emissions remains high compared to other EU countries. The results of the greenhouse gas life cycle assessment varied from one region to another and enormously depended on the scope of study and assumptions fixed; for example, in 2019, Trigaux et al. [31] assessed the greenhouse gas emissions from households in various European cities and implemented mitigation strategies. A typical household’s carbon footprint was estimated to be around 6930 kgCO2-eq/year, which is comparable to the annual carbon sequestration of 0.51 hectares of forest [43,44,45,46,47,48]. In another study by Reusswig et al. [49] in 2021, the carbon footprints of households in a German city were analyzed. The study compared voluntary carbon emission reductions in 2018 with the involuntary reductions during the coronavirus disease 2019 (COVID-19) pandemic. The researchers installed carbon trackers in households to monitor their carbon footprints related to mobility, food consumption, and electricity use. The findings revealed that households reduced their CO2 emissions by an average of 11%, with some individuals achieving reductions of up to 40%. The presence of the COVID-19 pandemic resulted in a reduction of up to 10% in carbon emissions in Germany; however, scientists anticipated that emissions would rise again as economies rebounded post-pandemic. Most of the initiatives adopted to reach carbon neutrality at the neighborhood level will have a necessarily large economic impact. Indeed, the economic impact of carbon neutrality is in most cases due to a shift related to economic development models, as well as energy consumption and production. It was noticed that carbon neutrality will impact the economic growth toward sustainable, green, and low-carbon development, and it could also impact emerging technology trends, such as energy efficiency technology, energy storage technology, and recycling technology.

5.1.4. Summarize of Scenario

Applying a mixed strategy, as explained in the last section, on average, 90.1% of total carbon emissions are expected to be reduced in 2050. This result is very interesting because it shows us the way to reach our target objective in 2050. This scenario has a bigger effect in urban than rural districts. This could be due to the presence of a strong population rate in an urban city, with the added implication of huge traffic jams. A substantial reduction in CO2 emissions could be achieved by choosing building materials better suited to the changing climate. Our findings indicate that the shading effect is significantly more pronounced in urban areas compared to rural ones. However, the variation in solar energy generation between different types of neighborhoods does not appear to alter the energy priorities and strategies at the neighborhood level. Focusing on greener mobility solutions and incorporating local renewable energy sources are among the most effective strategies and will remain crucial for achieving carbon neutrality by 2050 [45,46,47,48,49]. Table 6 shows the reduction percentage for each scenario in detail.
As seen in [50], light and heavy renovations, coupled with the current renovation rate, can lead to a reduction of up to 20% in carbon emissions. A study carried out by Osman et al. [24] provides insight into the impacts of climate change on renewable energy sources (solar, wind, geothermal, hydropower, and biomass), and their future prospects under climate change scenarios. The findings of this study offer meaningful insights for urban planning and policy-making, particularly in the context of achieving climate neutrality targets set by the European Union and the Paris Agreement. The significant reductions in CO2 emissions observed—especially under the mixed scenario—underscore the critical role of integrated strategies that combine building renovation, transport electrification, and renewable energy deployment. From a policy standpoint, this suggests that comprehensive renovation programs (targeting 100% of existing buildings) should be prioritized, especially in urban neighborhoods where the potential for emissions reduction is highest. At the same time, rural areas require context-specific policies to overcome structural limitations such as lower building density and limited infrastructure for renewable energy systems. The transition to renewable energy, notably through the integration of PV systems, is shown to be a highly effective lever for decarbonization. Therefore, decision-makers should consider strengthening subsidies, tax incentives, and regulatory frameworks that promote on-site solar generation, particularly in combination with electrified mobility systems. This study also highlights the importance of planning at the neighborhood scale, which allows for localized strategies tailored to specific socio-technical contexts. Such spatially targeted approaches enable more accurate forecasting, efficient resource allocation, and stronger public engagement.
By adopting the net-zero carbon emission decarbonization roadmap, the outlook for renewable energy becomes highly encouraging, with the potential to substitute fossil fuel-based energy and help restrict the global temperature increase to 1.5 °C by 2050 [38,50]. The principle of carbon neutrality can deliver substantial benefits related to the survival of mankind. A zero carbon goal is possible with the adoption of the Carbon-Neutral Protocol framework. Our results should thus help politicians to increase their decision without harming the environment. According to Fawzy et al. [51], residential and commercial buildings could achieve zero emissions in the future by using sustainable building envelopes, renewable materials, and 3D printing. Moreover, this objective can be attained by upgrading heating and cooling systems powered by renewable energy sources and promoting the adoption of high-efficiency technologies. The implementation of sensors to oversee and control smart building components—such as lighting—as well as advancements in both electric and thermal energy storage systems present promising strategies. In addition, electromechanical devices in residential buildings should carry eco-certification labels, and baseline performance standards must be enforced for heating, ventilation, and air conditioning (HVAC) systems. Incorporating wood into structural design is also vital, as one cubic meter of wood can retain approximately 0.5 tons of carbon; therefore, timber buildings and urban developments can function as carbon sinks. Furthermore, enhancing construction materials through the integration or coating of nanoparticles can improve their physical properties, contributing to increased sustainability. Ultimately, significant efforts should be directed toward both new developments and the retrofitting of existing buildings to meet carbon neutrality targets. Strategic and well-informed planning is critical to prevent poorly designed and overly ambitious initiatives, which may result in unachievable outcomes, as evidenced by the failure of several smart city projects worldwide. The strategy outlined in this study supports the broader climate objectives of the European Union by targeting carbon neutrality at the neighborhood level—a scale that enables tangible action and citizen engagement. Specifically, it echoes the vision of the European Green Deal, which promotes the transition to climate neutrality by 2050 through energy-efficient infrastructure and sustainable communities. Our multi-scenario approach also complements the goals of the Fit for 55 package, which sets a 55% emission reduction target by 2030. This package emphasizes decentralized renewable energy, improved building performance, and inclusive climate action—all elements incorporated into our modelling framework. Furthermore, the method is adaptable to the priorities of various National Energy and Climate Plans (NECPs). These plans define how each member state contributes to EU-wide climate objectives, and our proposed strategy offers a flexible, replicable tool for supporting local-level implementation of those plans across different geographic and socio-economic contexts. Parameters related to local urban morphology—such as building density, height-to-width ratios of streets, orientation, and surface coverage—significantly influence energy demand, solar potential, and microclimate conditions in neighborhoods. Similarly, climatic zones affect heating and cooling needs, renewable energy production potential, and material performance over time. These factors must be integrated into carbon neutrality assessments, as they shape the environmental impact and feasibility of mitigation strategies. In this study, while the baseline models are based on Belgian neighborhoods, we acknowledge that urban form and climate conditions vary across EU regions and should be adapted accordingly in future work.
In this study, the results obtained for urban and rural neighborhoods in terms of CO2 emission reduction align with trends observed in zero-emission neighborhood projects in other European cities. For instance, the Schoonschip project in Amsterdam demonstrated a significant reduction in CO2 emissions, with a focus on integrating net-zero energy floating homes, resulting in a 50% reduction in emissions compared to traditional buildings [44]. Similarly, the Hammarby Sjöstad project in Stockholm achieved a 30–40% reduction in carbon emissions compared to a standard urban area through a combination of renewable energy and heating systems, along with the use of sustainable materials [37]. In comparison, our study shows that integrating major building renovations and adopting 100% electric vehicles could reduce CO2 emissions by 90.1% by 2050 in urban areas, a similar but potentially more ambitious impact. These results confirm that initiatives such as improving building energy efficiency, transitioning to electric vehicles, and adopting renewable energy solutions can be effective strategies for achieving carbon neutrality goals in urban neighborhoods across Europe. However, it is important to note that projects in Germany, such as Kronsberg, have focused on integrating green infrastructure and reducing energy consumption from transportation, showing that a combined approach is necessary to maximize decarbonization outcomes at the urban scale [52]. Therefore, while our results are promising, the adaptation of specific strategies depending on the local context remains crucial [53].

5.2. Adaptation and Mitigation Strategies

Mitigation and adaptation strategies are very important to reduce carbon concentration.
Utilizing solar energy in buildings as a substitute for fossil fuels results in significantly lower carbon emissions, in fact, according to Barbara et al. [54], solar energy contributes to a more robust and dependable power infrastructure compared to traditional above-ground electrical grids, which are often susceptible to flooding and severe weather events intensified by climate change. As declared by Grafakos et al. [55] in 2019, construction with green walls and rooftops is necessary to reduce carbon emissions; indeed, green walls and rooftops can mitigate global warming both by sequestering carbon and by reducing heat islands. It is interesting to notice the increasing adoption of green roof facilities for floods and storm water management.
In the cities, promoting public transportation, electrifying transportation, and raising vehicle efficiency are some approaches to mitigate CO2 emissions in the transportation sector. In urban planning, a compact city model—characterized by optimal population density, diverse land use, and improved accessibility—supports both climate change mitigation and adaptation [56]. Such urban forms help lower per capita energy consumption for heating and cooling, reduce transportation needs, and enable the implementation of more efficient energy systems. Carbon capture and storage is recognized as an affordable technology, shown in the literature as one of the best strategies to reduce emissions in the old cities. One approach is to separate and capture CO2 gases generated by processes that use fossil fuels. This amount of captured CO2 is conveyed and sequestered for long-term periods in underground geological formations. Zhao et al. [23] suggested that carbon neutrality can be accomplished through both reductions in carbon emissions and the application of negative emission technologies. These methods are enhanced by strategies like terrestrial weathering, afforestation, reforestation, and ocean alkalinity enhancement, among others.

5.3. Policies

CO2 is lowered when low-carbon policies are implemented. Finnveden et al. [57] examined various methods to assess China’s CO2 trading schemes between 2008 and 2018. Their findings revealed a significant reduction in CO2 emissions across several regions after the carbon trading policy was enforced. In 2022, the same researchers showed that the ongoing implementation of a carbon trading initiative could lead to carbon neutrality. In conclusion, the impact of policies aimed at reducing greenhouse gas outputs, including mechanisms like emissions trading, climate-related levies, and targeted programs, are essential elements that require careful evaluation by decision-makers.
As areas containing residential buildings, universities also can help to reduce carbon emissions. For example, in 2022, Horne et al. [58] carried out a study by using a carbon calculator at the University of engineering in Karachi, Pakistan. The results revealed that in 2017, the campus was responsible for generating approximately 21,500 metric tons of CO2-equivalent emissions, which corresponds to an average of 1.79 metric tons of CO2-equivalent per student. The most impactful mitigation strategies recommended including the adoption of energy-efficient equipment, the utilization of renewable energy technologies, the transition to electric mobility, and afforestation initiatives. Given that the residential sector plays a pivotal role in attaining carbon neutrality, it is essential to incorporate climate change awareness programs aimed at informing individuals about effective ways to reduce carbon footprints in domestic, educational, and professional environments. As major notice, society can play a key role in carbon emission reduction. The suggested strategies include energy-efficient appliances, walking or cycling to work, efficient lighting use, shading facades, planting of trees, and converting to electric vehicles.

5.4. Sensitivity Analysis

To strengthen the robustness of our findings, we included a sensitivity analysis that explores the influence of key input assumptions on the overall carbon footprint results. Specifically, we examined variations in building orientation (e.g., north-facing vs. south-facing façades), national and regional energy mixes (ranging from fossil-intensive to renewable-rich scenarios), and occupancy behavior or usage patterns (such as heating/cooling setpoints and daily energy use). The analysis reveals that changes in energy mix and user behavior exert the greatest influence on life cycle emissions, while orientation has a moderate but non-negligible impact, especially for passive solar gains and daylight availability. These findings highlight the importance of contextualizing carbon neutrality strategies within local climatic, technical, and social parameters.

5.5. Limitations

As with all studies in the literature, this scientific research has some limitations:
(a)
It is difficult to predict the future with exact accuracy;
(b)
The urban morphology varies from one country to another;
(c)
The energy mix of each country can vary at any period;
(d)
Occupant behavior is difficult to quantify;
(e)
Economic and population growth are different in each of these countries;
(f)
Strategies of waste treatment are not the same in all European countries;
(g)
Moving mode and population daily mobility vary from one country to another;
(h)
It is certain that by combining wind turbines and solar panels, it was easier to achieve carbon neutrality in the neighborhoods. This work will be the subject of the next study.
Carrying out a life cycle assessment city scale may be more interesting although harder to achieve. Some of the parameters considered in this study are standards such as water system, hot and cool water, occupant activity, etc. Despite these limits, it is important to notice that the approach of study applied in this research is interesting because it enables a holistic view of the concentration of carbon emissions at the neighborhood scale in European Union countries. Nevertheless, this research already could be a publication topic serving as a guide for future researchers in this field.

6. Conclusions

Summarizing, this research assessed the carbon dioxide emissions coming from residential districts initially built in Belgium that were adapted to the different countries of the European Union. A strong predominance of greenhouse gas (GHG) emissions was observed during the operational phase, accounting for approximately 93% of the total emissions. Within this phase, daily transportation emerged as the primary contributor, responsible for up to 46% of emissions. This was followed by heating and domestic hot water (DHW), which collectively contributed 24%, while waste management represented around 15% of the operational emissions. During the operational stage, mobility and heating are among the main sources of carbon emissions; green mobility, as well as the implementation of heat pumps, could allow for great reductions in CO2 emissions.
Average carbon was expected to be 58.6 kgCO2/m2·year in the sustainable district; 133.8 kgCO2/m2·year in the rural district; and 219.5 kgCO2/m2·year in the urban neighborhood. These findings reveal that urban neighborhoods exhibit the highest levels of carbon dioxide concentration, whereas sustainable neighborhoods demonstrate the lowest, highlighting the effectiveness of sustainable planning in mitigating emissions. Most of the new districts should be more fitted to the new climate or made durable for limiting the concentration of CO2.
Encouragingly, it remains possible to limit the increase in global air temperature to approximately 1.5 °C over the next decade, particularly through the implementation of integrated mitigation scenarios. All European Union countries should start by reducing the percentage of fossil fuel in the energy mix to less than 40% in 2030 in favor of renewable energies. The results showed that heavy renovation is more beneficial in old buildings. The analysis revealed that in urban districts, building-related components—particularly electricity consumption—were the primary contributors to emissions at the neighborhood scale. As a result, the adoption of sustainable construction materials and enhanced thermal insulation is strongly recommended. Additionally, factors such as building orientation, the presence or absence of permeable surfaces, integration into public transportation networks, reduction in daily commuting distances, and increases in uninhabited green or open spaces can all significantly influence emission levels. The use of low-carbon technologies in residential neighborhoods is seen as key to decarbonization and combating temperature change. Therefore, in the transition to a low-carbon, green, and flexible energy system, the role of sustainable neighborhoods and their acceptance of new, low-carbon smart technologies is also very important. In addition, this research explained several other strategies mentioned in the literature to achieve carbon neutrality in the building, neighborhood, and city sectors. It is essential to lessen the heavy reliance on fossil-based energy and to accelerate the deployment of alternative renewable energy sources while simultaneously advancing low-emission technologies. The principal approaches for achieving an energy shift should focus on boosting energy performance, transitioning energy services to electricity, and expanding the use of various forms of clean energy. New urban developments should be designed to be resistant to natural disasters by limiting disturbances to the ecological environment. Considerable efforts are also needed to retrofit existing communities to align with carbon neutrality goals. Life cycle assessment (LCA) is advised as a standard practice for evaluating all decarbonization strategies and multiple elements of carbon-neutral infrastructure. In a future study, we should assess the different impacts of gardens and wind turbines on CO2 emissions on a district scale.

Author Contributions

M.K.N. conceptualized and designed this study and assisted in manuscript writing and review. M.S.R. contributed to data collection and analysis. S.R. Supervied all the manuscript. All authors have read and agreed to the published version of the manuscript.

Funding

This research received no specific grant from any funding agency in the public, commercial, or not-for-profit sectors.

Institutional Review Board Statement

Not applicable.

Informed Consent Statement

Not applicable.

Data Availability Statement

The datasets generated and analyzed during this study are available upon reasonable request.

Acknowledgments

The author of this research thanks all the people who contributed to this work.

Conflicts of Interest

The authors declare no conflicts of interest.

References

  1. Neutralité Carbone 2050: Des Efforts à Accélérer Pour l’UE. 2021. Available online: https://www.vie-publique.fr/en-bref/278834-neutralite-carbone-2050-des-efforts-accelerer-pour-lue (accessed on 10 January 2023).
  2. United Nation: Achieving Carbon Neutrality by 2050 is the Absolute Urgency, Says António Guterres. 2023. Available online: https://news.un.org/fr/story/2020/12/1084402 (accessed on 10 January 2023).
  3. What is Carbon Neutrality and How Can It Be Achieved by 2050? Available online: https://www.europarl.europa.eu/news/en/headlines/society/20190926STO62270/what-is-carbon-neutrality-and-how-can-it-be-achieved-by-2050 (accessed on 15 January 2023).
  4. Pulselli, R.M.; Broersma, S.; Martin, C.L.; Keeffe, G.; Bastianoni, S.; van den Dobbelsteen, A. Future city visions. The energy transition towards carbon-neutrality: Lessons learned from the case of Roeselare, Belgium. Renew. Sustain. Energy Rev. 2021, 137, 110612. [Google Scholar] [CrossRef]
  5. Laski, J.; Burrows, V. From Thousands to Billions: Coordinated Action towards 100% Net-Zero Carbon Buildings by 2050. 2017. Available online: https://worldgbc.org/article/from-thousands-to-billions-coordinated-action-towards-100-net-zero-carbon-buildings-by-2050/ (accessed on 15 January 2023).
  6. Shirinbakhsh, M.; Harvey, L.D. Net-zero energy buildings: The influence of definition on greenhouse gas emissions. Energy Build. 2021, 247, 111118. [Google Scholar] [CrossRef]
  7. Too, J.; Ejohwomu, O.A.; Hui, F.K.; Duffield, C.; Bukoye, O.T.; Edwards, D.J. Framework for standardising carbon neutrality in building projects. J. Clean. Prod. 2022, 373, 133858. [Google Scholar] [CrossRef]
  8. Nematchoua, M.K.; Sadeghi, M.; Sigrid, R. Strategies and scenarios to reduce energy consumption and CO2 emission in the urban, rural and sustainable neighbourhoods. Sustain. Cities Soc. 2021, 72, 103053. [Google Scholar] [CrossRef]
  9. Mirabella, N.; Röck, M.; Ruschi Mendes Saade, M.; Spirinckx, C.; Bosmans, M.; Allacker, K.; Passer, A. Strategies to improve the energy performance of buildings: A review of their life cycle impact. Buildings 2018, 8, 105. [Google Scholar] [CrossRef]
  10. Jain, S.; Agarwal, A.; Jani, V.; Singhal, S.; Sharma, P.; Jalan, R. Assessment of carbon neutrality and sustainability in educational campuses (CaNSEC): A general framework. Ecol. Indicat. 2017, 76, 131–143. [Google Scholar] [CrossRef]
  11. Ray, G. Net-zero-energy buildings or zero-carbon energy systems? How best to decarbonize Germany’s thermally inefficient 1950s-1970s-era apartments. J. Build. Eng. 2022, 54, 104671. [Google Scholar]
  12. Peuportier, B.; Popovici, E.; Troccmé, M. Analysedu cycle de vie à l’échelle du quartier, bilan et perspectives du projet ADEQUA. Build. Environ. 2013, 3, 17. [Google Scholar]
  13. Goedkoop, M.; Spriensma, R. The Eco-Indicator 99: A Damage Oriented Method for Life Cycle Impact Assessment; PRé Consultants B.V.: Amersfoort, The Netherlands, 2000; p. 142. [Google Scholar]
  14. Kennedy, S.; Sgouridis, S. Rigorousclassification and carbon accounting principles for low and zero carbon cities. Energy Policy 2011, 39, 5259–5268. [Google Scholar] [CrossRef]
  15. Nematchoua, M.K.; Somayeh, A.; Reiter, S. Influence of energy mix on the life cycle of an eco-neighborhood, a case study of 150 countries. Renew. Energy 2020, 162, 81–97. [Google Scholar] [CrossRef]
  16. Chen, L.; Msigwa, G.; Yang, M.; Osman, A.I.; Fawzy, S.; Rooney, D.W.; Yap, P.S. Strategies to achieve a carbon neutral society: A review. Environ. Chem. Lett. 2022, 20, 2277–2310. [Google Scholar] [CrossRef] [PubMed]
  17. Maximillian, J.; Brusseau, M.L.; Glenn, E.P.; Matthias, A.D. Pollution and environmental perturbations in the global system. In Environmental and Pollution Science; Academic Press: Cambridge, MA, USA, 2019; pp. 457–476. [Google Scholar] [CrossRef]
  18. Yang, M.; Chen, L.; Msigwa, G.; Tang, K.H.D.; Yap, P.-S. Implications of COVID-19 on global environmental pollution and carbon emissions with strategies for sustainability in the COVID-19 era. Sci. Total Environ. 2022, 809, 151657. [Google Scholar] [CrossRef] [PubMed]
  19. Modeste, K.N.; Rakotomalala, M.S.; Charline, M.; Jose AOrosa, E.S.; Sigrid, R. Analysis of environmental impacts and costs of a residential building over its entire life cycle to achieve nearly zero energy and low emission objectives. J. Clean. Prod. 2022, 373, 133834. [Google Scholar]
  20. Modeste, K.N.; Orosa, J.A. Life cycle assessment of radioactive materials from a residential neighbourhood. Sustain. Mater. Technol. 2022, 33, e00468. [Google Scholar]
  21. Arshian, S.; Syed Ali, R.; Ilhan, O.; Sahar, A. The dynamic relationship of renewable and nonrenewable energy consumption with carbon emission: A global study with the application of heterogeneous panel estimations. Renew. Energy 2019, 133, 685–691. [Google Scholar]
  22. Li, H.-S.; Geng, Y.-C.; Shinwari, R.; Yangjie, W.; Rjoub, H. Does renewable energy electricity and economic complexity index help to achieve carbon neutrality target of top exporting countries? J. Environ. Manag. 2021, 299, 113386. [Google Scholar] [CrossRef]
  23. Zhao, X.; Ma, X.; Chen, B.; Shang, Y.; Song, M. Challenges toward carbon neutrality in China: Strategies and countermeasures. Resour. Conserv. Recycl. 2022, 176, 105959. [Google Scholar] [CrossRef]
  24. Osman, A.I.; Chen, L.; Yang, M.; Msigwa, G.; Farghali, M.; Fawzy, S.; Yap, P.S. Cost, environmental impact, and resilience of renewable energy under a changing climate: A review. Environ. Chem. Lett. 2023, 21, 741–764. [Google Scholar] [CrossRef]
  25. Nematchoua, M.K.; Asadi, S.; Reiter, S. Estimation, analysis and comparison of carbon emissions and construction cost of the two tallest buildings located in United States and China. Int. J. Environ. Sci. Technol. 2022, 19, 9313–9328. [Google Scholar] [CrossRef]
  26. Allacker, K.; Maia, S.D.; Serenella, S. Land use impact assessment in the construction sector: An analysis of LCIA models and case study application. Int. J. Life Cycle Assess 2014, 19, 1799–1809. [Google Scholar] [CrossRef]
  27. Lotteau, M.; Loubet, P.; Pousse, M.; Dufrasnes, E.; Sonnemann, G. Critical review of life cycle assessment (LCA) for the built environment at the neighborhood scale. Build. Environ. 2015, 93, 165–178. [Google Scholar] [CrossRef]
  28. Leo De Nocker, V.I.T.O. VITO-WimDebacker, Annex: Monetisation of the MMG Method (Update 2017); Elsevier: Amsterdam, The Netherlands, 2018; pp. 1–65. [Google Scholar]
  29. Colombert, M.; De Chastenet, C.; Diab, Y.; Gobin, C.; Herfray, G.; Jarrin, T.; Bruno, P.; Charlotte, T.; Maxime, T. Analyse de cycle de vie à l’échelle du quartier: Un outil d’aide à la décision? Le cas de la ZAC Claude Bernard à Paris (France). Environ. Urbain/Urban Environ. 2011, 5, 1–21. [Google Scholar]
  30. De Nocker, L.; Broekx, S.; Liekens, I. Economische Waardering van Verbetering Ecologische Toestand Oppervlaktewater op Basis van Onderzoeksresultaten uit Aquamoney; Vito Intern Rapport 2011/RMA/R/248; Vito: Mol, Belgium, 2011; p. 58. [Google Scholar]
  31. Trigaux, D.; Allacker, K.; De Troyer, F. Life cycle assessment of land use in neighborhoods. Procedia Environ. Sci. 2017, 38, 595–602. [Google Scholar] [CrossRef]
  32. Ma, M.; Zhou, N.; Feng, W.; Yan, J. Challenges and opportunities in the global net-zero building sector. Cell Rep. Sustain. 2024, 1, 100154. [Google Scholar] [CrossRef]
  33. Meteonorm. 2024. Available online: https://meteonorm.com/en/meteonorm-version-8 (accessed on 14 April 2024).
  34. Nematchoua, M.K.; Teller, J.; Reiter, S. Statistical life cycle assessment of residential buildings in a temperate climate of northern part of Europe. J. Clean. Prod. 2019, 229, 621–631. [Google Scholar] [CrossRef]
  35. Nematchoua, M.K.; Jose, A.O.; Reiter, S. Life cycle assessment of two sustainable and old neighbourhoods affected by climate change in one city in Belgium: A review. Environ. Impact Assess. Rev. 2019, 78, 106282. [Google Scholar] [CrossRef]
  36. Nematchoua, M.K.; Reiter, S. Analysis, reduction and comparison of the life cycle environmental costs of an eco-neighborhood in Belgium. Sustain. Cities Soc. 2019, 48, 101558. [Google Scholar] [CrossRef]
  37. Urban Green-Blue Grids. Hammarby Sjöstad, Stockholm, Sweden. Available online: https://urbangreenbluegrids.com/projects/hammarby-sjostad-stockholm-sweden (accessed on 16 April 2025).
  38. Wati, E.; Meukam, P.; Nematchoua, M.K.; Rene, T. Influence of external shading on optimum insulation thickness of building walls in a tropical region. Appl. Therm. Eng. 2015, 90, 754–762. [Google Scholar] [CrossRef]
  39. Eurostat. Available online: https://ec.europa.eu/eurostat/web/interactive-publications/energy-2025 (accessed on 8 January 2023).
  40. Nick, V.; Mata, E.; Sasic, K.; Scartezzini, J. Effective and robust energy retrofitting measures for future climatic conditions—Reduced heating demand of Swedish households. Energy Build. 2016, 127, 12–24. [Google Scholar] [CrossRef]
  41. Ciobanu, D.; Eftimie, E.; Jaliu, C. The influence of measured/simulated weather data on evaluating the energy need in buildings. Energy Proc. 2014, 48, 796–805. [Google Scholar] [CrossRef]
  42. EPN 15978; Contribution des Ouvrages de Construction au Developpement Durable-Evaluation de la Performance Environnementale des Bâtiments-Methode de Calcul. Comite Europeen de Normalisation: Brussels, Belgium, 2011.
  43. Osman, A.I.; Mehta, N.; Elgarahy, A.M.; Al-Hinai, A.; Al-Muhtaseb AA, H.; Rooney, D.W. Conversion of biomass to biofuels and life cycle assessment: A review. Environ. Chem. Lett. 2021, 19, 4075–4118. [Google Scholar] [CrossRef]
  44. Schoonschip Amsterdam. Schoonschip Amsterdam. Available online: https://schoonschipamsterdam.org/en (accessed on 16 April 2025).
  45. Attia, S.; Mlecnik, E.; Van Loon, S. Principles for Nearly Zero Energy Building in Belgium. World Sustainable Energy Days. 2012. Available online: https://repository.tudelft.nl/record/uuid:64362f4c-f3a9-407a-9e98-b7a175de6238 (accessed on 22 April 2025).
  46. Modeste Kameni, N.; Antoinette Marie-Reine, N.; Sigrid, R. Towards nearly zero-energy residential neighbourhoods in the European Union: A case study. Renew. Sustain. Energy Rev. 2021, 135, 110198. [Google Scholar]
  47. Modeste Kameni, N.; Sigrid, R. Evaluation of bioclimatic potential, energy consumption, CO2-emission, and life cycle cost of a residential building located in Sub-Saharan Africa; a case study of eight countries. Sol. Energy 2021, 218, 512–524. [Google Scholar]
  48. Modeste, K.N. From existing neighbourhoods to net-zero energy and nearly zero carbon neighbourhoods in the tropical regions. Sol. Energy 2020, 211, 244–257. [Google Scholar]
  49. Reusswig, F.; Bock, S.; Schleer, C.; Lass, W. Effects of voluntary and involuntary real lab situations on personal carbon foot-prints of private households. Exp. Ger. Front. Sustain. 2021, 2, 648433. [Google Scholar] [CrossRef]
  50. Modeste, K.N. A simplified framework to assess the feasibility of zero-energy at the European community scale in 2030. Sol. Energy 2021, 230, 1040–1051. [Google Scholar]
  51. Fawzy, S.; Osman, A.I.; Doran, J.; Rooney, D.W. Strategies for mitigation of climate change: A review. Environ. Chem. Lett. 2020, 18, 2069–2094. [Google Scholar] [CrossRef]
  52. Enviropaul. Kronsberg: A Model Neighborhood in Germany. 3 January 2018. Available online: https://enviropaul.wordpress.com/2018/01/03/kronsberg-a-model-neighborhood-in-germany (accessed on 16 April 2025).
  53. Nematchoua, M.K.; Reiter, S. Life cycle assessment of an eco-neighborhood: Influence of a sustainable urban mobility and photovoltaic panels. In Proceedings of the IAPE’19, Oxford, UK, 15 March 2019. [Google Scholar]
  54. Barbara, R.; Anne-Françoise, M.; Sigrid, R. Life-cycle assessment of residential buildings in three different European locations, basic tool. Build. Environ. 2012, 51, 395–401. [Google Scholar]
  55. Grafakos, S.; Trigg, K.; Landauer, M.; Chelleri, L.; Dhakal, S. Analytical framework to evaluate the level of integration of climate adaptation and mitigation in cities. Clim. Chang. 2019, 154, 87–106. [Google Scholar] [CrossRef]
  56. Mustafa, A.; Kazmi, M.; Khan, H.R.; Qazi, S.A.; Lodi, S.H. Towards a carbon neutral and sustainable campus: Case study of NED university of engineering and technology. Sustainability 2022, 14, 794. [Google Scholar] [CrossRef]
  57. Finnveden, G.; Hauschild, M.Z.; Ekvall, T.; Guinée, J.; Heijungs, R.; Hellweg, S.; Koehler, A.; Pennington, D.; Suh, S. Recent developments in life cycle assessment. J. Environ. Manag. 2009, 91, 1–21. [Google Scholar] [CrossRef] [PubMed]
  58. Horne, R.E.; Grant, T.; Verghese, K. Life Cycle Assessment: Principles, Practice and Prospects; CSIRO Publishing: Clayton, Australia, 2009. [Google Scholar] [CrossRef]
Figure 1. Sustainable district.
Atmosphere 16 00508 g001
Figure 2. Geo-localization of Urban district.
Atmosphere 16 00508 g002
Figure 3. Rural district.
Atmosphere 16 00508 g003
Figure 4. Modelling of three districts in the Pleiades LCA software ((a) urban on left, (b) rural on middle, and (c) sustainable districts on right).
Atmosphere 16 00508 g004
Figure 5. Concentration of carbon dioxide generated each year in the sustainable neighborhoods (kg CO2).
Atmosphere 16 00508 g005
Figure 6. Concentration of carbon dioxide generated each year in the urban neighborhoods (kgCO2).
Atmosphere 16 00508 g006
Figure 7. Concentration of carbon dioxide generated each year in the rural neighborhoods (kgCO2).
Atmosphere 16 00508 g007
Figure 8. Greenhouse gas costs in the three districts in some European union countries (in EUR).
Atmosphere 16 00508 g008
Figure 9. Greenhouse gas cost in the three districts in some European Union countries (in %).
Atmosphere 16 00508 g009
Figure 10. Carbon emissions in sustainable and urban neighborhoods in 2050.
Atmosphere 16 00508 g010
Figure 11. Variation in carbon emission costs in 2050 in different countries of the EU.
Atmosphere 16 00508 g011
Figure 12. Variation in carbon emissions after installing PV panels in urban and rural districts in EU countries.
Atmosphere 16 00508 g012
Figure 13. Carbon reduction cost after applying PV panels.
Atmosphere 16 00508 g013
Figure 14. Variation in CO2 emissions after applying mix scenarios in urban and rural districts.
Atmosphere 16 00508 g014
Table 1. Some elements identified in the three districts evaluated.
Type of CommunityEco-FriendlyMetropolitanCountryside
Land area (m2)35,480872619,457
Inhabitants22010030
Structures203040
Single-family homes10%7%75%
Twin houses60%17%19%
Row houses25%75%4%
Flats5%1%2%
Compactness6 units/ha35 units/ha20 units/ha
% of land occupied by structures18%44%10%
Table 2. Global method monetize [28].
Environmental MetricUnitValue EUR/Unit
Greenhouse gaseskg CO2eq0.050
Energy consumptionkWh0.200
Table 3. Comparison of the outcomes of this study with the existing literature.
Environmental MetricsLotteau et al. [27]This Research
GHG
(kgeqCO2/m2 Floor area/year)
11.0–123.07.5–35.1
Table 4. Concentration of carbon and energy demand per area in some countries.
CountriesSustainable Neighborhood: Greenhouse Gas (kgCO2eq/Year/m2)Rural Neighborhood: Greenhouse Gas (kgCO2eq/Year/m2)Urban Neighborhood: Greenhouse Gas (kgCO2eq/Year/m2)
Living AreaFloor AreaLiving AreaFloor AreaLiving AreaFloor Area
Austria50.012.3140.0-190.018.7
Belgium30.09.6120.0 180.017.6
Bulgaria90.019.6170.0 260.025.5
Croatia40.09.2130.0-230.022.1
Cyprus50.011.5110-160.015.4
Denmark30.07.5150.0-260.025.6
Finland40.08.7170.0-320.031.0
France30.07.5100.0-170.017.0
Germany60.011.7140.0-190.018.9
Greece50.011.0120.0-180.017.6
Hungary50.011.4140.0-190.018.8
Ireland40.010.1130.0-240.024.0
Italy60.012.9110.0-19018.5
Luxembourg80.017.4160.0-260.025.4
Netherlands90.019.4120.0-210.020.4
Poland14032.3170.0-300.029.6
Portugal60.014.390.0-150.014.8
Romania70.016.3130.0-240.023.8
Slovenia60.012.6140.0-250.024.5
Spain40.09.0120.0-160.015.5
Sweden70.014.8150.0-280.027.4
Table 5. The cost increase in 2050 in some European Union countries.
CountriesSustainable NeighborhoodUrban Neighborhood
Rate of Increase of Total CO2 Emission Cost by 2050 (%)Rate of Increase of Total CO2 Emission Cost by 2050 (%)
Austria38.86.7
Belgium54.39.6
Bulgaria58.116.1
Croatia12.93.7
Cyprus29.74.6
Denmark34.99.1
Finland45.46.9
France29.817.2
Germany35.44.3
Greece55.00.1
Hungary30.02.4
Ireland48.94.3
Italy39.29.2
Luxembourg16.91.2
Netherland77.43.8
Poland46.21.4
Portugal26.24.6
Romania19.342.0
Slovenia1.55.3
Spain12.413.1
Table 6. Reductions (in percentage) in CO2 emissions based on mixed scenarios.
CountriesScenario (0)
(Initial District):
Greenhouse Gas Emission (GHG)
(kgCO2·year)
Scenario (1)
Percentage of Reduction in GHG After PV
Scenario (2)
Percentage of Reduction in GHG After (Combining Global Warming Measures, Full Building Renovation (100%), 100% Electric Vehicles, and Solar Panels)
Austria470,540.010.1%90.4%
Belgium404,005.09.4%89.5%
Bulgaria595,680.014.1%91.4%
Croatia479,685.013.9%90.0%
Cyprus360,600.023.5%88.5%
Denmark539,455.018.0%90.7%
Finland641,210.08.6%91.5%
France361,810.09.0%88.1%
Germany463,840.08.2%90.2%
Greece400,645.029.8%89.1%
Disclaimer/Publisher’s Note: The statements, opinions and data contained in all publications are solely those of the individual author(s) and contributor(s) and not of MDPI and/or the editor(s). MDPI and/or the editor(s) disclaim responsibility for any injury to people or property resulting from any ideas, methods, instructions or products referred to in the content.

