

Allergic Asthma in the Municipalities of the Palynological Network of the Community of Madrid and Its Interrelation with the Concentration of Tree Pollen and Atmospheric Pollutants


Abstract

1. Introduction
2. Materials
Data on Asthma
3. Methods
4. Results
- The P-values derived from all the equations calculated in this study are all less than 0.0001, so they are all explanatory.
- The relationship between the variables is not only statistically significant, but it is a medium-high correlation. In fact, only 2 of the 11 models calculated for 2014 (in the stations of Alcobendas and Aranjuez) and another 2 (in Leganés and Collado Villalba) for 2015 present adjusted R2 values lower than 30%. Again, in the stations of Alcobendas and Aranjuez, the fit coefficient of the calculated regression models presents statistically non-significant values for the years 2016 and 2017. In those same years, there are also non-significant values in the Coslada station and, in addition, in 2017, in Collado Villalba, so in that year there are 4 non-significant adjustments and the 3 indicated in 2016 (Table A1).
- In the equations obtained for asthma, for the year 2014 (Table A1), the highest adjusted R2 value is given for the Madrid Ayuntamiento area, with 59.8843% (which represents the highest value in this study); and the lowest (within the models with adjusted R2 > 30%) is given for the Collado Villalba station, with 35.3715%. In 2015, the adjusted R2 value reaches its highest value, 50.8117%, for the Madrid Barrio de Salamanca station and the lowest, 31.6809%, for the Coslada area (Table A1). In 2016, the best fit is achieved with an adjusted regression coefficient R2 value of 55.0366%, for the Madrid Ayuntamiento station, and it is in the Collado Villalba area, with 30.2347%, where the lowest value of this study is given (Table A1). Finally, for 2017, 45.2944% is the highest value of adjusted R2, which corresponds to the Getafe area, and 31.6296% for the Madrid Facultad de Farmacia station is the value with the worst fit (Table A1).
- In general, the highest values of adjusted R2 are found in the stations located in the most urban municipalities, i.e., the three located in Madrid, as well as Getafe and Leganés, with the exception of Coslada (Table A1). And the lowest values of this coefficient of determination are found in the municipalities closest to the rurality classification, i.e., Aranjuez and Collado Villalba, in accordance with the description in the Materials section.
- In all the equations obtained, there is an interrelation of asthma episodes of care with one or more types of air pollutants and with two or more pollen types.
- Although, in most of the statistically significant models (19 out of 33), pollen types outnumber air pollutants (Table A1), even taking into account the deprivation of the measurement of some atmospheric pollutants already mentioned, there is a coexistence of the two types of independent variables in five calculated equations; even in nine of them, there is a greater number of air pollutants than pollen types.
5. Discussion
6. Conclusions
Author Contributions
Funding
Data Availability Statement
Acknowledgments
Conflicts of Interest
Appendix A

| ASTHMA (R96) | YEAR 2014 | YEAR 2015 | YEAR 2016 | YEAR 2017 | ||||||||
|---|---|---|---|---|---|---|---|---|---|---|---|---|
| Alcalá de Henares | 42.0712 231/232 0.0000 | O3 NO2 CO SO2 | Olea Pinus Populus | 47.5771 243/245 0.0000 | O3 NO2 PM10 SO2 | Olea Pinus Populus | 30.8708 241/243 0.0000 | O3 PM10 CO | Olea Pinus | 37.8836 242/243 0.0000 | O3 PM10 SO2 | Cupressac. Olea Pinus |
| Alcobendas | 29.6421 211/212 0.0000 | O3 PM10 SO2 | Olea Pinus Populus | 42.1048 243/245 0.0000 | NO2 PM10 | Olea Pinus Populus | 24.2444 241/243 0.0000 | O3 | Olea Pinus Ulmus | 21.9464 230/232 0.0000 | O3 | Cupressac. Pinus |
| Aranjuez | 28.8428 232/236 0.0000 | O3 PM10 | Olea Pinus Platanus Populus Ulmus | 35.5350 239/242 0.0000 | NO2 PM10 | Cupressac. Olea | 25.8380 225 0.0000 | O3 PM10 | Olea Pinus | 22.7937 237/238 0.0000 | O3 PM10 | Pinus Populus Ulmus |
| Coslada | 42.3669 237/242 0.0000 | O3 PM10 | Olea Platanus Populus | 31.6809 231/233 0.0000 | O3 NO2 | Olea Pinus Populus | 17.9732 207/209 0.0000 | O3 PM10 | Populus Ulmus | 18.2183 230 0.0000 | O3 | Pinus Populus |
| Madrid: Barrio de Salamanca | 49.1694 245/247 0.0000 | O3 PM10 CO | Olea Pinus Platanus Populus | 50.8117 245/247 0.0000 | O3 NO2 CO SO2 | Olea Pinus Populus | 52.2529 245/247 0.0000 | O3 PM2.5 SO2 | Olea Pinus | 31.9710 244 0.0000 | CO SO2 | Cupressac. Pinus Populus |
| Madrid: Ayunta- miento | 59.8843 225/231 0.0000 | PM10 CO SO2 | Olea Pinus Platanus Populus | 43.6201 247 0.0000 | O3 PM10 SO2 | Olea Pinus Populus | 55.0366 237/242 0.0000 | O3 PM10 CO SO2 | Olea Pinus Ulmus | 40.4575 213 0.0000 | NO2 CO SO2 | Olea Populus |
| Madrid: Facultad de Farmacia | 50.6526 242/246 0.0000 | O3 NO2 PM10 CO | Olea Pinus Populus | 42.7070 242/245 0.0000 | PM10 PM2.5 | Cupressac. Olea Pinus | 47.1049 235/244 0.0000 | O3 PM10 SO2 | Cupresac. Olea Pinus Populus | 31.6296 243/244 0.0000 | O3 PM2.5 CO | Olea Platanus Populus Ulmus |
| Getafe | 51.1448 234/237 0.0000 | O3 NO2 | Olea Pinus Populus | 49.3450 235/238 0.0000 | O3 PM10 | Cupressac. Olea Pinus Populus | 48.0933 220/226 0.0000 | O3 PM10 | Olea Pinus Ulmus | 45.2944 226/231 0.0000 | O3 PM10 | Cupressac. Olea Pinus Platanus Populus |
| Leganés | 55.3196 240/244 0.0000 | O3 NO2 | Olea Pinus Platanus Populus | 26.7813 227/231 0.0000 | O3 PM10 | Cupressac. Olea Pinus Platanus | 40.8556 226/233 0.0000 | O3 PM10 | Olea Pinus Populus Ulmus | 32.2166 234/235 0.0000 | O3 PM10 | Cupressac. Olea Pinus Platanus Populus |
| Las Rozas | 43.4263 232/243 0.0000 | O3 PM10 | Olea Pinus Populus | 41.4306 232/243 0.0000 | O3 | Olea Pinus Populus | 36.7175 238/243 0.0000 | O3 PM10 | Cupresac. Olea | 34.8693 233/240 0.0000 | O3 NO2 | Olea Pinus Populus |
| Collado Villalba | 35.3715 193/194 0.0000 | NO2 PM2.5 CO SO2 | Cupressa. Pinus | 25.4007 219/221 0.0000 | O3 PM2.5 | Pinus Populus | 30.2347 194/195 0.0000 | O3 NO2 SO2 | Pinus Populus Ulmus | 22.7516 238/239 0.0000 | SO2 | Cupressac. Olea Pinus Platanus Populus |
| ASTHMA (R96) | YEAR 2014 | YEAR 2015 | YEAR 2016 | YEAR 2017 |
|---|---|---|---|---|
| Alcalá de Henares | Asthma Alcalá de Henares 2014 = 6.92088 − 0.0369873 × O3 − 0.0360638 × NO2 + 2.0679 × CO + 0.12524 × SO2 + 0.0546737 × Olea + 0.00559378 × Pinus + 0.0065671 × Populus | Asthma Alcalá de Henares 2015 = 9.79148 − 0.0492475 × O3 − 0.047496 × NO2 − 0.0309684 × PM10 + 0.315842 × SO2 + 0.00617946 × Olea + 0.00898512 × Pinus + 0.00458227 × Populus | Asthma Alcalá de Henares 2016 = 9.27489 − 0.0394726 × O3 − 0.0385437 × PM10 − 2.22202 × CO + 0.0105445 × Olea + 0.00427664 × Pinus | Asthma Alcalá de Henares 2017 = 6.79215 − 0.0269283 × O3 − 0.033623 × PM10 + 0.184509 × SO2 + 0.000981516 × Cupressaceae + 0.00371276 × Olea + 0.00609206 × Pinus |
| Alcobendas | Asthma Alcobendas 2014 = 4.97064 − 0.0201927 × O3 − 0.0262672 × PM10 + 0.202395 × SO2 + 0.0454947 × Olea + 0.0162579 × Pinus + 0.0070044 × Populus | Asthma Alcobendas 2015 = 3.78025 + 0.0419715 × NO2 − 0.0529594 × PM10 + 0.00506312 × Olea + 0.0144111 × Pinus + 0.00871629 × Populus | Asthma Alcobendas 2016 = 4.73145 − 0.0174153 × O3 + 0.0110092 × Olea + 0.00601298 × Pinus + 0.0298582 × Ulmus | Asthma Alcobendas 2017 = 4.67778 − 0.0158027 × O3 + 0.00167108 × Cupressaceae + 0.0328716 × Pinus |
| Aranjuez | Asthma Aranjuez 2014 = 14.2168 − 0.0518256 × O3 − 0.113777 × PM10 + 0.073782 × Olea + 0.0826072 × Pinus + 0.00538321 × Platanus + 0.070332 × Populus − 0.0163899 × Ulmus | Asthma Aranjuez 2015 = 10.4245 + 0.0936369 × NO2 − 0.158279 × PM10 + 0.00790116 × Cupressaceae + 0.0535221 × Olea | Asthma Aranjuez 2016 = 13.1755 − 0.0355478 × O3 − 0.103823 × PM10 + 0.00614581 × Olea + 0.0541875 × Pinus | Asthma Aranjuez 2017 = 11.921 − 0.0332926 × O3 − 0.0481715 × PM10 + 0.166509 × Pinus + 0.0172682 × Populus + 0.0222031 × Ulmus |
| Coslada | Asthma Coslada 2014 = 9.21838 − 0.0616481 × O3 − 0.037465 × PM10 + 0.121421 × Olea + 0.00498069 × Platanus + 0.0135303 × Populus | Asthma Coslada 2015 = 9.37723 − 0.050608 × O3 − 0.0216264 × NO2 + 0.0217098 × Olea + 0.00566132 × Pinus + 0.0240948 × Populus | Asthma Coslada 2016 = 7.8874 − 0.0258817 × O3 − 0.0439366 × PM10 + 0.0132475 × Populus + 0.0685507 × Ulmus | Asthma Coslada 2017 = 6.6213 − 0.0280946 × O3 + 0.0782881 × Pinus + 0.00668292 × Populus |
| Madrid: Barrio de Salamanca | Asthma Dr Subiza 2014 = 7.44622 − 0.0401219 × O3 − 0.0464036 × PM10 + 1.65598 × CO + 0.025379 × Olea + 0.0449605 × Pinus + 0.00146327 × Platanus + 0.0224213 × Populus | Asthma Dr. Subiza 2015 = 6.80539 − 0.0299026 × O3 − 0.0229315 × NO2 + 5.23247 × CO − 0.104121 × SO2 + 0.0121755 × Olea + 0.0196392 × Pinus + 0.0161604 × Populus | Asthma Dr. Subiza 2016 = 5.34591 − 0.0315159 × O3 − 0.0356518 × PM2.5 + 0.178614 × SO2 + 0.00689674 × Olea + 0.00812023 × Pinus | Asthma Dr. Subiza 2017 = 5.70672 + 2.04231 × CO − 0.153161 × SO2 + 0.00249545 × Cupressaceae + 0.0346903 × Pinus + 0.0152588 × Populus |
| Madrid: Ayunta− miento | Asthma Madrid Ayto. 2014 = 3.66188 − 0.0671616 × PM10 + 1.84835 × CO + 0.31889 × SO2 + 0.0762976 × Olea + 0.0154566 × Pinus + 0.000531998 × Platanus + 0.0121833 × Populus | Asthma Madrid Ayto. 2015 = 6.09369 − 0.0109032 × O3 − 0.0385109 × PM10 + 0.238251 × SO2 + 0.00548418 × Olea + 0.0194436 × Pinus + 0.0118667 × Populus | Asthma Madrid Ayto. 2016 = 6.34469 − 0.0160281 × O3 − 0.0445019 × PM10 + 4.92447 × CO − 0.242165 × SO2 + 0.0175723 × Olea + 0.00670987 × Pinus + 0.0058998 × Ulmus | Asthma Madrid Ayto. 2017 = 4.9028 − 0.0355397 × NO2 + 1.91881 × CO + 0.255125 × SO2 + 0.00628459 × Olea + 0.00603721 × Populus |
| Madrid: Facultad de Farmacia | Asthma C. Univ. 2014 = 4.87518 − 0.0299854 × O3 − 0.0391158 × NO2 − 0.0173987 × PM10 + 4.94642 × CO + 0.0455906 × Olea + 0.0146536 × Pinus + 0.00171875 × Populus | Asthma C. Univ. 2015 = 3.75549 − 0.0862543 × PM10 + 0.138403 × PM2.5 + 0.00227758 × Cupressaceae + 0.00577979 × Olea + 0.00982304 × Pinus | Asthma C. Univ. 2016 = 5.89473 − 0.0197887 × O3 − 0.021609 × PM10 − 0.345892 × SO2 + 0.00155281 × Cupressaceae + 0.0137827 × Olea + 0.00242409 × Pinus + 0.00174335 × Populus | Asthma C. Univ. 2017 = 3.70066 − 0.00643805 × O3 − 0.0715709 × PM2.5 + 3.58126 × CO + 0.00793662 × Olea + 0.000323787 × Platanus + 0.00343849 × Populus + 0.0142822 × Ulmus |
| Getafe | Asthma Getafe 2014 = 12.011 − 0.0951763 × O3 − 0.0239882 × NO2 + 0.0975832 × Olea + 0.0984703 × Pinus + 0.110834 × Populus | Asthma Getafe 2015 = 11.3369 − 0.0597383 × O3 − 0.0580158 × PM10 + 0.0114923 × Cupressaceae + 0.0134292 × Olea + 0.0516064 × Pinus + 0.047476 × Populus | Asthma Getafe 2016 = 10.5952 − 0.0633162 × O3 − 0.0562564 × PM10 + 0.0427731 × Olea + 0.0976613 × Pinus + 0.303252 × Ulmus | Asthma Getafe 2017 = 8.69819 − 0.0459755 × O3 − 0.0268317 × PM10 + 0.00488585 × Cupressaceae + 0.00750634 × Olea + 0.128874 × Pinus + 0.000909939 × Platanus + 0.0443417 × Populus |
| Leganés | Asthma Leganés 2014 = 11.2257 − 0.0843305 × O3 − 0.0190966 × NO2 + 0.165366 × Olea + 0.0993725 × Pinus + 0.0131861 × Platanus + 0.0469193 × Populus | Asthma Leganés 2015 = 11.2505 − 0.0444401 × O3 − 0.0686687 × PM10 + 0.01509 × Cupressaceae + 0.0174911 × Olea + 0.0280848 × Pinus + 0.00160732 × Platanus | Asthma Leganés 2016 = 10.6375 − 0.0615913 × O3 − 0.0546703 × PM10 + 0.0167692 × Olea + 0.0470158 × Pinus + 0.0400987 × Populus + 0.178237 × Ulmus | Asthma Leganés 2017 = 9.09893 − 0.0467436 × O3 − 0.0335593 × PM10 + 0.00557287 × Cupressaceae + 0.0105807 × Olea + 0.083035 × Pinus + 0.00332866 × Platanus + 0.0295104 × Populus |
| Las Rozas | Asthma Las Rozas 2014 = 12.6376 − 0.0668753 × O3 − 0.0470106 × PM10 + 0.274575 × Olea + 0.0448217 × Pinus + 0.0308489 × Populus | Asthma Las Rozas 2015 = 10.7132 − 0.0380397 × O3 + 0.0462633 × Olea + 0.029355 × Pinus + 0.0388175 × Populus | Asthma Las Rozas 2016 = 12.4233 − 0.0422013 × O3 − 0.0836115 × PM10 + 0.0175418 × Cupressaceae + 0.0894933 × Olea | Asthma Las Rozas 2017 = 12.6105 − 0.0618271 × O3 − 0.0302336 × NO2 + 0.0290067 × Olea + 0.0595487 × Pinus + 0.0357058 × Populus |
| Collado Villalba | Asthma Villalba 2014 = 4.5792 + 0.0310704 × NO2 − 0.154985 × PM2.5 + 3.68636 × CO + 0.378868 × SO2 + 0.00237073 × Cupresaceae + 0.0128953 × Pinus | Asthma Villalba 2015 = 5.62112 − 0.0157225 × O3 + 0.0891772 × PM2.5 + 0.00516212 × Pinus + 0.0444403 × Populus | Asthma Villalba 2016 = 9.6406 − 0.0544051 × O3 − 0.0636737 × NO2 + 0.490163 × SO2 + 0.0103773 × Pinus + 0.0855361 × Populus + 0.372528 × Ulmus | Asthma Villalba 2017 = 4.36117 + 0.631479 × SO2 − 0.00101313 × Cupressaceae + 0.0158547 × Olea + 0.0135319 × Pinus + 0.0329744 × Platanus + 0.0777578 × Populus |
References
- Van den Berg, M.; van Poppel, M.; van Kamp, I.; Andrusaityte, S.; Balseviciene, B.; Cirach, M.; Danileviciute, A.; Ellis, N.; Hurst, G.; Masterson, D.; et al. Visiting green space is associated with mental health and vitaly: A cross sectional study in four European cities. Health Place 2016, 38, 8–15. [Google Scholar] [CrossRef] [PubMed]
- Chico Fernández, J.; Ayuga Téllez, E. Analysis of Pollen Concentrations from Various Tree Pollen Types and Their Interrelation with Different Airborne Pollutants in the Madrid Region (Spain). Sustainability 2021, 14, 5259. [Google Scholar] [CrossRef]
- Rojo, J.; Cervigón, P.; Zuzana Ferencova, Z.; Cascón, A.; Galán Díaz, J.; Romero-Morte, J.; Sabariego, S.; Torres, M.; Gutiérrez-Bustillo, A.M. Assessment of environmental risk areas based on airborne pollen patterns as a response to land use and land cover distribution. Environ. Pollut. 2024, 344, 123385. [Google Scholar] [CrossRef] [PubMed]
- Cervigón, P.; Ferencova, Z.; Cascón, Á.; Romero-Morte, J.; Galán Díaz, J.; Sabariego, S.; Torres, M.; Gutiérrez-Bustillo, A.M.; Rojo, J. Progressive pollen calendar to detect long-term changes in the biological air quality of cities in the Madrid Region, Spain. Landsc. Urban Plan. 2024, 247, 105053. [Google Scholar] [CrossRef]
- Gutiérrez Bustillo, M.; Sáenz Laín, C.; Aránguez Ruiz, E.; Ordóñez Iriarte, J.M. Polen Atmosférico en la Comunidad de Madrid; Documentos técnicos de salud pública; Dirección General de Salud Pública, Consejería de Sanidad, Comunidad de Madrid: Madrid, Spain, 2001. [Google Scholar]
- Galán, I.; Prieto, A.; Rubio, M.; Herrero, T.; Cervigón, P.; Cantero, J.L.; Gurbindo, M.D.; Martínez, M.I.; Tobías, A. Association between airborne pollen and epidemic asthma in Madrid, Spain: A case-control study. Thorax 2010, 65, 398–402. [Google Scholar] [CrossRef]
- SEAIC. Alergológica 2015; SEAIC: Madrid, Spain, 2017; ISBN 978-84-88014-41-2. [Google Scholar]
- Jutel, M.; Agache, I.; Zemelka-Wiacek, M.; Akdis, M.; Chivato, T.; del Giacco, S.; Gajdanowicz, P.; Gracia, I.E.; Klimek, L.; Lauerma, A.; et al. Nomenclature of allergic diseases and hypersensitivityreactions: Adapted to modern needs: An EAACI position paper. Allergy 2023, 78, 2851–2874. [Google Scholar] [CrossRef]
- Schiavoni, G.; D’Amato, G.; Afferni, C. The dangerous liaison between pollens and pollution in respiratory allergy. Ann. Allergy Inmunol. 2017, 118, 269–275. [Google Scholar] [CrossRef]
- Dick, S.; Friend, A.; Dynes, K.; Alkandari, F.; Doust, E.; Cowie, H.; Ayres, J.G.; Turner, S.W. A systematic review of associations between environmental exposures and development of asthma in children aged up to 9 years. BMJ Open. 2014, 4, e006554. [Google Scholar] [CrossRef]
- Capone, P.; Lancia, A.; D’Ovidio, M.C. Interaction between Air Pollutants and Pollen Grains: Effects on Public and Occupational Health. Atmosphere 2023, 14, 1544. [Google Scholar] [CrossRef]
- Subiza, J. Papel de la polución en el aumento de la polinosis. Centro de Asma y Alergia Subiza, Madrid. Salud Rural 2004, 21, 1–6. [Google Scholar]
- Reinmuth-Selzle, K.; Kampf, C.J.; Lucas, K.; Lang-Yona, N.; Frohlich-Nowoisky, J.; Shiraiwa, M.; Lakey, P.S.J.; Lai, S.; Liu, F.; Kunert, A.T.; et al. Air pollution and climate change effects on allergies in the Anthropocene: Abundance, interaction and modification of allergens and adjuvants. Environ. Sci. Technol. 2017, 51, 4119–4141. [Google Scholar] [CrossRef] [PubMed]
- González-Díaz, S.N.; Arias-Cruz, A.; Macouzet-Sánchez, C.; Partida-Ortega, A.B. Impact of air pollution in respiratory allergic diseases. Med. Univ. 2017, 18, 212–215. [Google Scholar] [CrossRef]
- Sénéchal, H.; Visez, N.; Charpin, D.; Shahali, Y.; Peltre, G.; Biolley, J.-P.; Lhuissier, F.; Couderc, R.; Yamada, O.; Malrat-Domenge, A.; et al. A Review of the Effects of Major Atmospheric Pollutants on Pollen Grains, Pollen Content, and Allergenicity. Sci. World J. 2015, 2015, 940243. [Google Scholar] [CrossRef]
- Ortega-Rosas, C.I.; Meza-Figueroa, D.; Vidal-Solano, J.R.; González-Grijalva, B.; Schiavo, B. Association of airborne particulate matter with pollen, fungal spores, and allergic symptoms in an arid urbanized area. Environ. Geochem. Health 2021, 43, 1761–1782. [Google Scholar] [CrossRef] [PubMed]
- de Lira-Quezada, C.E.; González-Díaz, S.N.; Cotera-de Lira, A.G.; Macouzet-Sánchez, C.; Acuña-Ortega, N.; Guzman-Avilán, R.I.; Alejandra Macías-Weinmann, A. The association of air pollution in respiratory allergy: Its impact in an industrial city. World Allergy Organ. J. 2024, 17, 100867. [Google Scholar] [CrossRef] [PubMed]
- Rice, M.B.; Rifas-Shiman, S.L.; Litonjua, A.A.; Gillman, M.W.; Liebman, N.; Kloog, I.; Luttmann-Gibson, H.; Coull, B.A.; Schwartz, J.; Koutrakis, P.; et al. Lifetime air pollution exposure and asthma in a pediatric birth cohort. J. Allergy Clin. Immunol. 2018, 141, 1932–1934. [Google Scholar] [CrossRef]
- Yin, S.; Shen, Z.; Zhou, P.; Zou, X.; Che, S.; Wang, W. Quantifying air pollution attenuation within urban parks: An experimental approach in Shanghai, China. Environ. Pollut. 2011, 159, 2155–2163. [Google Scholar] [CrossRef] [PubMed]
- Nowak, D.J.; Crane, D.E.; Stevens, J.C. Air pollution removal by urban trees and shrubs in the United States. Urban For. Urban Green. 2006, 4, 115–123. [Google Scholar] [CrossRef]
- Alcock, I.; White, M.; Cherrie, M.; Wheeler, B.; Taylor, J.; McInnes, R.; Otte Im Kampe, E.; Vardoulakis, S.; Sarran, C.; Soyiri, I.; et al. Land cover and air pollution are associated with asthma hospitalisations: A cross-sectional study. Environ. Int. 2017, 109, 29–41. [Google Scholar] [CrossRef]
- Chico Fernández, J.; Ayuga Téllez, E. Relationship of Meteorological Variables with the Concentration of Various Tree Pollen Types in Madrid (Spain). Appl. Sci. 2025, 15, 692. [Google Scholar] [CrossRef]
- Garrido-Lestache, J.S. Pólenes alergénicos en España. Allergol. Inmunopathologia 2004, 32, 121–124. [Google Scholar] [CrossRef]
- Chico Fernández, J.; Ayuga Téllez, E. Study of the Interrelations of the Concentrations of Six Tree Pollen Types and Six Atmospheric Pollutants with Rhinitis and Allergic Conjunctivitis in the Community of Madrid. Appl. Sci. 2024, 14, 2965. [Google Scholar] [CrossRef]
- Descripción de la Red de Calidad del Aire de la Comunidad de Madrid. Consejería de Medio Ambiente, Agricultura e Interior de la Comunidad de Madrid. Dirección General de Transición Energética y Economía Circular. Área de Calidad Atmosférica. Available online: https://gestiona.comunidad.madrid/azul_internet/html/web/3.htm?ESTADO_MENU=3 (accessed on 22 March 2025).
- Instituto de Estadística de la Comunidad de Madrid. Available online: https://gestiona.comunidad.madrid/nomecalles_web/#/inicio?layers=ref_nmcl_parcelario_cache,ref_nmcl_paseillo_cache,ref_nmcl_app_cache,ref_nmcl_callejero_cache,ref_nmcl_municipio&extent=309031.46401939593,4411102.037922823,576874.7869512611,4560942.689336593 (accessed on 17 February 2025).
- Ley 45/2007, de 13 de Diciembre, Para el Desarrollo Sostenible del Medio Rural. BOE 299, 14 December 2007. Available online: https://www.boe.es/eli/es/l/2007/12/13/45/con (accessed on 17 February 2025).
- Caracterización de Las Zonas Rurales en la Comunidad de Madrid Plan Estratégico de la PAC (2023–2027). Available online: https://www.comunidad.madrid/sites/default/files/doc/medio-ambiente/1._caracterizacion_de_las_zonas_rurales_comunidad_madrid_pepac_2023-2027.pdf (accessed on 17 February 2025).
- Spain—Rural Development Programme (Regional)—Comunidad de Madrid. The European Agricultural Fund for Rural Development: Europe Investing in Rural Areas. Available online: https://www.comunidad.madrid/sites/default/files/pdr-cm_21042020_version_7.0.pdf (accessed on 17 February 2025).
- Tipología Municipal de la Comunidad de Madrid 2006. Metodología e Infraestructura Estadística. Instituto de Estadística. Consejería de Economía e Innovación Tecnológica. Comunidad de Madrid. Available online: https://www.madrid.org/iestadis/fijas/informes/descarga/tipomuni06cu.pdf (accessed on 17 February 2025).
- Observatorio de Resultados del Servicio Madrileño de Salud. Consejería de Sanidad. Comunidad de Madrid. Available online: http://observatorioresultados.sanidadmadrid.org/AtencionPrimariaInformes.aspx (accessed on 25 January 2025).
- Consejería de Salud. Guía Para el Diagnóstico y Manejo del Asma; Documentos técnicos de Salud Pública Nº 1; Consejería de Salud, Comunidad de Madrid: Madrid, Spain, 1992. [Google Scholar]
- Kjellman, N.I.; Croner, S.; Gustafsson, P.M. Development of asthma in children. Allerg. Immunol. 1991, 23, 351–357. [Google Scholar]
- Ninan, T.K.; Russell, G. Respiratory symptoms, and atopy in Aberdeen schoolchildren: Evidence from two surveys 25 years apart. BMJ 1992, 304, 873–875. [Google Scholar] [CrossRef] [PubMed]
- Mannino, D.M.; Homa, D.M.; Pertowski, C.A.; Ashizawa, A.; Nixon, L.L.; Johnson, C.A.; Ball, L.B.; Jack, E.; Kang, D.S. Surveillance for asthma United States, 1960–1995. MMWR CDC Surveill. Summ. 1998, 47, 1–27. [Google Scholar]
- Von Mutius, E. The rising trends in asthma and allergic disease. Clin. Exp. Allergy 1998, 28, 45–49. [Google Scholar] [CrossRef]
- Dodge, R.R.; Burrows, B. The prevalence and incidence of asthma and asthma-like symptoms in a general population sample. Am. Rev. Respir. Dis. 1980, 122, 567–575. [Google Scholar] [CrossRef]
- Sporik, R.; Holgate, S.T.; Cogswell, J.J. Natural history of asthma in childhood. A birth cohort study. Arch. Dis. Child. 1991, 66, 1050–1053. [Google Scholar] [CrossRef]
- Bousquet, J.; Khaltaev, N.; Cruz, A.A.; Denburg, J.; Fokkens, W.J.; Togias, A.; Zuberbier, T.; Baena-Cagnani, C.E.; Canonica, G.W.; Van Weel, C.; et al. Allergic rhinitis and its impact in asthma (ARIA) 2008 update (in collaboration with the World Health Organization, GA(2)LEN and AllerGen). Allergy 2008, 63, 8–160. [Google Scholar] [CrossRef]
- López Pereira, P.; Gandarillas Grande, A.M.; Díez Gañán, L.; Ordobás Gavín, y.M. Evolución de la prevalencia de Asma y factores sociodemográficos y de salud asociados en población de 18 a 64 años de la Comunidad de Madrid (1996–2013). Rev. Esp. Salud Pública. 2017, 91: 25 de mayo e201705036. Available online: https://www.sanidad.gob.es/biblioPublic/publicaciones/recursos_propios/resp/revista_cdrom/VOL91/ORIGINALES/RS91C_201705036.pdf (accessed on 17 February 2025).
- Ratner, B. The correlation coefficient: Its values range between+1/−1, or do they? J. Target. Meas. Anal. Mark. 2009, 17, 139–142. [Google Scholar] [CrossRef]
- Ghaderpour, E.; Mazzanti, P.; Mugnozza, G.S.; Bozzano, F. Coherency and phase delay analyses between land cover and climate across Italy via the least-squares wavelet software. Int. J. Appl. Earth Obs. Geoinf. 2023, 118, 103241. [Google Scholar] [CrossRef]
- Moonen, S.; Koper, M.J.; Van Schoor, E.; Schaeverbeke, J.M.; Vandenberghe, R.; von Arnim, C.A.; Tousseyn, T.; De Strooper, B.; Thal, D.R. Pyroptosis in Alzheimer’s disease: Cell type-specific activation in microglia, astrocytes and neurons. Acta Neuropathol. 2023, 145, 175–195. [Google Scholar] [CrossRef]
- Fares-Otero, N.E.; De Prisco, M.; Oliva, V.; Radua, J.; Halligan, S.L.; Vieta, E.; Martinez-Aran, A. Association between childhood maltreatment and social functioning in individuals with affective disorders: A systematic review and meta-analysis. Acta Psychiatr. Scand. 2023, 148, 142–164. [Google Scholar] [CrossRef]
- Kim, H.; Park, Y.; Park, K.; Yoo, B. Association between Pollen Risk Indexes, Air Pollutants, and Allergic Diseases in Korea. Osong Public Health Res. Perspect. 2016, 7, 172–179. [Google Scholar] [CrossRef]
- Feo Brito, F.; Mur Gimeno, P.; Martínez, C.; Tobías, A.; Suárez, L.; Guerra, F.; Borja, J.M.; Alonso, A.M. Air pollution and seasonal asthma during the pollen season. A cohort study in Puertollano and Ciudad Real (Spain). Allergy 2007, 62, 1152–1157. [Google Scholar] [CrossRef]
- Subiza, J.; Jerez, M.; Gavilán, M.J.; Varela, S.; Rodriguez, R.; Narganes, M.J.; Jiménez, A.; Tejada Cazorla, J.; Fernández Pérez, C.; Subiza, M.C.y.E. ¿Cuáles son los pólenes que producen polinosis epidémica en el medio urbano de Madrid? Rev. Española Alergol. Inmunol. Clínica 1998, 13, 107–119. [Google Scholar]
- Lam, H.C.Y.; Jarvis, D.; Fuertes, E. Interactive effects of allergens and air pollution on respiratory health: A systematic review. Sci. Total Environ. 2021, 757, 143924. [Google Scholar] [CrossRef]
- Dales, R.E.; Cakmak, S.; Judek, S.; Dann, T.; Coates, F.; Brook, J.R.; Burnett, R.T. Influence of outdoor aeroallergens on hospitalization for asthma in Canada. J. Allergy Clin. Immunol. 2004, 113, 303–306. [Google Scholar] [CrossRef]
- Gleason, J.A.; Bielory, L.; Fagliano, J.A. Associations between ozone, PM2.5, and four pollen types on emergency department pediatric asthma events during the warm season in New Jersey: A case-crossover study. Environ. Res. 2014, 132, 421–429. [Google Scholar] [CrossRef]

| Municipalities | Census Population (Inhabitants Year 2024) | Surface Area of Municipality (Km2) | Population Density (Inhabitants/Km2) | Distance to the Capital of Madrid (Km) |
|---|---|---|---|---|
| Alcalá de Henares | 199,804 | 87.7 | 2278.27 | 31 |
| Alcobendas | 121,446 | 45.0 | 2698.80 | 15 |
| Aranjuez | 62,508 | 201.1 | 310.83 | 47 |
| Collado Villalba | 67,323 | 26.5 | 2540.49 | 41 |
| Coslada | 80,688 | 12.0 | 6724.00 | 8 |
| Getafe | 191,560 | 78.4 | 2443.37 | 14 |
| Las Rozas | 99,193 | 58.3 | 1701.42 | 19 |
| Leganés | 193,934 | 43.1 | 4499.63 | 11 |
| Madrid | 3,422,416 | 607.1 | 5637.32 | 0 |
| PCC Alcalá de Henares | 2014 | 2015 | 2016 | 2017 | PCC Alcobendas | 2014 | 2015 | 2016 | 2017 |
|---|---|---|---|---|---|---|---|---|---|
| Carmen Calzado | 15,507 0.078 | 15,605 0.078 | 15,842 0.078 | 16,002 0.079 | La Chopera | 30,050 0.270 | 30,335 0.269 | 30,726 0.267 | 31,009 0.265 |
| Puerta de Madrid | 13,969 0.070 | 13,889 0.069 | 13,880 0.069 | 13,834 0.068 | Miraflores | 23,398 0.210 | 23,149 0.205 | 23,187 0.202 | 23,358 0.200 |
| Nuestra Señora del Pilar | 19,275 0.097 | 19,339 0.096 | 19,417 0.096 | 19,404 0.095 | Marqués de la Valdavia | 16,883 0.152 | 16,738 0.148 | 16,693 0.145 | 16,726 0.143 |
| Luis Vives | 28,147 0.141 | 27,964 0.139 | 27,905 0.138 | 28,042 0.138 | Arroyo de la Vega | 21,171 0.190 | 21,893 0.194 | 22,631 0.197 | 23,317 0.199 |
| Manuel Merino | 12,162 0.061 | 12,199 0.061 | 12,234 0.061 | 12,320 0.060 | Valdelasfuentes | 19,773 0.178 | 20,721 0.184 | 21,665 0.189 | 22,508 0.193 |
| Juan de Austria | 32,703 0.164 | 32,683 0.163 | 32,690 0.162 | 32,786 0.161 | TOTAL | 111,275 1 | 112,836 1 | 114,902 1 | 116,918 1 |
| María de Guzmán | 21,342 0.107 | 21,242 0.106 | 21,326 0.106 | 21,400 0.105 | PCC Aranjuez | 2014 | 2015 | 2016 | 2017 |
| Reyes Magos | 28,463 0.143 | 28,714 0.143 | 28,997 0.144 | 29,105 0.143 | Aranjuez | 40,680 0.698 | 41,041 0.696 | 41,563 0.696 | 42,281 0.694 |
| Miguel de Cervantes | 22,378 0.112 | 22,932 0.114 | 23,617 0.117 | 24,505 0.120 | Las Olivas | 17,607 0.302 | 17,945 0.304 | 18,183 0.304 | 18,639 0.306 |
| La Garena | 5765 0.029 | 5981 0.030 | 6133 0.030 | 6288 0.031 | TOTAL | 58,287 1 | 58,986 1 | 59,746 1 | 60,920 1 |
| TOTAL | 199,711 1 | 200,548 1 | 202,041 1 | 203,686 1 | PCC Madrid Facultad de Farmacia | 2014 | 2015 | 2016 | 2017 |
| PCC Madrid Ayuntamiento | 2014 | 2015 | 2016 | 2017 | Reina Victoria | 29,981 0.169 | 30,378 0.171 | 31,017 0.172 | 31,454 0.173 |
| Pacífico | 33,858 0.091 | 33,742 0.090 | 33,899 0.089 | 34,099 0.088 | Villaamil | 22,937 0.130 | 23,272 0.131 | 23,837 0.133 | 24,218 0.133 |
| Adelfas | 25,382 0.068 | 25,815 0.069 | 26,325 0.069 | 26,825 0.069 | María Auxiliadora | 11,344 0.064 | 11,368 0.064 | 11,524 0.064 | 11,699 0.064 |
| Las Cortes | 26,994 0.072 | 27,415 0.073 | 27,888 0.073 | 28,233 0.073 | Casa de Campo | 12,390 0.070 | 12,542 0.071 | 12,733 0.071 | 12,844 0.071 |
| Segovia | 21,208 0.057 | 21,409 0.057 | 21,820 0.057 | 22,119 0.057 | Argüelles | 13,168 0.074 | 13,285 0.075 | 13,516 0.075 | 13,709 0.075 |
| Lavapiés | 23,194 0.062 | 23,814 0.063 | 24,464 0.064 | 24,898 0.064 | Isla de Oza | 20,580 0.116 | 20,258 0.114 | 20,340 0.113 | 20,434 0.112 |
| Alameda | 20,134 0.054 | 20,272 0.054 | 20,680 0.054 | 20,987 0.054 | Andrés Mellado | 22,408 0.127 | 22,296 0.126 | 22,371 0.124 | 22,521 0.124 |
| Paseo Imperial | 45,187 0.121 | 45,517 0.121 | 46,191 0.121 | 46,773 0.121 | Cea Bermúdez | 23,081 0.130 | 23,005 0.130 | 23,192 0.129 | 23,503 0.129 |
| Martín de Vargas | 16,961 0.045 | 16,961 0.045 | 17,157 0.045 | 17,465 0.045 | Guzmán el Bueno | 21,070 0.119 | 21,012 0.118 | 21,322 0.119 | 21,643 0.119 |
| Párroco Julio Morate | 20,851 0.056 | 21,042 0.056 | 21,367 0.056 | 21,833 0.056 | TOTAL | 176,959 | 177,416 | 179,852 | 182,025 |
| Embajadores | 19,251 0.052 | 19,402 0.052 | 19,372 0.051 | 19,450 0.050 | PCC Collado Villalba | 2014 | 2015 | 2016 | 2017 |
| Cáceres | 12,936 0.035 | 13,054 0.035 | 13,449 0.035 | 13,641 0.035 | Collado Villalba Estación | 44,135 0.497 | 44,214 0.493 | 44,490 0.488 | 44,994 0.485 |
| Legazpi | 31,035 0.083 | 31,743 0.084 | 32,494 0.085 | 32,961 0.085 | Collado Villalba Pueblo | 29,633 0.334 | 30,101 0.336 | 30,889 0.339 | 31,526 0.340 |
| Quince de Mayo | 15,621 0.042 | 15,451 0.041 | 156,05 0.041 | 15,835 0.041 | Sierra de Guadarrama | 14,999 0.169 | 15,339 0.171 | 15,758 0.173 | 16,201 0.175 |
| Comillas | 22,429 0.060 | 22,348 0.059 | 22,236 0.058 | 22,273 0.058 | TOTAL | 88,767 1 | 89,654 1 | 91,137 1 | 927,21 1 |
| Las Calesas | 28,266 0.076 | 28,467 0.076 | 29,000 0.076 | 29,492 0.076 | PCC Coslada | 2014 | 2015 | 2016 | 2017 |
| Delicias | 9748 0.026 | 9856 0.026 | 10,077 0.026 | 10,293 0.027 | Doctor Tamames | 22,629 0.258 | 22,762 0.260 | 22,816 0.260 | 22,901 0.261 |
| TOTAL | 373,055 1 | 376,308 1 | 382,024 1 | 387,177 1 | Jaime Vera Coslada | 13,703 0.156 | 13,529 0.154 | 13,420 0.153 | 13,423 0.153 |
| PCC Madrid Barrio de Salamanca | 2014 | 2015 | 2016 | 2017 | Valleaguado | 25,315 0.289 | 25,261 0.288 | 25,251 0.288 | 25,128 0.286 |
| Ibiza | 33,226 0.071 | 33,306 0.071 | 33,583 0.071 | 33,683 0.070 | Ciudad San Pablo | 13,026 0.149 | 13,036 0.149 | 12,946 0.147 | 12,877 0.147 |
| Baviera | 14,332 0.031 | 14,288 0.030 | 14,380 0.030 | 14,375 0.030 | El Puerto | 12,915 0.147 | 13,053 0.149 | 13,345 0.152 | 13,513 0.154 |
| Goya | 58,725 0.126 | 58,754 0.125 | 59,211 0.125 | 59,743 0.124 | TOTAL | 87,588 1 | 87,641 1 | 87,778 1 | 878,42 1 |
| Montesa | 24,112 0.052 | 24,616 0.052 | 25,294 0.053 | 25,780 0.054 | PCC Getafe | 2014 | 2015 | 2016 | 2017 |
| Castelló | 20,808 0.045 | 21,218 0.045 | 21,573 0.045 | 21,849 0.045 | Juan de la Cierva | 30,263 0.171 | 30,599 0.171 | 30,914 0.170 | 31,174 0.169 |
| Lagasca | 17,186 0.037 | 17,356 0.037 | 17,541 0.037 | 17,806 0.037 | Las Margaritas | 24,595 0.139 | 25,080 0.140 | 25,542 0.140 | 26,061 0.141 |
| Londres | 12,210 0.026 | 12,376 0.026 | 12,790 0.027 | 13,286 0.028 | El Greco | 21,408 0.121 | 21,331 0.119 | 21,461 0.118 | 21,554 0.117 |
| Príncipe de Vergara | 9337 0.020 | 9426 0.020 | 9541 0.020 | 9681 0.020 | Las Ciudades | 17,586 0.100 | 18,044 0.101 | 18,493 0.102 | 18,843 0.102 |
| Prosperidad | 18,449 0.040 | 18,676 0.040 | 18,845 0.040 | 19,015 0.040 | Sector III | 25,971 0.147 | 26,649 0.149 | 27,393 0.150 | 27,785 0.150 |
| Santa Hortensia | 16,661 0.036 | 16,771 0.036 | 17,026 0.036 | 17,300 0.036 | El Bercial | 12,477 0.071 | 12,978 0.072 | 13,495 0.074 | 13,891 0.075 |
| Ciudad Jardín | 18,036 0.039 | 18,133 0.039 | 18,421 0.039 | 18,623 0.039 | Sánchez Morate | 22,553 0.128 | 22,473 0.125 | 22,585 0.124 | 22,662 0.123 |
| Segre | 26,536 0.057 | 26,534 0.057 | 26,980 0.057 | 27,532 0.057 | Getafe Norte | 13,146 0.074 | 13,403 0.075 | 13,606 0.075 | 13,884 0.075 |
| Potosí | 26,798 0.058 | 27,549 0.059 | 28,094 0.059 | 28,651 0.060 | Perales del Río | 8527 0.048 | 8599 0.048 | 8706 0.048 | 8826 0.048 |
| Daroca | 52,770 0.113 | 53,174 0.113 | 53,685 0.113 | 54,046 0.113 | TOTAL | 176,526 1 | 179,156 1 | 182,195 1 | 184,680 1 |
| Canal de Panamá | 30,337 0.065 | 30,149 0.064 | 30,201 0.064 | 30,048 0.063 | PCC Leganés | 2014 | 2015 | 2016 | 2017 |
| Espronceda | 37,800 0.081 | 38,364 0.082 | 38,831 0.082 | 39,280 0.082 | Huerta de los Frailes | 12,638 0.067 | 12,863 0.068 | 13,189 0.069 | 13,530 0.070 |
| Eloy Gonzalo | 33,508 0.072 | 33,809 0.072 | 34,240 0.072 | 34,482 0.072 | María Jesús Hereza | 30,984 0.163 | 31,596 0.166 | 32,356 0.169 | 32,868 0.170 |
| Justicia | 14,281 0.031 | 14,500 0.031 | 14,735 0.031 | 15,149 0.032 | Santa Isabel | 33,042 0.174 | 33,099 0.174 | 33,343 0.174 | 33,497 0.173 |
| TOTAL | 465,112 1 | 468,999 1 | 474,971 1 | 480,329 1 | M. Ángeles López Gómez | 25,671 0.135 | 25,585 0.134 | 25,547 0.133 | 25,602 0.132 |
| PCC Las Rozas | 2014 | 2015 | 2016 | 2017 | Jaime Vera | 20,922 0.110 | 20,625 0.108 | 20,499 0.107 | 20,373 0.105 |
| Las Rozas—El Abajón | 44,103 0.492 | 44,731 0.492 | 45,595 0.493 | 46,640 0.497 | María Montessori | 15,147 0.080 | 15,131 0.080 | 15,095 0.079 | 15,086 0.078 |
| Monterrozas | 45,500 0.508 | 46,096 0.508 | 46,855 0.507 | 47,145 0.503 | Marie Curie | 12,685 0.067 | 12,769 0.067 | 12,903 0.067 | 13,113 0.068 |
| TOTAL | 89,603 1 | 90,827 1 | 92,450 1 | 93,785 1 | Dr. Mendiguchía Carriche | 25,081 0.132 | 25,004 0.131 | 25,151 0.131 | 25,281 0.131 |
| Leganés Norte | 13,424 0.071 | 13,628 0.072 | 13,770 0.072 | 13,941 0.072 | |||||
| TOTAL | 189,594 1 | 190,300 1 | 191,853 1 | 193,291 1 |
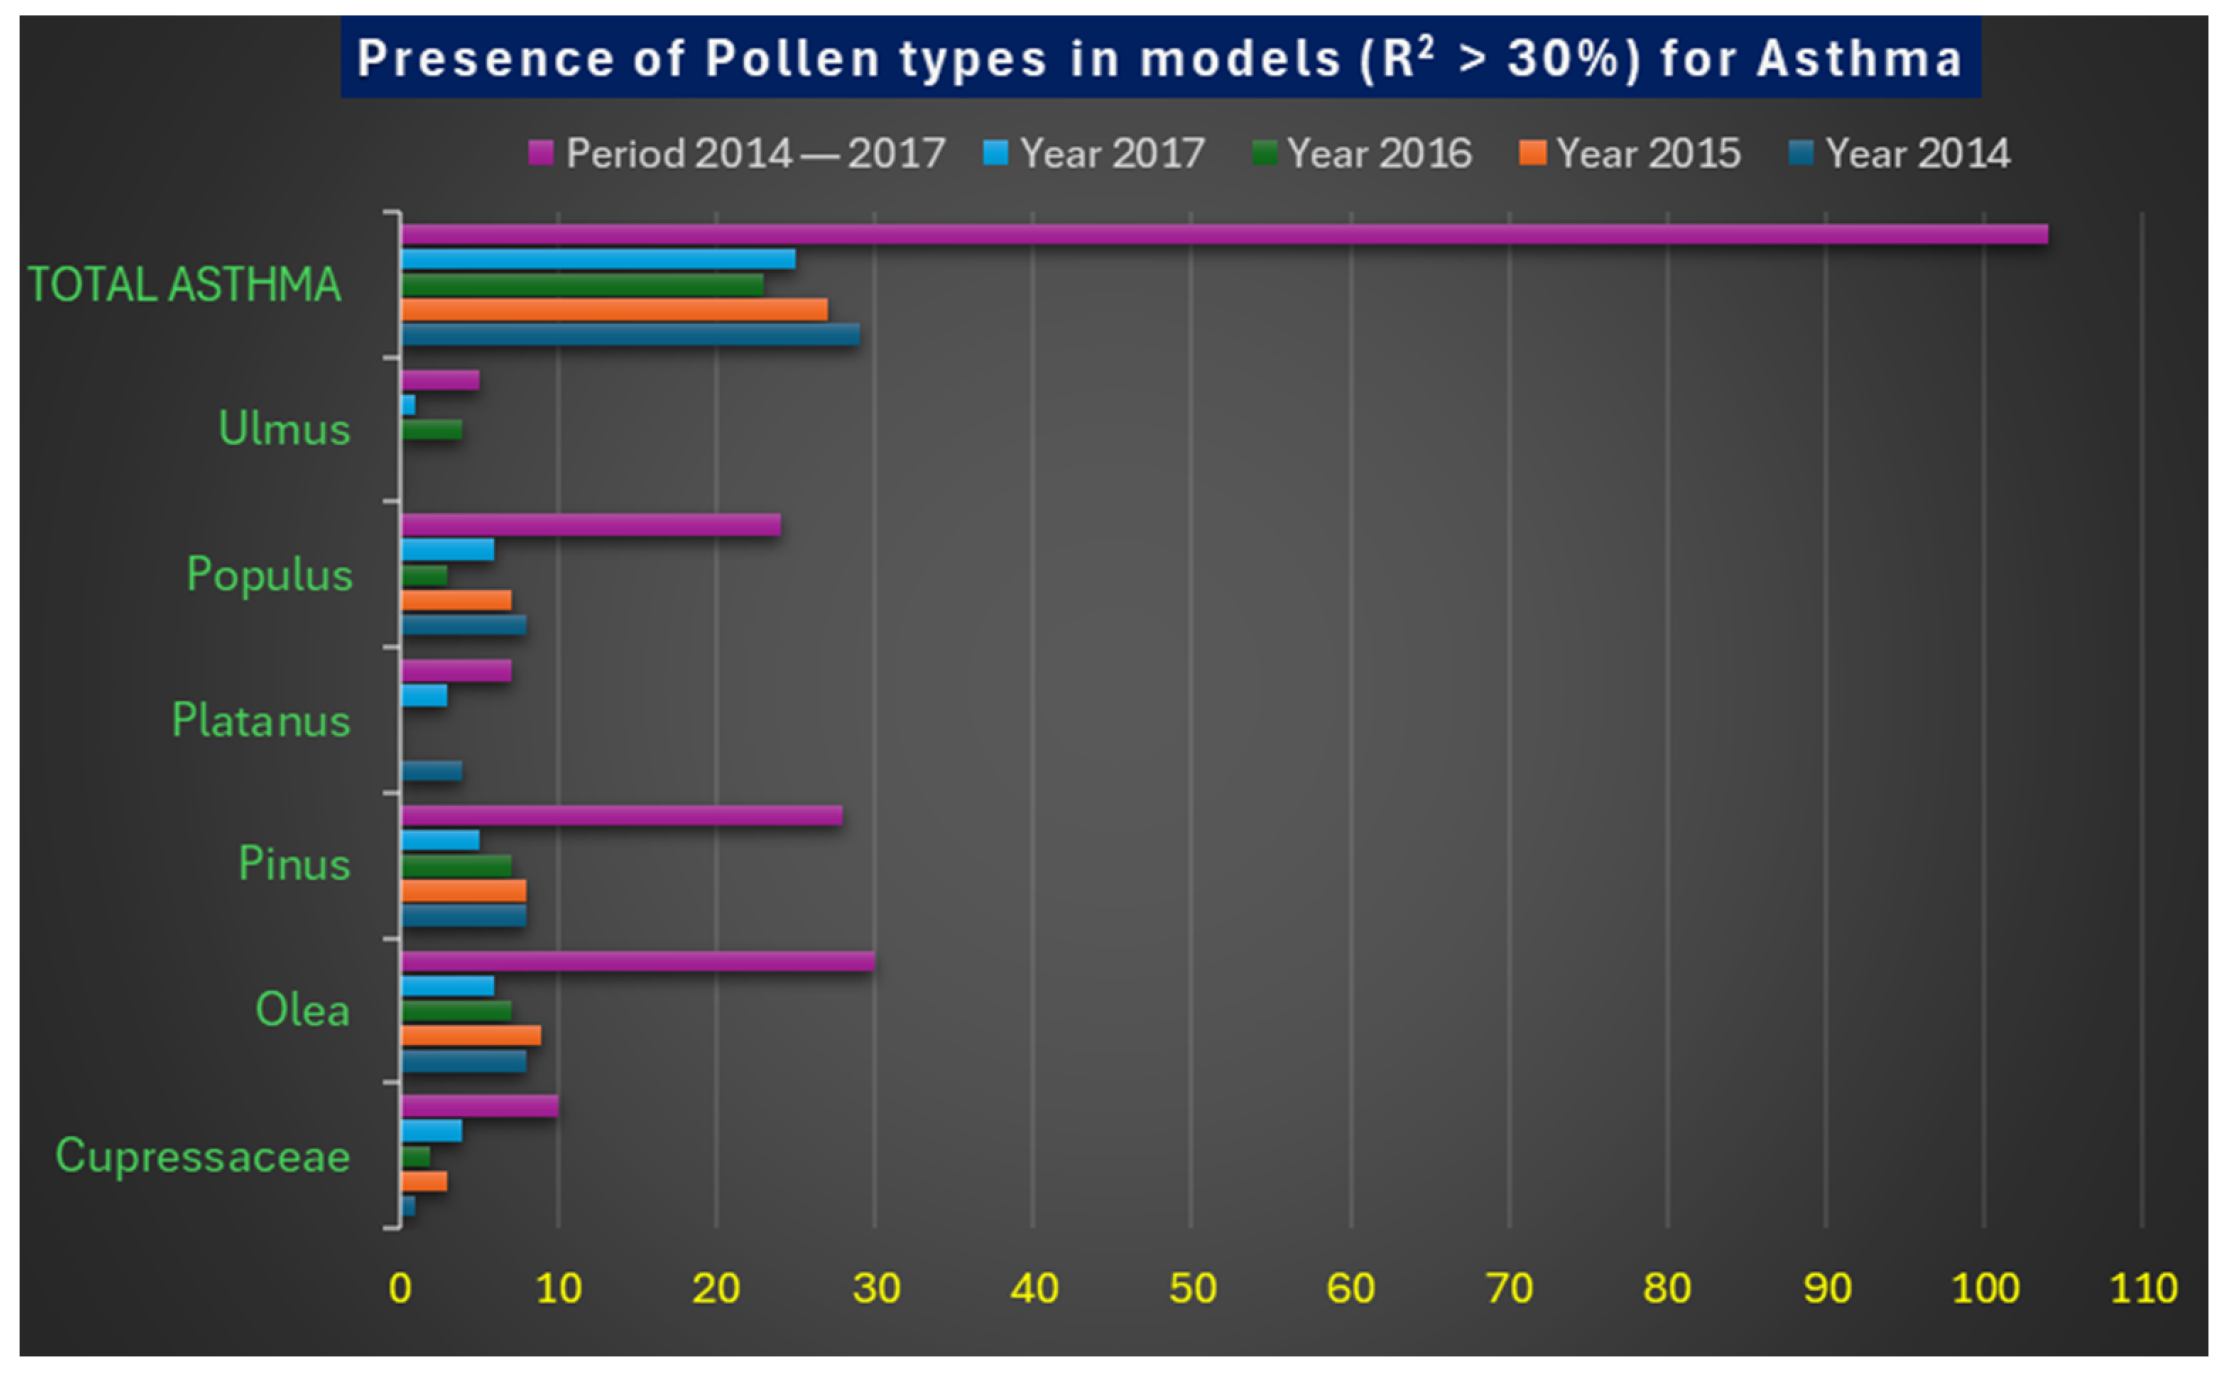
| Types of Pollen | Year 2014 | Year 2015 | Year 2016 | Year 2017 | Period 2014–2017 |
|---|---|---|---|---|---|
| Cupressaceae | 1 | 3 | 2 | 4 | 10 |
| Olea | 8 | 9 | 7 | 6 | 30 |
| Pinus | 8 | 8 | 7 | 5 | 28 |
| Platanus | 4 | - | - | 3 | 7 |
| Populus | 8 | 7 | 3 | 6 | 24 |
| Ulmus | - | - | 4 | 1 | 5 |
| Total Asthma | 29 | 27 | 23 | 25 | 104 |
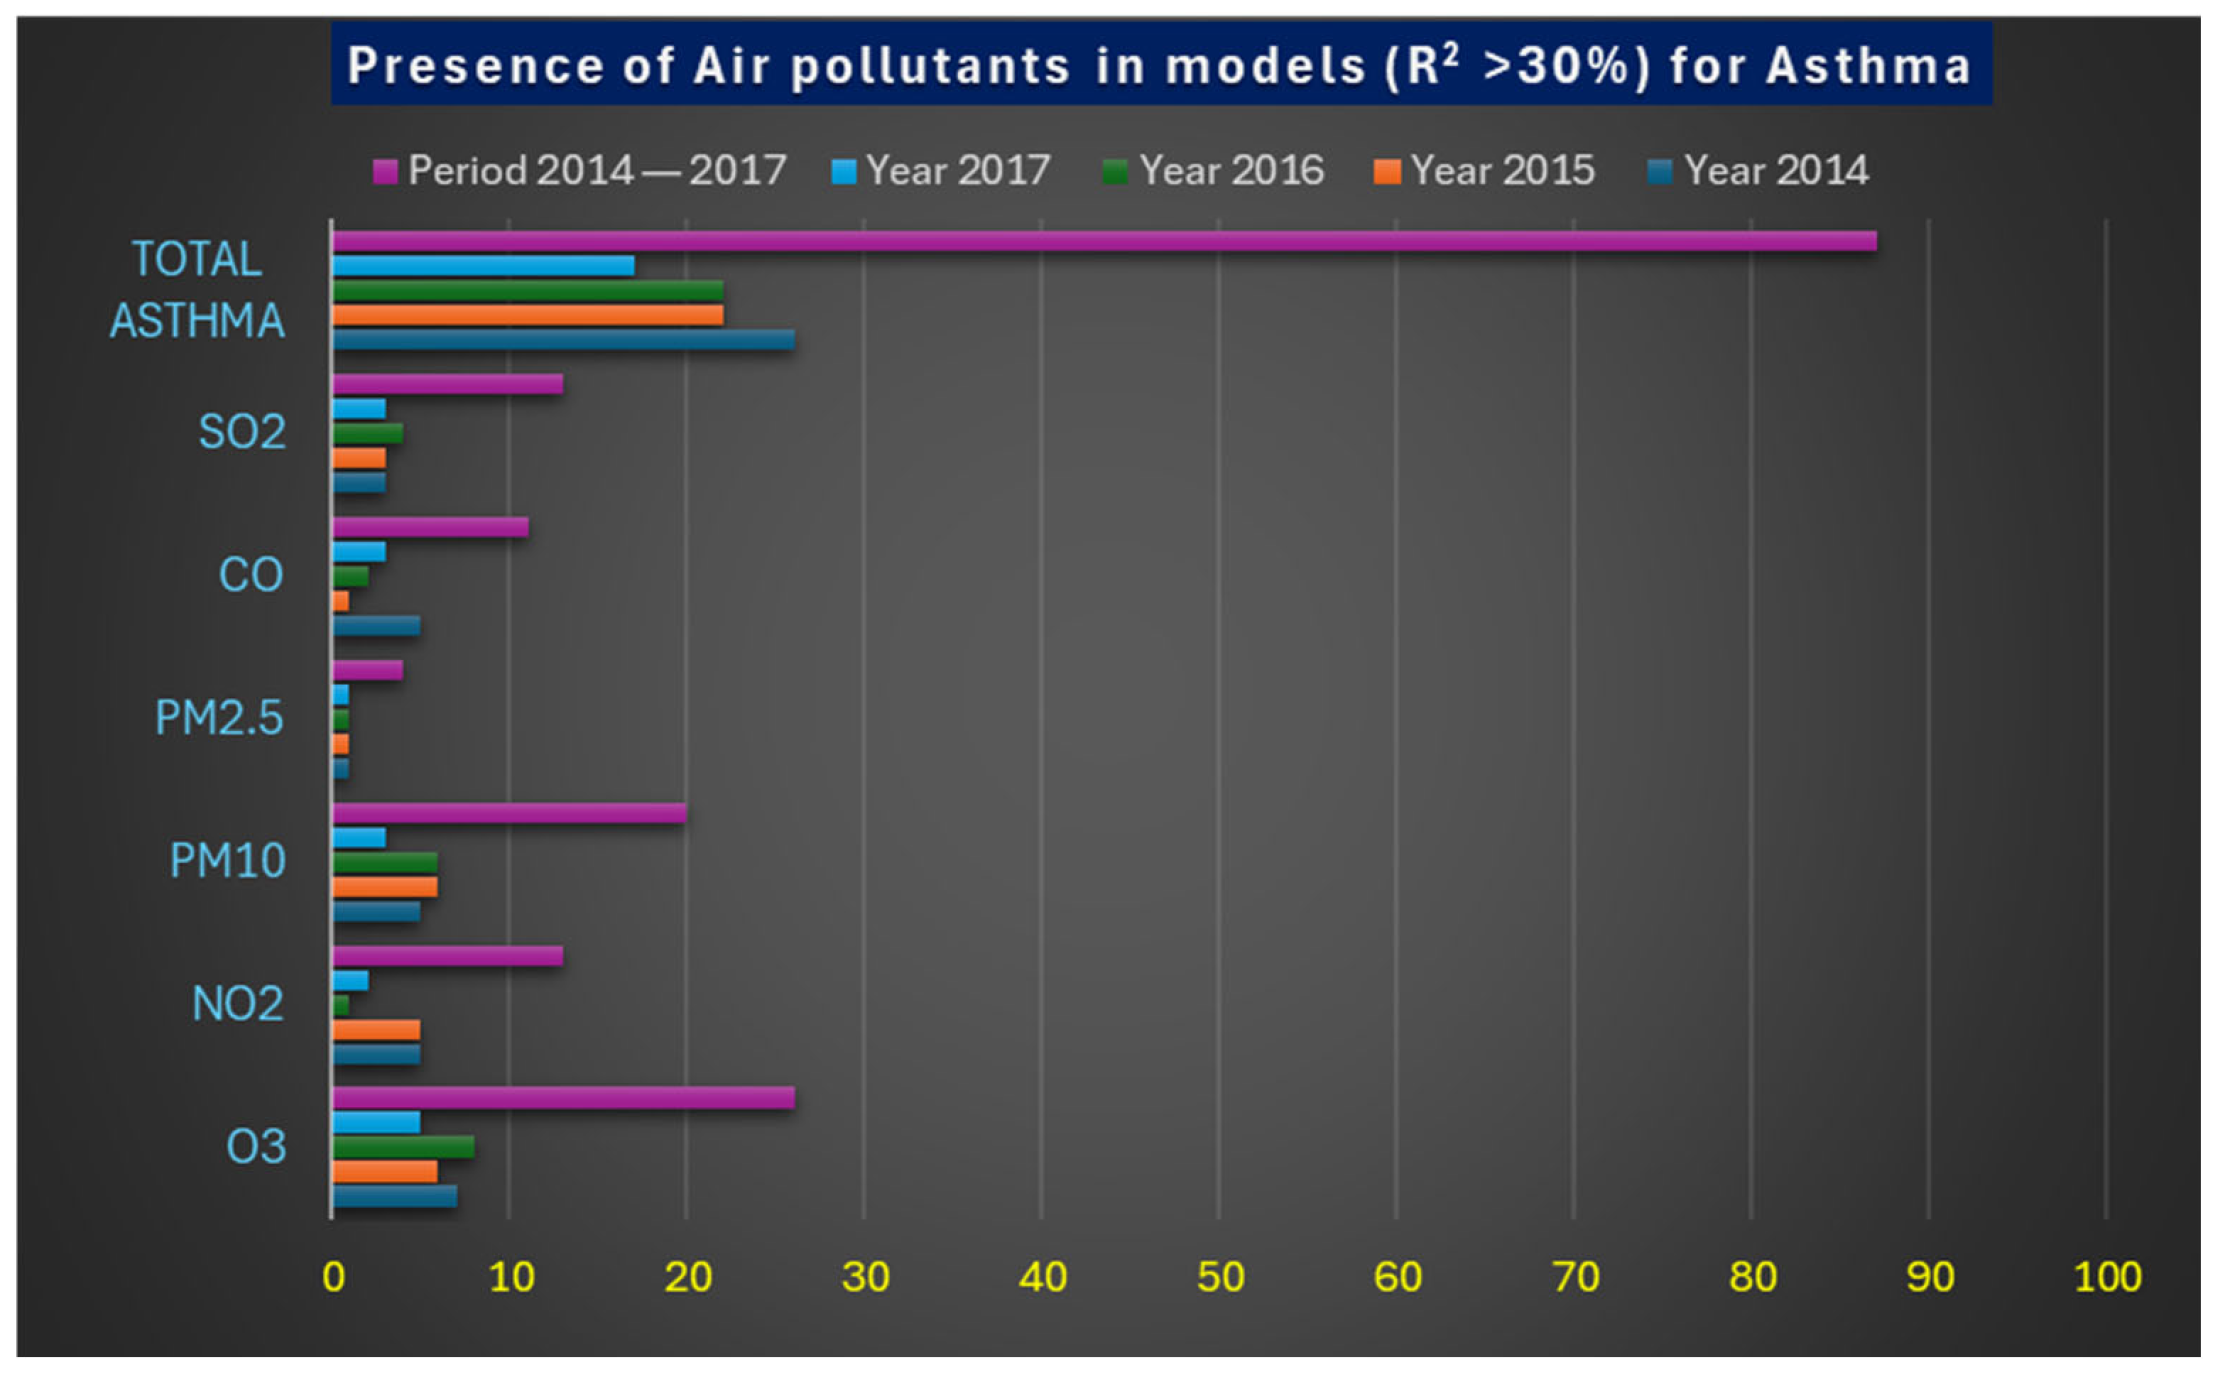
| Atmospheric Pollutants | Year 2014 | Year 2015 | Year 2016 | Year 2017 | Period 2014–2017 |
|---|---|---|---|---|---|
| O3 | 7 | 6 | 8 | 5 | 26 |
| NO2 | 5 | 5 | 1 | 2 | 13 |
| PM10 | 5 | 6 | 6 | 3 | 20 |
| PM2.5 | 1 | 1 | 1 | 1 | 4 |
| CO | 5 | 1 | 2 | 3 | 11 |
| SO2 | 3 | 3 | 4 | 3 | 13 |
| Total Asthma | 26 | 22 | 22 | 17 | 87 |
Disclaimer/Publisher’s Note: The statements, opinions and data contained in all publications are solely those of the individual author(s) and contributor(s) and not of MDPI and/or the editor(s). MDPI and/or the editor(s) disclaim responsibility for any injury to people or property resulting from any ideas, methods, instructions or products referred to in the content. |
© 2025 by the authors. Licensee MDPI, Basel, Switzerland. This article is an open access article distributed under the terms and conditions of the Creative Commons Attribution (CC BY) license (https://creativecommons.org/licenses/by/4.0/).
Share and Cite
Chico-Fernández, J.; Ayuga-Téllez, E. Allergic Asthma in the Municipalities of the Palynological Network of the Community of Madrid and Its Interrelation with the Concentration of Tree Pollen and Atmospheric Pollutants. Atmosphere 2025, 16, 425. https://doi.org/10.3390/atmos16040425
Chico-Fernández J, Ayuga-Téllez E. Allergic Asthma in the Municipalities of the Palynological Network of the Community of Madrid and Its Interrelation with the Concentration of Tree Pollen and Atmospheric Pollutants. Atmosphere. 2025; 16(4):425. https://doi.org/10.3390/atmos16040425
Chicago/Turabian StyleChico-Fernández, Javier, and Esperanza Ayuga-Téllez. 2025. "Allergic Asthma in the Municipalities of the Palynological Network of the Community of Madrid and Its Interrelation with the Concentration of Tree Pollen and Atmospheric Pollutants" Atmosphere 16, no. 4: 425. https://doi.org/10.3390/atmos16040425
APA StyleChico-Fernández, J., & Ayuga-Téllez, E. (2025). Allergic Asthma in the Municipalities of the Palynological Network of the Community of Madrid and Its Interrelation with the Concentration of Tree Pollen and Atmospheric Pollutants. Atmosphere, 16(4), 425. https://doi.org/10.3390/atmos16040425