Article

Threefold Threshold: Synergistic Air Pollution in Greater Athens Area, Greece

by
Aggelos Kladakis
1,2,*,
Kyriaki-Maria Fameli
1,2,
Konstantinos Moustris
1,
Vasiliki D. Assimakopoulos
2 and
Panagiotis T. Nastos
3
1
Laboratory of Air Pollution, Mechanical Engineering Department, University of West Attica, Campus 2, 250 Thivon and P. Ralli Str., 12244 Athens, Greece
2
Institute for Environmental Research and Sustainable Development, National Observatory of Athens, 15236 Athens, Greece
3
Laboratory of Climatology and Atmospheric Environment, Department of Geology and Geoenvironment, National and Kapodistrian University of Athens, University Campus, 15784 Athens, Greece
*
Author to whom correspondence should be addressed.
Atmosphere 2025, 16(7), 888; https://doi.org/10.3390/atmos16070888 (registering DOI)
Submission received: 27 May 2025 / Revised: 6 July 2025 / Accepted: 11 July 2025 / Published: 19 July 2025
(This article belongs to the Special Issue Urban Air Pollution Exposure and Health Vulnerability)

Abstract

This study investigates the health impacts of air pollution in the Greater Athens Area (GAA), Greece, by estimating the Relative Risk (RR) of hospital admissions (HA) for cardiovascular (CVD) and respiratory diseases (RD) from 2018 to 2020. The analysis focuses on daily exceedances of key air pollutants—PM10, O3, and NO2—based on the “Fair” threshold and above, as defined by the European Union Air Quality Index (EU AQI). Data from ten monitoring stations operated by the Ministry of Environment and Energy were spatially matched with six hospitals across the GAA. A Distributed Lag Non-linear Model (DLNM) was employed to capture both the delayed and non-linear exposure–response (ER) relationships between pollutant exceedances and daily HA. Additionally, the synergistic effects of pollutant interactions were assessed to provide a more comprehensive understanding of cumulative health risks. The combined exposure term showed a peak RR of 1.49 (95% CI: 0.79–2.78), indicating a notable amplification of risk when multiple pollutants exceed thresholds simultaneously. The study utilizes R for data processing and statistical modeling. Findings aim to inform public health strategies by identifying critical exposure thresholds and time-lagged effects, ultimately supporting targeted interventions in urban environments experiencing air quality challenges.

1. Introduction

Over the past two decades, a substantial body of epidemiological evidence has highlighted the short-term adverse effects of air pollution on cardiovascular and respiratory morbidity and mortality [1,2,3,4,5]. Although some studies have included multiple pollutants in their models, much of the existing literature has relied on single-pollutant approaches, estimating health risks associated with individual pollutants such as particulate matter or nitrogen dioxide. While informative, this method does not reflect the real-world scenario in which populations are exposed to complex mixtures of air pollutants simultaneously. One reason for this focus on single pollutants has been the statistical challenge of disentangling collinear relationships between co-occurring pollutants. Additionally, regulatory frameworks have traditionally treated pollutants independently, further reinforcing this analytical trend.
However, air pollution is inherently multipollutant in nature, comprising both particulates and gaseous compounds, and it is increasingly recognized that their combined effects may not be simply additive [6]. In response, the scientific community is gradually shifting towards multipollutant modeling frameworks to better characterize the interactive and potentially synergistic effects of air pollutant mixtures on health outcomes. Nevertheless, only a few studies have explicitly examined interactions between particulate matter and gaseous pollutants on cardiovascular outcomes [7,8,9,10,11].
Moreover, the joint effects of ozone and NO2, which interact dynamically in the atmosphere, have also received limited attention. Though both have been independently associated with increased daily mortality and hospital admissions (HA) in time-series analyses [12], relatively few studies have assessed their effects jointly [13,14,15,16,17,18]. Even fewer have utilized integrated indicators such as oxidative capacity (Ox = O3 + NO2), which may better reflect their combined toxicity. One of the few examples is a study conducted in Paris, which evaluated Ox in relation to respiratory HA, although it primarily focused on alternative O3 metrics [19].
Among the most impactful pollutants, PM and O3 have been identified as major independent contributors to respiratory morbidity and mortality worldwide [20]. While the short-term associations of each pollutant with respiratory health outcomes have been widely studied [21], their combined effects remain poorly understood, particularly in urban environments during warmer months, when PM-O3 co-pollution is more common. Research exploring this interaction has yielded limited and often inconsistent findings—especially regarding mortality outcomes [11,22,23], and even fewer studies have examined morbidity indicators such as HA, highlighting a critical research gap [24].
This study aims to address these gaps by evaluating both the individual and interactive health impacts of PM10, NO2, and O3 on HA due to CVDs and RDs in the Greater Athens Area (GAA). By applying a Distributed Lag Non-linear Model (DLNM), we assess short-term and delayed effects, capturing the complexity of exposure–response (ER) relationships and offering new insights into multipollutant health risks in an urban Mediterranean environment.

2. Materials and Methods

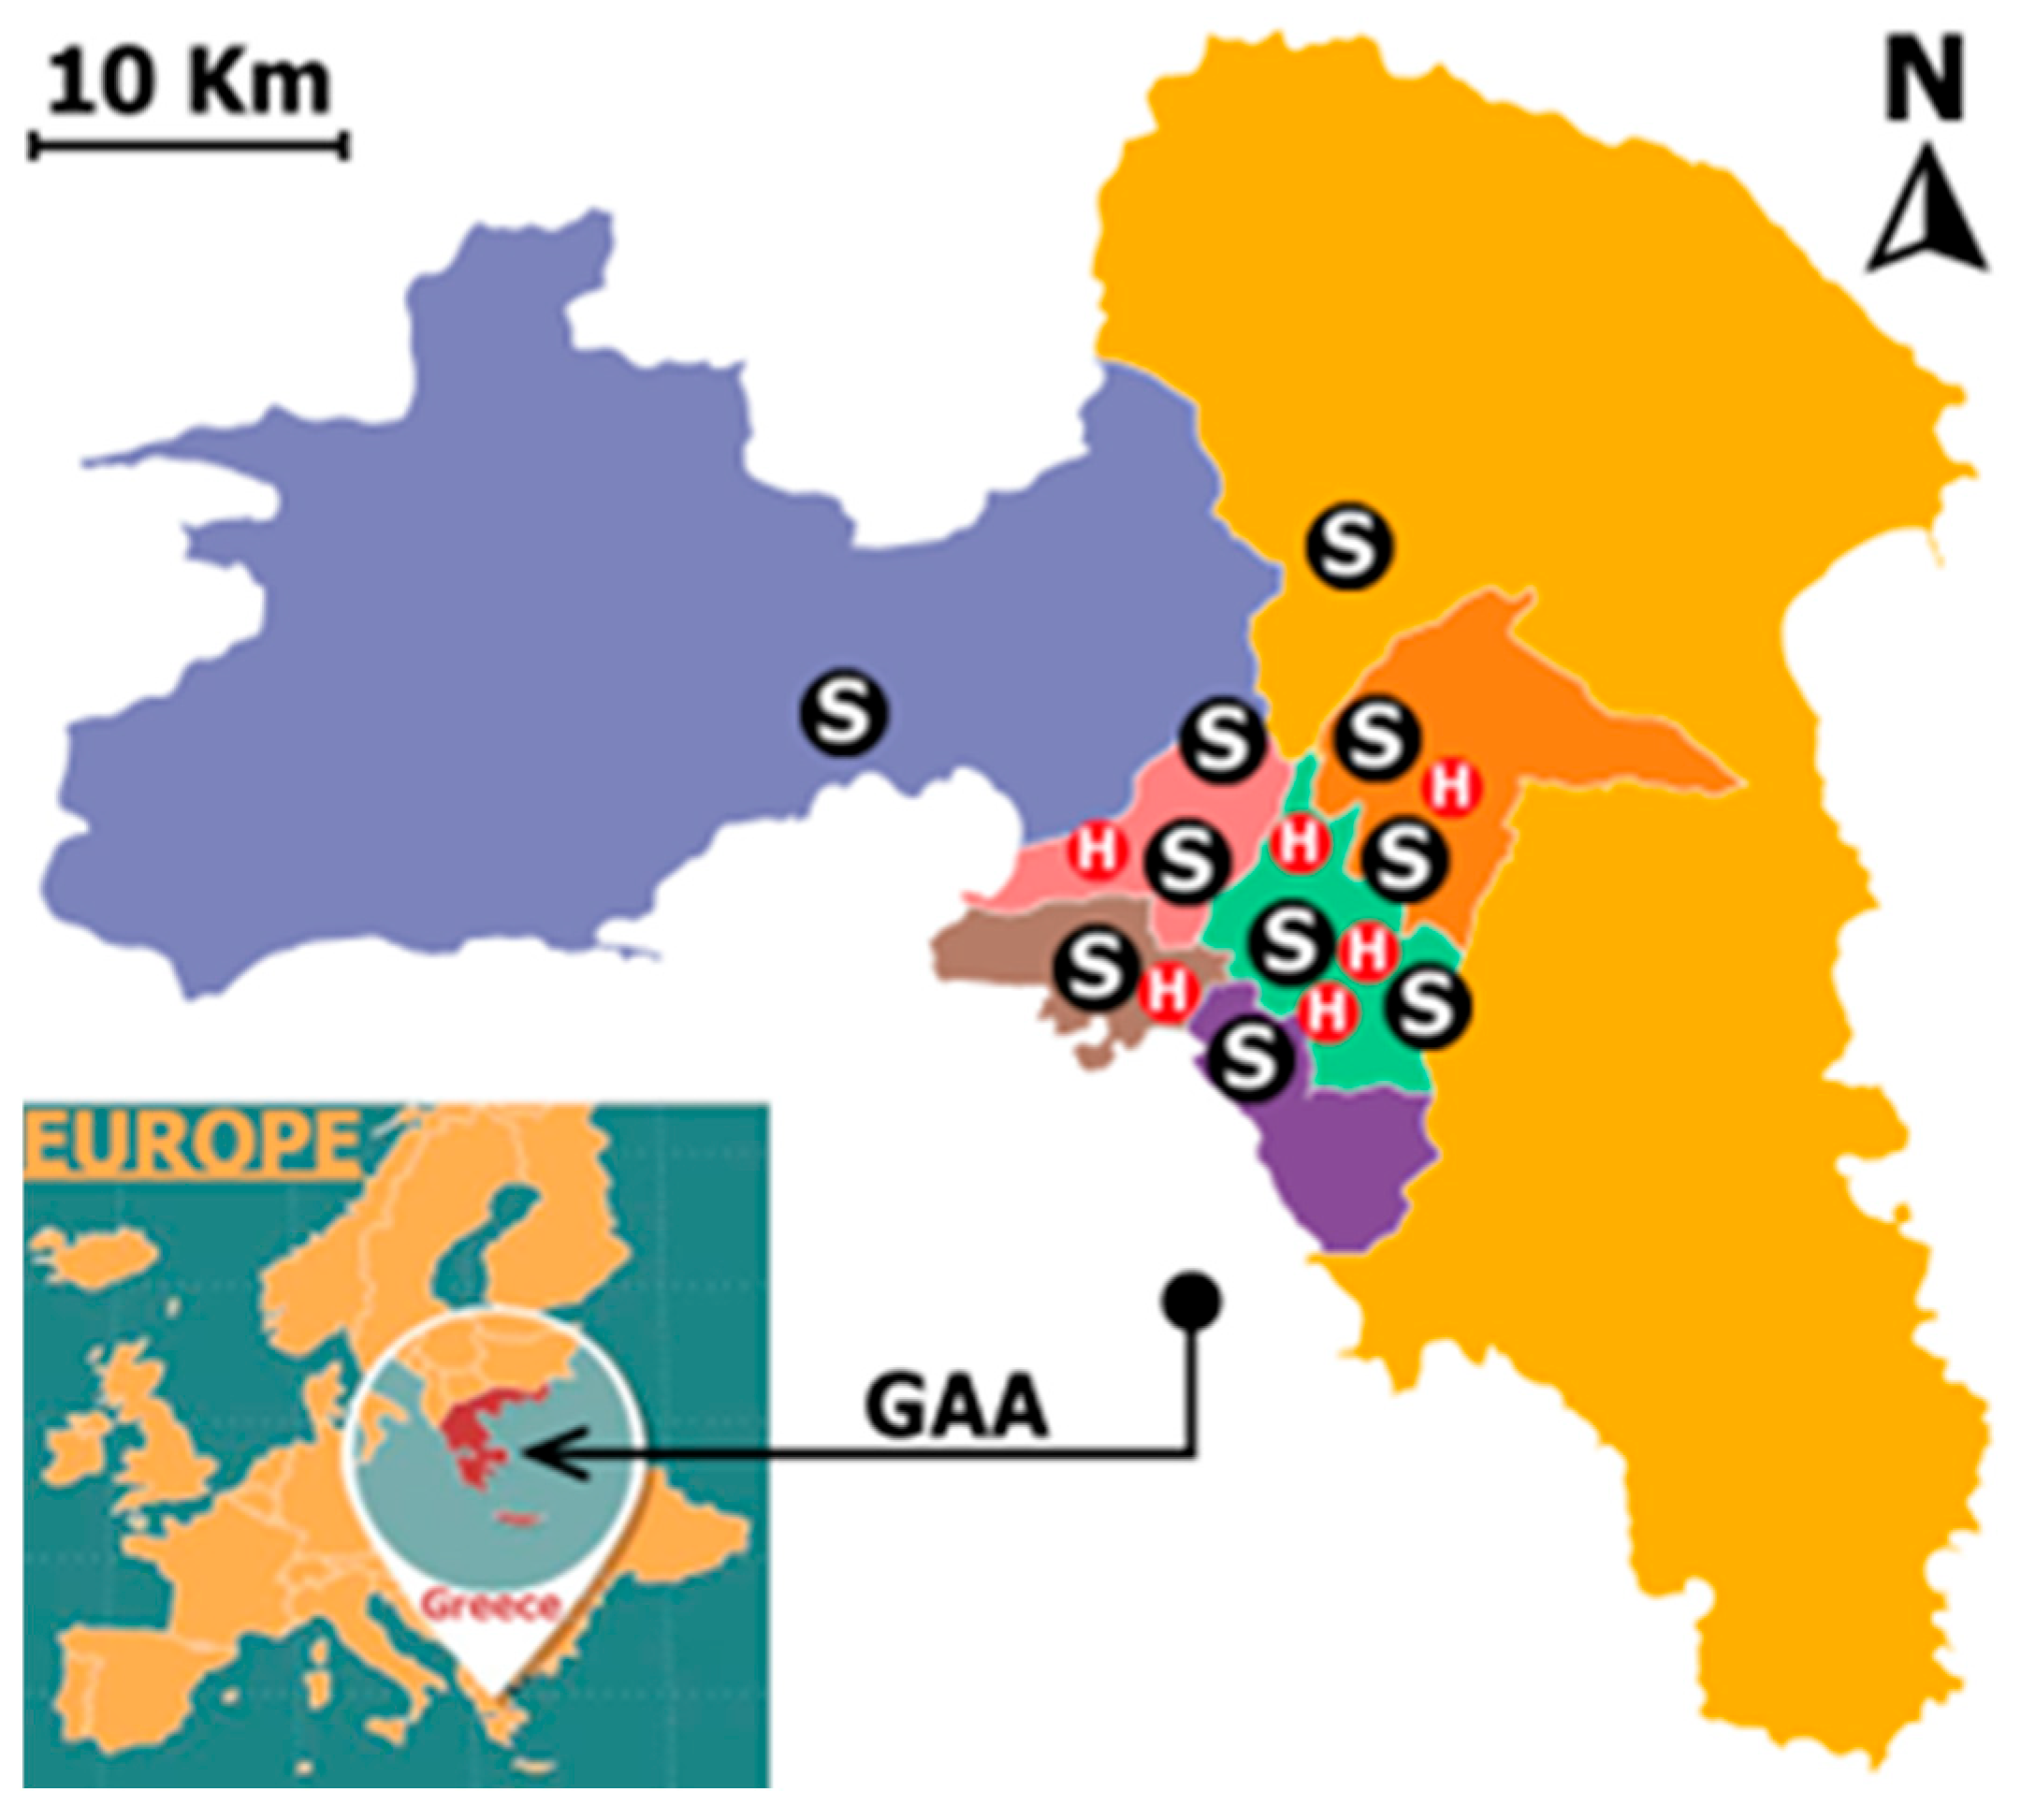
2.1. Data Collected and Study Area

The GAA is located within the Region of Attica, Greece, with a population of approximately 3.79 million, is illustrated in Figure 1. The region experiences significant urban activity, traffic congestion, and industrial emissions, all contributing to poor air quality, particularly during winter inversions and summer photochemical episodes lasting 3–5 days [25,26]. In 2020, over 4.4 million vehicles were in circulation, exacerbating emissions [27], while major industrial sources include the Thriassion plain and the Piraeus harbor [26].
Hospital admission (HA) data were collected from six public hospitals across the GAA: Evaggelismos (EVA), Konstantopoulio (KON), Elpis (ELP), Attikon (ATI), Tzanio (TZA), and Sismanoglio (SIS). These facilities were selected based on data availability (2018–2022), specialization in cardiovascular and respiratory diseases (CVD and RD), geographic representativeness, and sufficient case volume. Collectively, they represent 34% of Attica’s public hospital capacity (2907 out of 8476 beds in 2022) [28]. During the five-year study period, 64,044 HAs related to CVD and RD were recorded, resulting in 469,844 hospital stays, with an average duration exceeding one week per case. Approximately 60% of these admissions were due to RDs and 40% related to CVDs.
Daily air pollution data for the same period were retrieved from ten fixed monitoring stations across the region (Athens, Piraeus, Peristeri, Elefsina, Maroussi, Thrakomakedones, Agia Paraskevi, Lykovrisi, Nea Smyrni, and Liosia), operated by the Ministry of Environment and Energy (MEEN).
The key pollutants included in this study were PM10, NO2, and O3. The study focused on daily exceedances, quantified as the number of hourly pollutant concentrations per day that surpassed thresholds aligned with non-“Good” categories of the EU Air Quality Index:
  • PM10 ≥ 20 μg/m3
  • NO2 ≥ 40 μg/m3
  • O3 ≥ 50 μg/m3
Exceedances were used as continuous exposure variables (0–24 range), reflecting the frequency of pollution events that surpassed recommended thresholds. Data from both hospitals and stations were quality-checked and validated by the responsible public authorities before use, ensuring consistency and integrity throughout the analysis.
To provide long-term context and address trends in regional air quality, we examined annual frequencies of exceedances of EU air quality thresholds for PM10, NO2, and O3 across the Greater Athens Area (GAA) from 2005 to 2022. These thresholds are defined by the European Union as follows: PM10 daily mean > 50 μg/m3, NO2 hourly concentration > 200 μg/m3 (for at least one hour), and O3 maximum daily 8 h mean > 120 μg/m3. The exceedance values, summarized in Table 1, represent the highest yearly frequencies observed among all monitoring stations in the region. The data reveal a marked decline in PM10 exceedances over the years, from 127 days in 2005 to 64 in 2022, indicating a gradual improvement in particulate matter pollution. A similar downward trend is observed for NO2, with exceedances dropping from 14 days in 2005 to virtually zero in recent years. O3 exceedances, while more variable, also show a general decrease over time. These trends suggest that, despite episodic pollution events, long-term air quality in the GAA has improved. Notably, carbon monoxide and sulfur dioxide, though present and harmful, did not exceed their respective EU thresholds (10 mg/m3 for CO and 350 μg/m3 hourly for SO2) at any monitoring station from 2005 onward. Consequently, they were excluded from this study due to negligible exceedance frequency and limited epidemiological relevance in the context of the GAA.

2.2. Distributed Lag Non-Linear Model (DLNM)

To quantify the short-term effects of air pollution on daily HA, a series of Distributed Lag Non-Linear Models (DLNMs) were developed. These models allow for the flexible characterization of both non-linear ER functions and distributed lag effects, which are essential for capturing the delayed health impacts of air pollution exposure [29,30,31,32].
This analysis was performed in the R statistical environment (version 4.2.3; R Foundation for Statistical Computing, Vienna, Austria) using the DLNM package [33]. Separate DLNMs were constructed for each exposure variable: PM10, NO2, O3, and their interaction term.
Each pollutant was analyzed in isolation using its own exceedance count per day, which ranged from 0 to 24, based on hourly concentration values exceeding established thresholds. For the interaction term, a separate DLNM was constructed using the daily sum of exceedances across all three pollutants, resulting in a combined exceedance metric ranging from 0 to 72. This variable captures the total hourly burden of air pollution by integrating the frequency of exceedance events across all pollutants. It is important to note that this interaction term does not model pollutant-specific synergies but rather reflects the cumulative intensity of air quality violations occurring on a given day. Accordingly, the models for individual pollutants represent isolated ER relationships, while the interaction term characterizes the health impact of concurrent multi-pollutant exceedance events.
PM2.5 were not modeled independently, as they are inherently included in PM10 and strongly correlated with it. Including both in the analysis could have distorted the results due to collinearity, particularly in assessing the combined effects of multiple pollutants.
To assess short-term health effects, pollutant exposure was modeled over a lag period of 0 to 7 days, where lag 0 represents the same day as the hospital admission. This approach is consistent with prior studies on acute impacts of environmental exposures and was intended to fully capture the temporal dynamics of admissions attributed to pollution [34,35]. The best-fitting lag structure and degrees of freedom (df) were selected through a systematic grid search, optimizing the Akaike Information Criterion (AIC) and Bayesian Information Criterion (BIC). Natural cubic splines were employed for both the exposure and lag dimensions. For exposure, knots were defined using equally spaced values within the observed data range, based on spline degrees of freedom (df_var). For lag, the spline was defined using a logarithmic scale through ns(..., df = df_lag).
All models included:
  • ns(time, df = df_time × 5) to control for long-term trends;
  • year as a categorical factor to capture inter-annual variability;
  • ns(doy, df = 6) to adjust for seasonality.
The final model specification is expressed as:
A d m i s s i o n s   ~ P M 10 _ b a s i s + O 3 _ b a s i s + N O 2 _ b a s i s + I N T E R A C T I O N b a s i s + n s t i m e , d f = d f _ t i m e × 5 + y e a r + n s d o y , d f = 6
The best-performing model parameters for each variable are summarized in Table 2:
This DLNM framework effectively captures the independent and combined impacts of air pollution on HA due to CVDs and RDs, and offers a solid basis for guiding health risk mitigation strategies and environmental policy decisions.

3. Results and Discussion

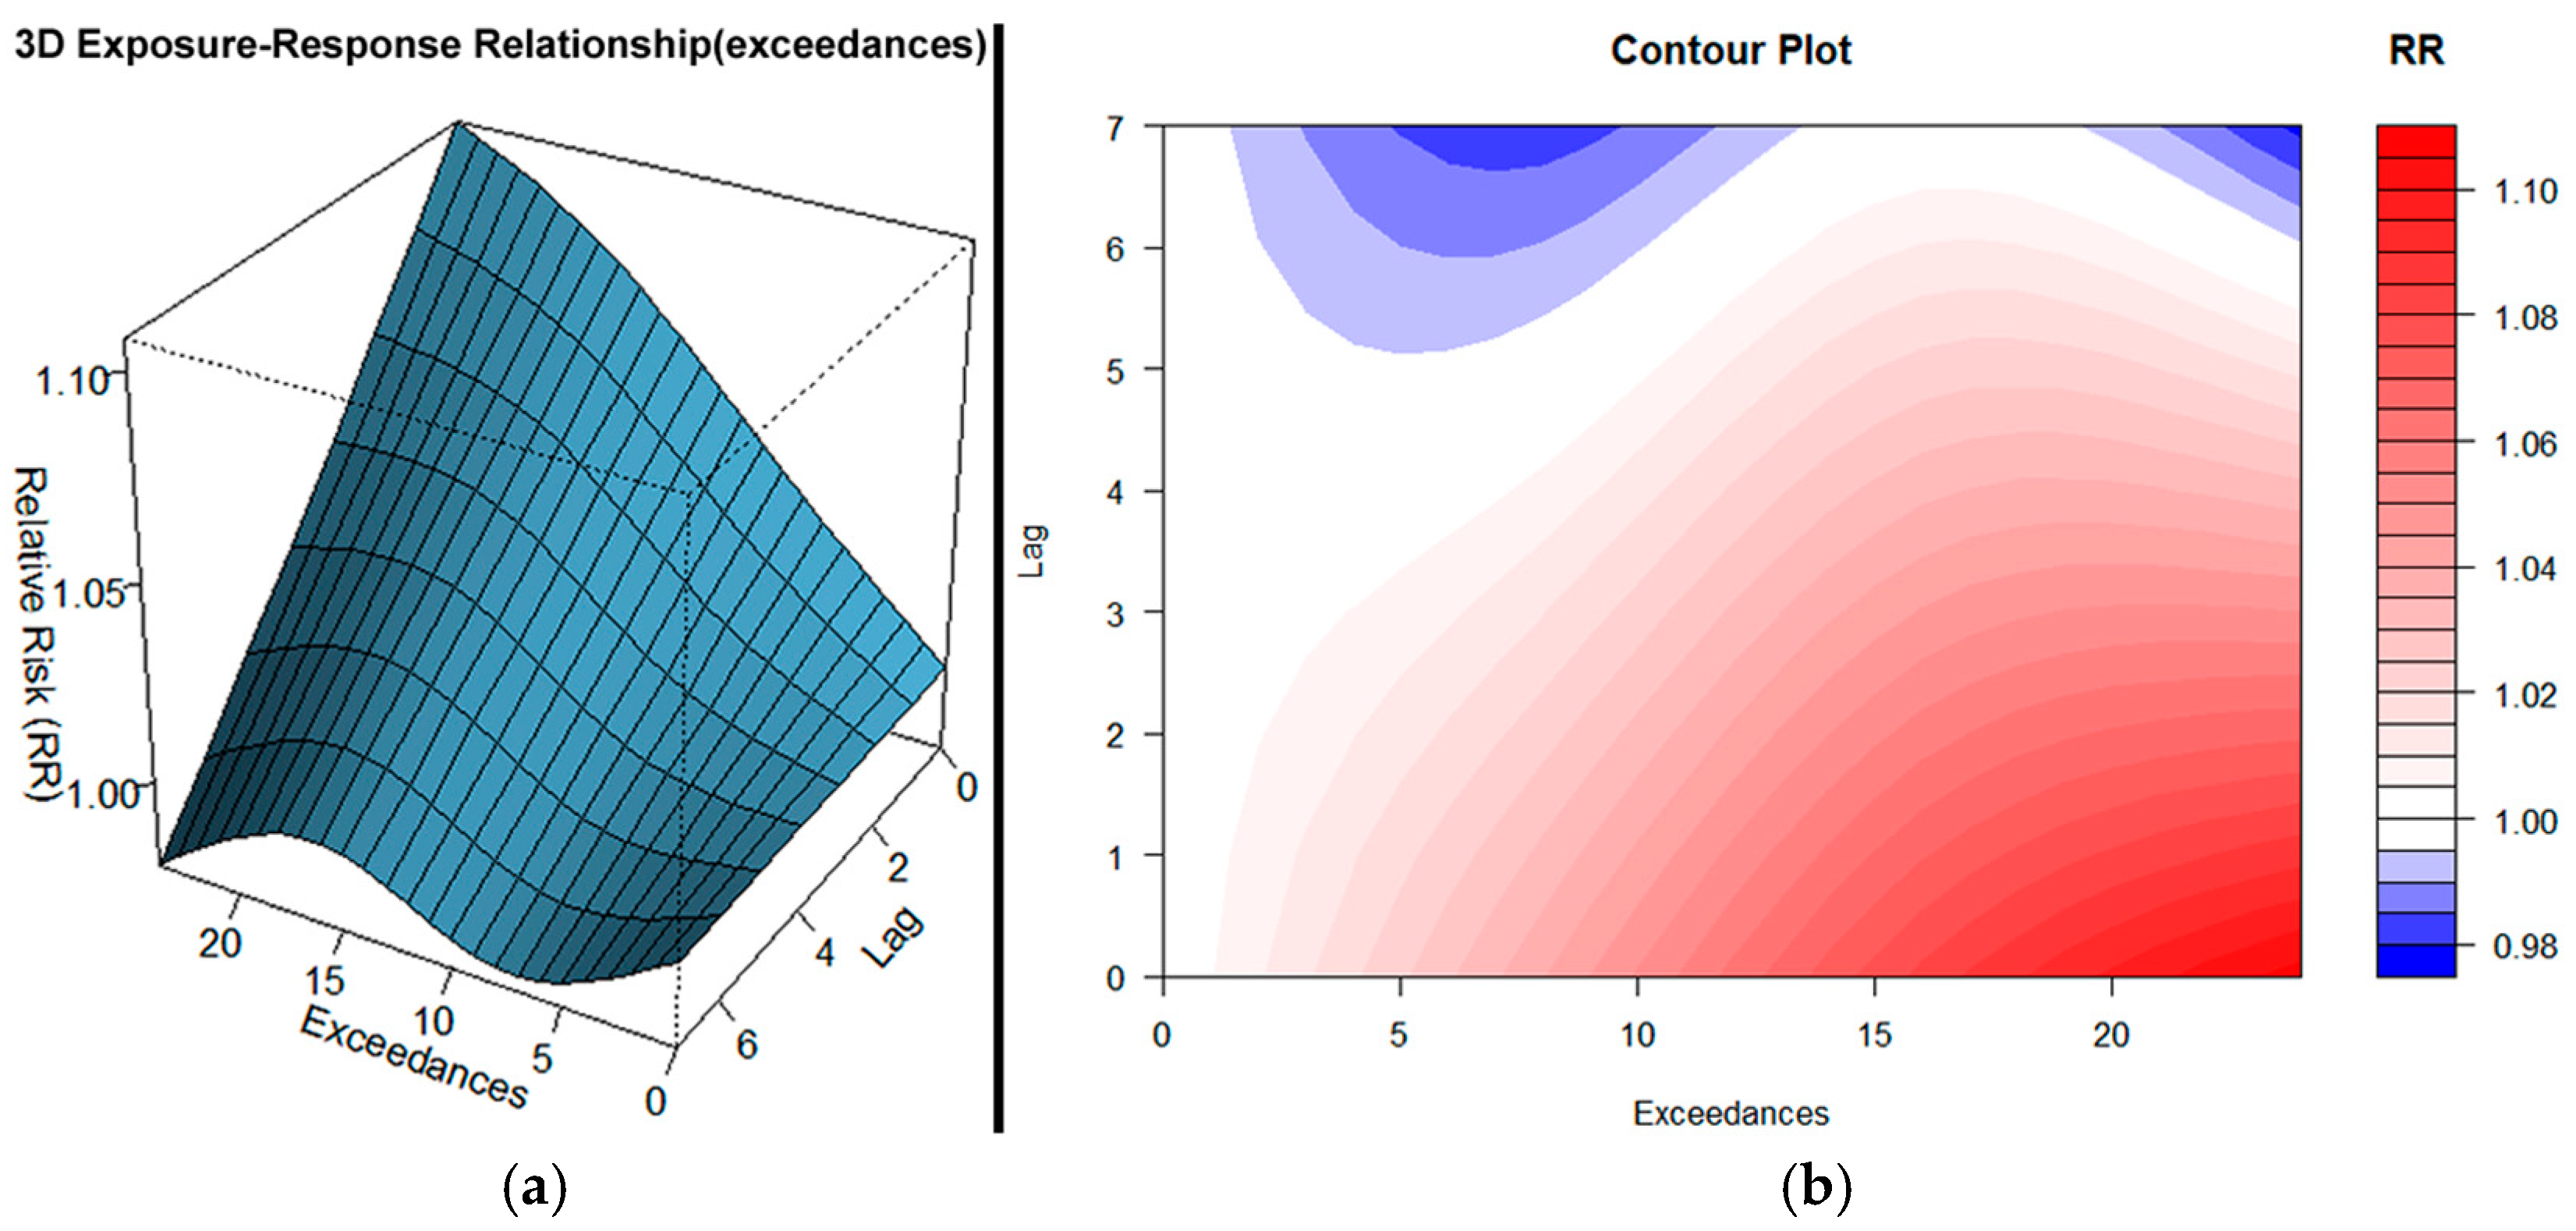
3.1. PM10 Exceedances
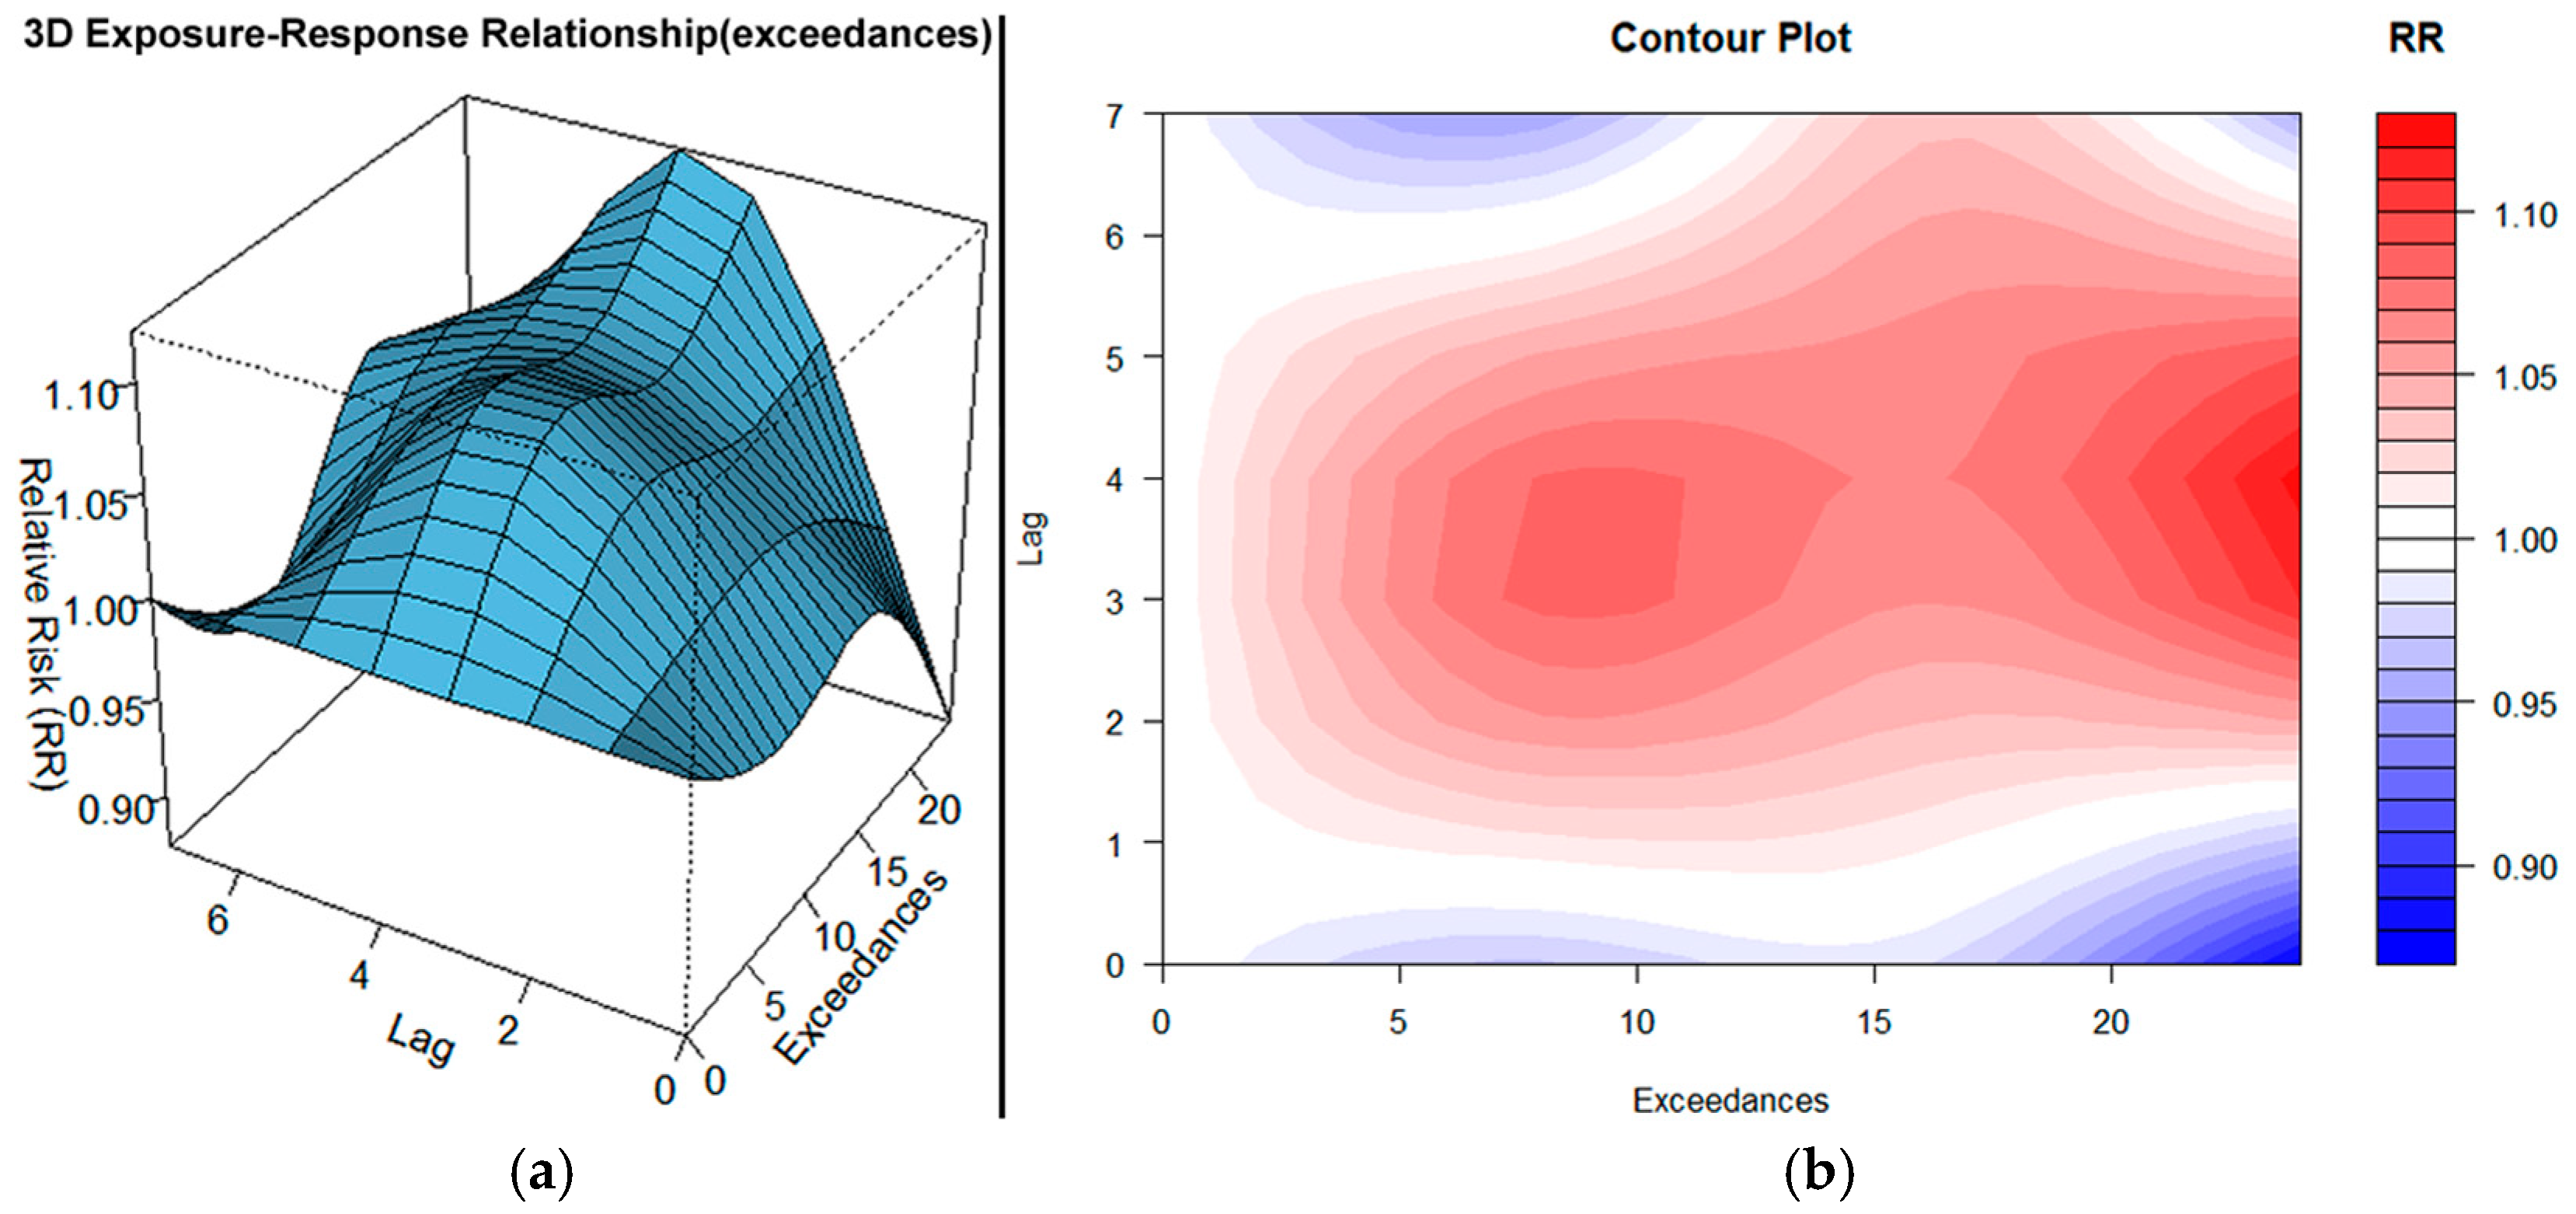
Figure 2 presents the three-dimensional ER surface and its corresponding contour plot for PM10 exceedances. The most prominent feature is a steady and almost linear increase in RR with rising exceedance values, particularly within the early lags (lags 0 to 3). RR begins to exceed 1.05 at approximately 10 exceedances (lag 0) and continues increasing, peaking at 1.11 (95% CI: 0.91–1.34) at lag 0 for 24 exceedances. A similar pattern is evident at lag 1, where RR reaches 1.09 (95% CI: 0.93–1.27) at the highest exposure levels (ELs). This trend persists at lag 2, with RR rising to 1.07 (95% CI: 0.94–1.21) for 24 exceedances, suggesting a sustained acute-phase effect across the first 72 h following exposure. Such early-lag peaks emphasize the immediate and short-term health burden posed by elevated PM10 concentrations, particularly reflecting acute effects due to CVDs and RDs [36,37], especially among older adults [38]. Also, they are consistent with rapid inflammatory responses, particularly in events related to pneumonia, which have shown strongest associations with PM exposure at lag zero (0) in prior studies [39,40]. Interestingly, the timing of peak effects may differ between conditions, with PM10 linked to slightly delayed effects (lag 1) for COPD hospitalizations, as seen in prior multicity studies [39]. Moreover, even relatively low PM10 concentrations, if accompanied by high exceedance counts, were associated with significant health impacts, highlighting the need for stricter protective thresholds under such conditions [38]. What is more, longer pollution duration (over 48 h) has been shown in other studies to worsen CVDs outcomes by depleting the body’s compensatory mechanisms [41], a pattern that resonates with the present study findings where increased hours of exceedances correspond to greater RR.
This pattern is consistent with findings from previous studies in the same region, where a 10.2% increase in daily hospital admissions was reported for every 10 μg/m3 rise in PM10 concentrations [42]. Such results underscore the strong and nearly linear ER relationship observed here, especially at short lags, and affirm the role of particulate pollution as a key contributor to acute health outcomes.
Continuing, a broad plateau zone develops between lags 3 to 5, especially for exceedance levels above 15. Within this region, RR remains steadily elevated, reaching 1.0508 (95% CI: 0.9499–1.1624) at lag 3, 1.0361 (95% CI: 0.9369–1.1458) at lag 4, and 1.0216 (95% CI: 0.9078–1.1497) at lag 5 for 20 exceedances. This persistent risk zone, although more gradual in its slope, suggests a sustained short-term health burden that may extend beyond immediate exposure, potentially due to ongoing systemic inflammation or delayed exacerbation of chronic conditions [43]. The RR curve appears to flatten slightly at the highest levels of exceedance, possibly reflecting a physiological saturation effect, analogous to traditional concentration–response (C-R) analyses where marginal health gains diminish at extreme pollutant levels [38,43]).
The contour plot further emphasizes these findings, revealing a dominant red “hotspot” concentrated at lags 0 to 1 and high exceedance values. Moreover, a prolonged zone of elevated RR is evident even beyond lag 5, with RR remaining above 1 for exceedances > 20, up to lag 6, indicating that the health impact of significant pollution events can persist for nearly a week. While seasonal factors such as cold periods may intensify effects due to higher pollution levels and respiratory infections [38], similar risks have also been reported during warm seasons, particularly for emergencies related to pneumonia [40]. Additionally, biological mechanisms such as oxidative stress and inflammation, induced by PM10’s ability to generate reactive oxygen species in lung tissue, likely underlie the observed increases in HAs [43,44].
This sustained elevation in RR up to lag 6 reflects a prolonged physiological response, which may relate to secondary effects such as latent symptom progression or delayed healthcare access. For example, recent work has demonstrated that people with disabilities experience significantly heightened sensitivity to PM10 exposure, especially among those with brain lesion disorders or visual impairments [45]. These elevated risks are not merely the result of individual health conditions but stem from structural inequalities—limited healthcare access, material deprivation, and persistent social exclusion—that compound physiological vulnerability.
Notably, the plot also reveals a subtle downward transition beyond lag 5 for ELs (<10), where RR gradually returns toward baseline (RR ≈ 1.00), suggesting a diminishing influence of milder pollution events over time.
Overall, the ER surface highlights a strong and immediate association between PM10 exceedances and HA, with the most intense effects occurring within the first three days of exposure, followed by a more moderate but sustained risk zone lasting up to lag 6 for higher pollution levels.

3.2. O3 Exceedances

Figure 3 presents the three-dimensional ER surface and the corresponding contour plot for O3 exceedances. The response surface exhibits an initial decline in relative risk (RR) with increasing exceedance levels, followed by a progressive rise in RR over extended lags and higher exposures.
Although O3 is mainly produced through daytime photochemical processes, recent studies show that nocturnal ozone enhancement can occur in coastal cities due to sea–land breeze dynamics. A recent study reported nighttime O3 levels rising by over 70 µg/m3 within just 10 min as sea breezes transported ozone-rich air inland after sunset [46]. Such mechanisms may explain the elevated nighttime O3 exceedances observed outside typical photochemical hours.
In the early lags (lag 0 and 1), ozone exceedances are associated with a gradual and consistent decline in RR, reaching a minimum at lag 0 for 24 exceedances. This downward trend continues through lag 1, where RR remains below 1 across the full exceedance spectrum, illustrating a suppressive or delayed-onset response during the immediate post-exposure period. These regions of reduced risk are visualized in the contour plot as extended blue areas, indicating lower-than-baseline risk that gradually gives way to delayed effects.
A similar pattern was observed in a previous study conducted in the same area, which examined the association between hospital admissions and pollutant concentration levels. That analysis showed a temporary reduction in risk as air pollution concentrations increased, followed by a later rise [47]. This was explained by the harvesting effect, where vulnerable individuals experience adverse events earlier, leading to a short-term decrease in admissions. Other contributing factors included delayed clinical responses, risk absorption by overlapping stressors, and non-linear ER relationships. These findings support the current results, where hospital admissions decrease despite rising exceedances in the moderate exposure range, before increasing again at higher levels.
Such a lag structure is consistent with the biological plausibility that exposure to O3 initiates systemic effects, such as inflammation and vascular dysfunction [48], which may require time to culminate in clinically apparent cardiovascular events, and is further supported by epidemiological studies reporting delayed increases in respiratory hospital admissions following ozone exposure [49].
From lag 2 onward, the ER surface undergoes a pronounced transition. A steady increase in RR becomes evident across higher exceedance levels. By lag 3, RR climbs to 1.1104 (95% CI: 0.8037–1.5341) for 24 exceedances, initiating a delayed risk trajectory. This upward trend continues, and at lag 4, RR reaches 1.1242 (95% CI: 0.8120–1.5564)—the highest point observed across all lags and exceedances. Importantly, this sustained increase in risk across moderate-to-high exceedances is consistent with evidence suggesting that even relatively low concentrations of ozone can result in adverse health effects if exposure persists. Specifically, consistent with the findings of a recent study in Eastern Europe, even short-term increases in daily 8 h maximum O3 concentrations were associated with a rise in acute myocardial infarction hospitalizations per 10 μg/m3 increase [50], further supporting the concept that longer or more intense ozone exposure periods amplify health risks. Furthermore, studies reported that increased respiratory hospitalizations occurred even at 8 h maximum ozone levels below 100 μg/m3, and the (C-R) relationship did not suggest a clear threshold [51], emphasizing the potential for cumulative impacts even under conditions traditionally considered low-risk.
This is in line with findings from previous work in the same area, where ozone was associated with a 7.2% increase in daily hospital admissions per 10 μg/m3 rise in concentration [43]. Moreover, studies from other regions observed increases in daily mortality ranging from 0.52% to 1.59% for every 10 ppb (19.6 μg/m3) increase in ozone, with reported mean concentrations as low as 50.96 μg/m3 and 79.97 μg/m3 [52,53,54].
The plateau of elevated risk is well-defined between lags 3 and 5, where RR consistently exceeds 1.05 for exceedances above 20. Similarly, in a Texas study on asthma hospitalizations, increased rates were observed one-to-three days after ozone exposure, supporting a delayed effect pattern [55]. In this study for instance, at 24 exceedances, RR is 1.0905 (lag 5; 95% CI: 0.8168–1.4557) and remains elevated through lag 6 (RR = 1.0276) and lag 7 (RR = 0.9545), albeit with some decline. This persistent ridge of risk, stretching across several days, is emphasized in the contour plot as a broad red hotspot extending diagonally from lag 3 to lag 6, underscoring a delayed and cumulative effect of ozone exposure, similar to the previous studies [56]. More specifically, evidence from sepsis-related hospitalizations [57] supports the aforementioned idea, since it was reported that the strongest effects appeared within 4 days, matching the delayed increase in relative risk observed in this study.
Together, the plots suggest that short-term impacts of ozone are not immediate but rather emerge with a lag of 2–3 days, peaking around lag 4. The initial reductions in RR, potentially reflecting adaptive or non-linear physiological responses, give way to a clear and sustained increase in risk—highlighting the importance of considering lagged exposure windows in assessing ozone-related health impacts.

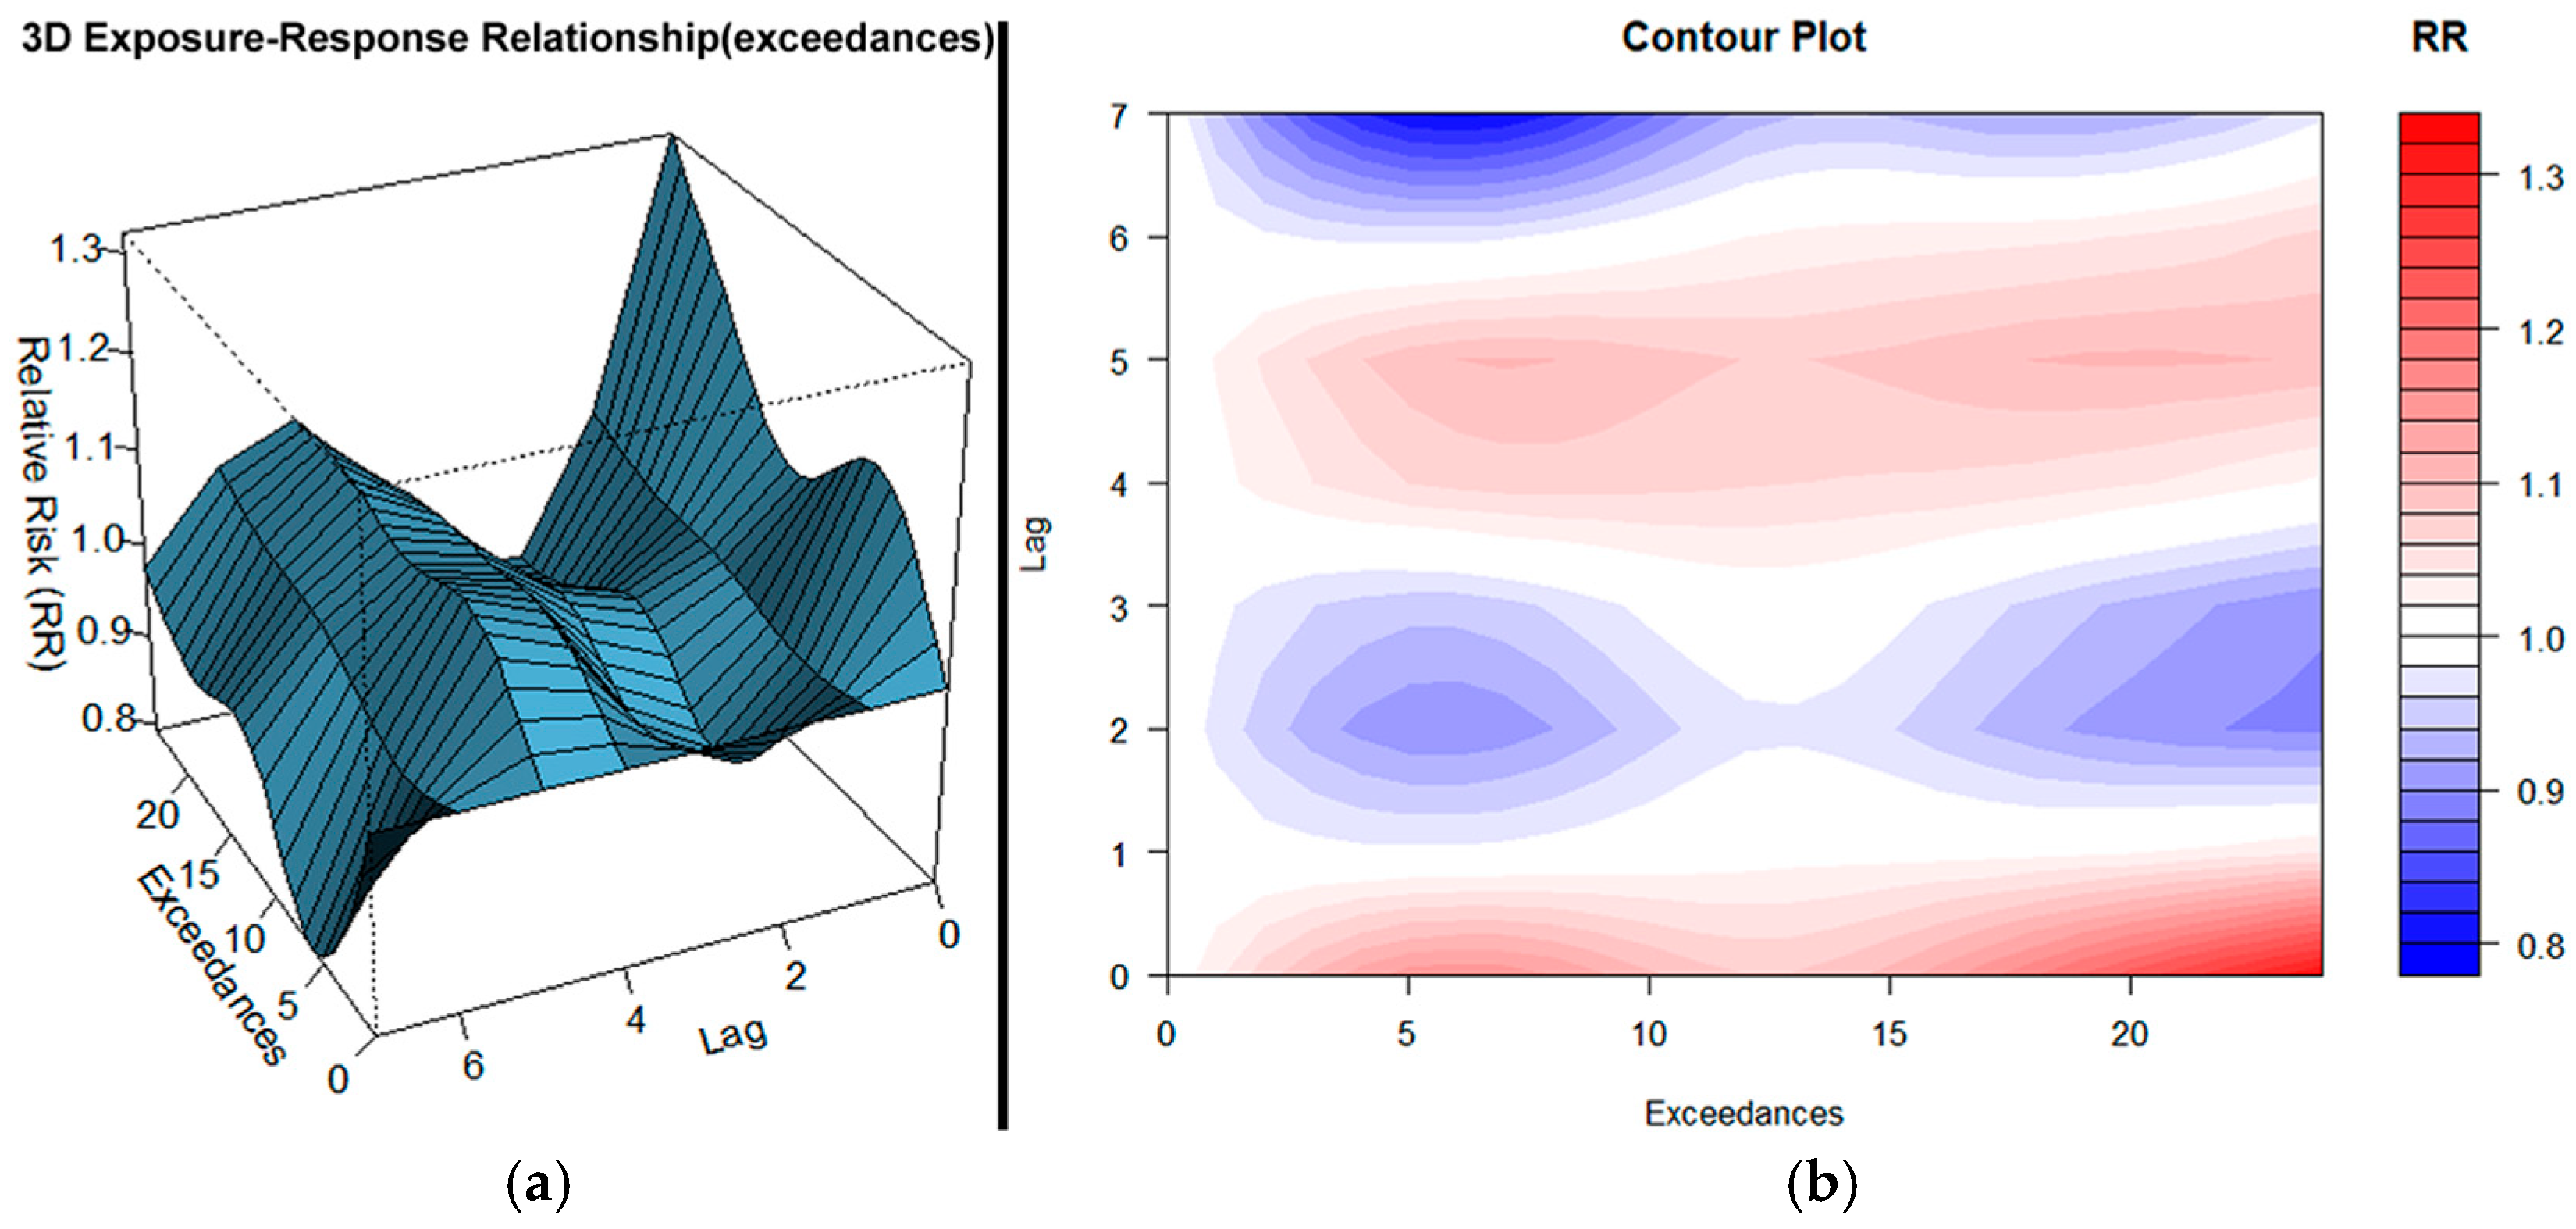
3.3. NO2 Exceedances

Figure 4 presents the three-dimensional ER surface and the corresponding contour plot for nitrogen dioxide (NO2) exceedances. The ER surface displays a distinct two-phase pattern, with a steep and immediate increase in relative risk (RR) at lag 0, followed by a decline during intermediate lags and a gradual resurgence in later days.
At lag 0, RR increases rapidly with exceedance levels, exceeding 1.05 at approximately 2 exceedances. This highlights that even relatively low exceedances can already carry a meaningful health risk, consistent with findings linking low pollution concentrations to increased morbidity [58]. For instance, just a single exceedance at lag 0 yields an RR of 1.036 (95% CI: 0.986–1.089), while only two exceedances already raise the RR to 1.071 (95% CI: 0.972–1.180), underscoring a measurable increase in hospital admissions even under modest pollution conditions. As early as four exceedances, RR surpasses 1.12, highlighting a dose-dependent response that begins at surprisingly low exposure levels. Particularly, vulnerable groups such as individuals with diabetes or elderly people, have been shown to be more susceptible to NO2 exposure, intensifying the health impacts even at modest pollution ELs [59,60].
Subsequently, RR continues climbing, reaching 1.23 (95% CI: 1.00–1.51) for 20 exceedances and peaking at 1.32 (95% CI: 1.08–1.61) for 24 exceedances. This sharp rise reflects acute health effects, consistent with immediate oxidative stress, inflammation, and lung injury following NO2 exposure [61]. Supporting this, research findings showed that respiratory admissions exhibited an acute peak at lag 0, with diminishing effects over the following days [62].
A noticeable dip follows between lags 1 and 3, where RR temporarily declines. At lag 2, RR drops to 0.91 for 20 exceedances, and remains below 1 across much of this lag window. The contour plot reflects this as an extended blue zone, possibly indicating a short delay in physiological response or an initial compensatory effect.
From lag 4 onward, RR begins to climb again, particularly at higher ELs. At lag 4, RR for 20 exceedances reaches 1.04 (95% CI: 0.93–1.18), continuing upward at lag 5 with 1.10 (95% CI: 0.96–1.27). This secondary rise may reflect delayed systemic effects such as endothelial dysfunction, thrombotic events, and autonomic imbalance, which are implicated in cardiovascular disease mechanisms [61]. Similarly, epidemiological studies [62] found that cardiovascular admissions exhibited a smaller secondary peak around lag 4–5, supporting the possibility of delayed cardiovascular impacts. Continuing, the elevated risk zone remains visible through lag 6, where RR is still 1.04 (95% CI: 0.93–1.17) for 20 exceedances.
By lag 7, RR slightly declines again to 0.92 for 20 exceedances, reflecting a return toward baseline and suggesting the health effects of NO2 exposure may subside after the first week. This is supported by the contour plot, where the red zone begins to fade beyond this point.
Overall, the ER surface reveals a clear acute effect at lag 0, followed by a secondary, delayed elevation in RR between lags 4 to 6, particularly at higher exceedances. A meta-analysis [63] found that each 10 μg/m3 increase in NO2 concentration corresponded to a 1.0% increase in hospital admissions, reinforcing that greater ELs lead to proportionally higher health impacts. This trend is consistent with epidemiological findings showing an approximately linear ER relationship between NO2 levels and cardiovascular disease risk [64]. This study results underscore both the immediate and lagged public health burden of NO2 pollution, with significant effects detectable across a full week following exposure.

3.4. Combined PM10, O3, and NO2 Exceedances

Figure 5 displays the three-dimensional exposure–response ER surface and its associated contour plot for cumulative exceedances of PM10, O3, and NO2, capturing their combined influence across lags and ELs. The exposure axis spans from 0 to 72 total exceedances, representing the sum across all three pollutants.
At lag 0, RR initially increases with exposure and reaches a modest local maximum around 20 exceedances, potentially indicating an early response among individuals more vulnerable to air pollution. Research evidence shows that O3 and NO2 synergistically amplify oxidative stress, inflammatory cytokine release, and respiratory epithelial damage, particularly among younger and more vulnerable groups [65], supporting the rapid early risk increase observed at lag 0.
Continuing, this is followed by a dip, with RR briefly returning toward baseline, suggesting transient adaptation or depletion of the most susceptible cases. Beyond 40 exceedances, RR begins to climb more substantially, culminating at 1.18 (95% CI: 0.49–2.80) at the highest ELs. This biphasic shape implies a layered effect: an acute spike among sensitive individuals followed by a broader and more robust risk at higher cumulative exposure.
In lags 1 and 2, RR values remain consistently below 1, with a steady downward trend across all exceedance levels. This continuous suppression likely reflects a post-exposure attenuation period, possibly associated with behavioral or physiological buffering mechanisms, with no signs of rebound even at maximum exposure.
By lag 3, RR begins to show signs of recovery, although still sub-baseline. At lag 4, a definitive upward trajectory emerges. RR gradually surpasses 1 at moderate exceedances and reaches 1.17 (95% CI: 0.67–2.03) by 72 exceedances, highlighting the onset of a delayed risk effect.
The most prominent and sustained escalation appears from lag 5 onward, where RR increases rapidly and persistently across nearly all ELs. At lag 5, the response accelerates notably: RR surpasses 1.45 at 48 exceedances and peaks at 1.49 (95% CI: 0.79–2.78) at the highest EL. This steep slope in the ER surface suggests the unfolding of a delayed and more generalized physiological burden that builds up over several days. Additionally, the oxidative stress resulting from O3 and NO2 exposure may be cumulative, intensifying respiratory impacts beyond those of individual pollutants [66], aligning with the progressive risk amplification at longer lags. Moreover, NO2 acts as a precursor to nitric acid (HNO3), which condenses onto particulate surfaces and elevates nitrate content in PM10, thereby enhancing its cardiovascular toxicity [67]. According to other epidemiological study, this mechanistic pathway confirmed by elevated nitrate levels during high NO2 days, providing chemical evidence for the observed synergy between NO2 and PM10 in aggravating adverse health effects related to cardiac diseases [68].
At lag 6, the risk continues to climb sharply and ultimately reaches the highest observed magnitude across all lags and exposures. RR rises consistently with exposure and peaks at 1.53 (95% CI: 0.91–2.59) at 72 exceedances, with a broad high plateau appearing between 60 and 72 exceedances. Confidence intervals throughout this range remain well above baseline, reinforcing the robustness of this delayed effect. This suggests that day 6 may represent the tipping point in the cumulative burden of multi-pollutant exposure.
By lag 7, RR continues to increase but at a slower rate. It reaches 1.41 (95% CI: 0.59–3.35) at the highest exposure, forming a broad but slightly attenuated plateau when compared to lag 6. The contour plot shows this as a persistent elevated zone, but without the same sharp gradient seen at earlier lags. This could indicate a saturation of response or the beginning of physiological compensation in the population.
Altogether, the ER surface reveals a distinct temporal risk structure: an acute response at lag 0, followed by attenuation through lags 1–2, and then a delayed, rising, and more intense burden between lags 4–6, culminating at lag 6, with elevated but tapering risk persisting through lag 7.
The observed early and delayed RR patterns are consistent with known oxidative injury mechanisms triggered by O3 and NO2 co-exposure (CE). As in other Southern European settings, the highest RR values emerge not from individual pollutant effects but from their oxidative synergy, which contributes most strongly to respiratory and cerebrovascular outcomes [69]. This CE can deplete antioxidant defenses, acidify airway lining fluids, and facilitate deeper penetration of pollutants into vulnerable lung regions [70]. It also produces highly reactive secondary products, including N2O5, NO2+, and HNO3, which sustain oxidative stress, protein nitration, and inflammation over time [70]. These processes are fundamentally more damaging than additive effects alone, explaining the acute and delayed risk patterns—particularly the amplification between lags 4–6. This interpretation is supported by research demonstrating that single-pollutant models often underestimate the true burden posed by complex pollution mixtures [71].
An epidemiological study identified a positive interactive association between PM and O3, revealing that health impacts were significantly higher when both pollutants were elevated simultaneously. Stratified analyses and synergy indices confirmed that their combined effect exceeded the sum of their individual contributions, highlighting a clear synergistic interaction between PM and ozone exposure [72]. This finding aligns with another study on PM and ozone synergy, which also observed a stronger health impact when both pollutants were elevated simultaneously [24]. Notably, that study found the most pronounced effects using moving average exposure windows, a methodological approach that parallels this study’s use of cumulative exceedance sums. Both approaches reflect that sustained or repeated pollutant exposure, rather than isolated daily spikes, are more predictive of adverse respiratory outcomes. Furthermore, the other study reported a prolonged health impact across lags 0–4, which closely mirrors the lag 0–6 window used in this analysis—supporting the conclusion that the health effects of co-pollutant exposure extend beyond the immediate day of exposure.
Biologically, these enhanced risks arise through multiple synergistic mechanisms. Ozone has been shown to amplify PM-induced lung inflammation and oxidative injury [73], while CE impairs immune defenses and disrupts airway microbiota [74], increasing susceptibility to respiratory infections [75]. These synergistic pathways are especially consequential for individuals with existing chronic conditions or age-related immune decline, underscoring the public health relevance of continuous, multi-pollutant exposure events. Additionally, CE to NO2 and O3 not only depletes respiratory antioxidant systems and cleaves essential peptides, but also generates secondary oxidants such as N2O5 and nitric acid [76], which further compound damage. Studies also show that NO2 and O3 together produce highly reactive molecules capable of attacking key structural proteins in the moist environment of the lungs [77].
These findings contribute important evidence to the growing literature on pollutant synergies. As previously discussed, most epidemiological studies have focused on the health impacts of two pollutants in combination. In contrast, the short-term health consequences of simultaneous exposure to all three pollutants have been far less explored. By examining the joint effects of PM10, O3, and NO2 together—using cumulative exceedances and distributed lag models—this study provides a more comprehensive and temporally nuanced understanding of how complex pollution mixtures influence acute health risks. In doing so, it extends prior research by capturing interaction patterns likely overlooked in simpler two-pollutant or single-day exposure designs.

4. Conclusions

This study demonstrates that short-term exceedances of PM10, O3, and NO2 concentrations are associated with increased hospital admissions, each showing distinct and informative lag-response patterns:
PM10 exerts strong immediate and sustained health effects, with the highest risk on the day of exposure (lag 0), and continuing up to a week. Apparently, these findings highlight the acute inflammatory and cardiopulmonary stress caused by particulate matter.
Ozone impacts are delayed and cumulative, with risk beginning mainly at lag 1 and peaking around lag 3–4. This pattern suggests that the health burden from ozone builds progressively over several days of exposure, even when initial levels are modest.
NO2 shows a biphasic response, with the most substantial impact at lag 0 and a secondary rise around lag 4. Notably, even small exceedances of NO2 levels can lead to significant health burdens, indicating its high toxicity and rapid biological effects.
A critical overall finding is that the more frequent the exceedances, the steeper the increases in RR, highlighting the cumulative effect of repeated short-term exposures.
Importantly, even low levels of pollutant concentrations, if exposure lasts continuously for several hours, can significantly increase RR, underlining the health risks of sustained sub-threshold pollution.
When multiple pollutants exceed thresholds simultaneously, their combined effects are more severe than individual pollutants alone. These combined impacts are not only more intense but also more prolonged, often extending beyond the typical lag period of each individual pollutant. This highlights the importance of including pollutant mixtures in health risk assessments and regulatory considerations.
Finally, in such cases of combined exceedances, especially when PM10, O3, and NO2 all surpass the EU AQI “Good” thresholds, nearly half a day of exposure is sufficient to reach the highest observed RR values. These findings underscore the need for integrated pollution control policies that address more than just individual pollutant thresholds. Considering the distinct lag structures and the combined effects observed, regulatory strategies should focus not only on peak concentrations but also on the duration and frequency of exceedances across multiple pollutants. Timely public health warnings, continuous real-time monitoring, and coordinated efforts to reduce emissions on days with high exceedance levels are essential for mitigating acute health impacts. In particular, implementing targeted interventions in urban areas during periods known to pose higher risks, such as heatwaves, traffic congestion, or stagnant atmospheric conditions, may be especially effective.
Looking ahead, future studies could build on these findings to further strengthen the evidence base and refine ER relationships. Although this study offers valuable insight into the short-term health effects of PM10, O3, and NO2, there are still important areas for improvement. One limitation is that hospital admission data were available only for a subset of healthcare facilities in the GAA, which may not capture variation across the full urban landscape. Expanding data sources to include more hospitals and detailed patient information would help improve spatial and clinical resolution. Similarly, the number of available air quality stations limits the ability to estimate exposure at a fine scale. Adding more stations would enhance spatial coverage, but even then, fixed-site monitors will never fully represent all locations. To address this, spatial interpolation methods such as kriging can be applied to estimate pollution levels in areas without direct measurements. This would enable researchers to more precisely link pollutant exposures to specific districts or municipalities. Taken together, these steps would allow for a more detailed analysis of health effects, support more targeted public health policies, and lay the groundwork for personalized RR assessments in future research.

Author Contributions

Conceptualization, A.K., K.-M.F., K.M., V.D.A., and P.T.N.; methodology, A.K., K.-M.F., K.M., V.D.A., and P.T.N.; software, A.K.; validation, A.K., K.-M.F., K.M., V.D.A., and P.T.N.; formal analysis, A.K.; data curation, A.K.; writing—original draft preparation, A.K.; writing—review and editing, A.K., K.-M.F., K.M., V.D.A., and P.T.N.; visualization, A.K.; supervision, K.M., V.D.A., and P.T.N.; project administration, A.K. All authors have read and agreed to the published version of the manuscript.

Funding

This research received no external funding.

Institutional Review Board Statement

Ethical review and approval were waived for this study due to the use of fully anonymized hospital admission data, with no access to personal identifiers or direct involvement of human subjects.

Informed Consent Statement

Informed consent was obtained from all subjects involved in the study.

Data Availability Statement

The data presented in this study are available on request from the corresponding author. The data are not publicly available due to ethical restrictions. Public sharing of these data would compromise privacy and violate institutional and regulatory confidentiality agreements.

Conflicts of Interest

The authors declare no conflicts of interest.

Abbreviations

The following abbreviations are used in this manuscript:
GAAGreater Athens Area
RRRelative Risk
HAHospital Admissions
RDRespiratory Diseases
CVDCardiovascular Diseases
CECo-Exposure
DLNMDistributed Lag Non-linear Model
ERExposure-Response
AICAkaike Information Criterion
BICBayesian Information Criterion
EU AQIEuropean Union Air Quality Index

References

  1. Samet, J.M.; Dominici, F.; Curriero, F.C.; Coursac, I.; Zeger, S.L. Fine particulate air pollution and mortality in 20 U.S. cities, 1987–1994. N. Engl. J. Med. 2000, 343, 1742–1749. [Google Scholar] [CrossRef] [PubMed]
  2. Peters, A.; Dockery, D.W.; Muller, J.E.; Mittleman, M.A. Increased particulate air pollution and the triggering of myocardial infarction. Circulation 2001, 103, 2810–2815. [Google Scholar] [CrossRef] [PubMed]
  3. Morris, R.D. Airborne particulates and hospital admissions for cardiovascular disease: A quantitative review of the evidence. Environ. Health Perspect. 2001, 109, 495–500. [Google Scholar] [PubMed]
  4. Metzger, K.B.; Tolbert, P.E.; Klein, M.; Peel, J.L.; Flanders, W.D.; Todd, K.; Mulholland, J.A.; Ryan, P.B.; Frumkin, H. Ambient air pollution and cardiovascular emergency department visits. Epidemiology 2004, 15, 46–56. [Google Scholar] [CrossRef] [PubMed]
  5. Dominici, F.; Peng, R.D.; Bell, M.L.; Pham, L.; McDermott, A.; Zeger, S.L.; Samet, J.M. Fine particulate air pollution and hospital admission for cardiovascular and respiratory diseases. JAMA 2006, 295, 1127–1134. [Google Scholar] [CrossRef] [PubMed]
  6. Dominici, F.; Peng, R.D.; Barr, C.D.; Bell, M.L. Protecting human health from air pollution: Shifting from a single-pollutant to a multipollutant approach. Epidemiology 2010, 21, 187–194. [Google Scholar] [CrossRef] [PubMed]
  7. Simpson, R.W.; Williams, G.; Petroeschevsky, A.; Morgan, G.; Rutherford, S. Associations between outdoor air pollution and daily mortality in Brisbane, Australia. Arch. Environ. Health 1997, 52, 442–454. [Google Scholar] [CrossRef] [PubMed]
  8. Sunyer, J.; Basagaña, X. Particles, and not gases, are associated with the risk of death in patients with chronic obstructive pulmonary disease. Int. J. Epidemiol. 2001, 30, 1138–1140. [Google Scholar] [CrossRef] [PubMed]
  9. Pönkä, A.; Savela, M.; Virtanen, M. Mortality and air pollution in Helsinki. Arch. Environ. Health 1998, 53, 281–286. [Google Scholar] [CrossRef] [PubMed]
  10. Wong, T.W.; Lau, T.S.; Yu, T.S.; Neller, A.; Wong, S.L.; Tam, W.; Pang, S.W. Air pollution and hospital admissions for respiratory and cardiovascular diseases in Hong Kong. Occup. Environ. Med. 1999, 56, 679–683. [Google Scholar] [CrossRef] [PubMed]
  11. Hong, Y.C.; Lee, J.T.; Kim, H.; Ha, E.H.; Schwartz, J.; Christiani, D.C. Effects of air pollutants on acute stroke mortality. Environ. Health Perspect. 2002, 110, 187–191. [Google Scholar] [CrossRef] [PubMed]
  12. Anderson, H.R.; Atkinson, R.W.; Bremner, S.A.; Carrington, J.; Peacock, J. Quantitative Systematic Review of Short Term Associations Between Ambient Air Pollution (Particulate Matter, Ozone, Nitrogen Dioxide, Sulphur Dioxide And Carbon Monoxide), and Mortality and Morbidity. Department of Health. Available online: http://www.dh.gov.uk/en/Publicationsandstatistics/Publications/PublicationsPolicyAndGuidance/DH_121200 (accessed on 20 April 2025).
  13. Burnett, R.T.; Cakmak, S.; Brook, J.R. The effect of the urban ambient air pollution mix on daily mortality rates in 11 Canadian cities. Can. J. Public Health Rev. Can. Sante Publique 1998, 89, 152–156. [Google Scholar] [CrossRef] [PubMed]
  14. Touloumi, G.; Katsouyanni, K.; Zmirou, D.; Schwartz, J.; Spix, C.; de Leon, A.P.; Tobias, A.; Quennel, P.; Rabczenko, D.; Bacharova, L.; et al. Short-term effects of ambient oxidant exposure on mortality: A combined analysis within the APHEA project. Air Pollution and Health: A European Approach. Am. J. Epidemiol. 1997, 146, 177–185. [Google Scholar] [CrossRef] [PubMed]
  15. Samoli, E.; Aga, E.; Touloumi, G.; Nisiotis, K.; Forsberg, B.; Lefranc, A.; Pekkanen, J.; Wojtyniak, B.; Schindler, C.; Niciu, E.; et al. Short-term effects of nitrogen dioxide on mortality: An analysis within the APHEA project. Eur. Respir. J. 2006, 27, 1129–1138. [Google Scholar] [CrossRef] [PubMed]
  16. Simpson, R.; Williams, G.; Petroeschevsky, A.; Best, T.; Morgan, G.; Denison, L.; Hinwood, A.; Neville, G.; Neller, A. The short-term effects of air pollution on daily mortality in four Australian cities. Aust. N. Z. J. Public Health 2005, 29, 205–212. [Google Scholar] [CrossRef] [PubMed]
  17. Gryparis, A.; Forsberg, B.; Katsouyanni, K.; Analitis, A.; Touloumi, G.; Schwartz, J.; Samoli, E.; Medina, S.; Anderson, H.R.; Niciu, E.M.; et al. Acute effects of ozone on mortality from the “air pollution and health: A European approach” project. Am. J. Respir. Crit. Care Med. 2004, 170, 1080–1087. [Google Scholar] [CrossRef] [PubMed]
  18. HEI Public Health and Air Pollution in Asia Program. Public Health and Air Pollution in Asia (PAPA): Coordinated Studies of Short-Term Exposure to Air Pollution and Daily Mortality in Four Cities; HEI Research Report 154; Health Effects Institute: Boston, MA, USA, 2010. [Google Scholar]
  19. Chardon, B.; Host, S.; Lefranc, A.; Millard, F.; Gremy, I. What exposure indicator should be used to study the short-term respiratory health effect of photochemical air pollution? A case study in the Paris metropolitan area (2000–2003). Environ. Risques Santé 2007, 6, 345–353. [Google Scholar]
  20. Cohen, A.J.; Brauer, M.; Burnett, R.; Anderson, H.R.; Frostad, J.; Estep, K.; Balakrishnan, K.; Brunekreef, B.; Dandona, L.; Dandona, R.; et al. Estimates and 25- year trends of the global burden of disease attributable to ambient air pollution: An analysis of data from the Global Burden of Diseases Study 2015. Lancet 2017, 389, 1907–1918. [Google Scholar] [CrossRef] [PubMed]
  21. Orellano, P.; Reynoso, J.; Quaranta, N.; Bardach, A.; Ciapponi, A. Short-term exposure to particulate matter (PM10 and PM2.5), nitrogen dioxide (NO2), and ozone (O3) and all-cause and cause-specific mortality: Systematic review and meta-analysis. Environ. Int. 2020, 142, 105876. [Google Scholar] [CrossRef] [PubMed]
  22. Cheng, S.; Lu, K.; Liu, W.; Xiao, D. Efficiency and marginal abatement cost of PM2.5 in China: A parametric approach. J. Clean. Prod. 2019, 235, 57–68. [Google Scholar] [CrossRef]
  23. Revich, B.; Shaposhnikov, D. The effects of particulate and ozone pollution on mortality in Moscow, Russia. Air Qual. Atmos. Health 2010, 3, 117–123. [Google Scholar] [CrossRef] [PubMed]
  24. Li, J.; Liang, L.; Lyu, B.; Cai, Y.S.; Zuo, Y.; Su, J.; Tong, Z. Double trouble: The interaction of PM2.5 and O3 on respiratory hospital admissions. Environ. Pollut. 2023, 338, 122665. [Google Scholar] [CrossRef] [PubMed]
  25. Fameli, K.-M.; Assimakopoulos, V.D. The new open Flexible Emission Inventory for Greece and the Greater Athens Area (FEI-GREGAA): Account of pollutant sources and their importance from 2006 to 2012. Atmos. Environ. 2016, 137, 17–37. [Google Scholar] [CrossRef]
  26. Kallos, G.; Kassomenos, P.; Pielke, R.A. Synoptic and mesoscale weather conditions during air pollution episodes in Athens, Greece. Bound.-Layer Meteorol. 1993, 62, 163–184. [Google Scholar] [CrossRef]
  27. Chaziris, A.; Yannis, G. A critical assessment of Athens Traffic Restrictions using multiple data sources. Traportation Res. Procedia 2022, 72, 375–382. [Google Scholar] [CrossRef]
  28. Ministry of Health. Hospital Admissions and Hospital Beds. Available online: https://www.moh.gov.gr/articles/bihealth/stoixeia-noshleytikhs-kinhshs/10431-klines-noshleythentes-hmeres-noshleias-2021 (accessed on 15 March 2024).
  29. Singh, N.; Area, A.; Breitner, S.; Zhang, S.; Agewall, S.; Schikowski, T.; Schneider, A. Heat and Cardiovascular Mortality: An Epidemiological Perspective. Circ. Res. 2024, 134, 1098–1112. [Google Scholar] [CrossRef] [PubMed]
  30. Gasparrini, A. Modeling exposure-lag-response associations with distributed lag non-linear models. Stat. Med. 2014, 33, 881–899. [Google Scholar] [CrossRef] [PubMed]
  31. Gasparrini, A.; Armstrong, B.; Kenward, M.G. Distributed lag non-linear models. Stat. Med. 2010, 29, 2224–2234. [Google Scholar] [CrossRef] [PubMed]
  32. Gasparrini, A.; Armstrong, B.; Kenward, M.G. Reducing and meta-analyzing estimates from distributed lag non-linear models. BMC Med. Res. Methodol. 2013, 13, 1. [Google Scholar] [CrossRef] [PubMed]
  33. Gasparrini, A. Distributed lag linear and non-linear models in R: The package dlnm. J. Stat. Softw. 2011, 43, 1–20. [Google Scholar] [CrossRef] [PubMed]
  34. Zhang, Z.; Hong, Y.; Liu, N. Association of ambient Particulate matter 2.5 with intensive care unit admission due to pneumonia: A distributed lag non-linear model. Sci. Rep. 2017, 7, 8679. [Google Scholar] [CrossRef] [PubMed]
  35. Jia, H.; Xu, J.; Ning, L.; Feng, T.; Cao, P.; Gao, S.; Shang, P.; Yu, X. Ambient air pollution, temperature and hospital admissions due to respiratory diseases in a cold, industrial city. J. Glob. Health 2022, 12, 04085. [Google Scholar] [CrossRef] [PubMed]
  36. Kim, S.Y.; Peel, J.L.; Hannigan, M.P.; Dutton, S.J.; Sheppard, L.; Clark, M.L.; Vedal, S. The temporal lag structure of short-term associations of fine particulate matter chemical constituents and cardiovascular and respiratory hospitalizations. Environ. Health Perspect. 2012, 120, 1094–1099. [Google Scholar] [CrossRef] [PubMed]
  37. Peng, R.D.; Chang, H.H.; Bell, M.L.; McDermott, A.; Zeger, S.L.; Samet, J.M.; Dominici, F. Coarse particulate matter air pollution and hospital admissions for cardiovascular and respiratory diseases among medicare patients. JAMA 2008, 299, 2172–2179. [Google Scholar] [CrossRef] [PubMed]
  38. Peng, W.; Li, H.; Peng, L.; Wang, Y.; Wang, W. Effects of particulate matter on hospital admissions for respiratory diseases: An ecological study based on 12.5 years of time series data in Shanghai. Environ. Health 2022, 21, 12. [Google Scholar] [CrossRef] [PubMed]
  39. Medina-Ramón, M.; Zanobetti, A.; Schwartz, J. The effect of ozone and PM10 on hospital admissions for pneumonia and chronic obstructive pulmonary disease: A national multicity study. Am. J. Epidemiol. 2006, 163, 579–588. [Google Scholar] [CrossRef] [PubMed]
  40. Cheng, F.J.; Lee, K.H.; Lee, C.W.; Hsu, P.C. Association between Particulate Matter Air Pollution and Hospital Emergency Room Visits for Pneumonia with Septicemia: A Retrospective Analysis. Aerosol Air Qual. Res. 2019, 19, 345–354. [Google Scholar] [CrossRef]
  41. Zhang, Y.; Ma, R.; Ban, J.; Lu, F.; Guo, M.; Zhong, Y.; Jiang, N.; Chen, C.; Li, T.; Shi, X. Risk of Cardiovascular Hospital Admission After Exposure to Fine Particulate Pollution. J. Am. Coll. Cardiol. 2021, 78, 1015–1024. [Google Scholar] [CrossRef] [PubMed]
  42. Kassomenos, P.; Papaloukas, C.; Petrakis, M.; Karakitsios, S. Assessment and prediction of short term hospital admissions: The case of Athens, Greece. Atmos. Environ. 2008, 42, 7078–7086. [Google Scholar] [CrossRef]
  43. Gilmour, P.S.; Rahman, I.; Donaldson, K.; MacNee, W. Histone acetylation regulates epithelial IL-8 release mediated by oxidative stress from environmental particles. Am. J. Physiol. Lung Cell. Mol. Physiol. 2003, 284, L533–L540. [Google Scholar] [CrossRef] [PubMed]
  44. Kim, S.; Lee, J.T. Short-term exposure to PM10 and cardiovascular hospitalization in persons with and without disabilities: Invisible population in air pollution epidemiology. Sci. Total Environ. 2022, 848, 157717. [Google Scholar] [CrossRef] [PubMed]
  45. Tamagawa, E.; Bai, N.; Morimoto, K.; Gray, C.; Mui, T.; Yatera, K.; Zhang, X.; Xing, L.; Li, Y.; Laher, I.; et al. Particulate matter exposure induces persistent lung inflammation and endothelial dysfunction. Am. J. Physiol. Lung Cell Mol. Physiol. 2008, 295, L79–L85. [Google Scholar] [CrossRef] [PubMed]
  46. He, C.; Lu, X.; Wang, H.; Wang, H.; Li, Y.; He, G.; He, Y.; Wang, Y.; Zhang, Y.; Liu, Y.; et al. The unexpected high frequency of nocturnal surface ozone enhancement events over China: Characteristics and mechanisms. Atmos. Chem. Phys. 2022, 22, 15243–15261. [Google Scholar] [CrossRef]
  47. Kladakis, A.; Retalis, A.; Giannaros, C.; Vafeiadis, V.; Fameli, K.-M.; Assimakopoulos, V.D.; Moustris, K.; Nastos, P.T. Evaluating the Health Risks of Air Quality and Human Thermal Comfort–Discomfort in Relation to Hospital Admissions in the Greater Athens Area, Greece. Sustainability 2025, 17, 5182. [Google Scholar] [CrossRef]
  48. Mirowsky, J.E.; Carraway, M.S.; Dhingra, R.; Tong, H.; Neas, L.; Diaz-Sanchez, D.; Cascio, W.; Case, M.; Crooks, J.; Hauser, E.R.; et al. Ozone exposure is associated with acute changes in inflammation, fibrinolysis, and endothelial cell function in coronary artery disease patients. Environ. Health 2017, 16, 126. [Google Scholar] [CrossRef] [PubMed]
  49. Yang, Q.; Chen, Y.; Shi, Y.; Burnett, R.T.; McGrail, K.M.; Krewski, D. Association between ozone and respiratory admissions among children and the elderly in Vancouver, Canada. Inhal. Toxicol. 2003, 15, 1297–1308. [Google Scholar] [CrossRef] [PubMed]
  50. Gu, X.; Guo, T.; Si, Y.; Wang, J.; Zhang, W.; Deng, F.; Chen, L.; Wei, C.; Lin, S.; Guo, X.; et al. Association Between Ambient Air Pollution and Daily Hospital Admissions for Depression in 75 Chinese Cities. Am. J. Psychiatry 2020, 177, 735–743. [Google Scholar] [CrossRef] [PubMed]
  51. Petroeschevsky, A.; Simpson, R.W.; Thalib, L.; Rutherford, S. Associations between outdoor air pollution and hospital admissions in Brisbane, Australia. Arch. Environ. Health 2001, 56, 37–52. [Google Scholar] [CrossRef] [PubMed]
  52. Huang, W.H.; Chen, B.Y.; Kim, H.; Honda, Y.; Guo, Y.L. Significant Effects of Exposure to Relatively Low Level Ozone on Daily Mortality in 17 cities from three Eastern Asian Countries. Environ. Res. 2018, 168, 80–84. [Google Scholar] [CrossRef] [PubMed]
  53. Bell, M.L.; McDermott, A.; Zeger, S.L.; Samet, J.M.; Dominici, F. Ozone and short-term mortality in 95 US urban communities, 1987–2000. J. Am. Med. Assoc. 2004, 292, 2372–2378. [Google Scholar] [CrossRef] [PubMed]
  54. Tao, Y.B.; Huang, W.; Huang, X.L.; Zhong, L.J.; Lu, S.E.; Li, Y.; Dai, L.Z.; Zhang, Y.H.; Zhul, T. Estimated acute effects of ambient ozone and nitrogen dioxide on mortality in the Pearl River Delta of Southern China. Environ. Health Perspect. 2012, 120, 393–398. [Google Scholar] [CrossRef] [PubMed]
  55. Goodman, J.E.; Zu, K.; Loftus, C.T.; Tao, G.; Liu, X.; Lange, S. Ambient ozone and asthma hospital admissions in Texas: A time-series analysis. Asthma Res. Pract. 2017, 3, 6. [Google Scholar] [CrossRef] [PubMed]
  56. Wu, H.; Lu, K.; Fu, J. A Time-Series Study for Effects of Ozone on Respiratory Mortality and Cardiovascular Mortality in Nanchang, Jiangxi Province, China. Front. Public Health 2022, 10, 864537. [Google Scholar] [CrossRef] [PubMed]
  57. Wang, Y.; Liu, Z.; Yang, L.; Zhou, J.; Li, J.; Liao, H.L.; Tian, X.J. Sepsis-related hospital admissions and ambient air pollution: A time series analysis in 6 Chinese cities. BMC Public Health 2021, 21, 1182. [Google Scholar] [CrossRef] [PubMed]
  58. Jacobs, J.; Strak, M.; Velders, G.J.M.; Zorn, J.; Hogerwerf, L.; Simões, M.; Mijnen-Visser, S.; Wesseling, J.; Gerlofs-Nijland, M.; Smit, L.; et al. Short-term exposure to ambient air pollution and severe COVID-19: Mortality and hospital admission to COVID-19 in the Netherlands from February to December 2020. Environ. Adv. 2024, 17, 100592. [Google Scholar] [CrossRef]
  59. Fu, Z.; Gong, H.; Hu, X.; Xie, Y.; Rui, D. The Impact of Air Pollutant Exposure on Diabetes Hospital Admissions in a City in Xinjiang. Atmosphere 2025, 16, 244. [Google Scholar] [CrossRef]
  60. Stosic, L.T.; Dragic, N.; Stojanovic, D.; Lazarevic, K.; Bijelovic, S.; Apostolovic, M. Air Pollution and Hospital Admissions for Respiratory Diseases in Nis, Serbia. Pol. J. Environ. Stud. 2021, 30, 4677–4686. [Google Scholar] [CrossRef] [PubMed]
  61. de Bont, J.; Jaganathan, S.; Dahlquist, M.; Persson, Å.; Stafoggia, M.; Ljungman, P. Ambient air pollution and cardiovascular diseases: An umbrella review of systematic reviews and meta-analyses. J. Intern. Med. 2022, 291, 779–800. [Google Scholar] [CrossRef] [PubMed]
  62. Abd Rahim, N.N.; Ahmad Zaki, R.; Yahya, A.; Wan Mahiyuddin, W.R. Acute effects of air pollution on cardiovascular hospital admissions in the port district of Klang, Malaysia: A time-series analysis. Atmos. Environ. 2024, 333, 120629. [Google Scholar] [CrossRef]
  63. Sun, J.; Barnes, A.J.; He, D.; Wang, M.; Wang, J. Systematic Review and Meta-Analysis of the Association between Ambient Nitrogen Dioxide and Respiratory Disease in China. Int. J. Environ. Res. Public Health 2017, 14, 646. [Google Scholar] [CrossRef] [PubMed]
  64. Collart, P.; Dubourg, D.; Levêque, A.; Sierra, N.B.; Coppieters, Y. Short-term effects of nitrogen dioxide on hospital admissions for cardiovascular disease in Wallonia, Belgium. Int. J. Cardiol. 2018, 255, 231–236. [Google Scholar] [CrossRef] [PubMed]
  65. Fu, Y.; Zhang, W.; Li, Y.; Li, H.; Deng, F.; Ma, Q. Association and interaction of O3 and NO2 with emergency room visits for respiratory diseases in Beijing, China: A time-series study. BMC Public Health 2022, 22, 2265. [Google Scholar] [CrossRef] [PubMed]
  66. Petit, P.C.; Fine, D.H.; Vásquez, G.B.; Gamero, L.; Slaughter, M.S.; Dasse, K.A. The Pathophysiology of Nitrogen Dioxide During Inhaled Nitric Oxide Therapy. ASAIO J. 2017, 63, 7–13. [Google Scholar] [CrossRef] [PubMed]
  67. Ostro, B.D.; Feng, W.Y.; Broadwin, R.; Malig, B.J.; Green, R.S.; Lipsett, M.J. The impact of components of fine particulate matter on cardiovascular mortality in susceptible subpopulations. Occup. Environ. Med. 2008, 65, 750–756. [Google Scholar] [CrossRef] [PubMed]
  68. Yu, I.T.; Qiu, H.; Wang, X.; Tian, L.; Tse, L.A. Synergy between particles and nitrogen dioxide on emergency hospital admissions for cardiac diseases in Hong Kong. Int. J. Cardiol. 2013, 168, 2831–2836. [Google Scholar] [CrossRef] [PubMed]
  69. Faustini, A.; Stafoggia, M.; Williams, M.; Davoli, M.; Forastiere, F. The effect of short-term exposure to O3, NO2, and their combined oxidative potential on mortality in Rome. Air Qual. Atmos. Health 2019, 12, 561–571. [Google Scholar] [CrossRef]
  70. O’Neill, C.A.; van der Vliet, A.; Eiserich, J.P.; Last, J.A.; Halliwell, B.; Cross, C.E. Oxidative damage by ozone and nitrogen dioxide: Synergistic toxicity in vivo but no evidence of synergistic oxidative damage in an extracellular fluid. Biochem. Soc. Symp. 1995, 61, 139–152. [Google Scholar] [CrossRef] [PubMed]
  71. Williams, M.L.; Atkinson, R.W.; Anderson, H.R.; Kelly, F.J. Associations between daily mortality in London and combined oxidant capacity, ozone and nitrogen dioxide. Air Qual. Atmos. Health 2014, 7, 407–414. [Google Scholar] [CrossRef] [PubMed]
  72. Liu, C.; Chen, R.; Sera, F.; Vicedo-Cabrera, A.M.; Guo, Y.; Tong, S.; Lavigne, E.; Correa, P.M.; Ortega, N.V.; Achilleos, S.; et al. Interactive effects of ambient fine particulate matter and ozone on daily mortality in 372 cities: Two stage time series analysis. BMJ 2023, 383, e075203. [Google Scholar] [CrossRef] [PubMed]
  73. Kurai, J.; Onuma, K.; Sano, H.; Okada, F.; Watanabe, M. Ozone augments interleukin-8 production induced by ambient particulate matter. Genes Environ. 2018, 40, 14. [Google Scholar] [CrossRef] [PubMed]
  74. Glencross, D.A.; Ho, T.R.; Camina, N.; Hawrylowicz, C.M.; Pfeffer, P.E. Air pollution and its effects on the immune system. Free Radic. Biol. Med. 2020, 151, 56–68. [Google Scholar]
  75. Niu, Y.; Chen, R.; Wang, C.; Wang, W.; Jiang, J.; Wu, W.; Cai, J.; Zhao, Z.; Xu, X.; Kan, H. Ozone exposure leads to changes in airway permeability, microbiota and metabolome: A randomised, double-blind, crossover trial. Eur. Respir. J. 2020, 56, 2000165. [Google Scholar] [CrossRef] [PubMed]
  76. Gamon, L.F.; White, J.M.; Wille, U. Oxidative damage of aromatic dipeptides by the environmental oxidants NO2 and O3. Org. Biomol. Chem. 2014, 12, 8280–8287. [Google Scholar] [CrossRef] [PubMed]
  77. Nathanael, J.G.; Wille, U. Phenylalanine Residues Are Very Rapidly Damaged by Nitrate Radicals (NO3 ⋅) in an Aqueous Environment. Chembiochem A Eur. J. Chem. Biol. 2023, 24, e202200731. [Google Scholar] [CrossRef] [PubMed]
Figure 1. The Greater Athens Area (GAA), situated in Greece (Europe), is divided into seven distinct sectors, each represented by a different color. Red circles (H) denote the hospitals’ locations, while black circles (S) indicate the positions of air pollution monitoring stations.
Atmosphere 16 00888 g001
Figure 2. ER relationship of PM10 exceedances. (a) The 3D plot; (b) the contour plot.
Atmosphere 16 00888 g002
Figure 3. ER relationship of O3 exceedances. (a) The 3D plot; (b) the contour plot.
Atmosphere 16 00888 g003
Figure 4. ER relationship of NO2 exceedances. (a) The 3D plot; (b) the contour plot.
Atmosphere 16 00888 g004
Figure 5. ER relationship of combined PM10, O3, and NO2 exceedances. (a) The 3D plot; (b) the contour plot.
Atmosphere 16 00888 g005
Table 1. Annual frequency of days exceeding EU air quality thresholds for PM10, O3, and NO2 based on the highest yearly values across ten monitoring stations in the Greater Athens Area (2005–2022).
YearPM10O3NO2
200512712414
2006166987
2007186917
20081501435
2009881005
2010701162
2011861080
201242740
201373840
201429460
201594931
201672770
201774891
201862920
201958680
202027380
202159976
202264610
Table 2. Optimal DLNM configuration parameters and fit statistics for each exposure variable.
Variabledf_vardf_lagdf_timeMax_Lag (Days)AICBIC
PM10223715,417.6215,593.81
O3233715,419.9415,612.65
NO2343715,375.6815,606.94
Interaction243715,399.24155,608.47
Disclaimer/Publisher’s Note: The statements, opinions and data contained in all publications are solely those of the individual author(s) and contributor(s) and not of MDPI and/or the editor(s). MDPI and/or the editor(s) disclaim responsibility for any injury to people or property resulting from any ideas, methods, instructions or products referred to in the content.

