
Temporal Evolution of Lightning Properties in the Metropolitan Area of São Paulo (MASP) During the CHUVA-Vale Campaign

 , and
, and 
Abstract
1. Introduction
2. Methodology
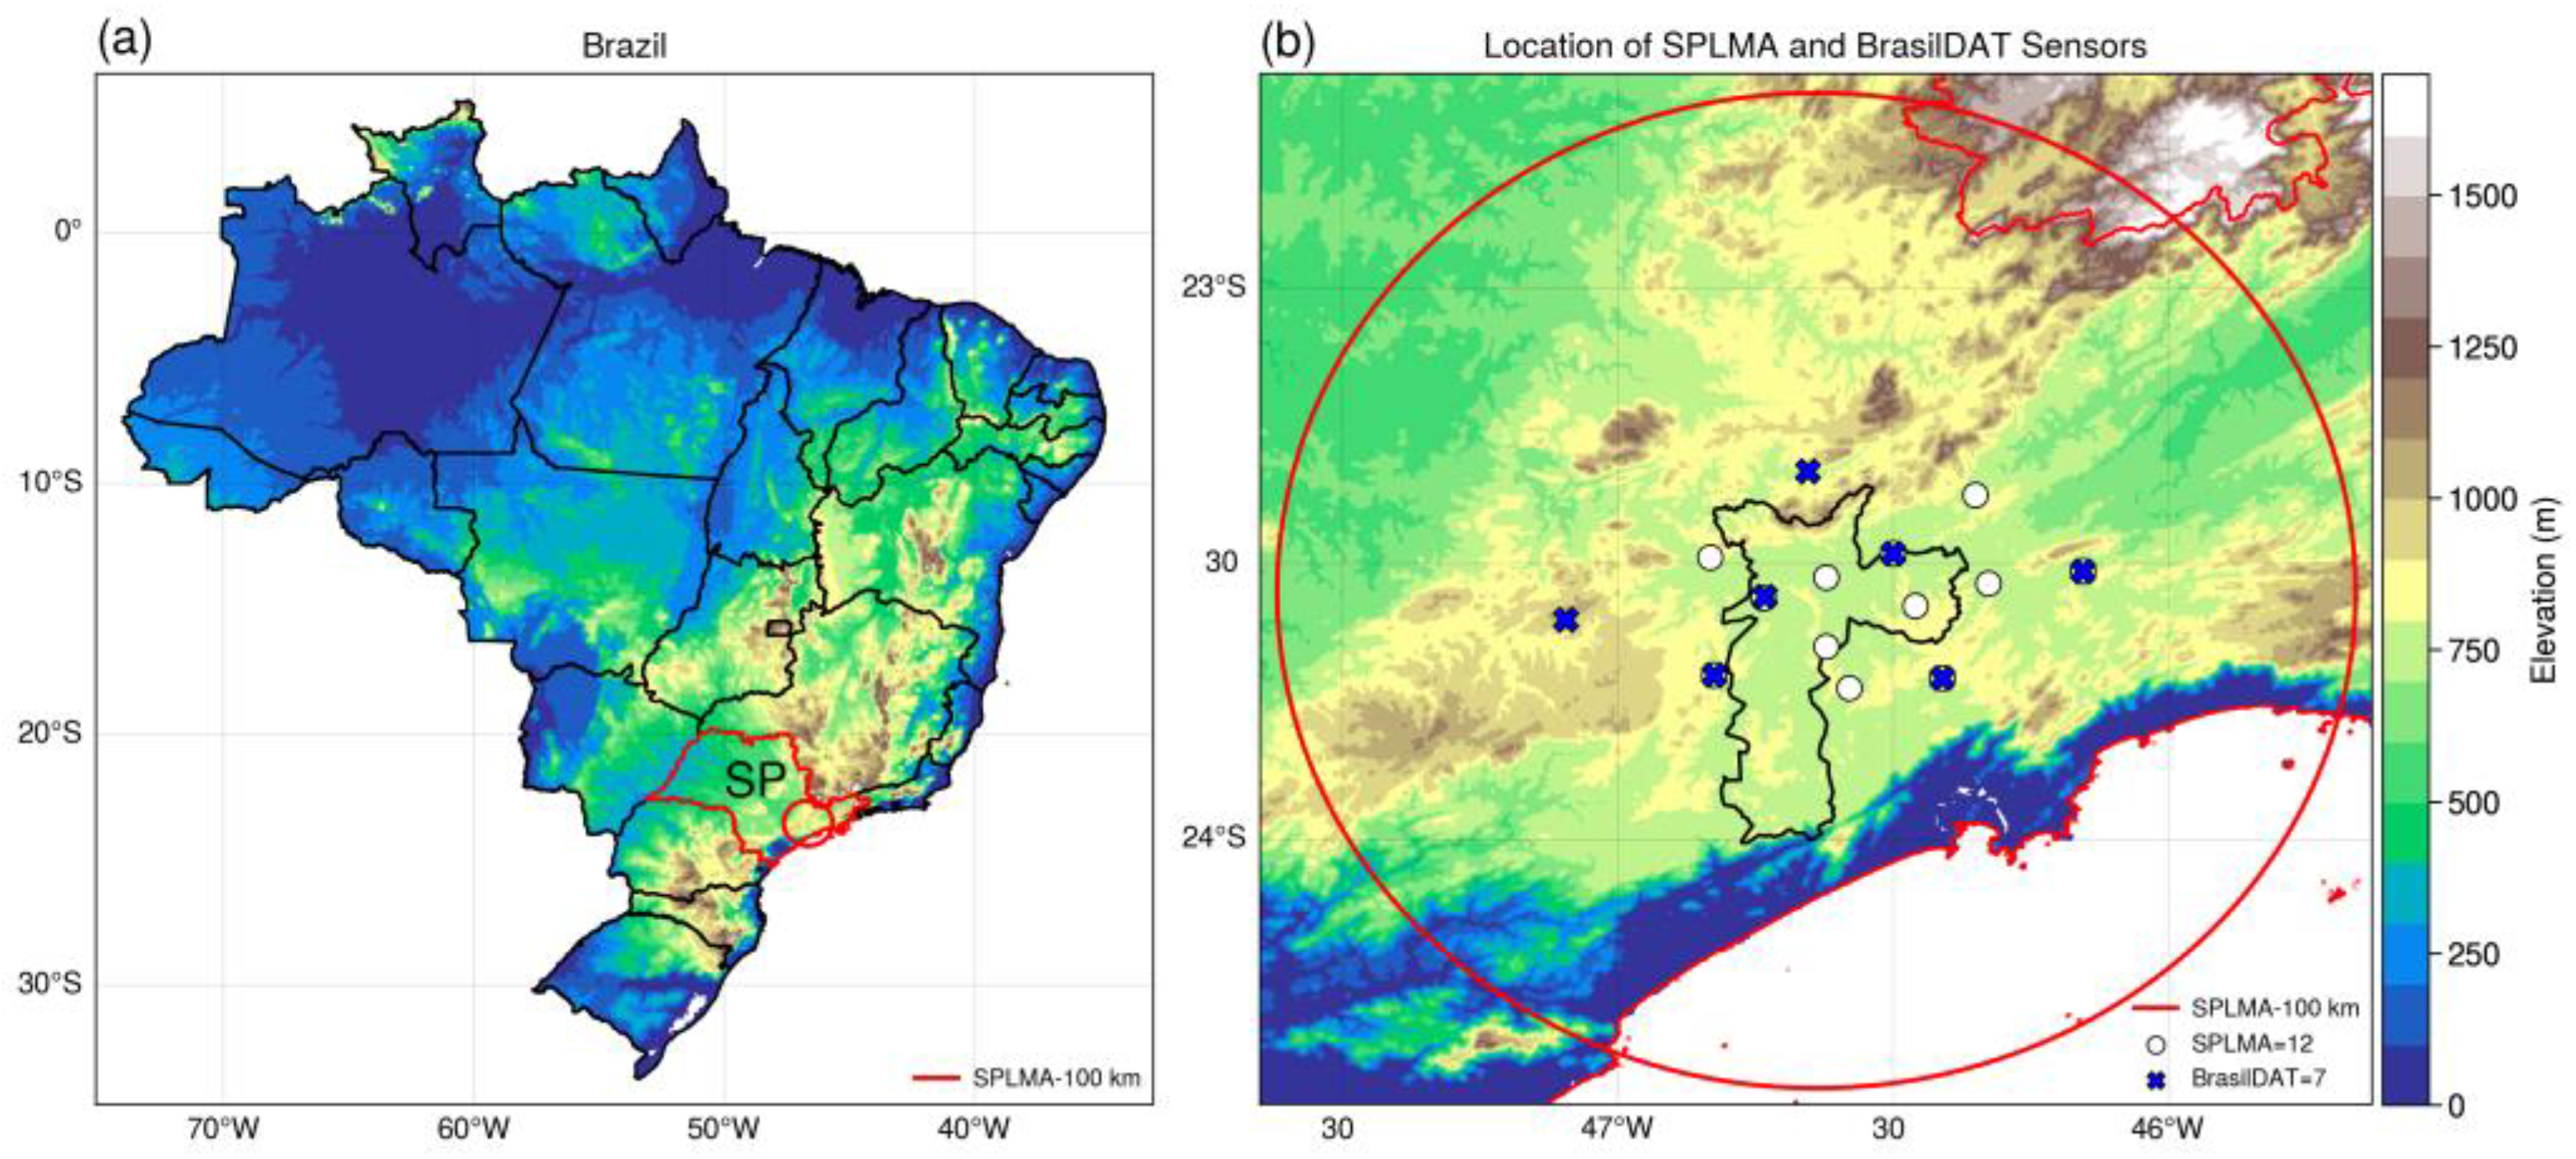
2.1. Study Area
2.2. Data
2.3. Analysis Method
3. Results and Discussion
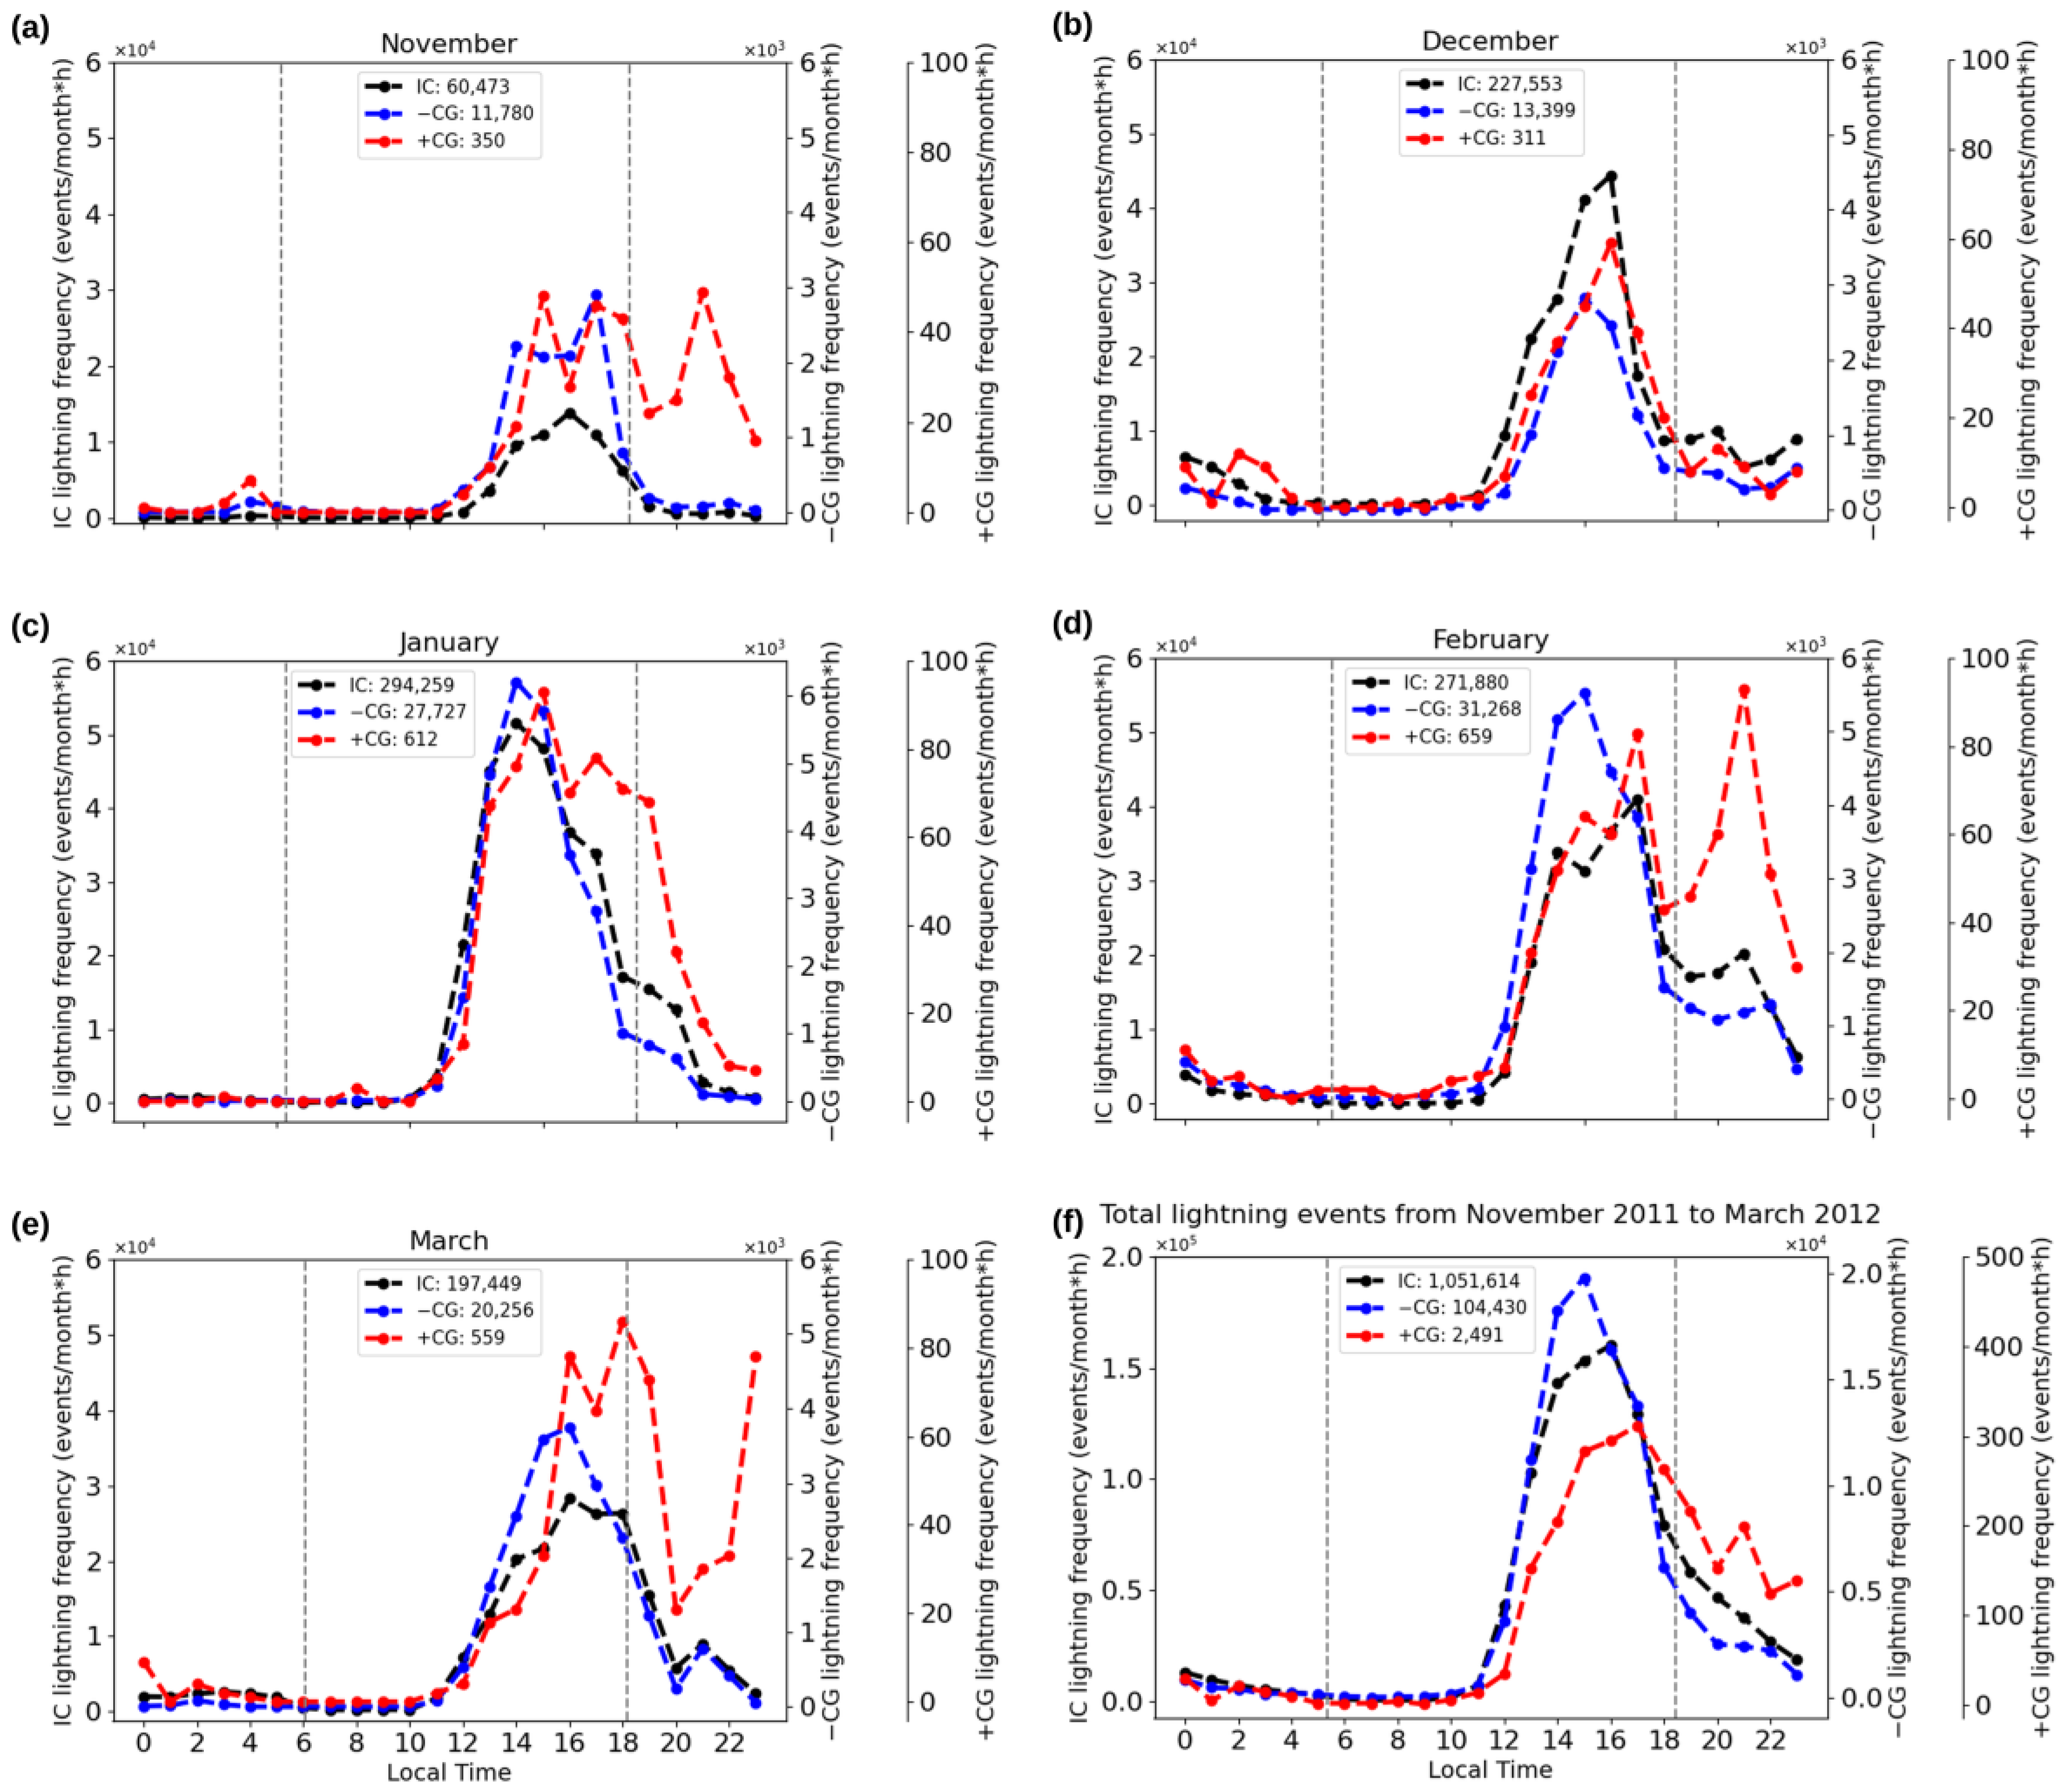
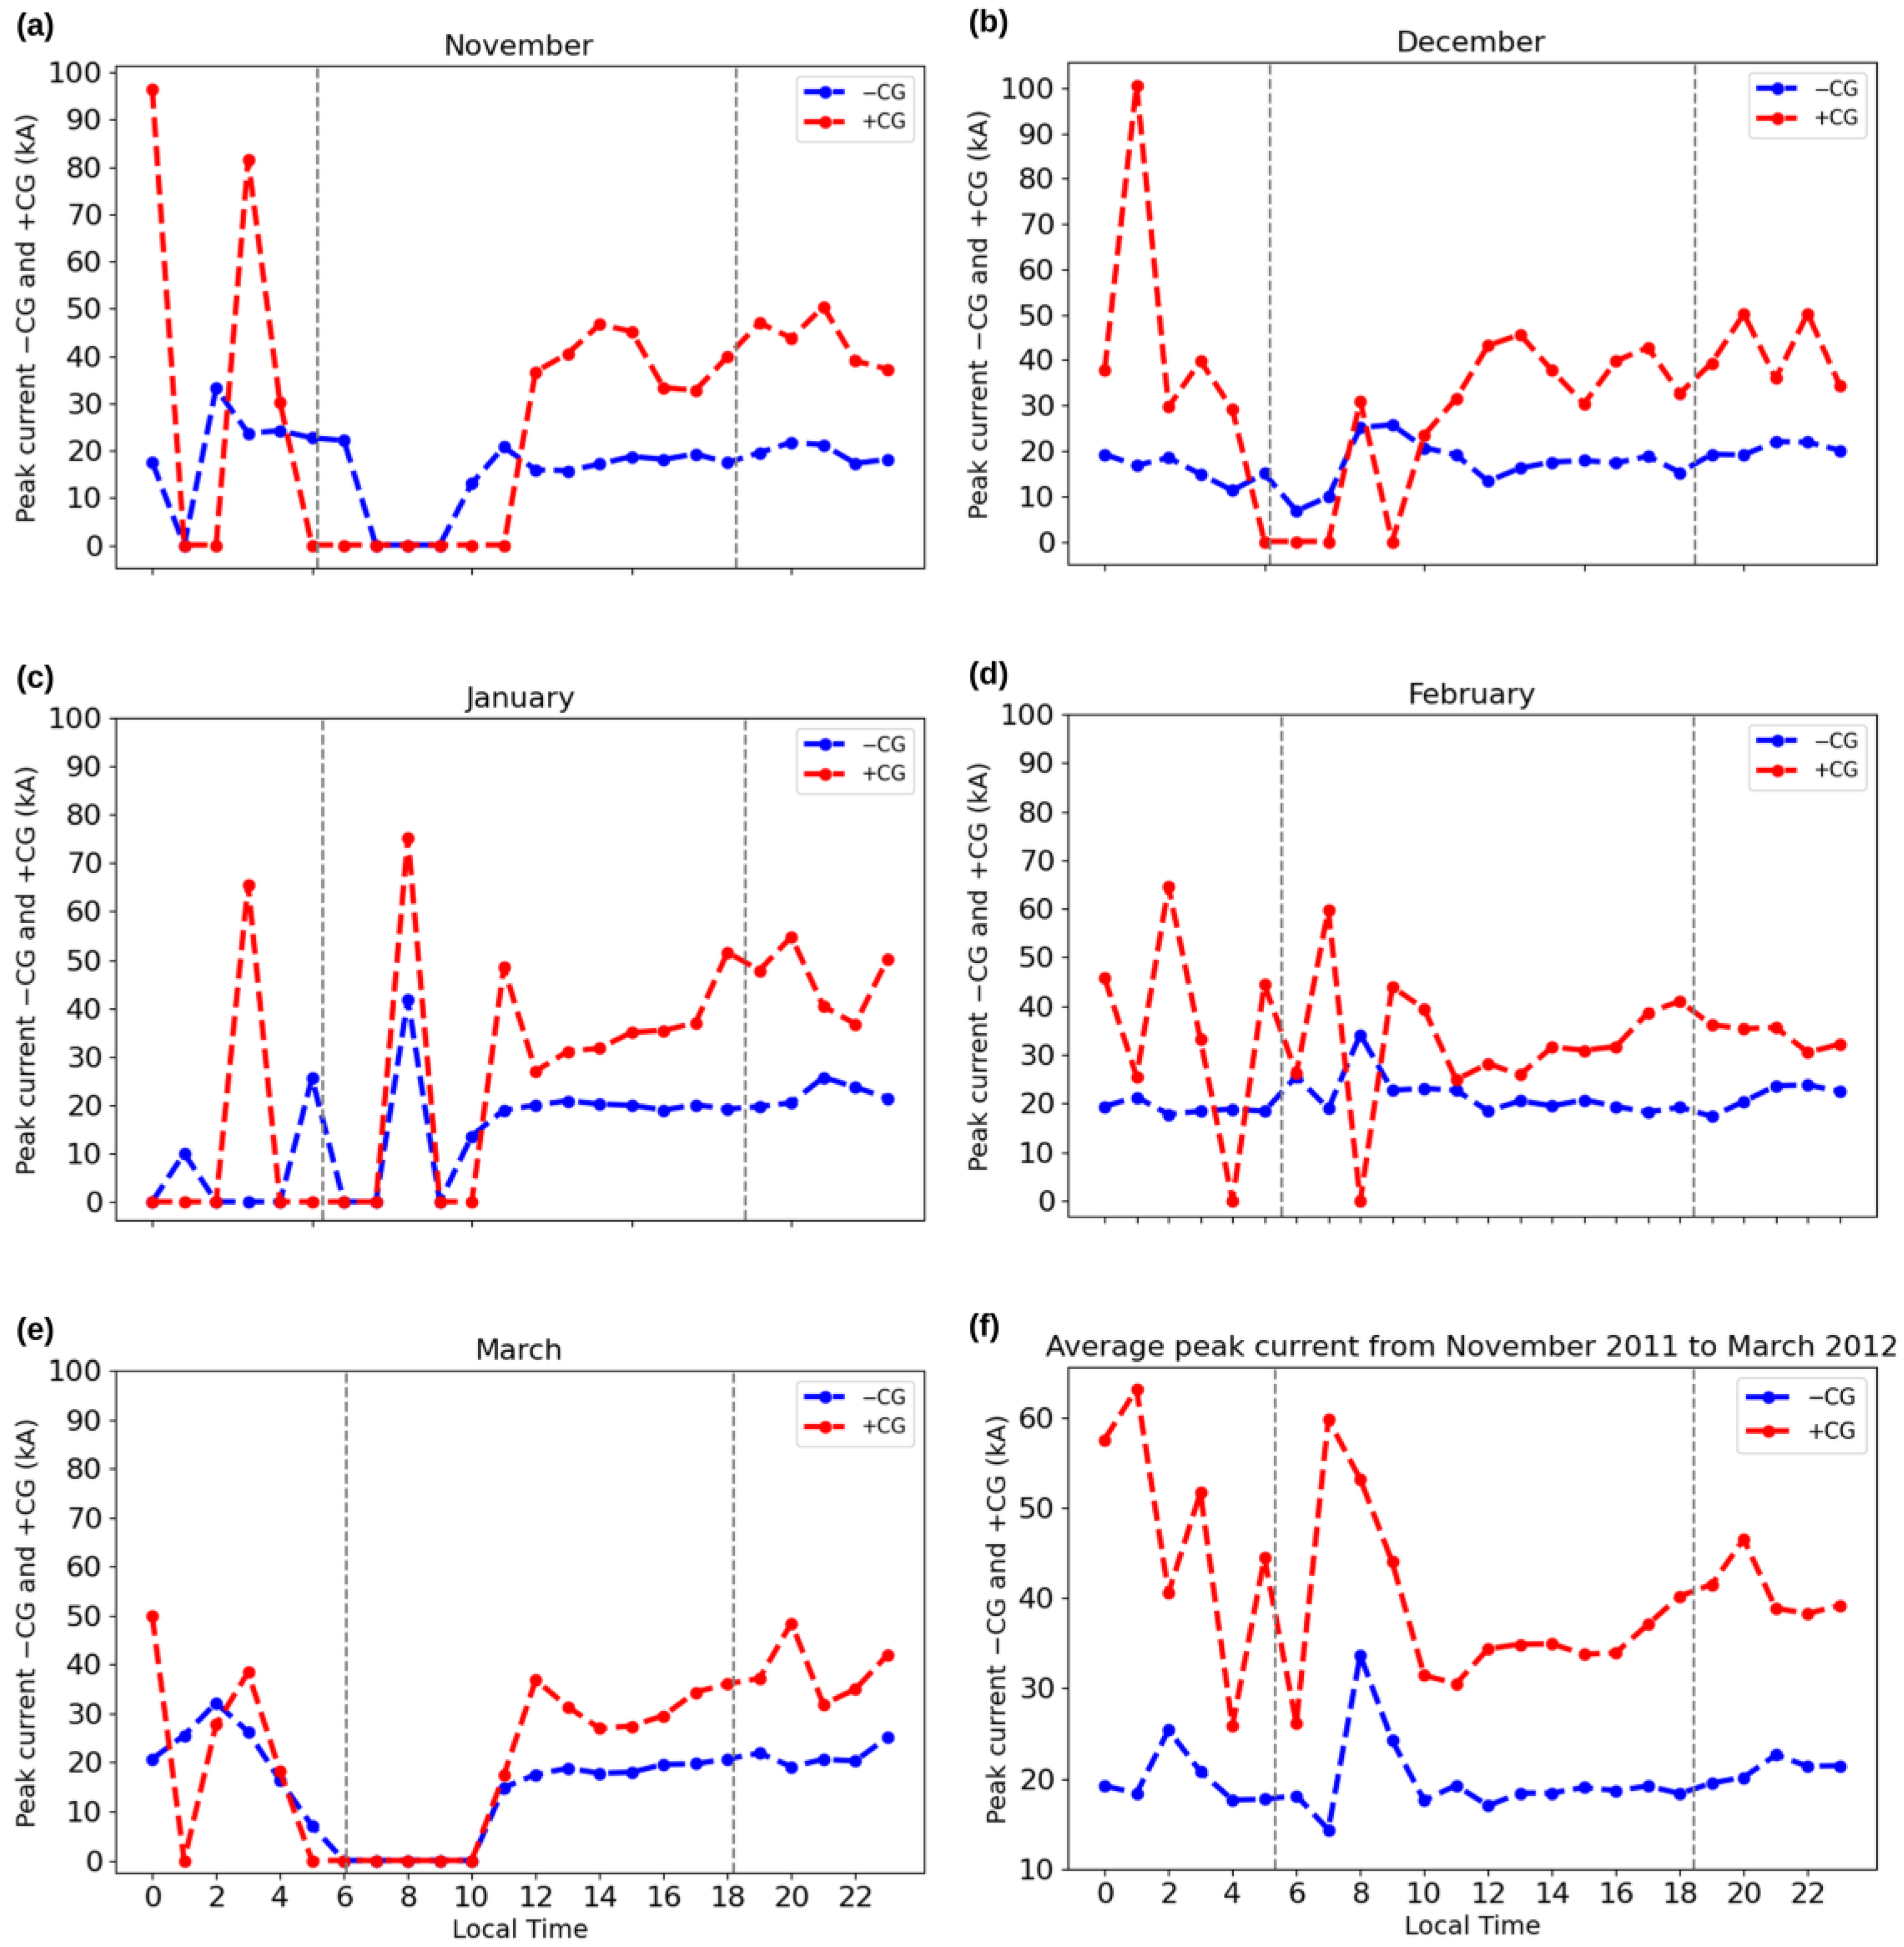
3.1. Diurnal Cycle of Lightning Frequency and Peak Current from BrasilDAT
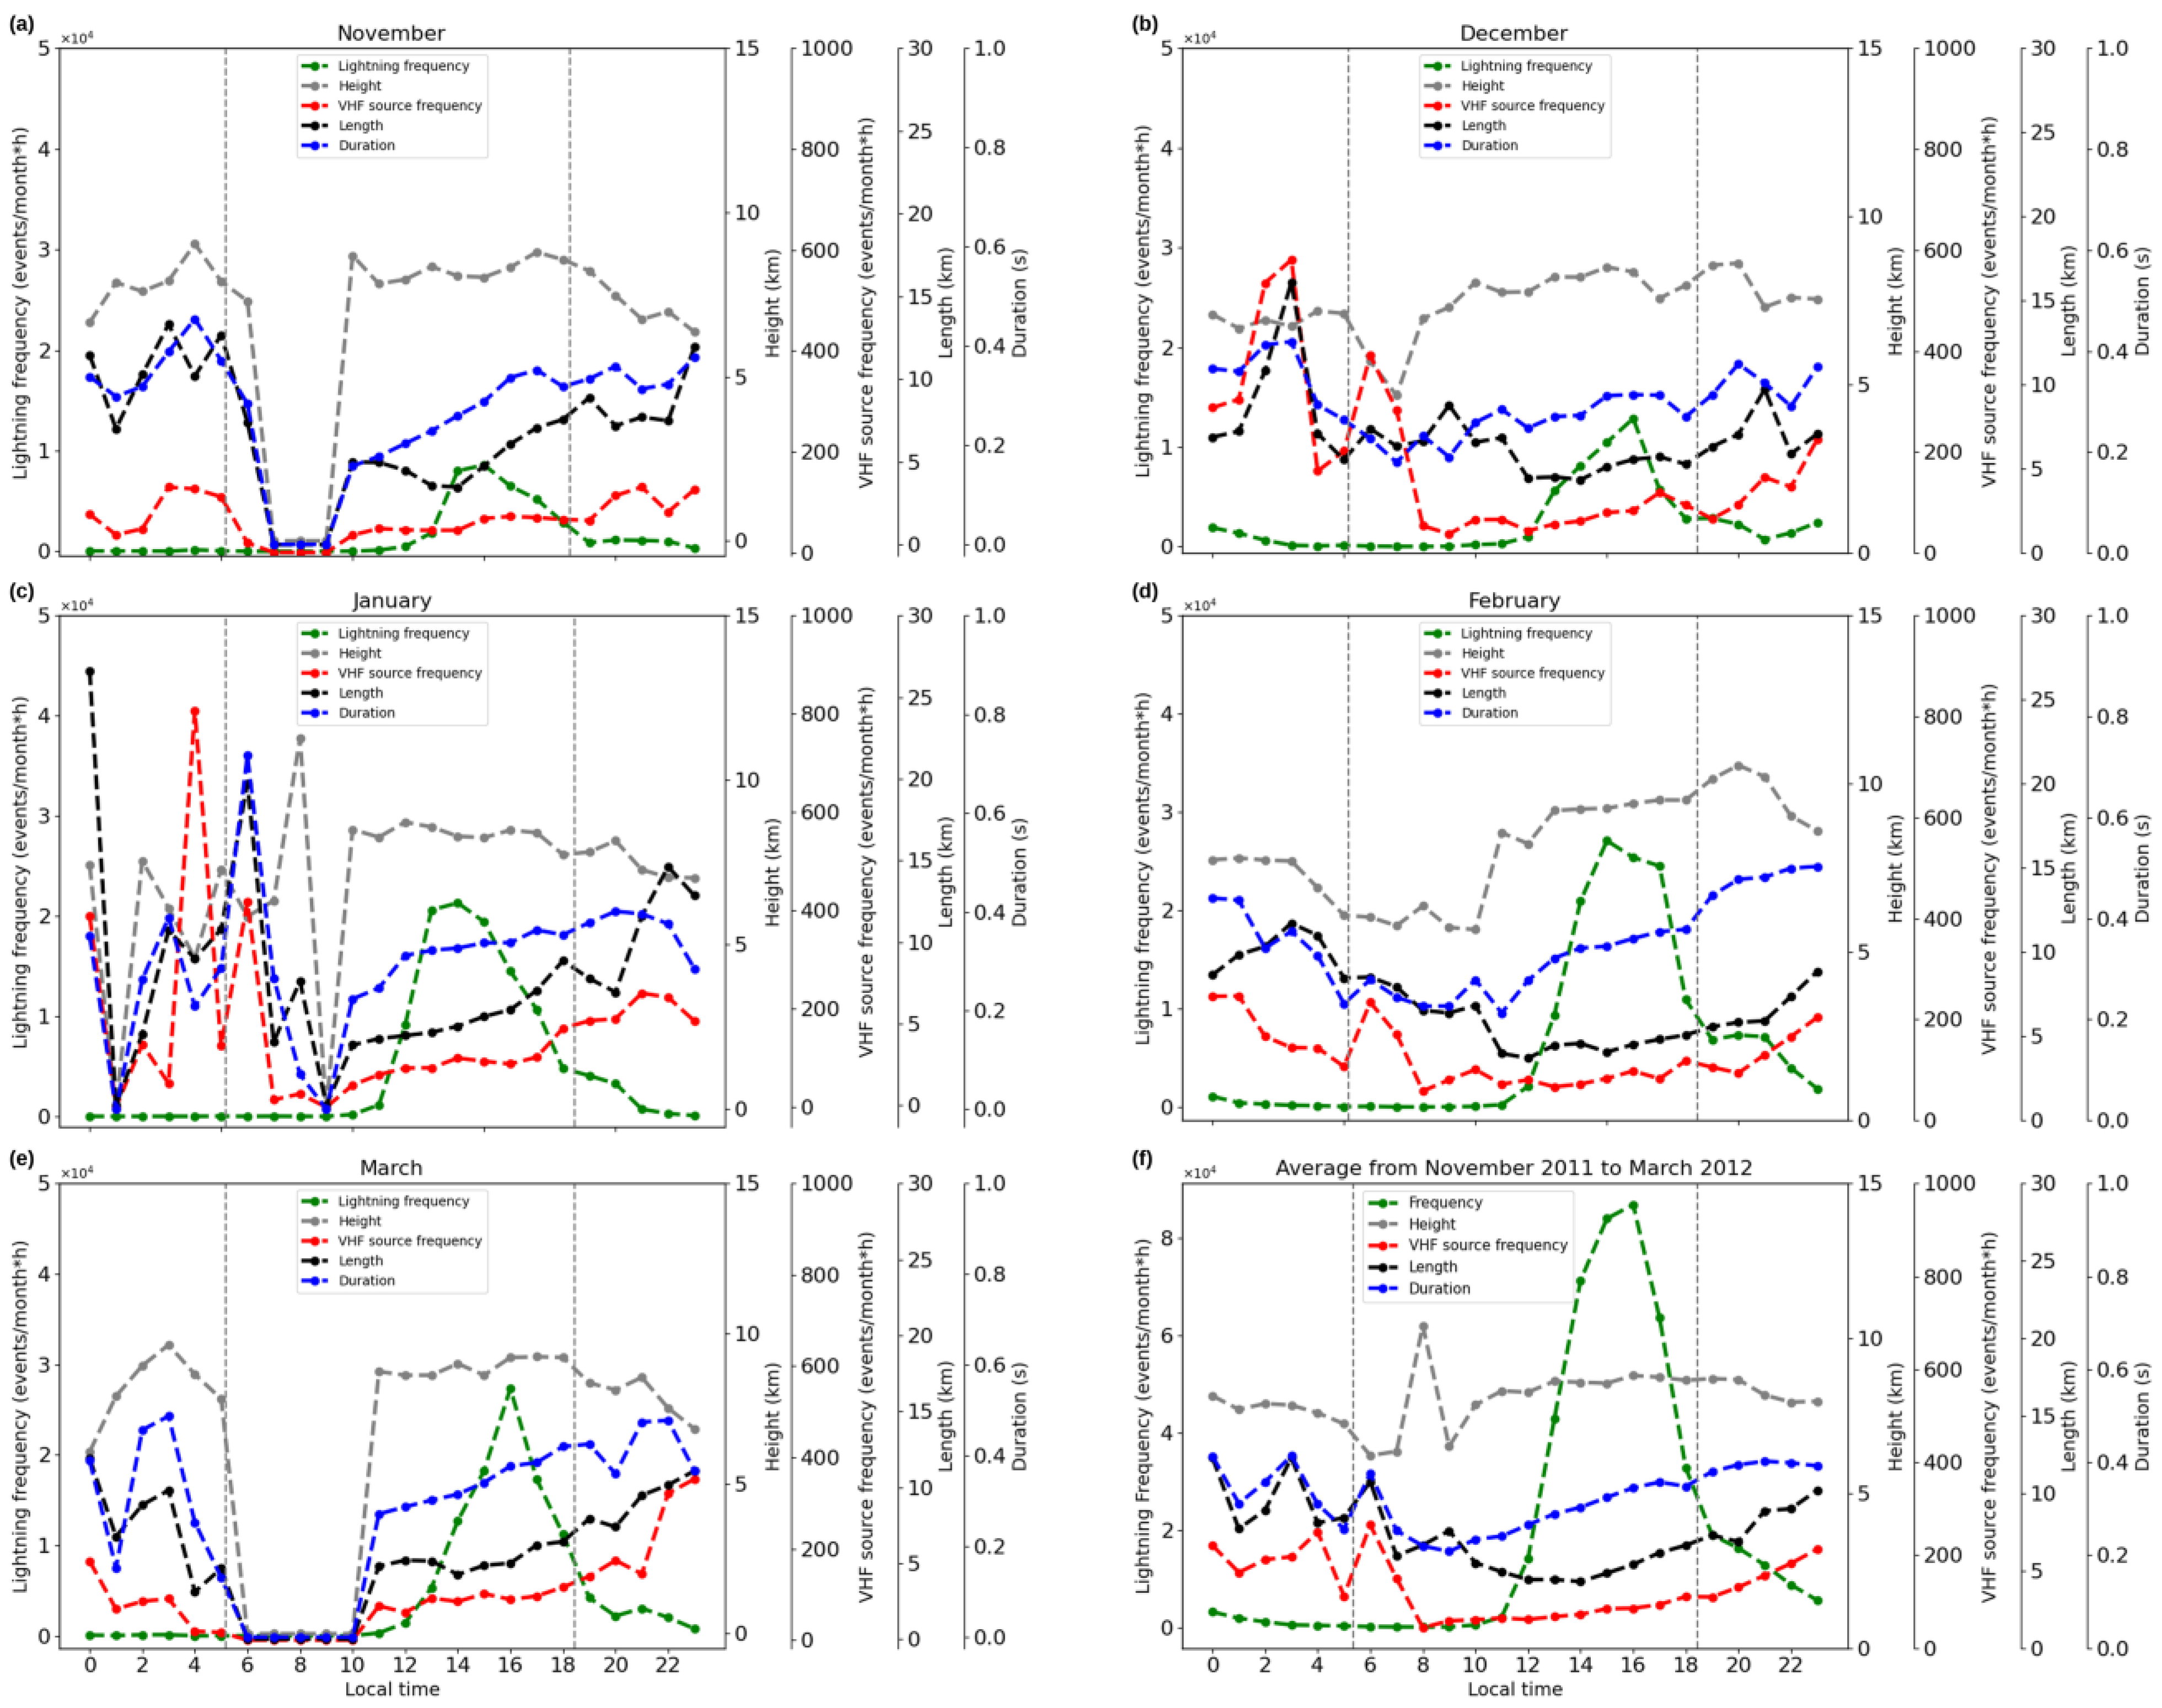
3.2. Diurnal Cycle of Physical Properties of Lightning from SPLMA
4. Conclusions
Author Contributions
Funding
Institutional Review Board Statement
Informed Consent Statement
Data Availability Statement
Conflicts of Interest
References
- Wallace, J.M.; Hobbs, P.V. Atmospheric Science: An Introductory Survey; Elsevier Academic Press: Cambridge, MA, USA, 2006; 483p. [Google Scholar]
- Reynolds, S.E.; Brook, M.; Gourley, M.F. Thunderstorm charge separation. J. Meteorol. 1957, 14, 426–436. [Google Scholar] [CrossRef]
- Ogawa, T. Lightning currents. In Handbook of Atmospheric Electrodynamics; Volland, H., Ed.; CRC Press: Boca Raton, FL, USA, 1995; pp. 93–136. [Google Scholar]
- Pinto, J.R.O.; Pinto, I.R.C.A. Tempestades e Relâmpagos no Brasil; Instituto Nacional de Pesquisas Espaciais (INPE): São José dos Campos, Brazil, 2000; 185p. [Google Scholar]
- Rakov, V.A.; Uman, M.A. Lightning: Physics and Effects; Cambridge University Press: Cambridge, UK, 2003; 850p. [Google Scholar]
- Cecil, D.J.; Buechler, D.E.; Blakeslee, R.J. Gridded lightning climatology from TRMM-LIS and OTD: Dataset description. Atmos. Res. 2014, 135–136, 404–414. [Google Scholar] [CrossRef]
- Albrecht, R.I.; Goodman, S.J.; Buechler, D.E.; Blakeslee, R.J.; Christian, H.J. Where are the lightning hotspots on earth? Bull. Am. Meteorol. Soc. 2016, 97, 2051–2068. [Google Scholar] [CrossRef]
- Oda, P.S.S.; Enoré, D.P.; Mattos, E.V.; Weber, A.G.; Albrecht, R.I. An initial assessment of the distribution of total Flash Rate Density (FRD) in Brazil from GOES-16 Geostationary Lightning Mapper (GLM) observations. Atmos. Res. 2022, 270, 106081. [Google Scholar] [CrossRef]
- Cardoso, I.; Pinto, J.R.O.; Pinto, I.R.C.A.; Holle, R. Lightning casualty demographics in Brazil and their implications for safety rules. Atmos. Res. 2014, 135–136, 374–379. [Google Scholar] [CrossRef]
- Mecikalski, R.M.; Bain, A.L.; Carey, L.D. Radar and lightning observations of deep moist convection across Northern Alabama during DC3: 21 May 2012. Mon. Weather. Rev. 2015, 143, 2774–2794. [Google Scholar] [CrossRef]
- Wallace, J.M. Diurnal variations in precipitation and thunderstorm frequency over the conterminous United States. Mon. Weather Rev. 1975, 103, 406–419. [Google Scholar] [CrossRef]
- Orville, R.E.; Huffines, G.; Gammon, J.N.; Zhang, R.; Ely, B.; Steige, S.; Phillips, S.; Allen, S.; Read, W. Enhancement of cloud-to-ground lightning over Houston, Texas. Geophys. Res. Lett. 2000, 28, 2597–2600. [Google Scholar]
- Nascimento, M.G. Análise dos Impactos Dos Jatos de Baixos Níveis sobre a Bacia do Prata. Master’s Thesis, Instituto Nacional de Pesquisas Espaciais (INPE), São José dos Campos, Brazil, 2008. [Google Scholar]
- Paegle, J.; Zhang, C.D.; Baumhefner, D.P. Atmospheric response to tropical thermal forcing in real-data integrations. Mon. Weather. Rev. 1987, 115, 2975–2995. [Google Scholar]
- Garreaud, R.D.; Wallace, J.M. The diurnal march of convective cloudiness over the Americas. Mon. Weather. Rev. 1997, 125, 3157–3171. [Google Scholar] [CrossRef]
- Williams, E.R.; Heckman, S.J. The local diurnal variation of cloud electrification and the global diurnal variation of negative charge on the Earth. J. Geophys. Res. 1993, 98, 5221–5234. [Google Scholar] [CrossRef]
- Williams, E.; Rothkin, K.; Stevenson, D.; Boccipio, D. Global lightning variations caused by changes in thunderstorm flash rate and by changes in the number of thunderstorms. J. Appl. Meteorol. 2000, 39, 1965–1982. [Google Scholar] [CrossRef]
- Pinto, J.R.O.; Pinto, I.R.C.A.; Diniz, J.H.; Cazetta Filho, B.; Cherchiglia, L.C.L.; Carvalho, B.M. A seven-year study about the negative cloud-to-ground lightning flash characteristics in southeastern Brazil. J. Atmos. Sol. -Terr. Phys. 2003, 65, 739–748. [Google Scholar] [CrossRef]
- Naccarato, K.P. Análise das Características dos Relâmpagos na Região Sudeste do Brasil. Ph.D. Thesis, Instituto Nacional de Pesquisas Espaciais (INPE), São José dos Campos, Brazil, 2005. [Google Scholar]
- Bailey, J.C.; Blakeslee, R.J.; Carey, L.D.; Goodman, S.J.; Rudlosky, S.D.; Albrecht, R.; Morales, C.A.; Anselmo, E.M.; Neves, J.R.; Buechler, D.E. São Paulo Lightning Mapping Array (SP-LMA): Network assessment and analyses for intercomparison studies and GOES-R proxy activities. In Proceedings of the International Conference on Atmospheric Electricity (ICAE 2014), Norman, OK, USA, 15–20 June 2014. [Google Scholar]
- Chronis, T.; Lang, T.; Koshak, W.; Blakeslee, R.; Christian, H.; Maccaul, E.; Bailey, J. Diurnal characteristics of lightning flashes detected over the São Paulo Lightning Mapping Array. J. Geophys. Res. Atmos. 2015, 120, 11799–11808. [Google Scholar] [CrossRef]
- Paulucci, T.B.; França, G.B.; Libonati, R.; Ramos, A.M. Long-term spatial–temporal characterization of cloud-to-ground lightning in the Metropolitan Region of Rio de Janeiro. Pure Appl. Geophys. 2019, 176, 5161–5175. [Google Scholar] [CrossRef]
- Kousky, V. Frontal influences on Northeast Brazil. Mon. Weather. Rev. 1979, 107, 1140–1153. [Google Scholar] [CrossRef]
- Natan, C.O.N.; Machado, G.P.H.; Reboita, M.S.; Reis, A.L. Assessment of the Intertropical Convergence Zone over the Atlantic Ocean through an Algorithm Based on Precipitation. J. Atmos. Sci. Res. 2024, 7, 59–73. [Google Scholar] [CrossRef]
- Cohen, J.; Silva Dias, M.; Nobre, C. Environmental conditions associated with Amazonian squall lines: A case study. Mon. Weather. Rev. 1995, 123, 3163–3174. [Google Scholar] [CrossRef]
- Rison, W.; Thomas, R.J.; Krehbiel, P.R.; Hamlin, T.; Harlin, J. A GPS-based three-dimensional lightning mapping system: Initial observations in central New Mexico. Geophys. Res. Lett. 1999, 26, 3573–3576. [Google Scholar] [CrossRef]
- Machado, L.A.T.; Silva Dias, M.A.F.; Morales, C.; Fisch, G.; Vila, D.; Albrecht, R.; Goodman, S.J.; Calheiros, A.J.P.; Biscaro, T.; Kummerow, C.; et al. The CHUVA Project: How does convection vary across Brazil? Bull. Am. Meteorol. Soc. 2014, 95, 1365–1380. [Google Scholar] [CrossRef]
- Instituto Brasileiro de Geografia e Estatística (IBGE). Available online: https://www.ibge.gov.br (accessed on 15 September 2021).
- Centro de Estudos da Metrópole (CEM). Base de Dados. Contornos Perimétricos e Dados dos 162 Distritos da RMSP, Obtidos Conforme Quadro Político-Administrativo de 01 jan. 2001. Available online: https://centrodametropole.fflch.usp.br/pt-br (accessed on 20 September 2021).
- Zhou, J.; Lau, K.M. Does a monsoon climate exist over South America? J. Clim. 1998, 11, 1020–1040. [Google Scholar] [CrossRef]
- Marengo, J.A.; Liebmann, B.; Grimm, A.M.; Misra, V.; Silva Dias, P.L.; Cavalcanti, I.F.A.; Carvalho, L.M.V.; Berbery, E.H.; Ambrizzi, T.; Vera, C.S.; et al. Recent developments on the South American monsoon system. Int. J. Climatol. 2012, 32, 1–21. [Google Scholar] [CrossRef]
- Ferreira, G.W.S.; Reboita, M.S. A new look into the South America precipitation regimes: Observation and forecast. Atmosphere 2022, 13, 873. [Google Scholar] [CrossRef]
- Reboita, M.S.; Krusche, N.; Ambrizzi, T.; da Rocha, R.P. Entendendo o tempo e o clima na América do Sul. Terrae Didat. 2012, 8, 34–50. [Google Scholar] [CrossRef]
- Naccarato, K.P.; Saraiva, A.C.V.; Saba, M.M.F.; Schumann, D.C. First performance analysis of BrasilDAT total lightning network in southeastern Brazil. In Proceedings of the International Conference on Grounding and Earthing & International Conference on Lightning Physics and Effects, Bonito, Brazil, 25–29 November 2012. [Google Scholar]
- Williams, E.R.; Mattos, E.V.; Machado, L.A.T. Stroke multiplicity and horizontal scale of negative charge regions in thunderclouds. Geophys. Res. Lett. 2016, 43, 5460–5466. [Google Scholar] [CrossRef]
- Mattos, E.V.; Machado, L.A.T.; Williams, E.R.; Goodman, S.J.; Blakeslee, R.J.; Bailey, J.C. Electrification life cycle of incipient thunderstorms. J. Geophys. Res. Atmos. 2017, 122, 4670–4697. [Google Scholar] [CrossRef]
- Bruning, E.C.; Macgorman, D.R. Theory and observations of controls on lightning flash size spectra. J. Atmos. Sci. 2013, 70, 4012–4029. [Google Scholar] [CrossRef]
- Colgate, S.A. Planetary Electrodynamics; Coroniti, S.C., Hughes, J., Eds.; CRC Press: New York, NY, USA, 1969; pp. 144–145. [Google Scholar]

| SPLMA Network | |
|---|---|
| Physical Properties | Definition [Unit] |
| VHF source frequency | Number of VHF sources per hour [events/month.hour] |
| Flash frequency | Number of flashes per hour [events/month.hour] |
| Flash duration | Time difference between the occurrence of the last and the first source of the flash [s] |
| Flash height | Mean height of VHF sources of flash [km] |
| Flash length | Square root of the polygon area calculated with the polygon that connects the outermost VHF sources (convex hull) [km] |
| BrasilDAT Network | |
| Physical Properties | Definition [Unit] |
| Intracloud lightning frequency | Number of lightning events per hour [events/month.hour] |
| Negative cloud-to-ground lightning frequency | Number of lightning events per hour [events/month.hour] |
| Positive cloud-to-ground lightning frequency | Number of lightning events per hour [events/month.hour] |
| Peak current of negative cloud-to-ground lightning | Lightning intensity [kA] |
| Peak current of positive cloud-to-ground lightning | Lightning intensity [kA] |
| November | % | December | % | January | % | February | % | March | % | Total | |
|---|---|---|---|---|---|---|---|---|---|---|---|
| BrasilDAT | 72,603 | 6 | 241,263 | 21 | 322,598 | 28 | 303,807 | 26 | 218,264 | 19 | 1,158,535 |
| SPLMA | 38,412 | 8 | 61,081 | 13 | 110,382 | 24 | 150,566 | 32 | 106,719 | 23 | 467,160 |
Disclaimer/Publisher’s Note: The statements, opinions and data contained in all publications are solely those of the individual author(s) and contributor(s) and not of MDPI and/or the editor(s). MDPI and/or the editor(s) disclaim responsibility for any injury to people or property resulting from any ideas, methods, instructions or products referred to in the content. |
© 2025 by the authors. Licensee MDPI, Basel, Switzerland. This article is an open access article distributed under the terms and conditions of the Creative Commons Attribution (CC BY) license (https://creativecommons.org/licenses/by/4.0/).
Share and Cite
Pereira, R.G.; Mattos, E.V.; Biscaro, T.S.; Reboita, M.S. Temporal Evolution of Lightning Properties in the Metropolitan Area of São Paulo (MASP) During the CHUVA-Vale Campaign. Atmosphere 2025, 16, 426. https://doi.org/10.3390/atmos16040426
Pereira RG, Mattos EV, Biscaro TS, Reboita MS. Temporal Evolution of Lightning Properties in the Metropolitan Area of São Paulo (MASP) During the CHUVA-Vale Campaign. Atmosphere. 2025; 16(4):426. https://doi.org/10.3390/atmos16040426
Chicago/Turabian StylePereira, Raquel Gonçalves, Enrique Vieira Mattos, Thiago Souza Biscaro, and Michelle Simões Reboita. 2025. "Temporal Evolution of Lightning Properties in the Metropolitan Area of São Paulo (MASP) During the CHUVA-Vale Campaign" Atmosphere 16, no. 4: 426. https://doi.org/10.3390/atmos16040426
APA StylePereira, R. G., Mattos, E. V., Biscaro, T. S., & Reboita, M. S. (2025). Temporal Evolution of Lightning Properties in the Metropolitan Area of São Paulo (MASP) During the CHUVA-Vale Campaign. Atmosphere, 16(4), 426. https://doi.org/10.3390/atmos16040426