Article

Changes in the Distribution of Precipitation with the Potential to Cause Extreme Events in the State of Rio de Janeiro for a Future Climate Change Scenario

by
Wanderley Philippe Cardoso Ferreira
1,
Henderson Silva Wanderley
2,* and
Rafael Coll Delgado
3
1
Institute of Agronomy, Federal Rural University of Rio de Janeiro (UFRRJ), Seropédica 23897-000, Rio de Janeiro, Brazil
2
Department of Environmental Sciences, Forest Institute, Federal Rural University of Rio de Janeiro (UFRRJ), Seropédica 23897-000, Rio de Janeiro, Brazil
3
Center for Biological and Natural Sciences, Federal University of Acre (UFAC), Rio Branco 69917-400, Acre, Brazil
*
Author to whom correspondence should be addressed.
Atmosphere 2025, 16(4), 358; https://doi.org/10.3390/atmos16040358
Submission received: 7 February 2025 / Revised: 28 February 2025 / Accepted: 19 March 2025 / Published: 21 March 2025
(This article belongs to the Special Issue Climate Change and Extreme Weather Disaster Risks)

Abstract

:
Climate change can alter the frequency and magnitude of extreme precipitation events (EPEs), both in terms of scarcity and excess, impacting society as a whole. The aim of this study was, therefore, to identify changes in the distribution of precipitation with the potential to cause extreme events in the state of Rio de Janeiro (SRJ) for current and future climate change scenarios. Climate change indices were selected that refer to changes in the distribution and magnitude of rainfall events for the state of Rio de Janeiro. The analysis was carried out for the historical period between 2000 and 2020 and for future climate change scenarios between the years 2021 and 2100. The analysis for future climate change scenarios was carried out using data from climate models of the general circulation of the atmosphere (CMIP-6) for future climate change scenarios SSP 4.5 and SSP 8.5. Total annual precipitation in the SRJ by the end of the 21st century will be reduced by between 24% and 47% for the intermediate and pessimistic scenarios, respectively. The projections also indicate an increase in the number of consecutive dry days, which could be greater than 130% in the pessimistic scenario, and a reduction in consecutive wet days. An increase in the number of humid and extremely humid days is also projected for the SRJ, which could increase the EPEs.

1. Introduction

Rainfall is one of the most important meteorological elements for the conservation and balance of biodiversity, agriculture and urban supply and for diagnosing forest fire risk indices and maintaining life on the planet. However, its spatial and temporal distribution may undergo significant changes as a result of climate change. It is expected that, with climate change, rainfall will show a reduction in its days of occurrence, with a substantial increase in the frequency of extreme events [1,2,3].
There is a consensus on the increase in extreme precipitation events (EPEs), both due to scarcity and excess [4]. These events are related to a greater frequency and magnitude of droughts, floods, flash floods and mass movements on a global scale [5,6]. The changes observed in the distribution of precipitation include the intensification of the hydrological cycle, which will be responsible for increasing the contrast in precipitation between wet and dry regions and between wet and dry seasons, with a greater occurrence of severe storms and floods [6].
These changes may be due to the increase in greenhouse gas emissions, which, in turn, contribute to significantly modifying almost all the components of the climate system, with a direct impact on urban and agricultural water availability. Because agriculture and urban water supply are human activities that depend on the weather, a reduction or excess in water availability will have a profound impact on global grain production and urban water supply. Extreme rainfall events have strong social and economic impacts, with water quality worsening, often below international standards, posing a threat to human and animal welfare following extreme rainfall events [7].
The rainfall could become more unpredictable and extreme [1,2,8,9]. One of the predicted trends is a reduction in rainy days, which could have devastating effects on agriculture and water-dependent ecosystems. In addition, a substantial increase in the frequency of extreme rainfall events is expected, bringing with it high risks of flooding, landslides and damage to infrastructure. The frequency of extreme rainfall events almost doubles per degree of warming [8]. The frequency of extreme rainfall, on a global scale, increases in air temperature increase scenarios of 1.5 and 2 °C until around 2100 [10].
Climate projections for the rest of the century show the continued intensification of precipitation extremes. Simulations carried out with climate models show that projected global warming explains the spread of the intensification of extreme precipitation until the end of the 21st century. This intensification has direct implications for increasing the risk of socio-environmental disasters as the climate warms. An increase of this magnitude in air temperature was observed in the city of Rio de Janeiro (CRJ) [11]. However, the impact of this warming on extreme precipitation events for the state of Rio de Janeiro (SRJ) has not yet been carried out, especially for climate change scenarios.
For the SRJ, a previous study showed that changes in monthly rainfall have been occurring since the 1940s, which may indicate a response to climatic oscillations [2]. However, changes in the distribution of rainfall in recent decades have already been observed in the SRJ [12,13,14]. Between 1998 and 2018, seventy-four extreme rainfall events above the 99th percentile were identified in the CRJ [15]. The extreme rainfall above the 99th percentile for the CRJ shows an increasing trend [3].
These extreme events have caused dozens of deaths, and thousands of people are affected in the SRJ, especially by floods and mass movements [16]. EPEs and accumulated precipitation are the initial critical points for the occurrence of mass movement in the CRJ, where these types of disasters also depend on residential occupation, type of terrain, geology, vegetation, drainage, topography and other factors [17]. These characteristics are relevant to the CRJ and other cities in the state of Rio de Janeiro, which have regions vulnerable to socio-environmental disasters due to higher rainfall and irregular occupation of hills and slopes [18].
The most recent disasters in the state of Rio de Janeiro are associated with EPEs and irregular occupation. In 2010 and 2011, there were three very notable disasters: Angra dos Reis (52 deaths in January 2010), Morro do Bumba in Niterói (166 deaths in April 2010) and in the mountainous region of the SRJ (almost 1000 deaths) [16,19]. EPEs triggered flash floods and landslides, accounting for 74% of deaths related to natural disasters in the period from 1991 to 2010 [20].
These events highlight the importance of studying the distribution of rainfall as well as identifying possible variations in the frequency and magnitude of these events so that public authorities can take measures to manage water resources and mitigate the impacts caused by these events. The aim of this research was, therefore, to identify changes in the distribution of rainfall with the potential to cause extreme events in the state of Rio de Janeiro for current and future climate change scenarios.

2. Material and Methods

This research was carried out for the SRJ, located in the southeast of Brazil (Figure 1), with an area of 43,750.425 km2. The state has the second largest population and demographic density in Brazil. The capital of the SRJ is called the CRJ, the second largest city in Brazil. The state’s terrain is characterized by mountain ranges, which cover the interior of the state and can reach altitudes of over 2700 m, with a high-altitude tropical climate. The lowland and coastal regions have a maximum altitude of 200 m and a semi-humid tropical climate, with hot, humid summers, high rainfall and dry winters [14].

2.1. Data Used

Precipitation information for the current and future periods was used for the analysis. For the current period, we used precipitation data from the Global Precipitation Climatology Center—GPCP (National Centers for Environmental Information (NCEI) (noaa.gov) accessed on 15 Mar 2024), between 2000 and 2020, with a spatial resolution of 0.5° × 0.5°. For the future scenarios, data averages from the sixth generation of models from the Coupled Model Intercomparison Project (CMIP6-IPSL-Home|ESGF-CoG (upmc.fr) accessed on 08 Apr 2024) of the World Climate Research Programme (WCRP) were used for the CanESM5, MIROC6 and MPI- ESM1.2 models. The Canadian Earth System Model 5 (CanESM5) has a resolution of 64 latitude and 128 longitude [21]. The sixth version of the Model for Interdisciplinary Research on Climate (MIROC6) has a resolution of 128 latitude and 256 longitude [22], and the Max Planck Institute for Meteorology Earth System Model (MPI-ESM1.2) has a resolution of 96 latitude and 192 longitude [23]. The models used the Shared Socioeconomic Pathways (SSPs) intermediate scenario (SSP 4.5) and the pessimistic scenario SSP5 8.5, according to [4].
The data from the climate models between 2021 and 2100 were obtained from the average of the climate models. The future projections were divided into four intervals, 2021–2040, 2041–2060, 2061–2080 and 2081–2100, for two future climate change scenarios. The spatial resolution of the precipitation data from the GPCP and the models was adjusted to 2.5 min (~21 km2). A T-test was performed to identify statistical changes between the four interval means with p-value < α = 0.05.

2.2. Climate Change Detection Indices

The databases for the current and future periods were used to identify indices related to climate change defined by an Expert Team in Climate Change Detection and Indices (ETCCDI) [24], which are widely used in climate variability and change research to determine indicators of the occurrence of extreme events, such as maximum rainfall in one day (RX1day) in the year, maximum rainfall in five consecutive days (RX5day) in the year, maximum number of consecutive dry days (CDD), maximum number of consecutive wet days (CWD) and total annual rainfall (PRCPTOT) (Table 1). The indices used were obtained from precipitation data using the RClimDex software, which is maintained by the Climate Research Division and was developed in the RStudio 4.4.0 computer language, providing an easy-to-interpret graphical interface.

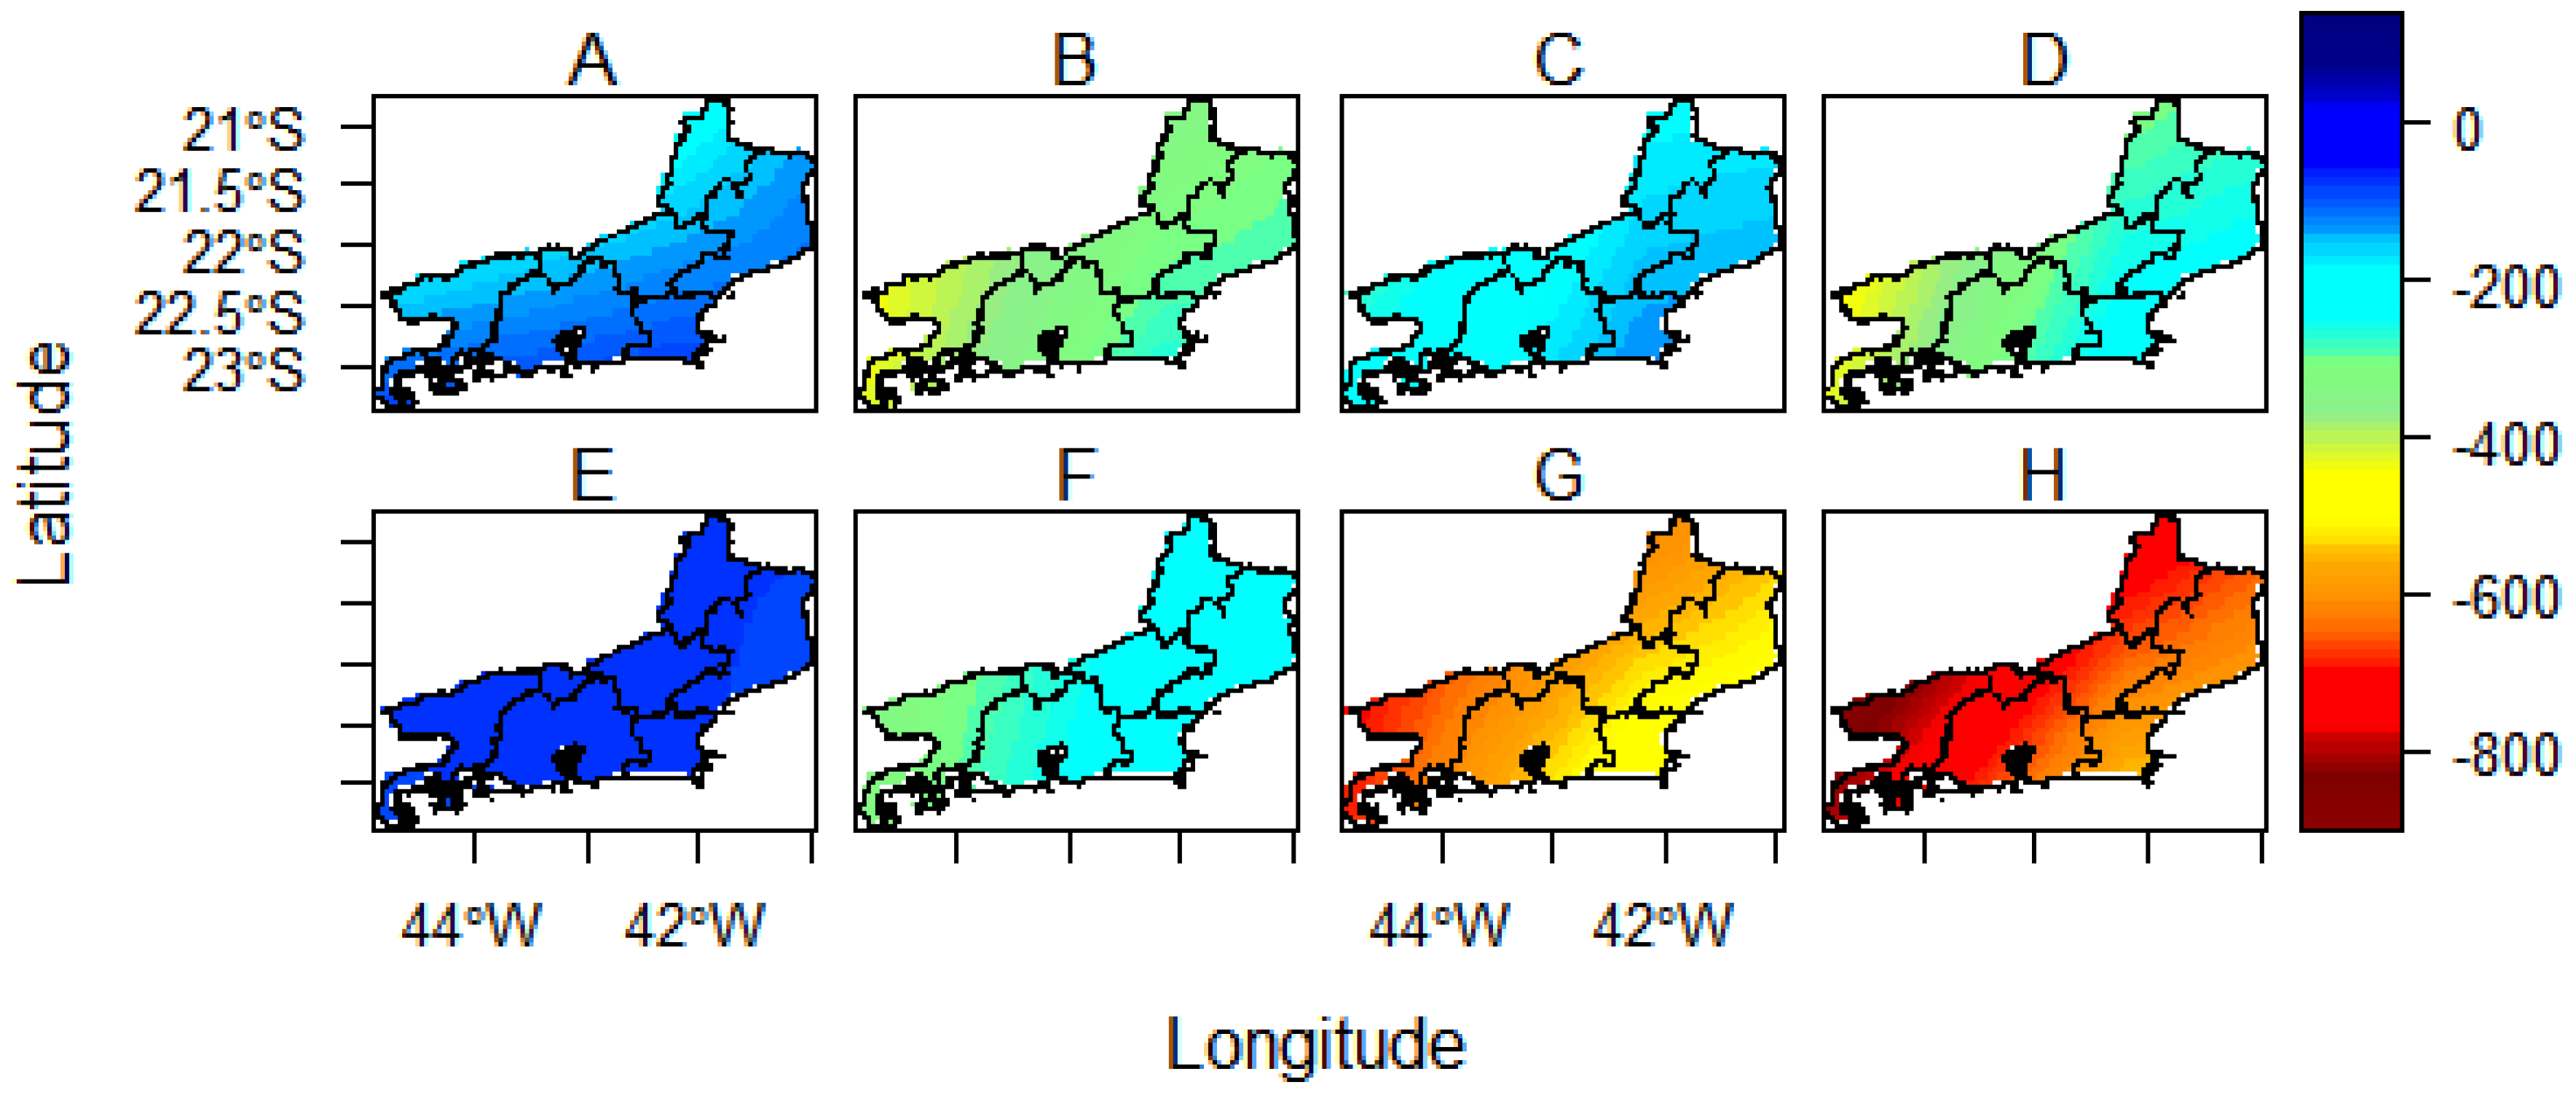
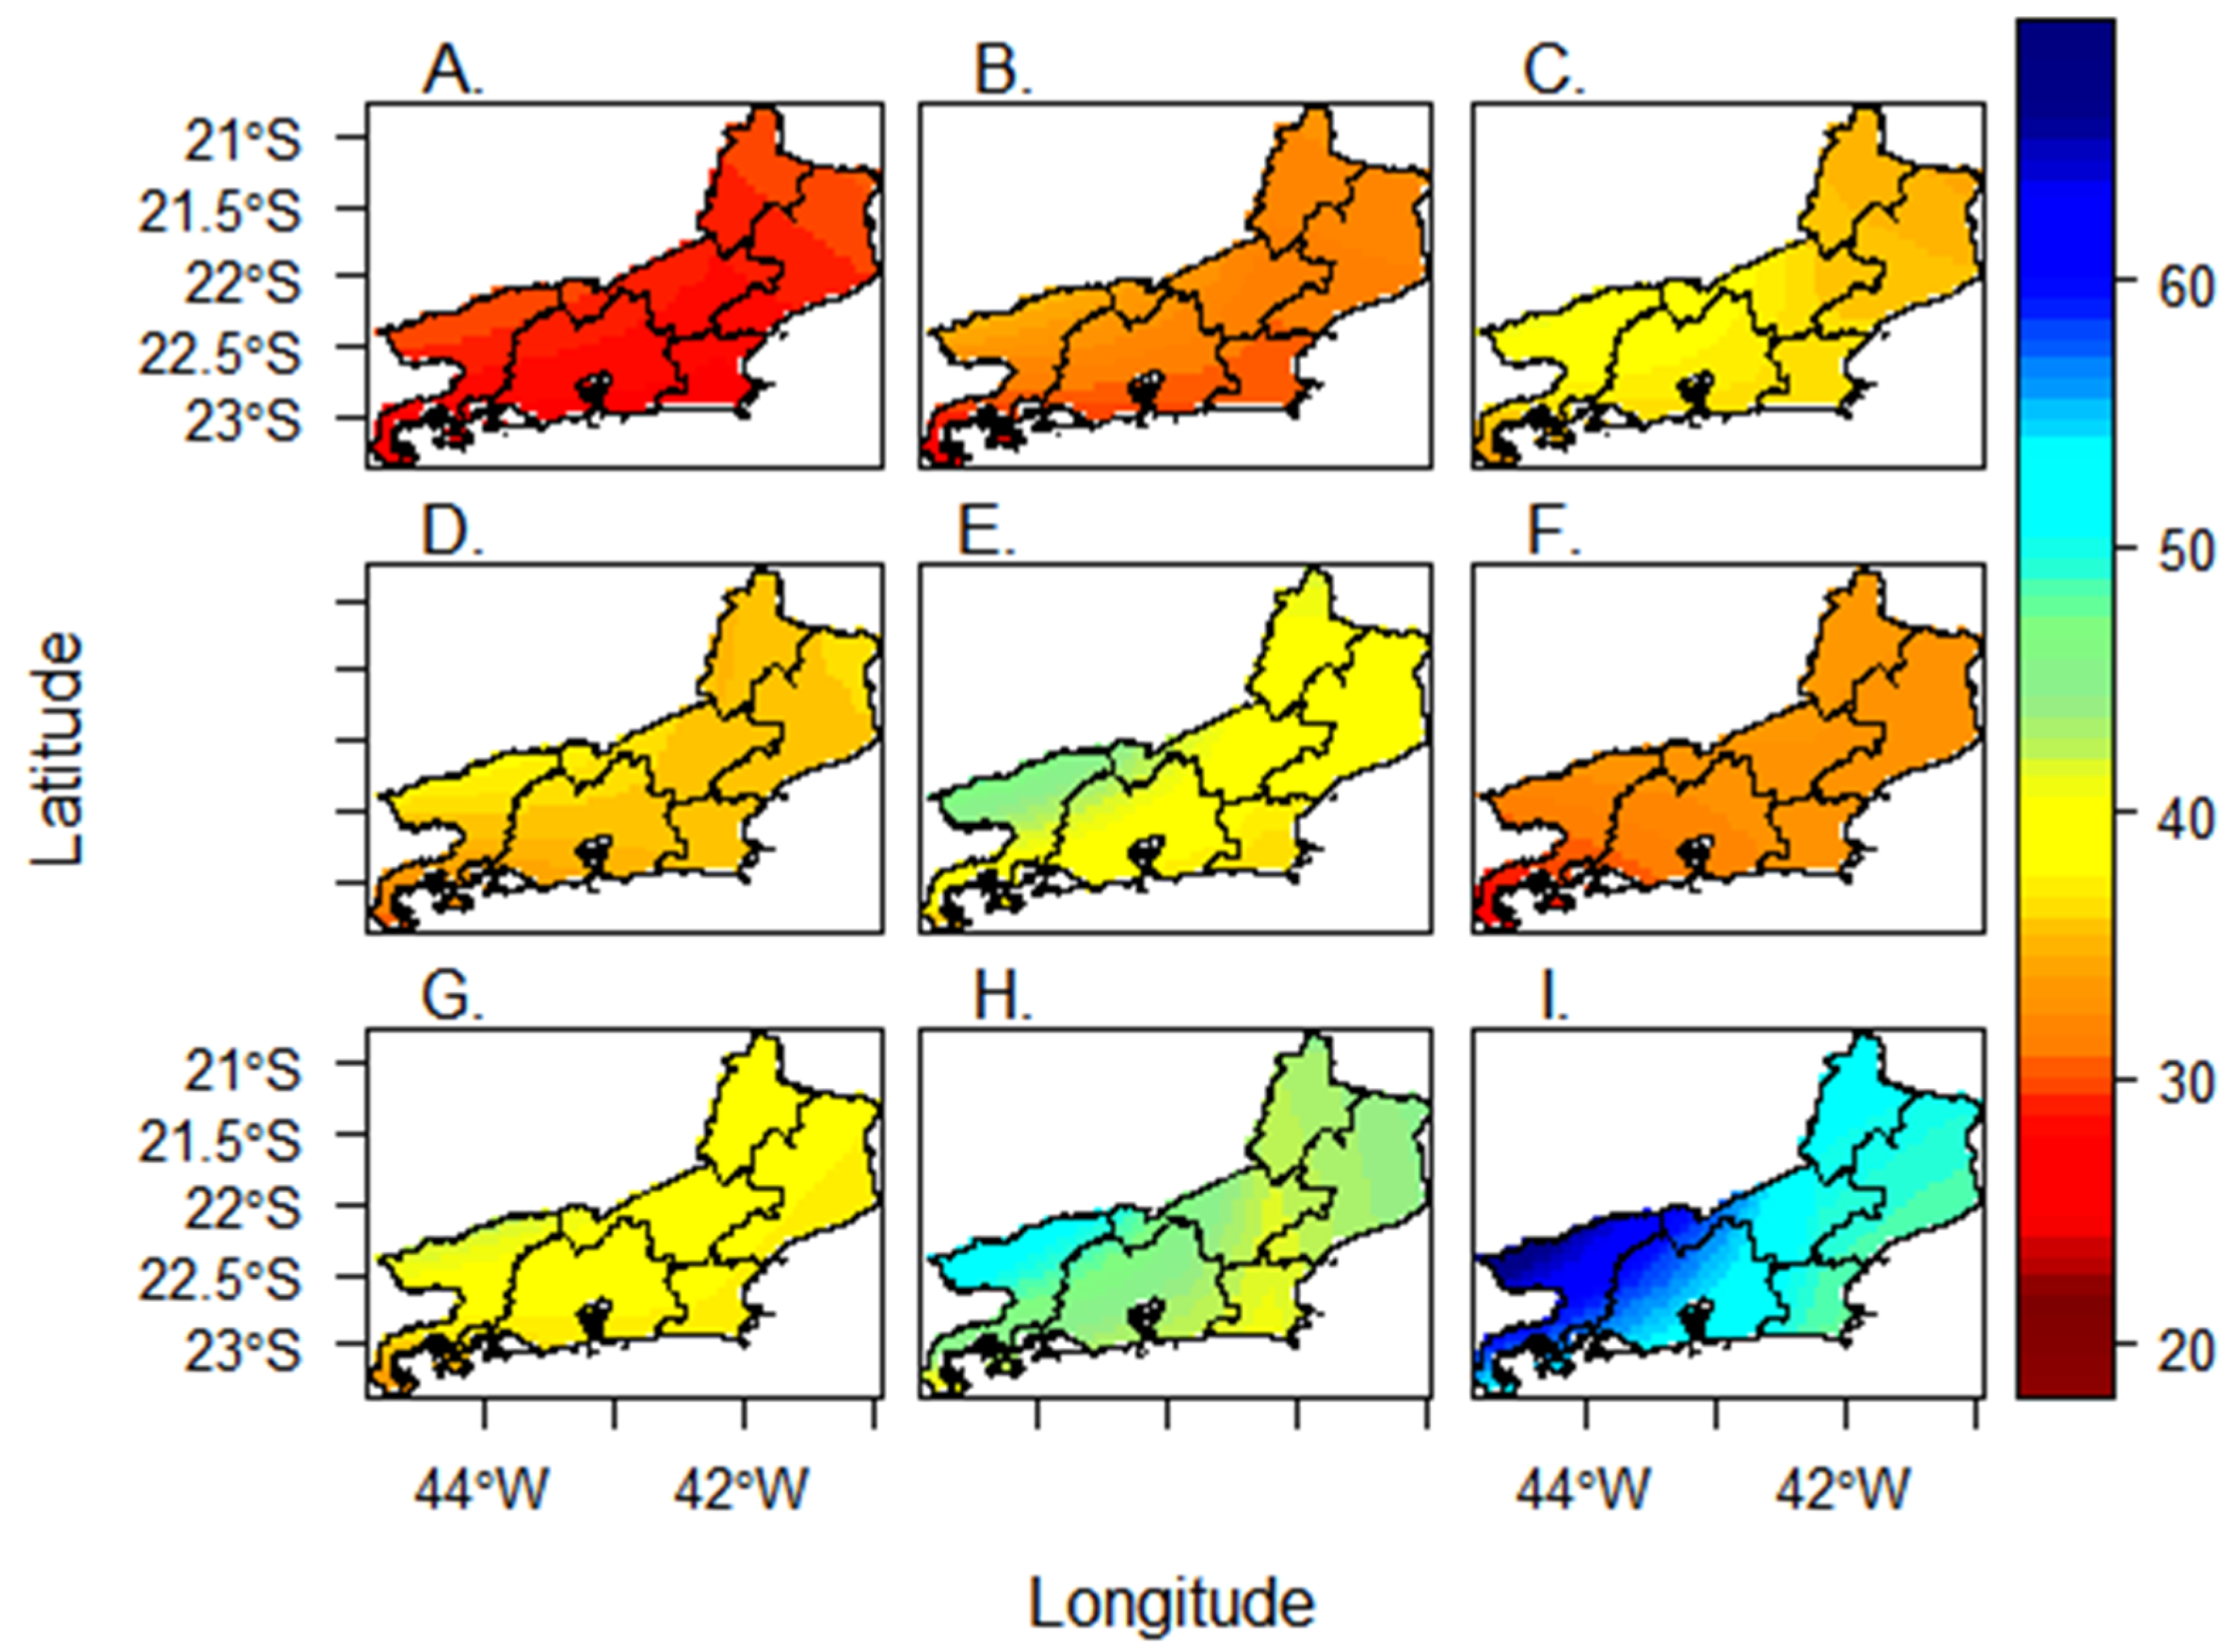
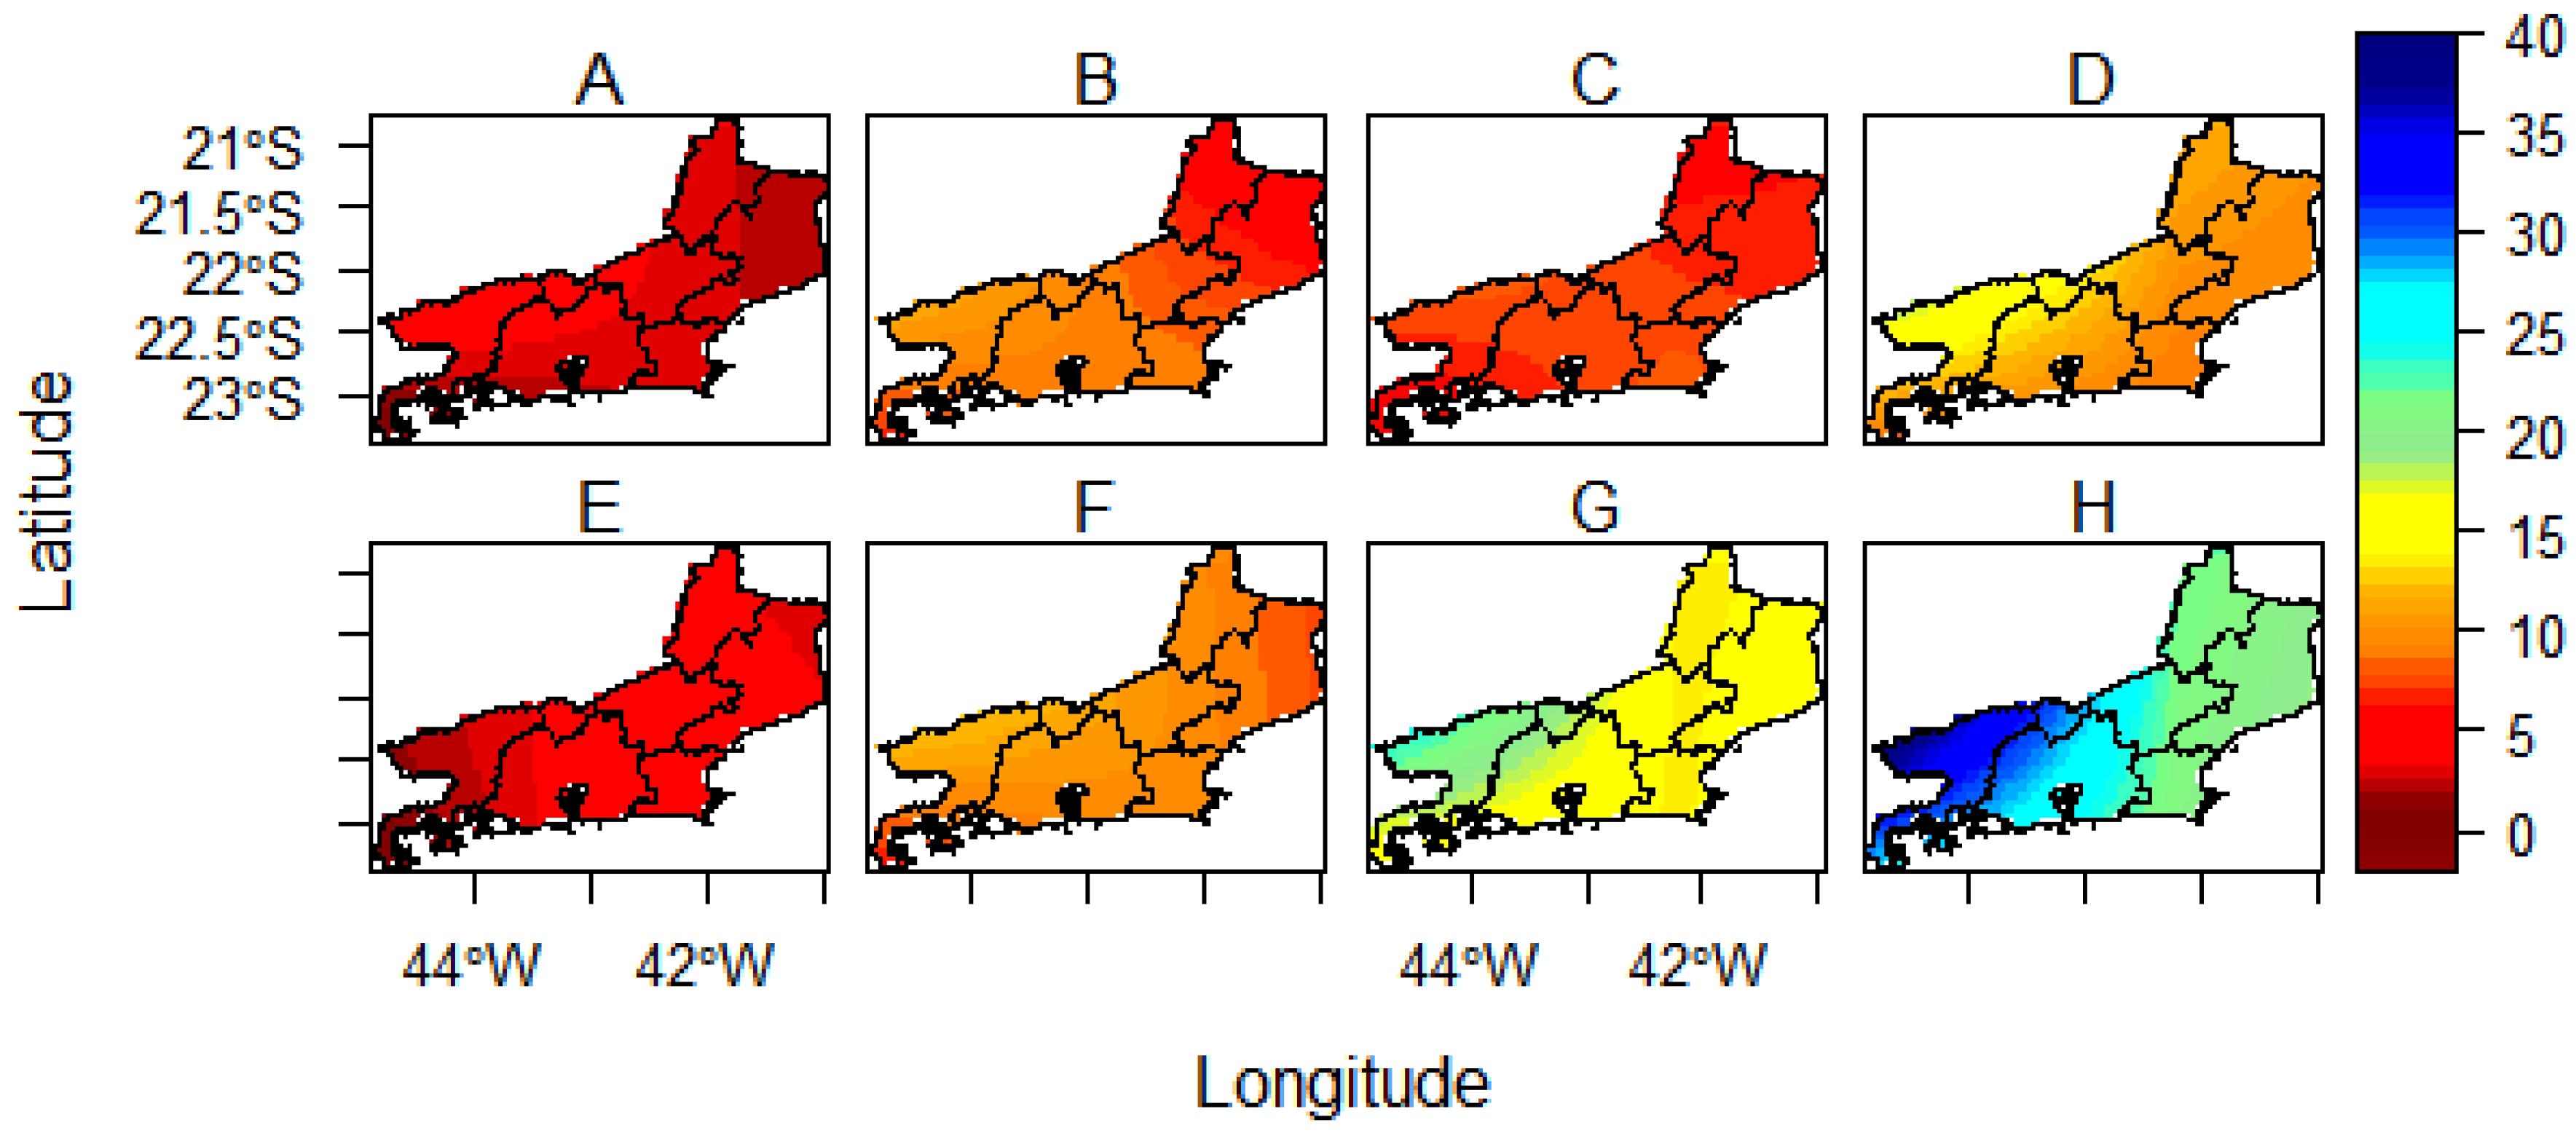
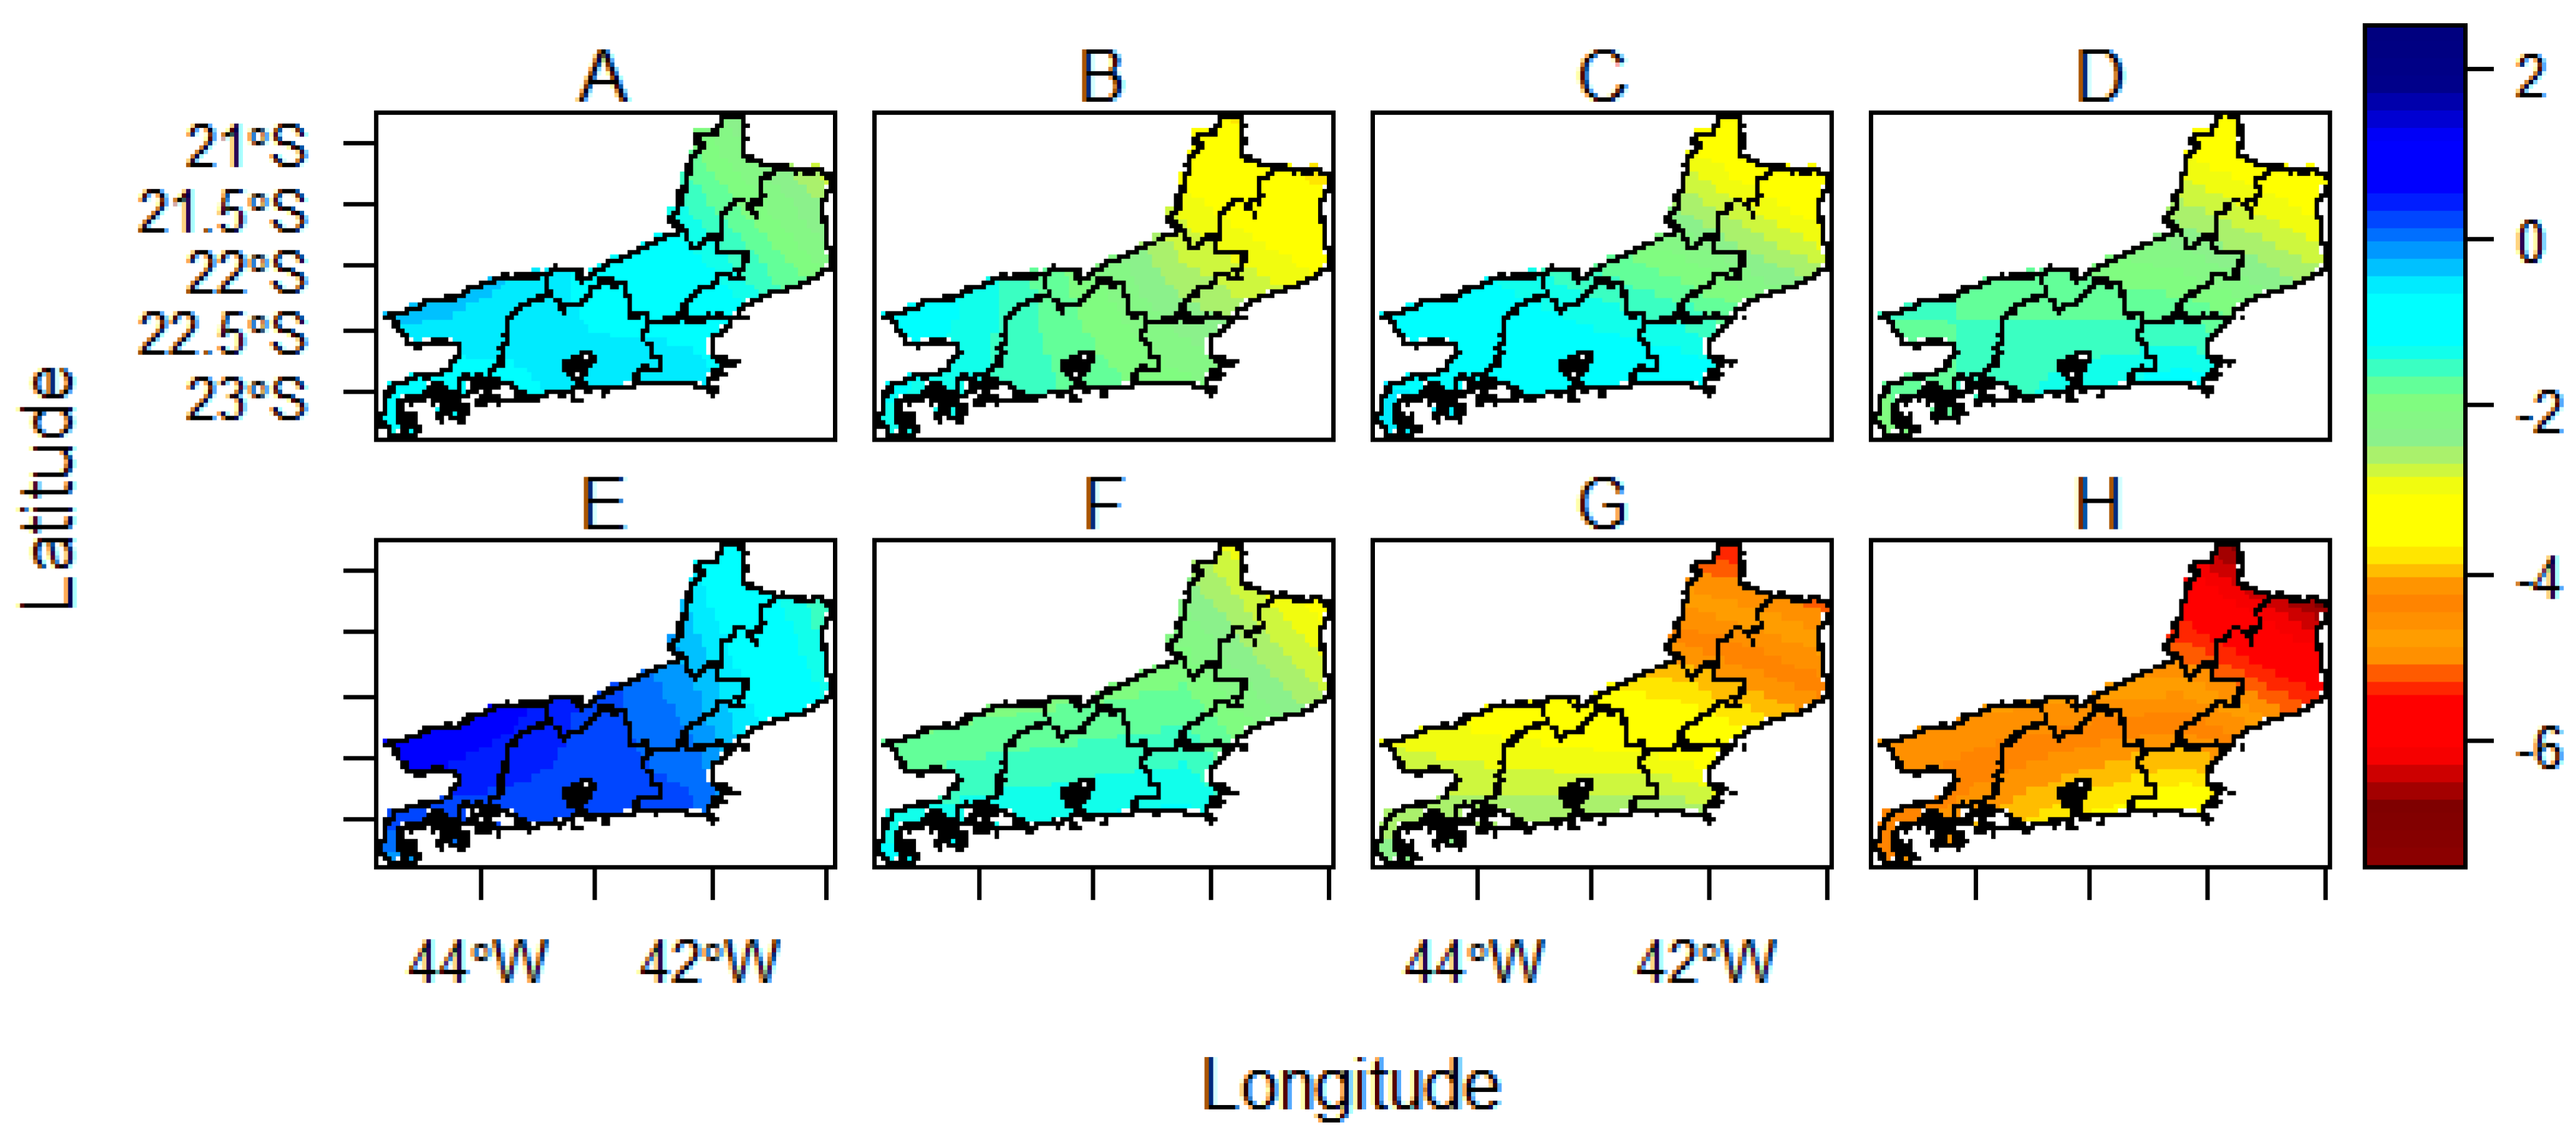
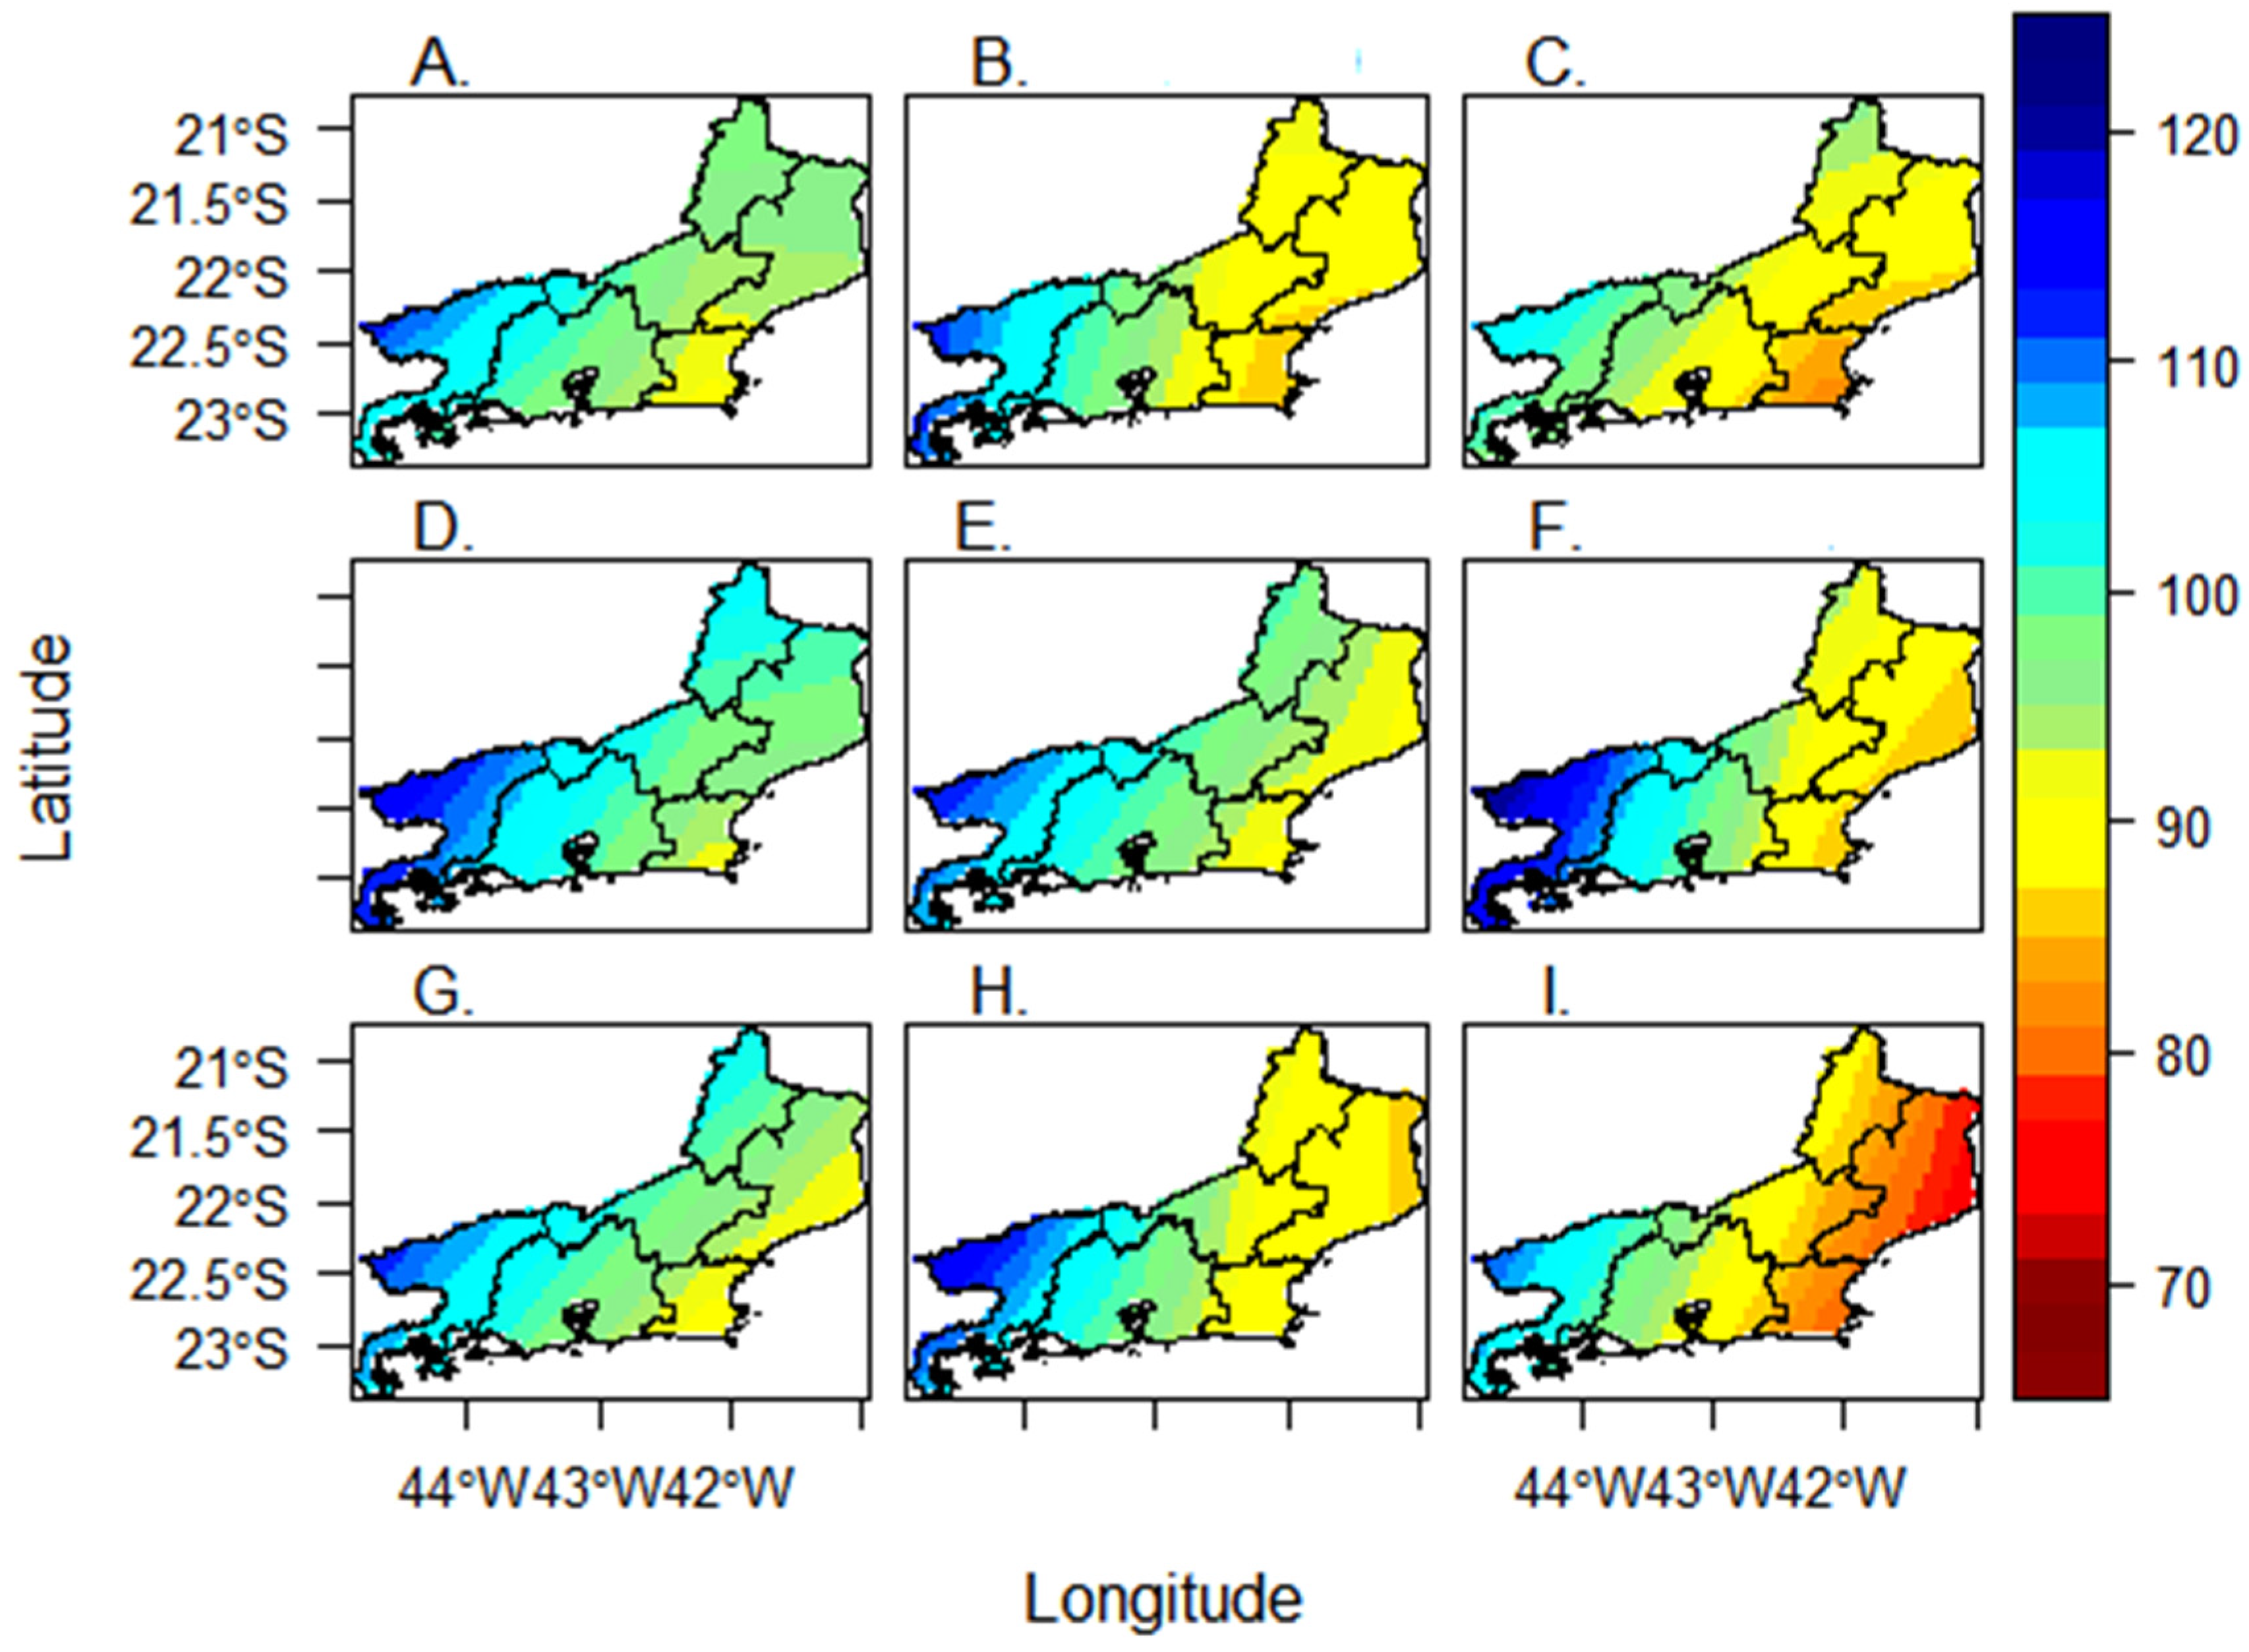
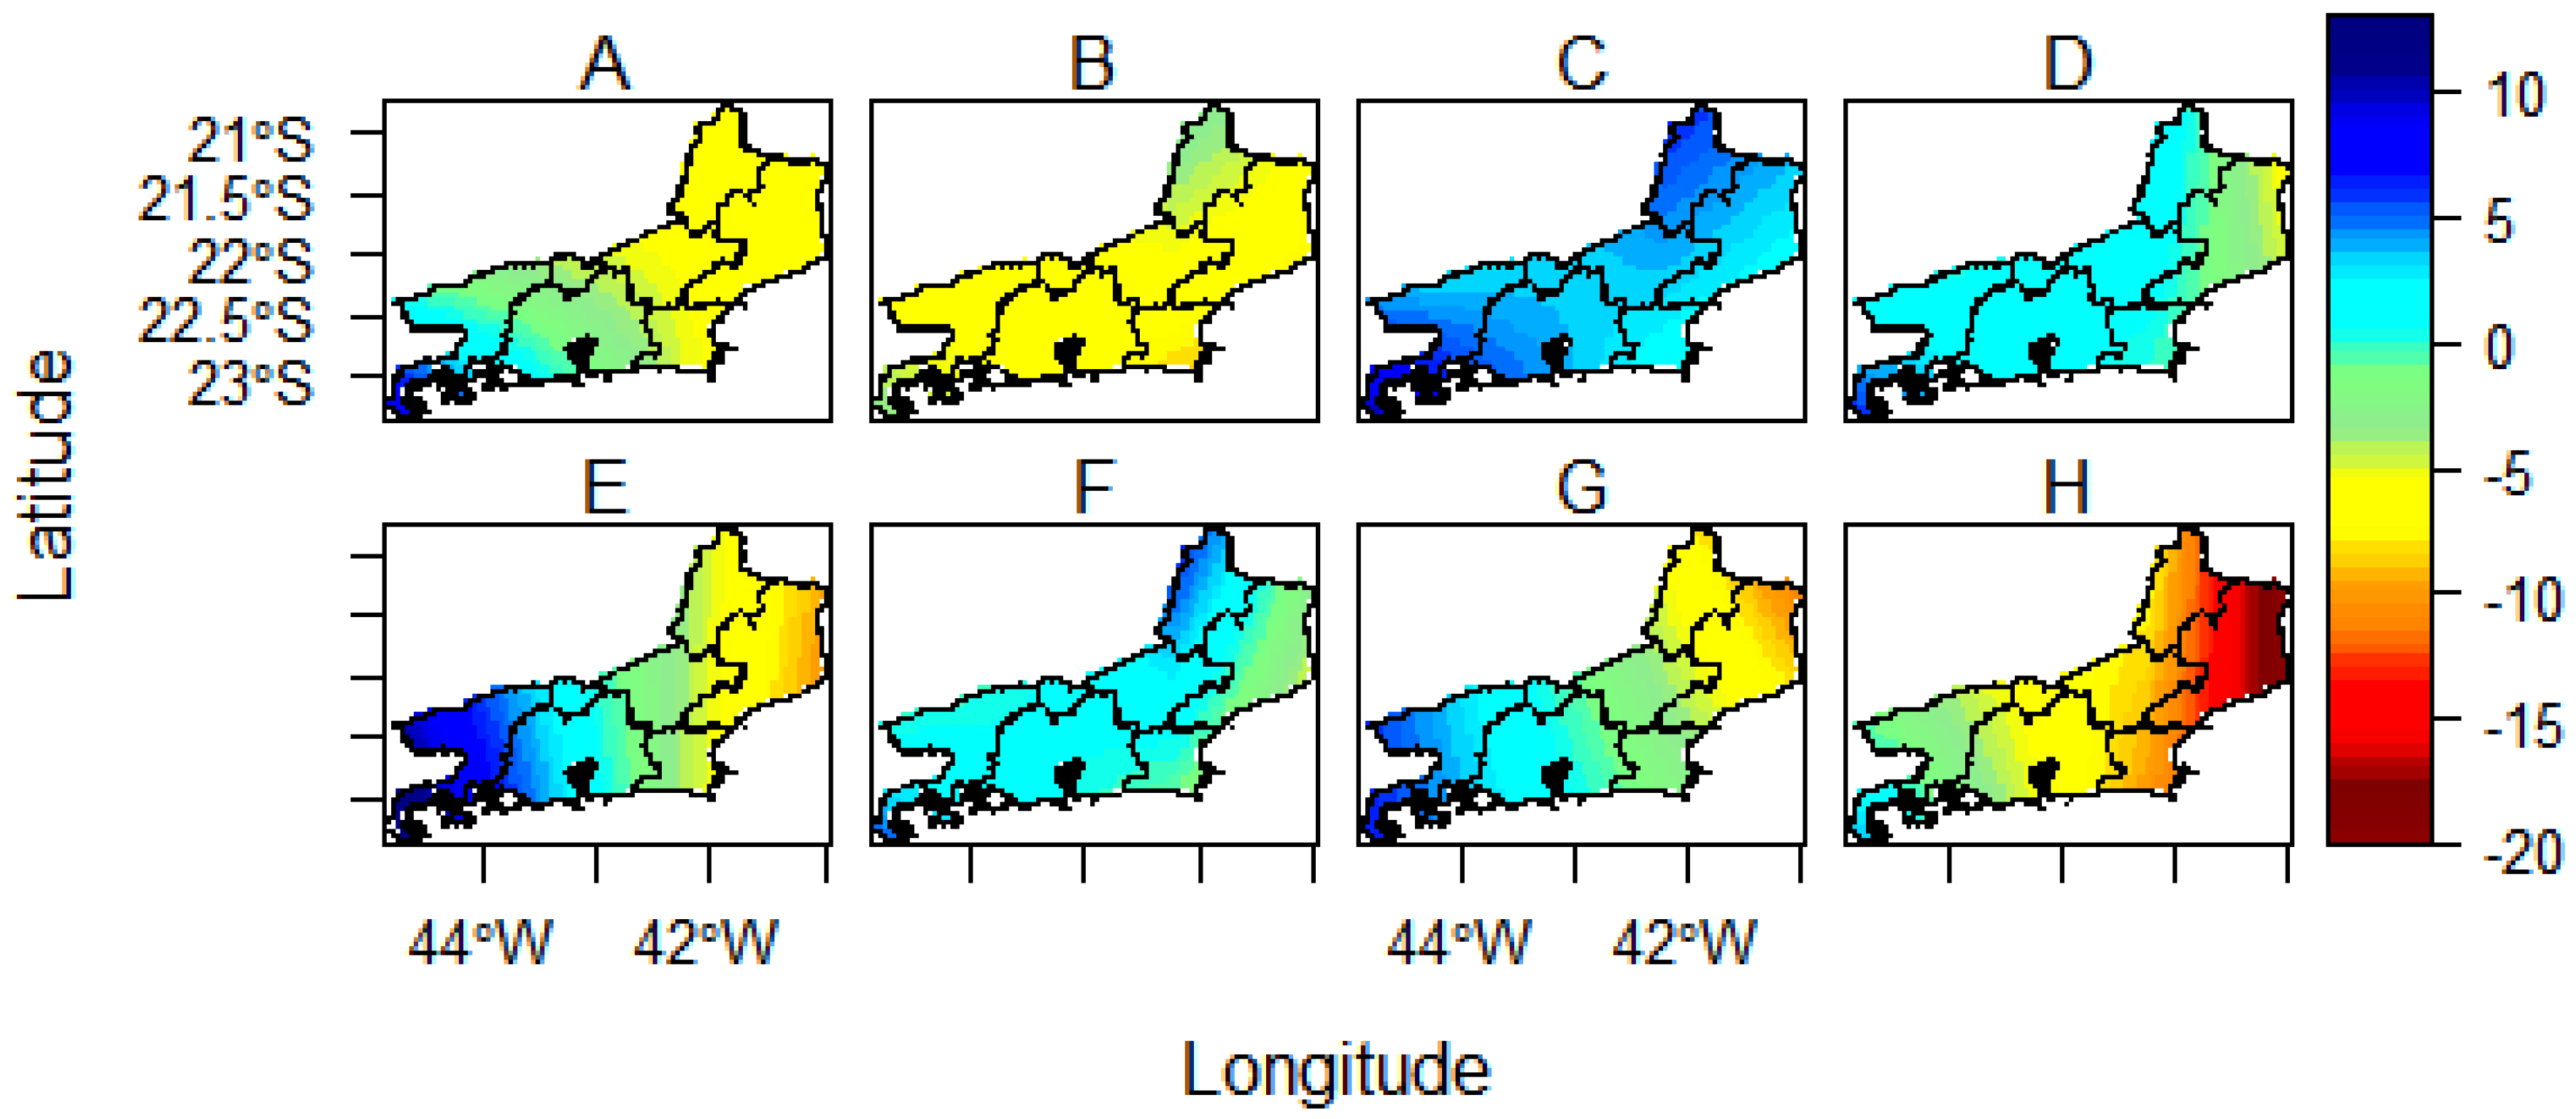
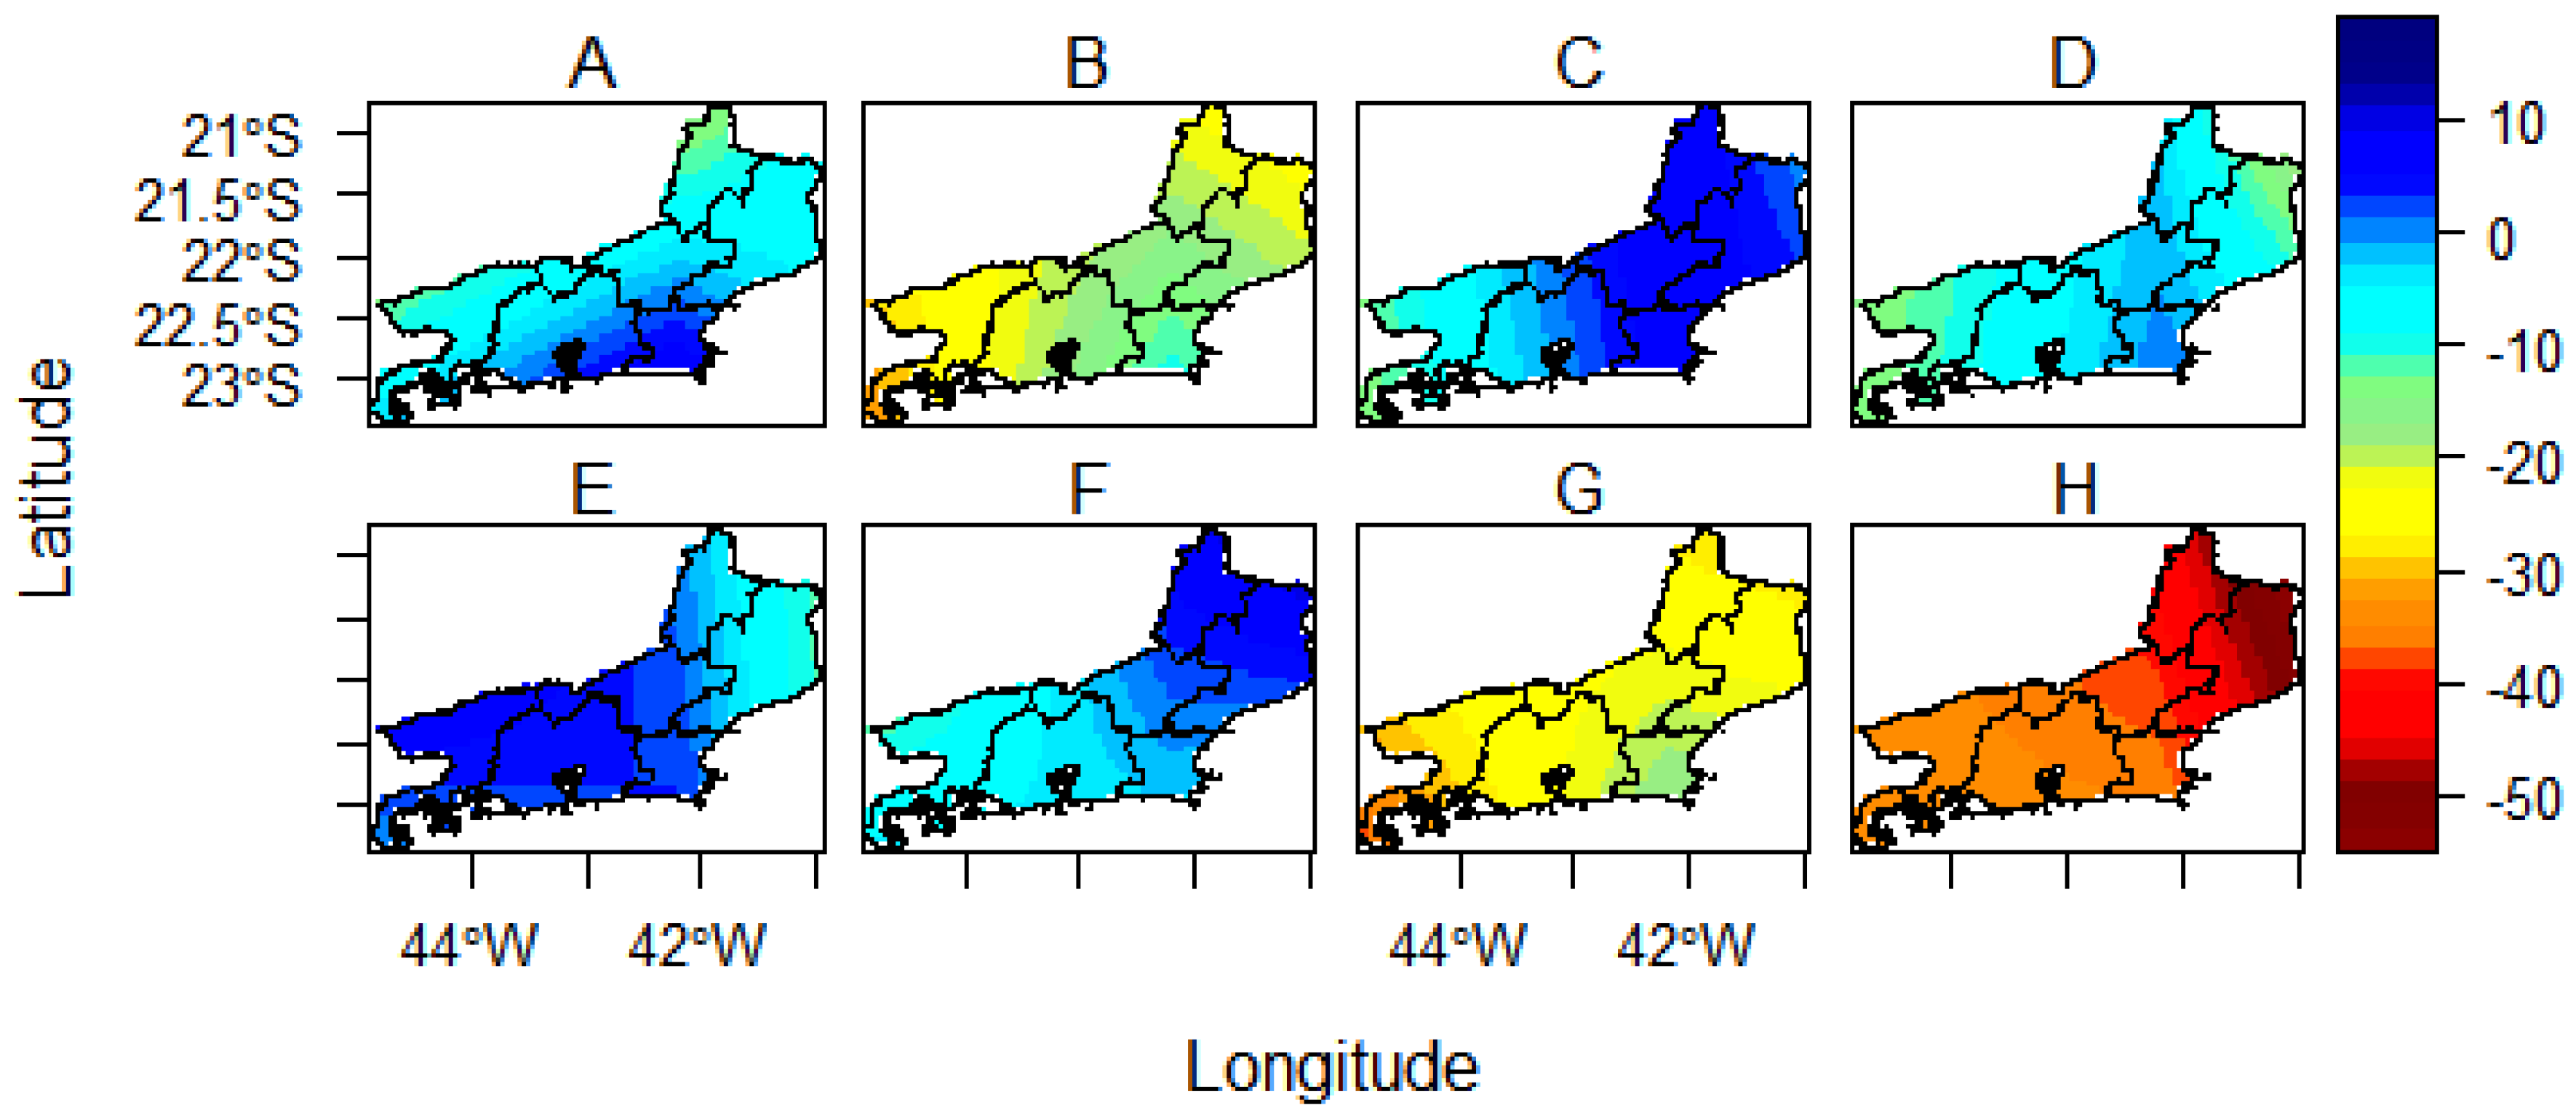
3. Results and Discussion

The distribution of annual rainfall (PRCPTOT) in the SRJ shows spatial variability of approximately 1000 mm (Figure 2). The highest rainfall totals are observed in the southern region of the state, with rainfall close to 2000 mm. These results are in line with those of [2,14,25]. These higher totals are due to the entry of frontal systems of polar origin and the influence of the orography of the Mar Mountain Range and Manteigueira, where, in the state of Rio de Janeiro, the altitude is higher than 2000 m. Rainfall in the SRJ is significantly lower than in other regions of the state. In the metropolitan region, rainfall ranges from 1200 to 1500 mm, with the lowest totals in the north and northwest of the state.
The climate change scenarios indicate a reduction in rainfall for the state of Rio de Janeiro in general. For the intermediate scenario (SSP-4.5), a reduction in rainfall of around 30 to 40% was observed, which could be equivalent to a reduction of 500 mm in the southern region, 400 mm in the metropolitan region and 300 for the other regions of the state. This reduction represented a significant change, with p-value < α = 0.05 between the current period and all future periods. The analysis showed that rainfall in the south of the state showed a statistically significant reduction from 2500 mm to less than 2000 mm over seven decades [14]. For the metropolitan region, there was a reduction in rainfall after 2017 [3].
For the pessimistic scenario (SSP-8.5), the reduction in rainfall in the SRJ could reach 60%, with average annual totals of between 400 and 1000 mm (Figure 3). The reduction in rainfall in the state of Rio de Janeiro could have significant impacts, especially in the north and northwest of the state. These regions have been experiencing rainfall below the climatological average over the years, threatening agriculture and livestock. The drought of 2017 alone generated a loss of R$70 million for municipalities in these regions and seriously compromised the water supply for the local population [26]. The years 2016 and 2017 saw annual rainfall below 800 mm, the maximum limit for a semi-arid climate. The reduction in rainfall could contribute to susceptibility to the desertification process, which could advance in the region [27]. The reduction in rainfall in the SRJ has also been verified for the southern region. A reduction in rainfall was observed for the south of the state of Rio de Janeiro in nine months of the year, with a monthly reduction in rainfall of more than 20 and 30% for some months, indicating that climate change could increase the reduction in rainfall for this region of the state of Rio de Janeiro [2]. The results obtained showed that total annual rainfall and consecutive rainy days decreased, which is mainly due to an increase in consecutive dry days [14].
The indication of a reduction in precipitation is confirmed by the increase in the number of consecutive dry days (CDD) for the SRJ for the climate change scenarios. In the climatological period, CDD showed an average variation of 20 to 30 days (Figure 4). The lowest values were observed in the coastal regions of the SRJ, including the capital CRJ. CDD increase moving towards the mainland and in the north and northwest of the state, indicating the existence of a gradient [28]. A similar variation was observed with CDD between 25 and 35 days, although CDD greater than 35 days can be observed in some regions [3]. Results are similar to those presented with CDD ranging from 20 to 32 and extremes greater than 40 days [25]. An increase in CDD in the south of the SRJ was observed in the mid-1990s [14]. This increase may be the result of the bidecadal modulation observed in rainfall, which indicates a reduction in rainfall and an increase in CDD [2].
For the climate change scenarios, the maximum CDD numbers will vary from 35 to 50 days for the SSP 4.5 scenario (Figure 5). The results show an increase in CDD by the end of this century of 60% compared to the current scenario. For the pessimistic SSP 8.5 scenario, this index points to changes to the maximum CDD values of 35 to 70. This increase ratifies a 133.3% increase in the number of consecutive dry days by the year 2100. The future scenarios show an increase in CDD. In the first two decades, for both scenarios, the increase in CDD is around 5 days. The analysis of the anomalies for CDD by the end of the 21st century in relation to the figures recorded in the historical scenario indicated that the respective changes for the SSP 4.5 scenario are an increase of 5, 10, 12 and 18 days. For the pessimistic scenario, these increases are 5, 12, 24 and 40 days for the periods under analysis. Was also verified a p-value < α = 0.05 between the current period and all future periods for both scenarios.
The south of Rio de Janeiro is the region that has seen the biggest increase in CDD numbers. This can be explained by the fact that this region currently has the highest annual rainfall totals in the state. Projections for this region are for approximately 800 mm by the end of the century, which will result in a greater increase in CDD. These changes will lead to less variability in the distribution of rainfall in the state of Rio de Janeiro.
The reduction in precipitation and the increase in CDD result in a reduction in CWD (Figure 6). Climatology shows oscillations in this index between 10 and 19 days, with the lowest values in the coastal region and the north, northwest and west of the SRJ. This change was also significant for the average, with the CRJ CWD varying between 9 and 22 days [3]. The authors also show a similar oscillation in CWD and precipitation, with both indices increasing until 2008. Thereafter, there was a reduction in both indices. The results obtained for the south of the state of Rio de Janeiro showed that the reduction in the number of consecutive rainy days began in the 1970s, and in recent decades, there has also been a reduction in total annual rainfall and consecutive rainy days [14].
Increases in CWD and reductions in rainfall have significant impacts on vegetation and agricultural production. Droughts associated with hot periods can affect vegetation productivity by reducing the absorption of atmospheric CO by vegetation [29]. Extreme periods of drought also contribute to the occurrence of forest fires [6]. Pollution from wildfire smoke directly affects human health. The thicker soot irritates the nose and throat, but the finer soot and toxic gases penetrate deep into the structures of the lungs and reach the blood, spreading their harmful effects throughout the body. Future simulations for the SRJ show that the risk of forest fires will increase with climate change [30].
For the SSP 4.5 scenario, CWD shows a reduction for all regions of the SRJ and an advance in the areas where CWD is lower. In the climatological period, the minimum CWD values are observed only in the lakes region (Costa Verde), while with the advance of climate change, the minimum CWD advances to the north, northwest, mountain and metropolitan regions (Figure 7). This situation is exacerbated for the worst-case climate change scenario, where minimum CWD values of 5 and maximum values of 14 are estimated, with a corresponding reduction of 50% and 30% in the minimum and maximum values, respectively. The changes presented by the intermediate climate change scenario are already relevant for the SRJ and will directly impact the distribution of rainfall up to the year 2100, which could be crucial for water supply if the worst-case scenario is established.
The average distribution of maximum daily rainfall shows that wet days have a rainfall range of 90 to 120 mm, which is a daily rainfall with the power to cause disruption in any city on the planet, mainly driven by climate change (Figure 8). Rainfall of over 100 mm in the cities of the SRJ is common and causes major damage. In January 2024, the passage of a frontal system caused 350 mm of rain in Angra dos Reis, 235 mm in Mesquita and São João do Meriti, 232 mm in Nilópolis, 166 mm in Seropédica, 161 mm in Queimados, 131 mm in Japeri, 125 mm in Beldord Roxo, 124 mm in Paraty and 103 mm in Niterói in just 24 h [19]. Climate models project an increase in the magnitude and frequency of extreme rainfall events by 2100 [30,31]. On a regional scale, the increase in extreme precipitation in a warmer climate can be substantially influenced by regional characteristics. The SRJ has a pronounced topography that favors the formation of convective and orographic precipitation, where these regional specificities can contribute significantly to the increase in rainfall associated with the increase in atmospheric humidity [32].
One example was the extreme rainfall that occurred in Angra dos Reis between 8 and 9 December 2023. The extreme rainfall was associated with orography due to the flow of moisture from the sea as a cold air mass passed over the coast. Orographic rain is precipitation induced by relief. Moisture from the ocean carried by the wind, when it meets the barrier of the Serra do Mar Mountain Range, rises into the atmosphere and finds a lower temperature as it rises into the atmosphere with colder layers. During these days, 280 mm was observed, with a total of 297 people left homeless and two deaths. In Resende, another municipality in the southern region of the state of Rio de Janeiro, heavy rain was observed between 27 and 28 October 2021, with 44 mm of rain in one hour and a further 130 mm in seven hours, five times more than was expected for that month [19].
For the southern region of the state of Rio de Janeiro, the greatest increases in extreme precipitation are projected for climate change scenarios (Figure 9). For the intermediate scenario (SSP 4.5), a reduction is expected until the middle of the century and then an increase. For the pessimistic scenario, this reduction in extremes may only occur in the last decades of the century. These changes are worrying because they present statistical significance for the rx1day and rx5day indices, placing the SRJ at constant risk. For the southern region of the state of Rio de Janeiro, there is a positive trend towards an increase in daily wet extremes [14]. According to the authors, Rx1day has increased since the beginning of the 1930s, falling slightly around the 1970s and increasing again from the 1980s onwards [14].
But without a doubt, the region’s most critical two extremes of precipitation are the metropolitan region, which includes the CRJ, and the mountain region of the SRJ. The CRJ has a region critical to EPEs, with 90% of the city’s geological–geotechnical accidents occurring in this region [18]. The number of EPEs has increased in the CRJ [3,25]. The CRJ has 33% of its annual rainfall in just 6.6 days, when the daily rainfall total is equal to or greater than the 95th percentile [15]. This increase may be related to the increase in convective precipitation [33]. The increase in extreme rainfall has the potential to increase disasters related to floods, torrents and mass movements, among others, that are so common in the SRJ, which always cause major socio-environmental impacts. Parts of these disasters are related to the irregular occupation of steep slopes and deforestation of slopes, which collapse with the EPEs.
The SRJ’s mountain region also stands out for its large number of EPEs, where the 2011 disaster occurred, with almost 1000 deaths [3,33,34]. Nova Friburgo was again affected by similar natural disasters in 2012, with five deaths, 2371 homeless people and more than 10,000 inhabitants affected. In 2016, the city of Petrópolis was once again punished by an EPE, with 34 deaths, 523 homeless people and 152,277 inhabitants affected [33]. In February 2022, Petrópolis was again hit by an EPE, with 231 deaths as a result of 252 mm of rain in three hours [35]. The EPE that occurred in February 2022 was the largest in the historical series analyzed in Petrópolis [36]. Part of the precipitation that affects the SRJ is accumulated over consecutive days, while Rx1day reflects the greatest daily magnitude of precipitation recorded throughout the year and indicates the intensity of rainfall capable of causing flash floods, flooding, runoff and mudflows. Another index that is also very important to analyze, especially for the state of Rio de Janeiro, is Rx5day. This index shows the potential incidence of landslides caused by waterlogged soil resulting from infiltration caused by rainy days.
For the SRJ, Rx5day always reaches values above 150 mm and can reach almost 250 mm (Figure 10). The highest values of consecutive days with significant rainfall are greater than 150 mm [25]. For the CRJ, Rx5day showed a positive trend [3]. The increase in extremely humid days in the south of the SRJ may contribute to an increase in the occurrence of extreme precipitation events in the region [17]. The analysis of this index is relevant because, even at low levels of rainfall intensity, there can be mass movement due to the waterlogged soil and the high slope of the slopes, which are occupied irregularly in many cases [3]. The analysis showed that RX5day in a large part of the SRJ showed trends between −4 and +4 mm/decade, without statistical significance [25].
There is no consensus on the increase in the positive trend for EPEs in the state of Rio de Janeiro; there is a positive trend in only 14 analyzed stations, and 61 stations have a negative trend [37]. The positive trends are mostly presented in Rx1day, which were verified in Bom Jardim, Teresópolis, with a significant upward trend, with magnitudes of +0.64 and +0.33 mm/year, respectively [38]. Nova Friburgo showed a significant upward trend in Rx1day, with a magnitude of +0.91 mm/year. On the other hand, two stations registered a significant downward trend in Petrópolis (−0.52 mm/year) and another in Valença (−0.55 mm/year). The analysis also identified regions of the SRJ with positive and negative trends [39].
These trends could intensify with climate change. An increase is even expected by the end of the century for the intermediate scenario in Rx1day for the SRJ. This increase can also be observed until the middle of the century for the pessimistic scenario, and then, it starts to decrease (Figure 11). However, the responses to long-term global warming may show small changes, even for extreme precipitation [40]. The increase in EPEs is due to the increase in atmospheric moisture content and thermodynamic and dynamic factors, which are responses to changes in temperature and wind speed [41,42]. Although the change in rainfall in the state of Rio de Janeiro is a fact, the impacts of EPEs are multidisciplinary, with significant socio- environmental impacts, and require greater attention from managers and decision-makers, especially in the case of climate change scenarios.

4. Conclusions

The distribution of rainfall in the state of Rio de Janeiro shows great spatial and temporal variability with a marked contrast in its distribution, where the wettest regions of the state have almost double the total annual rainfall. The analysis of the distribution of rainfall identified that changes in the climate could lead to marked changes in the spatial distribution of rainfall in the state of Rio de Janeiro. There are indications of a generalized reduction in rainfall in all regions of Rio de Janeiro, with a greater reduction in the areas of Rio de Janeiro with the highest totals. For the northern and northwestern regions of Rio de Janeiro, which have the lowest rainfall totals, the reductions in rainfall could lead to a change in climate towards dryland, sub-humid and arid climate regions. It is projected that there will be a longer interval of days without rain and a reduction in the number of days with rain. This reduction could have a significant impact on the availability of water for energy generation and urban and agricultural supply in the state of Rio de Janeiro.
In contrast to the reduction in rainfall and the change in its distribution, the SRJ could suffer from an increase in EPEs. An increase in humid and extremely humid days is projected. This increase could lead to an increase in disasters associated with high rainfall, which is very common in the state of Rio de Janeiro. Disasters in the SRJ have major socio-environmental impacts and are generally linked to fatalities. The warmer climate contributes to an increase in the frequency, magnitude and duration of EPEs, which, in the case of the SRJ, can have incalculable impacts, given the EPEs that have already occurred in the state and their proportions.

Author Contributions

All authors contributed to this study’s conception and design. W.P.C.F., H.S.W. and R.C.D. conceived of the presented idea. W.P.C.F. and R.C.D. developed the theory and performed the computations. W.P.C.F. and H.S.W. verified the analytical methods. W.P.C.F. and H.S.W. encouraged the investigation and supervised the findings of this work. All authors have read and agreed to the published version of the manuscript.

Funding

This paper was funded by the Carlos Chagas Filho Foundation for Research Support of the State of Rio de Janeiro (FAPERJ) Process number: (SEI-260003/005647/2024).

Institutional Review Board Statement

This article does not contain any studies with human or animal participants performed by any of the authors.

Informed Consent Statement

All authors agreed with the content, gave explicit consent to submit and obtained consent from the responsible authorities at the institute/organization before the work was submitted.

Data Availability Statement

The datasets generated during and/or analyzed during the current study are available from the corresponding author on reasonable request.

Acknowledgments

We are grateful to the Federal Rural University of Rio de Janeiro (UFRRJ) for the scientific initiation scholarship (PVIF5008-2024).

Conflicts of Interest

The authors declare no conflicts of interest.

References

  1. Maynard, T.; Beecroft, N.; Gonzalez, S.; Restell, L.; Toumi, R. Catastrophe Modelling and Climate Change; Lloyd’s of London: London, UK, 2014. [Google Scholar]
  2. Wanderley, H.S.; Bunhak, A.C.d.S. Alteração da precipitação e do número de dias sem chuva na região Sul Fluminense no estado do Rio de Janeiro (Alteration in precipitation and number of days without rain in the southern region of Rio de Janeiro state). Rev. Bras. Geogr. Física 2016, 9, 2341–2353. [Google Scholar] [CrossRef]
  3. Regueira, A.O.; Wanderley, H.S. Changes in rainfall rates and increased number of extreme rainfall events in Rio de Janeiro city. Nat. Hazards 2022, 114, 3833–3847. [Google Scholar] [CrossRef]
  4. IPCC–Climate Change 2021: AR6 Synthesis Report. Contribution of Working Groups I, II and III to the Sixth Assessment Report of the Intergovernmental Panel on Climate Change. Issues 1–151. 2021. Available online: https://archive.ipcc.ch/pdf/assessment-report/ar5/syr/SYR_AR5_FINAL_full_wcover.pdf (accessed on 12 October 2024).
  5. Merz, B.; Blöschl, G.; Vorogushyn, S.; Dottori, F.; Aerts, J.C.; Bates, P.; Bertola, M.; Kemter, M.; Kreibich, H.; Lall, U.; et al. Causes, impacts and patterns of disastrous river floods. Nat. Rev. Earth Environ. 2021, 2, 592–609. [Google Scholar] [CrossRef]
  6. De Souza Santos, J.A.; Wanderley, H.S.; de Amorim, R.F.C.; Delgado, R.C.; Fernades, R.C. The longest multiannual drought in Northeastern Brazil. J. S. Am. Earth Sci. 2024, 143, 104976. [Google Scholar] [CrossRef]
  7. Lorentz, J.F.; Calijuri, M.L.; Marques, E.G.; Baptista, A.C. Multicriteria analysis applied to landslide susceptibility mapping. Nat. Hazards 2016, 83, 41–52. [Google Scholar] [CrossRef]
  8. Myhre, G.; Alterskjær, K.; Stjern, C.W.; Hodnebrog, Ø.; Marelle, L.; Samset, B.H.; Sillmann, J.; Schaller, N.; Fischer, E.; Schulz, M.; et al. Frequency of extreme precipitation increases extensively with event rareness under global warming. Sci. Rep. 2019, 9, 16063. [Google Scholar] [CrossRef]
  9. Fu, Y.; Mao, Y.; Wu, G. Event-based evaluation of urbanization impact on precipitation during the 1978–2021 warm season over eastern China. Urban Clim. 2024, 56, 102048. [Google Scholar] [CrossRef]
  10. Zhang, M.; Chen, Y.; Shen, Y.; Li, Y. Changes of precipitation extremes in arid Central Asia. Quaternário Int. 2017, 436, 16–27. [Google Scholar]
  11. Wanderley, H.S.; Fernandes, R.C.; de Carvalho, A.L. Aumento das temperaturas extremas na cidade do Rio de Janeiro e o desvio ocasionado durante um evento de El Niño intenso (Thermal change in the city of Rio de Janeiro and the deviation caused during an intense El Niño event). Rev. Bras. Geogr. Física 2019, 12, 1291–1301. [Google Scholar] [CrossRef]
  12. Machado, R.L.; Ceddia, M.B.; de Carvalho, D.F.; da Cruz, E.S.; Francelino, M.R. Spatial variability of maximum annual daily rain under different return periods at the Rio de Janeiro state, Brazil. Bragantia 2010, 69, 77–84. [Google Scholar]
  13. Pristo, M.V.D.J.; Dereczynski, C.P.; Souza, P.R.D.; Menezes, W.F. Climatologia de chuvas intensas no município do Rio de Janeiro. Rev. Bras. Meteorol. 2018, 33, 615–630. [Google Scholar] [CrossRef]
  14. Carvalho, L.V.; Wanderley, H.S. Risk identification of precipitation extremes due to climate change in the southern region of the state of Rio de Janeiro. Rev. Bras. Geogr. Física 2022, 15, 2073–2085. [Google Scholar] [CrossRef]
  15. Da Silva, F.P.; da Silva, A.S.; da Silva, M.G.A.J. Extreme rainfall events in the Rio de Janeiro city (Brazil): Description and a numerical sensitivity case study. Meteorol. Atmos. Phys. 2022, 134, 77. [Google Scholar] [CrossRef]
  16. Dourado, F.; Arraes, T.C.; Silva, M.F. O Megadesastre da Região Serrana do Rio de Janeiro--as Causas do Evento, os Mecanismos dos Movimentos de Massa e a Distribuição Espacial dos Investimentos de Reconstrução no Pós-Desastre. In Anuário do Instituto de Geociências; Universidade Federal do Rio de Janeiro: Rio de Janeiro, Brazil, 2012. [Google Scholar]
  17. Ehrlich, M.; Luiz, B.J.; Mendes, C.G.; Lacerda, W.A. Triggering factors and critical thresholds for landslides in Rio de Janeiro-RJ, Brazil. Nat. Hazards 2021, 107, 937–952. [Google Scholar] [CrossRef]
  18. Pereira, R.M.S.; Wanderley, H.S.; Delgado, R.C. Homogeneous regions for rainfall distribution in the city of Rio de Janeiro associated with the risk of natural disasters. Nat. Hazards 2022, 111, 333–351. [Google Scholar] [CrossRef]
  19. METSUL. #CriseClimáticaNoRJ: Regiões Norte e Noroeste do Estado do Rio Sofrem Com Secas e Fortes Chuvas—Diário do Rio de Janeiro (diariodorio.com). Available online: https://metsul.com/2024-01-14-chuva-rio-de-janeiro-deslizamentos/ (accessed on 3 August 2024).
  20. Debortoli, N.S.; Camarinha, P.I.M.; Marengo, J.A.; Rodrigues, R.R. An index of Brazil’s vulnerability to expected increases in natural flash flooding and landslide disasters in the context of climate change. Nat. Hazards 2017, 86, 557–582. [Google Scholar]
  21. Swart, N.C.; Cole, J.N.; Kharin, V.V.; Lazare, M.; Scinocca, J.F.; Gillett, N.P.; Anstey, J.; Arora, V.; Christian, J.R.; Hanna, S.; et al. The Canadian earth system model version 5 (CanESM5. 0.3). Geosci. Model Dev. 2019, 12, 4823–4873. [Google Scholar] [CrossRef]
  22. Tatebe, H.; Ogura, T.; Nitta, T.; Komuro, Y.; Ogochi, K.; Takemura, T.; Sudo, K.; Sekiguchi, M.; Abe, M.; Saito, F.; et al. Description and basic evaluation of simulated mean state, internal variability, and climate sensitivity in MIROC6. Geosci. Model Dev. 2019, 12, 2727–2765. [Google Scholar] [CrossRef]
  23. Mauritsen, T.; Bader, J.; Becker, T.; Behrens, J.; Bittner, M.; Brokopf, R.; Brovkin, V.; Claussen, M.; Crueger, T.; Esch, M.; et al. Developments in the MPI-M Earth System Model version 1.2 (MPI-ESM1.2) and its response to increasing CO2. J. Adv. Model. Earth Syst. 2019, 11, 998–1038. [Google Scholar] [CrossRef]
  24. Zhang, X.; Yang, F. RClimDex (1.0)—User Manual; Climate Research Branch Environment Canada Downsview: Toronto, ON, Canada, 2004. [Google Scholar]
  25. Luiz-Silva, W.; Oscar-Júnior, A.C. Climate extremes related with rainfall in the State of Rio de Janeiro, Brazil: A review of climatological characteristics and recorded trends. Nat. Hazards 2022, 114, 713–732. [Google Scholar] [CrossRef]
  26. Lucena, F. #CriseClimáticaNoRJ: Regiões Norte e Noroeste do estado do Rio sofrem com secas e fortes chuvas. Diário do Rio de Janeiro, 9 August 2024. [Google Scholar]
  27. De Moraes, J.B.; Wanderley, H.S.; Delgado, R.C. Areas susceptible to desertification in Brazil and projected climate change scenarios. Nat. Hazards 2023, 116, 1463–1483. [Google Scholar] [CrossRef]
  28. Silva, W.L.; Dereczynski, C.P. Caracterização climatológica e tendências observadas em extremos climáticos no estado do Rio de janeiro. Anuário Inst. Geociências 2014, 37, 123–138. [Google Scholar] [CrossRef]
  29. Zscheischler, J.; Martius, O.; Westra, S.; Bevacqua, E.; Raymond, C.; Horton, R.M.; van den Hurk, B.; AghaKouchak, A.; Jézéquel, A.; Mahecha, M.D.; et al. A typology of compound weather and climate events. Nat. Rev. Earth Environ. 2020, 1, 333–347. [Google Scholar] [CrossRef]
  30. O’Gorman, P.A.; Schneider, T. The physical basis for increases in precipitation extremes in simulations of 21st-century climate change. Proc. Natl. Acad. Sci. USA 2009, 106, 14773–14777. [Google Scholar] [CrossRef]
  31. Pfahl, S.; O’gorman, P.A.; Fischer, E.M.; O’Gorman, P.A.; Fischer, E.M. Understanding the regional pattern of projected future changes in extreme precipitation. Nat. Clim. Change 2017, 7, 423–427. [Google Scholar] [CrossRef]
  32. Chernokulsky, A.; Kozlov, F.; Zolina, O.; Bulygina, O.; Mokhov, I.I.; Semenov, V.A. Observed changes in convective and stratiform precipitation in Northern Eurasia over the last five decades. Environ. Res. Lett. 2019, 14, 045001. [Google Scholar] [CrossRef]
  33. Alves, G.J.; Mello, C.R.; Guo, L.; Thebaldi, M.S. Natural disaster in the mountainous region of Rio de Janeiro state, Brazil: Assessment of the daily rainfall erosivity as an early warning index. Int. Soil Water Conserv. Res. 2022, 10, 547–556. [Google Scholar] [CrossRef]
  34. Alves, G.J.; Mello, C.R.; Guo, L. Rainfall disasters under the changing climate: A case study for the Rio de Janeiro mountainous region. Nat. Hazards 2023, 116, 1539–1556. [Google Scholar] [CrossRef]
  35. Alcântara, E.; Marengo, J.A.; Mantovani, J.; Londe, L.; San, R.L.Y.; Park, E.; Lin, Y.N.; Mendes, T.; Cunha, A.P.; Pampuch, L.; et al. Deadly disasters in Southeastern South America: Flash floods and landslides of February 2022 in Petrópolis, Rio de Janeiro. Nat. Hazards Earth Syst. Sci. 2023, 23, 1157–1175. [Google Scholar] [CrossRef]
  36. Fardin, S.C.S.G.; Aguilar-Muñoz, V.; Dias, L.F.; Tanus, B.J.M.; do Amaral Cunha, A.P.M. Identificação de eventos extremos de precipitação e desastres deflagrados por chuvas no município de Petrópolis-RJ. Sustain. Debate 2023, 14, 84–113. [Google Scholar] [CrossRef]
  37. Holender, B.V.; Santos, E.B. Análise de tendência dos eventos de precipitação intensa no sudeste do Brasil. Rev. Bras. Climatol. 2023, 32, 584–606. [Google Scholar] [CrossRef]
  38. Néto, N.C.G.; Santos, E.B. Análise espaço-temporal dos eventos de precipitação intensa no Estado do Rio de Janeiro. Rev. Bras. Meteorol. 2022, 37, 89–97. [Google Scholar] [CrossRef]
  39. Lima, S.S.; Armond, N.B. Rainfall in Metropolitan Region of Rio de Janeiro: Characterization, extreme events, and trends. Soc. Nat. 2022, 34, e64770. [Google Scholar] [CrossRef]
  40. Coelho, L.A.F.; Nunes, A.B. Eventos Recentes de Chuva Intensa na Cidade do Rio de Janeiro: Análise Sinótica. Rev. Bras. Geogr. Física 2020, 13, 994–1012. [Google Scholar]
  41. Allen, M.R.; Ingram, W.J. Constraints on future changes in climate and the hydrologic cycle. Nature 2002, 419, 224–232. [Google Scholar] [CrossRef]
  42. Pereira, V.C.M.; Bertolino, A.V.F.A.; Kede, M.L.F.M.; Delazeri, E.M. As chuvas de verão sob a influência do fenômeno El Niño, entre 2005 e 2018, e o risco de inundações no município de São Gonçalo-RJ (Brasil). Territorium 2021, 28, 27–41. [Google Scholar] [CrossRef]
Figure 1. State of Rio de Janeiro.
Atmosphere 16 00358 g001
Figure 2. Average values for PRCPTOT (mm) for the current period ((A). 2000–2020) and the future for the SSP 4.5 ((B). 2021–2040, (C). 2041–2060, (D). 2061–2080 and (E). 2081–2100) and SSP 8.5. ((F). 2021–2040, (G). 2041–2060, (H). 2061–2080 and (I). 2081–2100) scenarios.
Atmosphere 16 00358 g002
Figure 3. Total annual precipitation anomaly (PRCPTOT, mm) for the future climate change scenarios: SSP 4.5 ((A). 2021–2040, (B). 2041–2060, (C). 2061–2080 and (D). 2081–2100) and SSP 8.5 ((E). 2021–2040, (F). 2041–2060, (G). 2061–2080 and (H). 2081–2100).
Atmosphere 16 00358 g003
Figure 4. Average values for CDD (days) for the current period ((A). 2000–2014) and the future for scenarios SSP 4.5 ((B). 2021–2040, (C). 2041–2060, (D). 2061–2080 and (E). 2081–2100) and SSP 8.5 ((F). 2021–2040, (G). 2041–2060, (H). 2061–2080 and (I). 2081–2100).
Atmosphere 16 00358 g004
Figure 5. Consecutive dry days (CDD, days) anomaly for the future climate change scenarios: SSP 4.5 ((A). 2021–2040, (B). 2041–2060, (C). 2061–2080 and (D). 2081–2100) and SSP 8.5 ((E). 2021–2040, (F). 2041–2060, (G). 2061–2080 and (H). 2081–2100).
Atmosphere 16 00358 g005
Figure 6. Average values for CWD (days) for the current period ((A). 2000–2014) and the future scenarios SSP 4.5 ((B). 2021–2040, (C). 2041–2060, (D). 2061–2080 and (E). 2081–2100) and SSP 8.5 ((F). 2021–2040, (G). 2041–2060, (H). 2061–2080 and (I). 2081–2100).
Atmosphere 16 00358 g006
Figure 7. Consecutive wet days (CWD, days) anomaly for the future climate change scenarios: SSP 4.5 ((A). 2021–2040, (B). 2041–2060, (C). 2061–2080 and (D). 2081–2100) and SSP 8.5 ((E). 2021–2040, (F). 2041–2060, (G). 2061–2080 and (H). 2081–2100).
Atmosphere 16 00358 g007
Figure 8. Average values of maximum 1-day precipitation (Rx1day, mm) for the current period ((A). 2000–2014) and the future for scenarios SSP 4.5 ((B). 2021–2040, (C). 2041–2060, (D). 2061–2080 and (E). 2081–2100) and SSP 8.5 ((F). 2021–2040, (G). 2041–2060, (H). 2061–2080 and (I). 2081–2100).
Atmosphere 16 00358 g008
Figure 9. Maximum 1-day precipitation anomaly (Rx1day, mm) for the future climate change scenarios: SSP 4.5 ((A). 2021–2040, (B). 2041–2060, (C). 2061–2080 and (D). 2081–2100) and SSP 8.5 ((E). 2021–2040, (F). 2041–2060, (G). 2061–2080 and (H). 2081–2100).
Atmosphere 16 00358 g009
Figure 10. Average values of maximum 5-day precipitation (Rx5day, mm) for the current period ((A). 2000–2014) and the future for scenarios SSP 4.5 ((B). 2021–2040, (C). 2041–2060, (D). 2061–2080 and (E). 2081–2100) and SSP 8.5 ((F). 2021–2040, (G). 2041–2060, (H). 2061–2080.and (I). 2081–2100).
Atmosphere 16 00358 g010
Figure 11. Maximum 5-day precipitation anomaly (Rx5day, mm) for the future climate change scenarios: SSP 4.5 ((A). 2021–2040, (B). 2041–2060, (C). 2061–2080 and (D). 2081–2100) and SSP 8.5 ((E). 2021–2040, (F). 2041–2060, (G). 2061–2080 and (H). 2081–2100).
Atmosphere 16 00358 g011
Table 1. Climate change detection indices used.
IndexIndexDefinitionsUnits
PRCPTOTAnnual total precipitation on wet daysLet RRij be the daily wet day (≥1 mm) precipitation amount on day i in period j.mm
CDDMaximum number of consecutive days with RR < 1 mmLet RRij be the daily precipitation amount on day i in period j. Count the largest number of consecutive days where RRij < 1 mm.days
CWDMaximum number of consecutive days with RR ≥ 1 mmLet RRij be the daily precipitation amount on day i in period j. Count the largest number of consecutive days where RRij 1 mm.days
Rx1dayMaximum 1-day precipitation amountLet RRij be the daily precipitation amount on day I in period j. The maximum 1-day value for period j is Rx1dayj = max (RRij)mm
Rx5dayMaximum consecutive 5-day precipitationLet RRkj be the precipitation amount for the 5-day interval ending k, period j. Then, maximum 5-day values for period j are Rx5dayj = max (RRkj)mm
Disclaimer/Publisher’s Note: The statements, opinions and data contained in all publications are solely those of the individual author(s) and contributor(s) and not of MDPI and/or the editor(s). MDPI and/or the editor(s) disclaim responsibility for any injury to people or property resulting from any ideas, methods, instructions or products referred to in the content.

