Article

Aerodynamic and Dry Deposition Effects of Roadside Trees on NOx Concentration Changes on Roadways and Sidewalks

1
Department of Environmental and Biomedical Convergence, Kangwon National University, Chuncheon 24341, Republic of Korea
2
Center for Sustainable Environment Research, Korea Institute of Science and Technology, Seoul 02792, Republic of Korea
3
Climate and Air Quality Research Department, Air Quality Research Division, National Institute of Environmental Research, Incheon 22689, Republic of Korea
4
Institute of Occupation and Environment, Korea Worker’s Compensation & Welfare Service, Incheon 21417, Republic of Korea
5
Department of Environmental Science, Kangwon National University, Chuncheon 24341, Republic of Korea
*
Author to whom correspondence should be addressed.
Atmosphere 2025, 16(3), 344; https://doi.org/10.3390/atmos16030344
Submission received: 12 February 2025 / Revised: 10 March 2025 / Accepted: 14 March 2025 / Published: 19 March 2025
(This article belongs to the Special Issue Air Quality in Metropolitan Areas and Megacities (Second Edition))

Abstract

:
This study analyzes changes in NOx concentrations due to the aerodynamic and dry deposition effects of roadside trees in the Jongno area, a central business district of Seoul, Republic of Korea, using a computational fluid dynamics (CFD) model. The simulation results indicate that the on-road NOx concentration was slightly increased (2.09%) due to the aerodynamic effect of roadside trees. However, the dry deposition effect of roadside trees had a greater impact on reducing NOx concentrations (−2.77%) along sidewalks. It was observed that the reduction in NOx concentration due to the dry deposition effect of roadside trees was likely to offset the increase in NOx concentrations due to the aerodynamic effect of roadside trees, resulting in an overall decrease in NOx concentrations. Furthermore, sensitivity tests showed that the increase in NOx concentrations due to the aerodynamic effects of roadside trees was intensified along sidewalks when ambient wind speeds were high, while the decrease in NOx concentration was proportional to the deposition velocity of roadside trees. Therefore, roadside trees should be planted where aerodynamic effects do not significantly increase NOx concentrations in order to improve near-road air quality.

1. Introduction

Urban air quality has become one of the most critical environmental issues in modern society due to the public’s increasing awareness of air pollution. High pollutant concentrations pose serious health risks to urban residents, resulting in growing interest in air quality management. The complexity of airflow in urban areas is primarily caused by various obstacles, including building density, building-to-road ratio, roof shapes, and roadside trees, which generate turbulent flow and influence pollutant dispersion [1,2,3,4,5,6]. Such complex airflow patterns reduce urban ventilation, which is one of the key factors contributing to increased pollutant concentrations in urban environments. Among various pollution sources, vehicular emissions are the dominant contributors, with nitrogen oxides (NOx) being among the most emitted pollutants. In particular, roadside pollutant concentrations tend to be high due to vehicle emissions and airflow alterations induced by surrounding buildings [7,8]. According to the WHO, 80% of urban residents are exposed to air pollution levels that exceed the recommended air quality standards. Consequently, effective strategies to mitigate roadside pollutant concentrations are urgently needed. While the most effective solution would be reducing vehicular emissions, this approach is challenging to implement in the short term.
One alternative strategy to mitigate urban air pollution exposure is the implementation of green infrastructure. Green infrastructure includes fences, trees, parks, green roofs, and vegetated spaces, all of which provide environmental benefits and have been widely adopted by local governments [9,10]. The WHO has also recommended the integration of green infrastructure as a key tool in urban planning in order to enhance public health. In recent years, numerous studies have explored the application of various types of green infrastructure in air quality improvement efforts [11,12,13,14,15,16,17].
Among green infrastructure elements, roadside trees play a crucial role in urban air pollution control by providing multiple environmental benefits. These include aerodynamic effects, which reduce wind speed [17,18]; dry deposition effects, which remove pollutants through adsorption and deposition onto leaves, building walls, and road surfaces [19,20,21]; and cooling effects via transpiration [22,23]. However, the aerodynamic effects of trees can also increase wind roughness, disrupt airflow, and result in pollutant accumulation in densely vegetated areas [24,25,26,27]. In contrast, the dry deposition effect in vegetation facilitates air pollutant removal by capturing particulate matter and gaseous pollutants through leaf friction and stomatal respiration [28,29].
The impact of trees on air quality has been extensively analyzed through both numerical simulations and field measurements. Fantozzi et al. [30] conducted field measurements in an urban park in Siena, Italy, demonstrating that trees effectively reduce roadside air pollution. Similarly, Ren et al. [31] performed roadside field measurements in Xi’an, China, and found that adjusting tree spacing significantly reduced pedestrian exposure to vehicular pollutants. These studies, in addition to others, have consistently shown that urban trees play a beneficial role in improving air quality [30,31,32,33].
However, some studies highlight the potential limitations of trees in air quality management. Salmond et al. [26] observed that pollutant dispersion was hindered beneath tree canopies in Auckland, New Zealand, resulting in pollutant accumulation. Moreover, field measurements indicate that the impact of trees on air quality varies depending on urban morphology, meteorological conditions, and vegetation characteristics. To analyze these complex interactions, recent studies have increasingly used computational fluid dynamics (CFD) models to assess the effects of trees in urban street canyons. Jeanjean et al. [27] conducted numerical simulations on Oxford Street, London, and found that, depending on the meteorological conditions (wind direction and speed), air quality could improve by up to 6.7% or deteriorate by 4.3%. Similarly, Chen et al. [34] reported that pollutant concentrations increased by up to 106% or decreased by 4.4% depending on building configurations and wind direction, emphasizing the need for proper tree placement in order to enhance urban air quality. Tang et al. [14] and Huang et al. [35] further revealed that roadside tree planting and building height are critical factors that determine natural ventilation efficiency in urban street canyons.
Collectively, these studies suggest that the effects of urban trees on air quality are highly situation-dependent, and they are influenced by building configurations, tree placement, and local meteorological conditions. Therefore, this study aims to evaluate the impact of roadside trees on air quality in Seoul, Republic of Korea, one of the most densely populated urban areas. To achieve this, a CFD model was employed to simulate detailed street-scale environments [36], incorporating vehicular emissions, terrain, building arrangements, and tree morphology. To ensure the validity and reliability of the CFD model results, on-road NOx concentrations were measured using a mobile laboratory (ML) along major roadways within the study area [37,38]. Furthermore, sensitivity analyses were conducted to quantify the aerodynamic and dry deposition effects of roadside trees by assessing NOx concentration variations in response to different dry deposition velocities and ambient wind speeds on both the roadways and sidewalks.

2. Materials and Methods
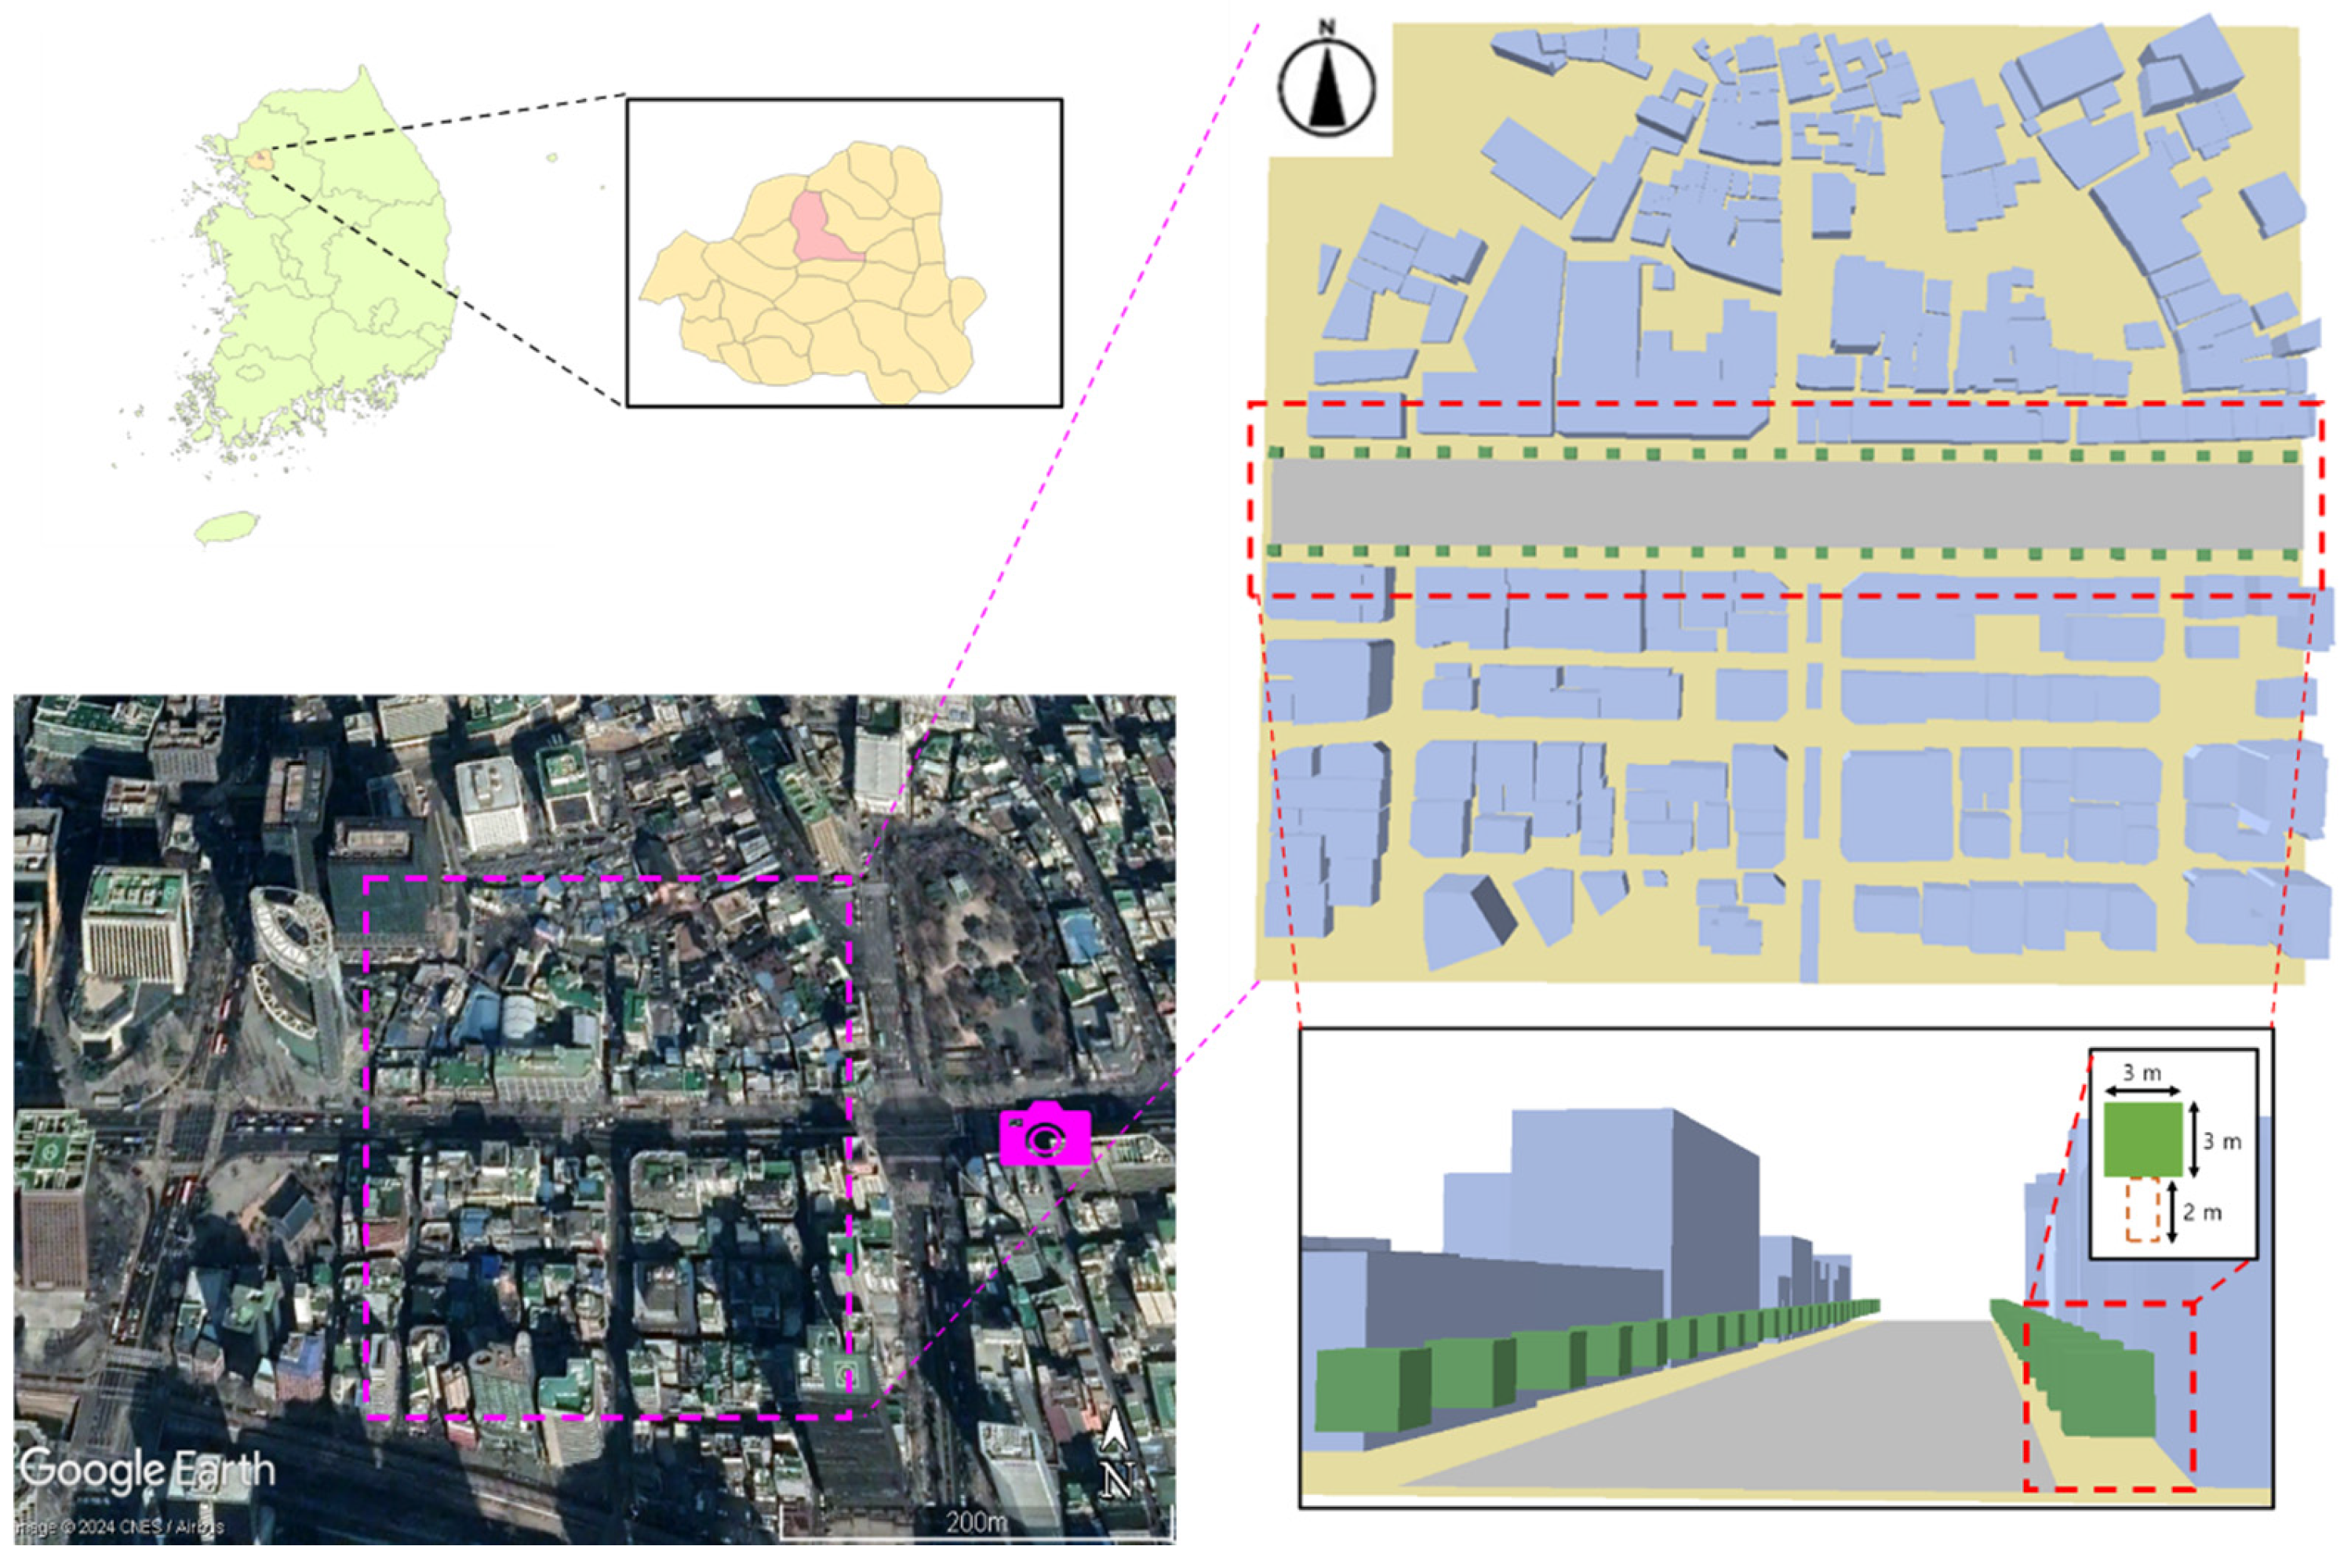
2.1. Study Area

The study area is located in Jongno-gu (37.569–37.571° N, 126.984–126.987° E), one of the central business districts in Seoul, Republic of Korea. This area is known for its high pollutant concentrations among the key urban districts in Seoul [38,39]. It is a high-pedestrian-traffic area due to the presence of office buildings, major tourist attractions, parks, and traditional markets. Additionally, an average of approximately 45,000 vehicles passes through this area daily on weekdays, indicating high vehicular traffic from the Seoul Transportation Operation and Information Service (TOPIS) [40]. The average building height in the area is 7 m, but buildings along the roadside range from approximately 3 to 28 m in height (Figure 1). The trees in the area were planted in a single row along the road edges, spaced approximately 3 to 10 m apart from the neighboring ones.

2.2. Field Measurements

NOx concentrations in the study area were measured using a mobile laboratory (ML) that was previously employed in several studies to analyze on-road pollution levels [37,38,41,42,43]. The NOx analyzer (Environnement S.A. AC32M, Poissy, France) installed in the ML operates based on the chemiluminescence detection method. It utilizes a converter to reduce NO2 to NO, allowing for the determination of total NOx (NO + NO2). The NOx analyzer carries out measurements at five-second intervals with a sampling flow rate of 1.2 L/min. The sampling inlet is positioned approximately 2 m above ground level, and air is drawn at a constant velocity using an external pump. The analyzer is mounted on the ML, and during measurements, a minimum distance of 10 m is maintained from the preceding vehicle. The accuracy of the NOx analyzer is ±1%. The ML is equipped with GPS, allowing it to collect data with respect to speed, latitude, and longitude simultaneously. Therefore, the ML used in this study can measure detailed pollutant levels on roadways, reflecting the actual traffic flow and vehicle emission environment of the study area. The measurements with the ML were conducted at 07:00 and 09:00 on 28 January and 14:00 on 29 January (both weekdays in 2019). The ML took approximately 210 s to drive through the study area from the west to the east. To minimize the ML’s self-emission impact and the influence of preceding vehicles, only data collected at speeds above 5 km h−1 were used, and a minimum distance of 10 m was maintained from any vehicle ahead while driving. The traffic volume was recorded concurrently with the ML measurements at the point indicated by the camera icon in Figure 1. To minimize the effect of traffic signals on vehicle flow, a single count of traffic volume included at least two complete traffic signal cycles. The recorded traffic volume data were used to calculate emissions for the CFD model’s simulation.

2.3. CFD Model Setup

The numerical model used in this study is a CFD model capable of realistically simulating three-dimensional wind flow and pollutant dispersion on roadways. The CFD model assumes non-rotational, incompressible airflow and employs the Semi-Implicit Method for Pressure-Linked Equation (SIMPLE) algorithm to solve the pressure equation implicitly, linking it with the Reynolds-averaged Navier−Stokes (RANS) equations [44,45]. Turbulence is resolved using the Renormalization Group (RNG) kε turbulence closure scheme. The governing equations of the CFD model—momentum, turbulent kinetic energy, turbulent kinetic energy dissipation rate, and transport equations—are as follows (Equations (1)–(3)).
( U i ) t + U i u x j = 1 ρ P * x i + δ i 3 T T 0 T 0 + v 2 U i x j x j x j u i u j ¯ + S u
k t + U i k x j = u i u j ¯ U i x j + δ 3 j g ρ T u j ¯ + x j K m σ k k x j ε + S k
ε t + U i ε x j = C ε 1 ε k u i u j ¯ u x j + C ε 1 ε k δ 3 j g ρ T u j ¯ + x j K m σ ε ε x j C ε 2 ε 2 k R + S ε
Here, t represents time; U i is the mean velocity in the i direction; P * is the pressure difference; T is the air temperature; v is the air viscosity coefficient; K m is the thermal diffusivity of the air; g is the gravitational acceleration; ρ is the air density (kg m−3); and δ is the Kronecker delta. The transport equation of the pollutant is solved as shown below (Equation (4)). R is an additional term added to the standard kε model to account for stress in non-equilibrium states [46].
C t + U j C x j = D 2 C x j d x j + x j K c C x j + S d
Here, C represents the NOx concentration, D is the molecular viscosity, and K c is the turbulent diffusion coefficient for the pollutants.
In this study, the aerodynamic effect of trees in the CFD model is incorporated by adding a sink term S u (Equation (5)) to the momentum equation (Equation (1)), and source terms S k and S ε (Equations (6) and (7)) are added to the turbulence-related equations (Equations (2) and (3)). The dry deposition effect of trees is incorporated by adding a sink term S d to the transport equation of the pollutant (Equation (4)). S d reflects the reduction in pollutants due to respiration occurring in the stomata of leaves. During the daytime, the glucose–alanine cycle takes place in the leaves. At this time, the stomata absorb NO2 and produce NO3 or NO2 [47,48]. In other words, the equation for NO2 absorption in leaves is provided via Equation (8) [49].
Terms S u , S k , S ε , and S d , which are added to the corresponding original governing equations, have been evaluated and verified in previous studies [32,50,51,52,53,54,55,56,57].
S u = L A D C d U u i ρ
S k = ρ L A D C d ( β p U 3 β d U k )
S ε = C ε ε k S k
S d = L A D V d C
Here, L A D is the leaf area density (m2·m−3); C d is the drag coefficient (=0.2); U (m· s−1) is the wind speed; U i (m·s−1) is the wind speed component in the ith direction; β p is the ratio of mean kinetic energy converted to turbulent kinetic energy (=1.0); β d is the coefficient for turbulence dissipation (=6.5); C ε is a model coefficient (=1.26); and V d (cm m−3) is the dry deposition velocity. In this study, the aerodynamic and dry deposition effects of trees are only applied to grid cells containing the tree canopy.
The input data for the CFD model include topographic data, initial meteorological boundary conditions, and vehicle emission data. The topographic data input to the CFD model was prepared using a digital map provided by the National Geographic Information Institute to closely represent the buildings and terrain (Figure 1). The initial meteorological boundary data for the CFD model were obtained from the Unified Model-Local Data Assimilation and Prediction System (UM-LDAPS) used operationally by the Korea Meteorological Administration, which includes wind components ( u and v ), air temperatures, and surface temperature data. Air and surface temperatures were utilized in the CFD model to reflect the thermal turbulence effects caused by atmospheric instability and surface heating. The wind components and air temperature data were extracted from the UM-LDAPS modeling system at heights corresponding to the CFD vertical domain (i.e., 10, 154, and 360 m). Then, the extracted UM-LDAPS data were linearly interpolated to all the CFD model’s vertical grids. For example, the wind direction, wind speed, and air temperature were 4°, 2.6 m·s−1, and 3.4 °C at 10 m; 263°, 7.9 m·s−1, and 1.9 °C at 154 m; and 271°, 14.5 m·s−1, and 0.1 °C at 360 m, respectively, at 09:00 on 28 January 2019. The vehicle emission data for the CFD model were calculated as emission rates, Cemis (ppb·s−1), using Equation (9).
C e m i s = E × D × N G × V
Here, E is the emission factor (g·km−1·car−1) provided by the Ministry of the Environment’s Clean Air Policy Support System (CAPSS) [58]; D (km) is the road length in the CFD model domain, which is 300 m along the x-axis; N (car·s−1) is the number of vehicles per second; G (#) is the number of grid cells representing the area of roadways; and V (m3·#−1) is the volume per grid cell. The unit of variable C e m i s (g·m−3·s−1) calculated from Equation (9) was converted to ppb·s−1 by multiplying the molecular weight of NOx and the volume of the grid. The molecular weight of NOx was assumed to be 34 g·mol−1 based on a 7:3 ratio of NO to NO2, which was based on the results of Kim et al. [59]. They measured NO, NO2, and NOx emissions from Euro 5 and 6 diesel vehicles at various driving speeds. The NOx molecular weight was calculated using measurement data corresponding to the driving speed closest to the average speed of vehicles (i.e., 24 km·h−1) in the downtown area of Seoul. We categorized the vehicle counts into vehicle types (passenger car, taxi, SUV, truck, and bus) based on the data recorded at the location, as shown in Figure 1. Overall, the initial meteorological input data and emission rates used in the CFD model are summarized in Table 1.
The CFD model simulations were conducted at 07:00 and 09:00 on 28 January 2019, and at 14:00 on 29 January 2019 according to the ML measurement data. This winter season experienced weak thermal heating effects, and there were higher NOx concentrations on the roadways compared to the concentrations in other seasons. The simulation domain was centered on the road to assess the impact of the roadside trees. Additionally, the domain’s dimension ( x × y × z ) was 300 m × 300 m × 372 m, with a horizontal grid size of 1 m. The vertical grid size within the domain was set to 1 m up to the maximum building height (i.e., 28 m), with a scaling factor of 1.05 applied to the vertical grid spacing above the height. The pollutant simulated in the CFD model was NOx, which is the most commonly emitted species from vehicular sources [60], and it is assumed to be a non-reactive gas without chemical reactions. The NOx emissions in the CFD model were set to be released at a height of 0.5 m, similarly to vehicle exhaust heights. The time step for integration into the CFD model was 0.08 s, with a total simulation time of 1800 s. The CFD model’s results were averaged over 1500–1800 s, the period when the simulation results reached a steady state.
The CFD model scenarios in this study were divided into a realistic scenario for comparison with the field measurements using the ML (noAero_noDep) and three hypothetical scenarios (Aero, Dep, and Aero_Dep) to examine the aerodynamic and dry deposition effects of roadside trees, as shown in Table 2. The noAero_noDep scenario does not include either effect. The Aero_Dep, Aero, and Dep scenarios were configured, as shown in Table 2, to assess the impact of the aerodynamic and dry deposition effects on the NOx concentration. In the Aero_Dep, Aero, and Dep scenarios, the tree canopies were located 2 m above ground level, with a spacing of 10 m between trees. There were 50 identical trees with a canopy volume of 27 m3 in the CFD model domain. Tree trunks were not represented in the model (Figure 1). The tree species was assumed to be ginkgo, which constitutes 70% of the roadside trees in Seoul. The leaf area density (LAD) of ginkgo was set to 1.20 m−2·m−3, as indicated in Ref. [61]. In the Aero_Dep and Dep scenarios, the NOx dry deposition velocity of the ginkgo trees was assumed to be 0.5 cm·s−1, as specified in Ref. [54].
In addition, seven sensitivity scenarios were configured, as shown in Table 3, to examine the sensitivity of the roadside tree effects relative to wind speed and dry deposition velocity. Scenarios Aero_Ctrl ( W S i n 2 ) and Aero_Ctrl ( W S i n 3 ) were set to assess the aerodynamic sensitivity of the trees relative to changes in wind speeds. Scenarios Dep_Ctrl ( W S i n 2 ) and Dep_Ctrl ( W S i n 3 ) were set to assess the sensitivity of the dry deposition effect of trees relative to changes in wind speeds. Finally, scenarios Dep_Ctrl (Dep0.125), Dep_Ctrl (Dep0.5), and Dep_Ctrl (Dep1.0) were set to examine the sensitivity of the dry deposition effect of trees relative to changes in the deposition velocity. Here, W S i n × 2 and W S i n × 3 indicate that the wind speed at the initial and boundary conditions in the CFD model are doubled and tripled, respectively, while the numbers in Dep0.125, Dep0.5, and Dep1.0 represent the dry deposition velocities of the trees in the CFD model.

3. Results and Discussion

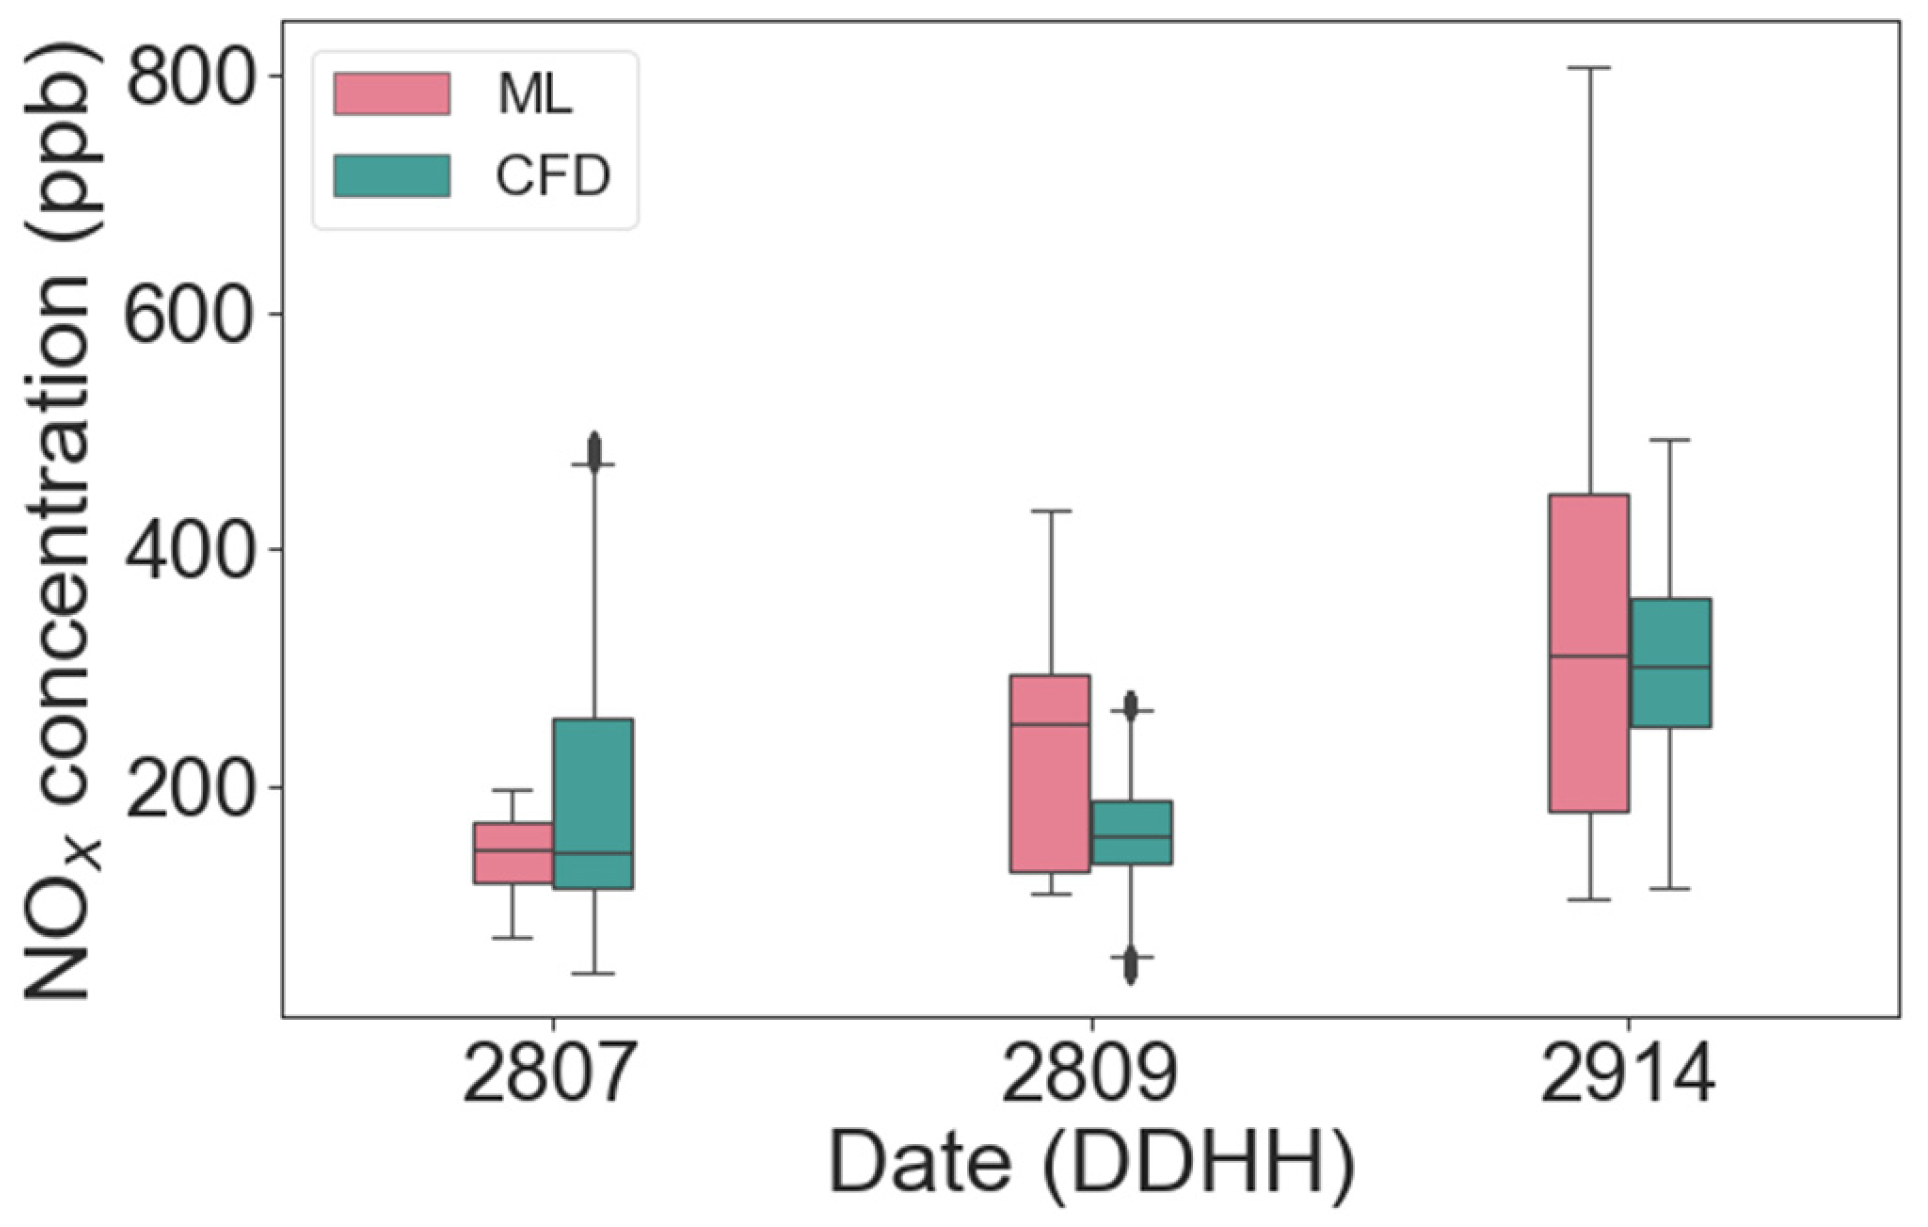
3.1. Validation of CFD Model

To verify the effectiveness of the CFD model, the NOx concentrations measured via the ML in the study area were compared with the CFD model results using a box plot (Figure 2). The CFD model results in the noAero_noDep scenario were used for validation. The CFD model results considered the area measured via the ML, specifically the road segments (x-axis: 0–300 m; y-axis: 134–162 m (Figure 3)) and at a height of 1.5 m. At 07:00 on 28 January, the CFD model results showed greater variability than the ML measurements, but the median values of the ML measurements and the CFD model results were similar, at 148.8 ppb and 144.8 ppb, respectively. At 09:00 on 28 January, the CFD model exhibited a slightly underestimated distribution compared to the other dates. The median values were 267.3 ppb for the ML measurements and 159.2 ppb for the CFD model results. At 14:00 on 29 January, the ML measurements showed greater variabilities than the CFD model results, but their median values were similar to each other, at 307.2 ppb and 301.2 ppb, respectively. While the CFD model tended to slightly underestimate NOx concentrations, it still provided a reasonable simulation of the NOx concentrations in the study area. The slight discrepancy between the field measurements and CFD model results might be attributed to differences in traffic volumes between the area where the traffic was recorded and the modeling area. In this study, the traffic volumes in the study area were quantified by converting a traffic count from a 5 min video recording into an hourly traffic volume rather than fully using a one-hour recording. Additionally, the absence of a chemical mechanism in the CFD model might have contributed to some uncertainties. Nevertheless, the CFD model reasonably captured the NOx concentration patterns within the study area.

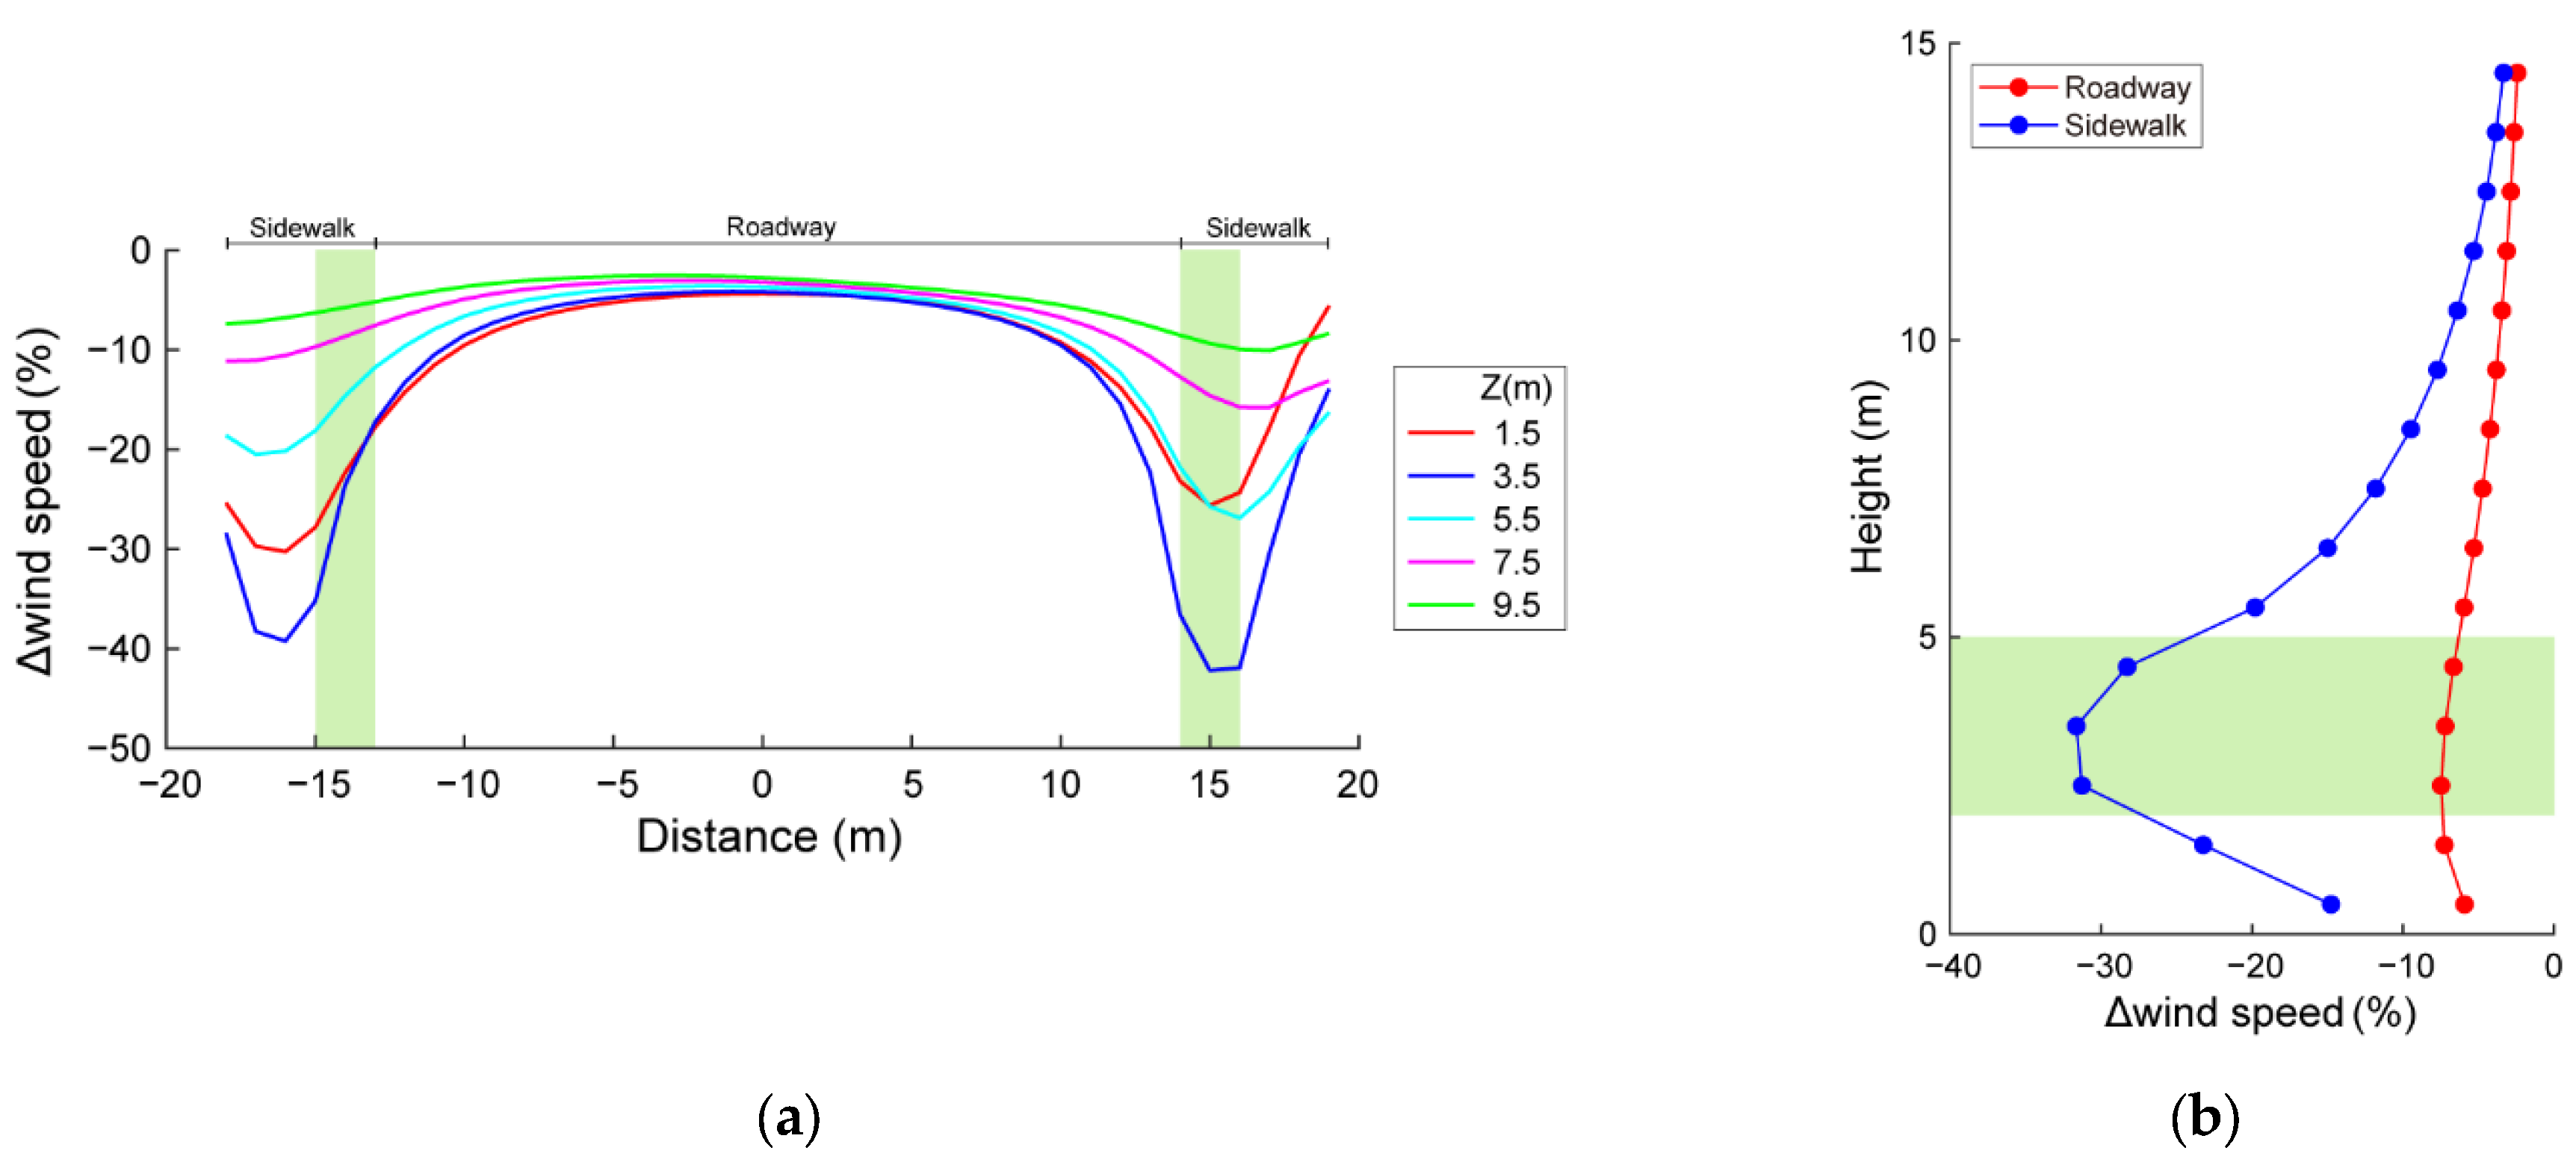
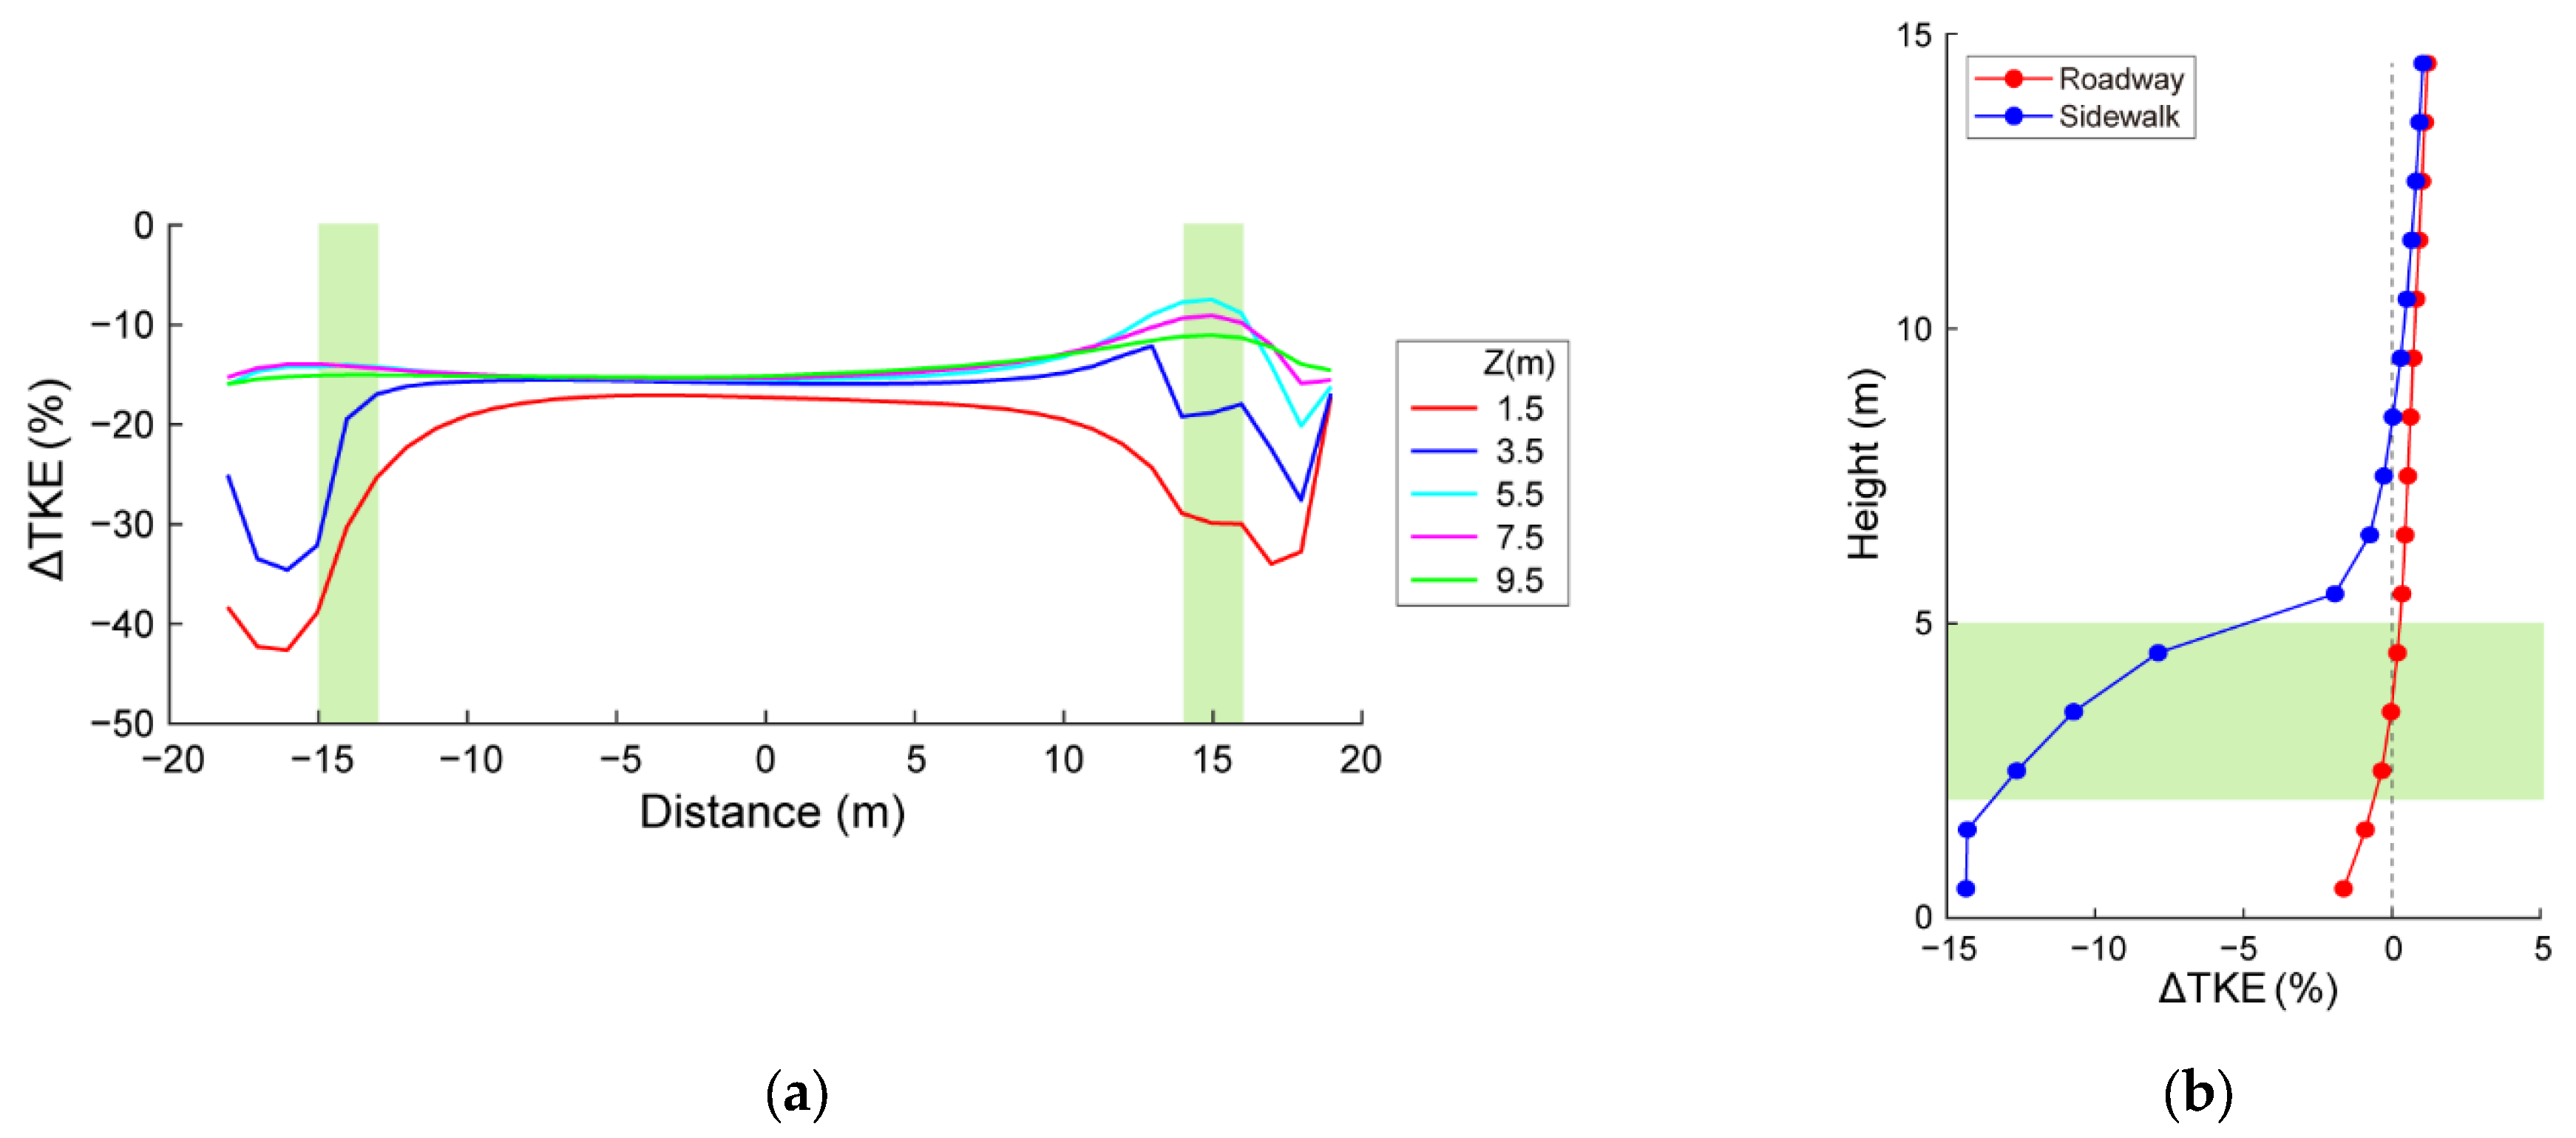
3.2. Effects of Roadside Trees on NOx Concentration Distribution

This study analyzed the NOx concentration changes and wind speed variations for each scenario, expressed as ΔNOx, ΔWindspeed, and ΔTKE (turbulence kinetic energy) (Equation (10)). Additionally, ΔNOx, ΔWindspeed, and ΔTKE were calculated separately on the roadways and sidewalks, with the sidewalk area defined as a region of 5 m width from the edge of the road.
N O x , W i n d s p e e d , T K E % = ( S i n o A e r o _ n o D e p ) n o A e r o _ n o D e p × 100
Here, S i represents scenarios other than the noAero_noDep scenario. For example, the NOx concentration change rate (ΔNOx) due to the aerodynamic or dry deposition effects of trees was calculated using the Aero_Dep or noAero_noDep scenario, respectively.
The impact of the trees on the NOx concentration at a pedestrian height (1.5 m) in the study area is assessed in Figure 3, which shows the NOx concentration distribution and ΔNOx distribution averaged over 07:00 and 09:00 on 28 January and 14:00 on 29 January.
High NOx concentration areas in the study area appeared at 150–200 m relative to the x-axis and 150–160 m relative to the y-axis (pink rectangle) (Figure 3a). This location showed high concentration regions in some road and sidewalk segments due to the structural impact of dense buildings. When only the aerodynamic effect of trees was applied, ΔNOx decreased and increased in certain road and sidewalk segments. The areas with decreased and increased ΔNOx were formed behind buildings along the roadside (red rectangles) rather than directly on the road or sidewalk segments (Figure 3b). When only the dry deposition effect of trees was considered, the ΔNOx distribution showed negative ΔNOx values across both the road and sidewalk segments, indicating a reduction in NOx concentration (Figure 3c). When both the aerodynamic and dry deposition effects of trees were applied, the highest and lowest ΔNOx distributions were similar to those observed when only the aerodynamic effect was considered. In other words, sections behind buildings along the roadside (red rectangles) showed a similar ΔNOx pattern to when only the aerodynamic effect was applied, with a large ΔNOx increase due to the aerodynamic effect (Figure 3d). Therefore, it was concluded that the aerodynamic effect of trees is a crucial factor in either increasing or decreasing NOx concentrations, which is in line with previous studies [62,63].
In contrast, on the roadways and sidewalks, similar patterns were not shown according to the effects of roadside trees (Figure 3c). The average ΔNOx was −0.8% on the roadways and approximately −2% on the sidewalks. This indicates that in the near-road environment, the dry deposition effect of trees had a greater impact on the NOx concentration than was the case with the aerodynamic effect. Thus, to examine the influence of both tree effects on ΔNOx, the horizontal and vertical profiles need to be further analyzed.
To examine the average ΔNOx caused by the aerodynamic and dry deposition effects of trees in the near-road environment, we analyzed the roadway (y-axis of 134–162 m in Figure 3) and sidewalk segments (y-axis of 129–133 m and 163–167 m in Figure 3) separately. Table 4 displays the average ΔNOx for both tree effects (aerodynamic and dry deposition) in the roadway and sidewalk segments. The ΔNOx from the aerodynamic effect of trees fluctuated between positive and negative values depending on the wind conditions. At 09:00 on 28 January, the aerodynamic effect showed positive ΔNOx values for both the roadway and sidewalk segments, with an increase in NOx concentrations of approximately 2.1% (i.e., 7.8 ppb) in the sidewalk segment. At 07:00 on 28 January, the ΔNOx from the aerodynamic effect was negative in both the sidewalk and roadway segments, indicating a reduction in concentration. At 14:00 on 29 January, ΔNOx in the roadway segment was 0.7% (i.e., 6.9 ppb) and −0.02% (i.e., −0.2 ppb) in the sidewalk segment, indicating a negligible change in the NOx concentration due to the aerodynamic effect. Based on these results, the NOx concentrations increased both on the sidewalk and roadway relative to a wind direction (i.e., 262°) oblique to the road axis due to the aerodynamic effect of trees; in contrast, relative to wind directions (i.e., 295° and 71°) parallel to the road axis, the NOx concentrations decreased. Therefore, the inflow wind direction has a predominant role in determining the contribution of roadside trees relative to air quality [64].
The dry deposition effect of trees consistently contributed negatively to the ΔNOx values in both the roadway and sidewalk segments, indicating reductions in NOx concentrations. In particular, ΔNOx in the sidewalk segment exhibited −2.8% (i.e., −7.6 ppb) at 07:00 on 28 January and −2.7% (i.e., −26.1 ppb) at 14:00 on 29 January negatively larger than those in the roadway segment, demonstrating that the dry deposition effect reduced pollutant concentrations more significantly in the sidewalk area. When both the aerodynamic and dry deposition effects were considered, the ΔNOx values were consistently negative. The results at 09:00 on 28 January are notable: although the aerodynamic effect increased the NOx concentrations in the sidewalk segment, the more substantial reduction from the dry deposition effect resulted in an overall decrease in NOx concentrations when both effects were considered. This suggests that on that date, the NOx concentration reductions due to the dry deposition effect of trees were greater than the increase due to the aerodynamic effect. The reduction in NOx concentrations due to both tree effects was greater in the sidewalk segment than in the roadway segment.
To analyze the impact of trees on NOx dispersion in the study area, ΔWindspeed ΔTKE values were calculated for a 20 m section from the center of the road (Figure 4a and Figure 5a). Figure 4a and Figure 5a show the horizontal ΔWindspeed and ΔTKE profiles at heights of 1.5, 3.5, 5.5, 7.5, and 9.5 m. The ΔWindspeed and ΔTKE values due to the presence of trees had a greater effect on the sidewalk segment than on the roadway segment. Figure 4b and Figure 5b show the vertical ΔWindspeed and ΔTKE profiles in both the roadway and sidewalk segments. Significant variations were observed at a tree canopy center height of 3.5 m, with the lowest ΔWindspeed variations observed in the sidewalk segment (e.g., ΔWindspeed of −33.5% and windspeed deviation of 0.3 m·s−1 at a height of 3.5 m) compared to the roadway segment (e.g., ΔWindspeed of −8.2% and windspeed deviation of 0.08 m·s−1 at a height of 3.5 m). The difference in ΔWindspeed and ΔTKE between the sidewalk and roadway segments exhibited a large gap from a tree canopy height up to 15 m. However, above 15 m from the ground, the difference decreased to less than −1%.
Figure 6 shows the horizontal ΔNOx profiles in three different scenarios at the pedestrian height. Similarly, this figure represents the average simulation results over 07:00 and 09:00 on 28 January and 14:00 on 29 January. It was obvious that the NOx concentrations increased due to the aerodynamic effect of trees. This is associated with changes in wind speed and TKE around the trees (Figure 4a and Figure 5a). In the sidewalk segment, the decrease in wind speed and TKE around the trees hindered the effective dispersion and transport of pollutants, resulting in higher concentrations. In the Aero scenario, the overall NOx concentration increased. This increase was attributed to the aerodynamic effect of trees, which reduced wind speed and TKE, resulting in higher NOx concentrations in the roadway segment. In the sidewalk segment, the reduction in wind speed and TKE prevented the dispersion of NOx transported from the roadway. In contrast, in the Dep scenario, ΔNOx were negative in both the sidewalk and roadway segments, indicating a decrease in NOx concentrations. The dry deposition effect of trees not only influenced the sidewalk segment but also affected the entire roadway segment. Notably, the NOx concentration decreased more in the sidewalk segment than in the areas without trees in the Dep scenario. When both effects of trees were considered (Aero_Dep scenario), ΔNOx in the sidewalk segment was negative due to the influence of the dry deposition effect, resembling the ΔNOx pattern of the dry deposition effect. Additionally, the ΔNOx pattern in the roadway segment was similar to that of the Aero scenario, which only considered the aerodynamic effect.
Figure 7 shows the vertical ΔNOx profiles in the sidewalk and roadway segments averaged over 07:00 and 09:00 on 28 January and 14:00 on 29 January. In the sidewalk and roadway segments, the rate of the decrease in NOx concentrations due to the aerodynamic effect of trees exhibited positive values above a height of 0.5 m, peaking at a height of 5.5 m (Figure 7a). The peak value at a height of 5.5 m is closely related to the wind speed and TKE (Figure 4b and Figure 5b). At this height, the TKE change was about −1.0% (a difference of 0.01 m2·s−2), which was not significant. Therefore, it is assumed that the NOx emitted from the roadway was transported and dispersed, resulting in high concentrations at this height. ΔNOx, due to the dry deposition effect, showed the largest negative values within the tree canopy heights, with greater negative values in the sidewalk segment than in the roadway segment (Figure 7b). When both effects of trees were considered, the ΔNOx in the sidewalk segment exhibited negative values at all heights, including heights where the aerodynamic effect alone had shown positive values (Figure 7c). This suggests that the dry deposition effect of trees offsets the aerodynamic effect in the sidewalk segment. However, in the roadway segment, the dry deposition effect only offsets the aerodynamic effect below a height of 2.5 m, while the aerodynamic effect became more dominant above a height of 2.5 m. The vertical ΔNOx profile in the roadway segment was very similar to that in the Aero scenario. This indicates that the changes in NOx concentrations in the sidewalk segment were more influenced by the dry deposition effect than by the aerodynamic effect, while in the roadway segment, the aerodynamic effect had a greater influence than the dry deposition effect.

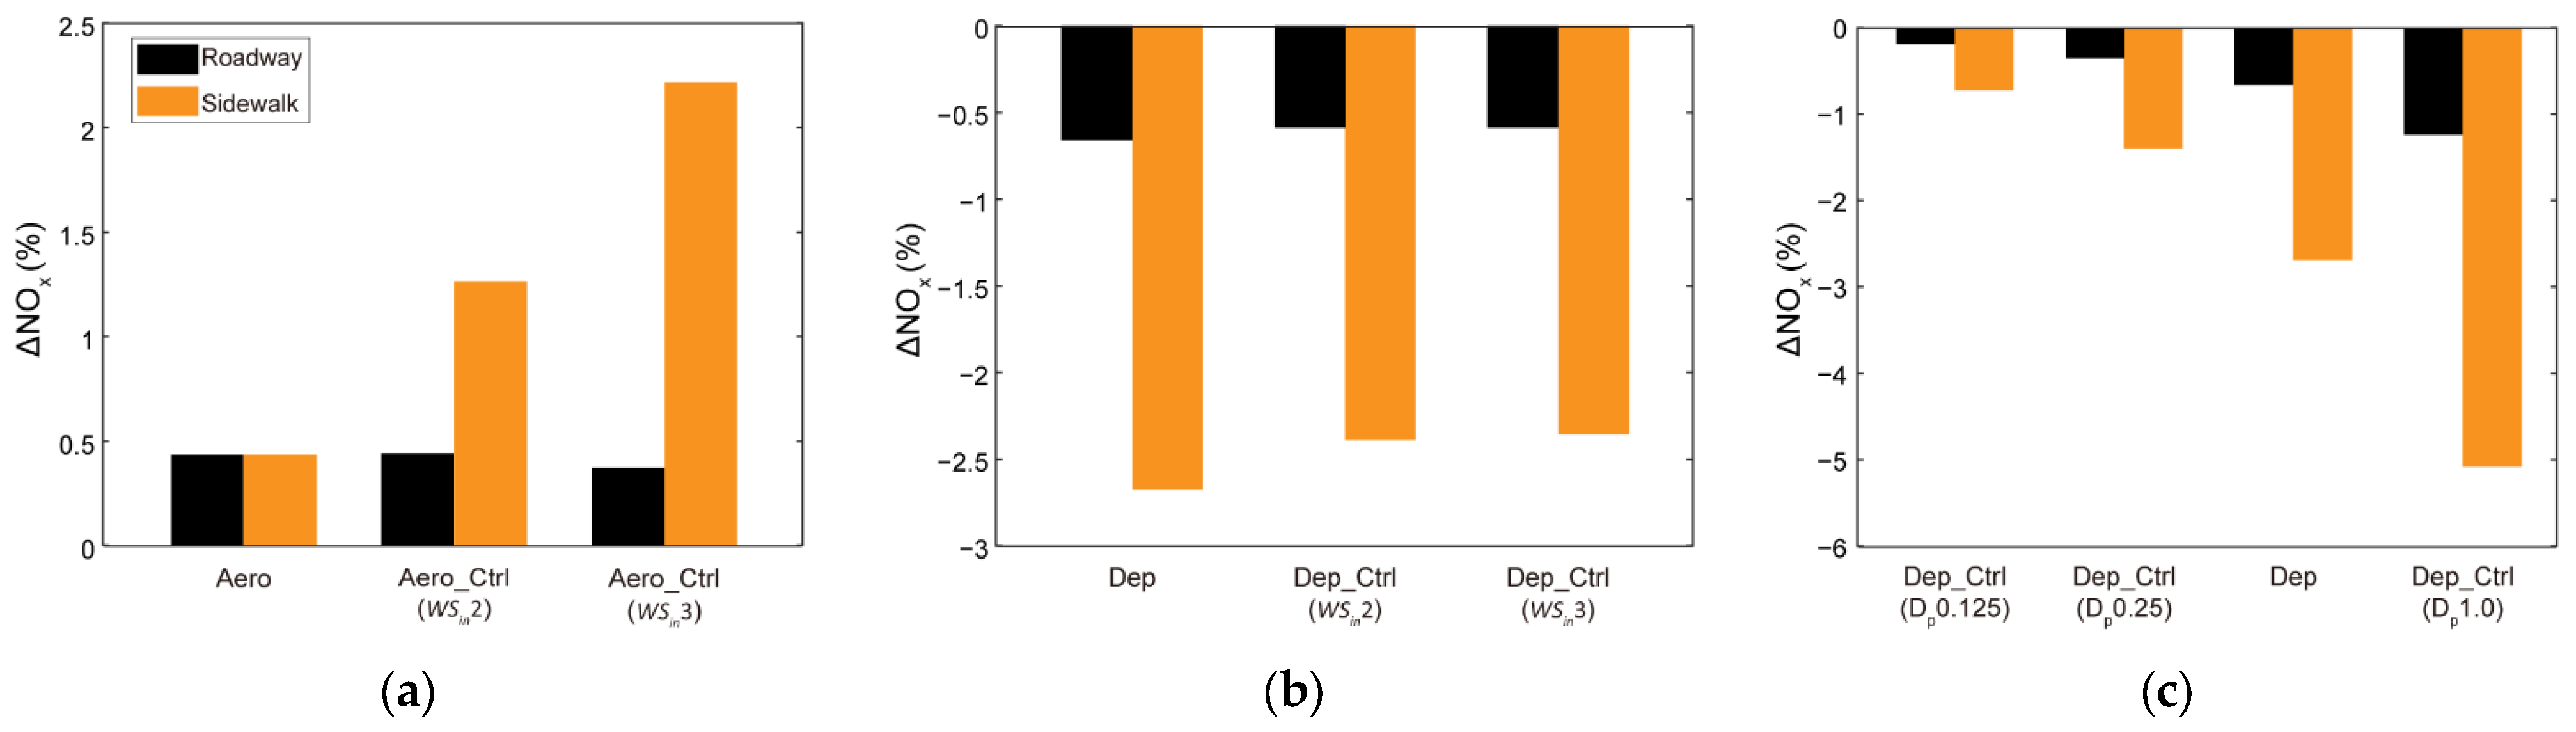
3.3. Sensitivities to Wind Speed and Dry Deposition Velocity

The ΔNOx in the roadway and sidewalk segments is non-negligibly dependent on the wind speed and dry deposition velocity. In the sensitivity scenarios, we found that ΔNOx increased as the wind speed increased due to the aerodynamic effect of trees in the sidewalk segment. The maximum difference in the sidewalk segment between the Aero scenario and the Aero_Ctrl ( W S i n 3 ) scenario was 3.2%. In the roadway segment, the difference in ΔNOx between the Aero scenario and other scenarios was less than 1.5%, showing little significant variation (Figure 8a). Under strong wind conditions, it is inferred that the NOx concentrations emitted on the road were dispersed and transported to the sidewalk segment. The ΔNOx from the dry deposition effect of trees tended to increase positively in both the sidewalk and roadway segments as the wind speeds increased. However, the difference in ΔNOx between the Dep scenario and other scenarios was not large, with a maximum of 0.6% (Figure 8b). Therefore, the sensitivity of the wind speed to the dry deposition and aerodynamic effects of trees was greater for the aerodynamic effect than for the dry deposition effect, and it was greater in the sidewalk segment than in the roadway segment.
The ΔNOx resulting from the dry deposition effect of trees significantly decreased in both the roadway and sidewalk segments as the deposition velocity increased (Figure 8c). The lowest ΔNOx was observed in the Dep_Ctrl (Dp1.0) scenario, exhibiting −6.4% (i.e., −37.6 ppb) in the sidewalk segment and −2.5% (i.e., −15.1 ppb) in the roadway segment. Thus, the sensitivity of the dry deposition effect to the tree deposition velocities was proportional to the deposition velocity and was higher in the sidewalk segment than in the roadway segment.
Figure 9 presents the average vertical ΔNOx profiles for the aerodynamic and dry deposition effects of trees due to changes in wind speed and for the dry deposition effect due to changes in dry deposition velocity by combining both the roadway and sidewalk segments. ΔNOx increased with the wind speed up to a tree canopy height of 4.5 m due to the aerodynamic effect of trees but decreased above that height (Figure 9a). Below the tree canopy height, ΔNOx increased with the wind speed due to the aerodynamic effect, peaking at 0.9% (about 3.8 ppb) in Aero_Ctrl ( W S i n 3 ) at 6.5 m before gradually decreasing above the height. The effect of the dry deposition and the change in ΔNOx with varying incoming wind speeds showed that ΔNOx increased with higher incoming wind speeds across all altitudes (Figure 9b). The difference in ΔNOx between Dep and Dep_Ctrl ( W S i n 3 ) below the tree canopy height ranged from 0.14% to 0.24%, which was negligible. Above the tree canopy height, the differences in ΔNOx due to wind speed became more pronounced. Thus, at heights above the tree canopy, weaker incoming wind speeds had a greater effect in reducing NOx concentrations. ΔNOx decreased proportionally as the deposition velocity of the trees increased due to the dry deposition effect of trees. ΔNOx was the lowest at the tree canopy height due to the dry deposition effect and deposition velocity, with ΔNOx at −3.5% (i.e., −14.9 ppb) in the Dep_Ctrl (Dp1.0) scenario before increasing at higher heights (Figure 9c).
Figure 10 shows the average ΔNOx at 07:00 and 09:00 on 28 January and 14:00 on 29 January for the aerodynamic effect and wind speed and for the dry deposition effect and deposition velocity scenarios in the roadway and sidewalk segments. In the roadway segment, the maximum ΔNOx due to the aerodynamic effect and increased wind speed was less than 0.4%, exhibiting insignificant differences (Figure 10a). In contrast, in the sidewalk segment, ΔNOx increased with stronger winds due to the aerodynamic effect, unlike in the roadway segment. The minimum ΔNOx increased due to the dry deposition effect and wind speed in both the roadway and sidewalk segments as the wind speeds increased. ΔNOx in the Dep scenario was -0.7% (i.e., −4.5 ppb) in the roadway segment and −2.7% (i.e., −14.5 ppb) in the sidewalk segment. Moreover, ΔNOx in the Dep( W S i n 3 ) scenario was −0.6% (i.e., −3.9 ppb) in the roadway segment and −2.4% (i.e., −13.0 ppb) in the sidewalk segment (Figure 10b). The ΔNOx due to the dry deposition effect and deposition velocity increased from a negative value as the deposition velocity increased. In the Dep_Ctrl (Dp1.0) scenario, the minimum ΔNOx was approximately −1.2% (i.e., −7.8 ppb) in the roadway segment and −5.1% (i.e., −27.5 ppb) in the sidewalk segment, exhibiting a greater reduction in NOx concentrations in the sidewalk segment than in the roadway segment (Figure 10c). In summary, ΔNOx is positively correlated with wind speed due to the aerodynamic and dry deposition effects of trees. Additionally, ΔNOx was lower in the sidewalk segment than in the roadway segment. As explained previously, this is because pollutants emitted on the road are transported to the sidewalk segment and fail to disperse effectively there due to the aerodynamic effect of trees. The influence of the dry deposition effect of trees in reducing the NOx concentrations diminished as the wind speeds increased.

4. Discussion and Conclusions

The main objective of this study was to examine the changes in NOx concentration due to the aerodynamic and dry deposition effects of trees separately in roadway and sidewalk segments. To achieve this, the study assessed the impact of trees’ aerodynamic and dry deposition effects on the horizontal and vertical distributions of NOx concentrations in Jongno, a representative central business district of Seoul, Republic of Korea. The validation and comparison of the CFD model were conducted using the ML measurements, which exhibited a reasonable agreement between them, with a slight underestimation in the CFD model’s results. Scenarios were developed for each effect (aerodynamic and dry deposition) relative to the trees in the study area, along with sensitivity scenarios for wind speeds and deposition velocities, in order to conduct sensitivity experiments on the roadway and sidewalk segments.
The results suggest that, when both tree effects are considered together, the impact of the trees on the NOx concentrations in the roadway and sidewalk segments is determined by the relative contribution of each effect to the NOx concentration changes. The aerodynamic effect of trees on the NOx concentration changes was significantly influenced by the wind direction. During periods with oblique winds (e.g., 09:00 on 28 January), the NOx concentrations increased, while during periods with parallel winds (e.g., 07:00 on 28 January and 14:00 on 29 January), the NOx concentrations decreased. These results are consistent with previous studies [13,24,65,66], which found that air pollution concentrations in street canyons tend to be lower when the wind direction is parallel to the canyon compared to other wind conditions. Therefore, local meteorological conditions can be considered as a key determinant of the impact of trees in street canyons.
Due to the aerodynamic effect of trees, the wind speeds decreased around the trees at a pedestrian height, which resulted in an increase in NOx concentrations. ΔNOx was greater in the sidewalk segment than in the roadway segment as the wind speed increased at the pedestrian height due to the aerodynamic effect of trees. The influence of the dry deposition effect of trees in reducing NOx in the sidewalk segment decreased as the wind speeds increased. This effect was greater in the sidewalk segment than in the roadway segment. The NOx concentrations decreased in both the roadway and sidewalk segments proportionally to the deposition velocity due to the dry deposition effect of trees. This indicates that variations in the dry deposition velocity of trees can significantly affect NOx concentration distributions in the sidewalk segment. This finding highlights the importance of deposition velocity in simulating the effect of roadside trees on air quality.
As reported in previous studies, trees in certain roadway and sidewalk segments are not always effective in improving air quality, as they can obstruct airflow. Nevertheless, in areas where the reduction in NOx concentrations due to the dry deposition effect exceeds the increase caused by the aerodynamic effect, the NOx concentrations were lower than those in the areas without roadside trees. These results are consistent with previous research [67], which suggested that the deterioration of air quality caused by the aerodynamic effect of trees can be mitigated by their dry deposition effects.
However, there are uncertainties in the results of the dry deposition effect, particularly related to the dry deposition velocity, which requires careful consideration. Several previous studies on dry deposition velocities have shown that they may vary depending on environmental factors, such as soil moisture content and background concentrations. Additionally, the dry deposition velocity differs based on the type of pollutant, tree species, and canopy structure [68,69]. Due to these uncertainties, previous studies have noted that the aerodynamic effect of trees is more significant than their dry deposition effect [50,70,71].
The findings of this study suggest that, in order to accurately simulate air quality at the street scale, it is essential to incorporate both the aerodynamic and dry deposition effects of roadside trees. This study is expected to contribute significantly to urban tree-planting strategies and air quality management policies.
The limitations of this study are as follows. First, the simulated NOx reacts with VOCs in the real environment to form O3, but this reaction process was not considered in this study. Second, in areas with dense buildings, shadows are formed, which affect photochemical reactions. However, this factor was not considered in this study. Third, vehicle-induced turbulence caused by traffic flow in urban street canyons was not implemented in the model. Fourth, uncertainties with respect to dry deposition velocities exist. These uncertainties may affect the overall estimation of NOx removal through dry deposition. These limitations should be addressed in future research.

Author Contributions

Conceptualization, K.-H.K.; formal analysis, Y.-U.K.; validation, Y.-U.K.; investigation, Y.-U.K., C.H.K., S.L. and S.-B.L.; data curation, Y.-U.K., C.H.K., S.L. and S.-B.L.; writing—original draft preparation, Y.-U.K.; writing—review and editing, K.-H.K.; visualization, Y.-U.K.; supervision, K.-H.K. All authors have read and agreed to the published version of the manuscript.

Funding

This research was supported by National Research Foundation of Korea (NRF) funded by the Korean government (MSIT) (No.RS-2024-00356913) and by Particulate Matter Management Specialized Graduate Program through the Korea Environmental Industry & Technology Institute (KEITI), funded by the Ministry of Environment (MOE).

Institutional Review Board Statement

Not applicable.

Informed Consent Statement

Not applicable.

Data Availability Statement

The data presented in this study are available on request individually.

Conflicts of Interest

The authors declare no conflicts of interest.

References

  1. Hang, J.; Li, Y.; Sandberg, M.; Buccolieri, R.; Di Sabatino, S. The influence of building height variability on pollutant dispersion and pedestrian ventilation in idealized high-rise urban areas. Build. Environ. 2012, 56, 346–360. [Google Scholar] [CrossRef]
  2. Zhang, H.; Xu, T.; Wang, Y.; Zong, Y.; Li, S.; Tang, H. Study on the influence of meteorological conditions and the street side buildings on the pollutant dispersion in the street canyon. Build. Simul. 2016, 9, 717–727. [Google Scholar] [CrossRef]
  3. Yang, J.; Shi, B.; Shi, Y.; Marvin, S.; Zheng, Y.; Xia, G. Air pollution dispersal in high density urban areas: Research on the triadic relation of wind, air pollution, and urban form. Sustain. Cities Soc. 2020, 54, 101941. [Google Scholar] [CrossRef]
  4. Zhang, Y.; Gu, Z.; Yu, C.W. Impact Factors on Airflow and Pollutant Dispersion in Urban Street Canyons and Comprehensive Simulations: A Review. Curr. Pollut. Rep. 2020, 6, 425–439. [Google Scholar] [CrossRef]
  5. Xie, X.; Huang, Z.; Wang, J.-S. Impact of building configuration on air quality in street canyon. Atmos. Environ. 2005, 39, 4519–4530. [Google Scholar] [CrossRef]
  6. Yazid, A.W.M.; Sidik, N.A.C.; Salim, S.M.; Saqr, K.M. A review on the flow structure and pollutant dispersion in urban street canyons for urban planning strategies. Simulation 2014, 90, 892–916. [Google Scholar] [CrossRef]
  7. Zhang, Y.; Ou, C.; Chen, L.; Wu, L.; Liu, J.; Wang, X.; Lin, H.; Gao, P.; Hang, J. Numerical studies of passive and reactive pollutant dispersion in high-density urban models with various building densities and height variations. Build. Environ. 2020, 177, 106916. [Google Scholar] [CrossRef]
  8. Huang, Y.; Lei, C.; Liu, C.H.; Perez, P.; Forehead, H.; Kong, S.; Zhou, J.L. A review of strategies for mitigating roadside air pollution in urban street canyons. Environ. Pollut. 2021, 280, 116971. [Google Scholar] [CrossRef]
  9. Rueda, S. Superblocks for the Design of New Cities and Renovation of Existing Ones: Barcelona’s Case. In Integrating Human Health into Urban and Transport Planning; A Framework; Springer: Cham, Switzerland, 2019; pp. 135–153. [Google Scholar]
  10. Mueller, N.; Rojas-Rueda, D.; Khreis, H.; Cirach, M.; Andrés, D.; Ballester, J.; Bartoll, X.; Daher, C.; Deluca, A.; Echave, C.; et al. Changing the urban design of cities for health: The superblock model. Environ. Int. 2020, 134, 105132. [Google Scholar] [CrossRef]
  11. Guo, X.; Gao, Z.; Buccolieri, R.; Zhang, M.; Shen, J. Effect of greening on pollutant dispersion and ventilation at urban street intersections. Build. Environ. 2021, 203, 108075. [Google Scholar] [CrossRef]
  12. Li, Z.; Zhang, H.; Juan, Y.H.; Lee, Y.T.; Wen, C.Y.; Yang, A.S. Effects of urban tree planting on thermal comfort and air quality in the street canyon in a subtropical climate. Sustain. Cities Soc. 2023, 91, 104334. [Google Scholar] [CrossRef]
  13. Jeong, N.R.; Han, S.W.; Ko, B. Effects of Green Network Management of Urban Street Trees on Airborne Particulate Matter (PM2.5) Concentration. Int. J. Environ. Res. Public Health 2023, 20, 2507. [Google Scholar] [CrossRef] [PubMed]
  14. Tang, Y.F.; Wen, Y.B.; Chen, H.; Tan, Z.C.; Yao, Y.H.; Zhao, F.Y. Airflow Mitigation and Pollutant Purification in an Idealized Urban Street Canyon with Wind Driven Natural Ventilation: Cooperating and Opposing Effects of Roadside Tree Plantings and Non-Uniform Building Heights. Sustain. Cities Soc. 2023, 92, 104483. [Google Scholar] [CrossRef]
  15. Karttunen, S.; Kurppa, M.; Auvinen, M.; Hellsten, A.; Järvi, L. Large-Eddy Simulation of the Optimal Street-Tree Layout for Pedestrian-Level Aerosol Particle Concentrations—A Case Study from a City-Boulevard. Atmos. Environ. X 2020, 6, 100073. [Google Scholar] [CrossRef]
  16. Buccolieri, R.; Gatto, E.; Manisco, M.; Ippolito, F.; Santiago, J.L.; Gao, Z. Characterization of Urban Greening in a District of Lecce (Southern Italy) for the Analysis of CO2 Storage and Air Pollutant Dispersion. Atmosphere 2020, 11, 967. [Google Scholar] [CrossRef]
  17. Buccolieri, R.; Santiago, J.-L.; Rivas, E.; Sáanchez, B. Reprint of: Review on urban tree modelling in CFD simulations: Aerodynamic, deposition and thermal effects. Urban For. Urban Green. 2019, 37, 56–64. [Google Scholar] [CrossRef]
  18. Zeng, F.; Simeja, D.; Ren, X.; Chen, Z.; Zhao, H. Influence of Urban Road Green Belts on Pedestrian-Level Wind in Height-Asymmetric Street Canyons. Atmosphere 2022, 13, 1285. [Google Scholar] [CrossRef]
  19. Lin, C.; Ooka, R.; Kikumoto, H.; Kim, Y.; Zhang, Y.; Flageul, C.; Sartelet, K. Impact of gas dry deposition parameterization on secondary particle formation in an urban canyon. Atmos. Environ. 2024, 333, 120633. [Google Scholar] [CrossRef]
  20. Wang, Y.; Flageul, C.; Maison, A.; Carissimo, B.; Sartelet, K. Impact of trees on gas concentrations and condensables in a 2-D street canyon using CFD coupled to chemistry modeling. Environ. Pollut. 2023, 323, 121210. [Google Scholar] [CrossRef]
  21. Jonsson, L.; Karlsson, E.; Jönsson, P. Aspects of Particulate Dry Deposition in the Urban Environment. J. Hazard. Mater. 2008, 153, 229–243. [Google Scholar] [CrossRef]
  22. Oliveira, S.; Andrade, H.; Vaz, T. The cooling effect of green spaces as a contribution to the mitigation of urban heat: A case study in Lisbon. Build. Environ. 2011, 46, 2186–2194. [Google Scholar] [CrossRef]
  23. Mun, D.S.; Kang, G.; Yang, M.; Kim, J.J. How trees’ drag and cooling effects influence airflow and temperature distributions around a street canyon. Build. Environ. 2024, 264, 111913. [Google Scholar] [CrossRef]
  24. Abhijith, K.V.; Kumar, P.; Gallagher, J.; McNabola, A.; Baldauf, R.; Pilla, F.; Broderick, B.; Di Sabatino, S.; Pulvirenti, B. Air pollution abatement performances of green infrastructure in open road and built-up street canyon environments—A review. Atmos. Environ. 2017, 162, 71–86. [Google Scholar] [CrossRef]
  25. Grote, R.; Samson, R.; Alonso, R.; Amorim, J.H.; Cariñanos, P.; Churkina, G.; Fares, S.; Thiec, D.L.; Niinemets, Ü.; Mikkelsen, T.N.; et al. Functional traits of urban trees: Air pollution mitigation potential. Front. Ecol. Environ. 2016, 14, 543–550. [Google Scholar] [CrossRef]
  26. Salmond, J.A.; Williams, D.E.; Laing, G.; Kingham, S.; Dirks, K.; Longley, I.; Henshaw, G.S. The influence of vegetation on the horizontal and vertical distribution of pollutants in a street canyon. Sci. Total Environ. 2013, 443, 287–298. [Google Scholar] [CrossRef] [PubMed]
  27. Jeanjean, A.P.R.; Gallagher, J.; Monks, P.S.; Leigh, R.J. Ranking current and prospective NO2 pollution mitigation strategies: An environmental and economic modelling investigation in Oxford Street, London. Environ. Pollut. 2017, 225, 587–597. [Google Scholar] [CrossRef]
  28. Hu, Y.; Sun, G. Leaf Nitrogen Dioxide Uptake Coupling Apoplastic Chemistry, Carbon/Sulfur Assimilation, and Plant Nitrogen Status. Plant Cell Rep. 2010, 29, 1069–1077. [Google Scholar] [CrossRef]
  29. Lovett, G.M. Atmospheric Deposition of Nutrients and Pollutants in North America: An Ecological Perspective. Ecol. Appl. 1994, 4, 629–650. [Google Scholar] [CrossRef]
  30. Fantozzi, F.; Monaci, F.; Blanusa, T.; Bargagli, R. Spatio-temporal variations of ozone and nitrogen dioxide concentrations under urban trees and in a nearby open area. Urban Clim. 2015, 12, 119–127. [Google Scholar] [CrossRef]
  31. Ren, F.; Qiu, Z.; Liu, Z.; Bai, H.; Gao, H.O. Trees help reduce street-side air pollution: A focus on cyclist and pedestrian exposure risk. Build. Environ. 2023, 229, 109923. [Google Scholar] [CrossRef]
  32. Qin, H.; Hong, B.; Jiang, R.; Yan, S.; Zhou, Y. The Effect of Vegetation Enhancement on Particulate Pollution Reduction: CFD Simulations in an Urban Park. Forests 2019, 10, 373. [Google Scholar] [CrossRef]
  33. Cavanagh, J.-A.E.; Zawar-Reza, P.; Wilson, J.G. Spatial attenuation of ambient particulate matter air pollution within an urbanised native forest patch. Urban For. Urban Green. 2009, 8, 21–30. [Google Scholar] [CrossRef]
  34. Chen, X.; He, J.; Han, M.; Li, X.; Xu, R.; Ma, H.; Kumar, P. Understanding the Impacts of Street Greening Patterns and Wind Directions on the Dispersion of Fine Particles. Sci. Total Environ. 2024, 953, 176044. [Google Scholar] [CrossRef]
  35. Huang, Y.D.; Li, M.Z.; Ren, S.Q.; Wang, M.J.; Cui, P.Y. Impacts of Tree-Planting Pattern and Trunk Height on the Airflow and Pollutant Dispersion inside a Street Canyon. Build. Environ. 2019, 165, 106385. [Google Scholar] [CrossRef]
  36. Lee, S.H.; Kwak, K.H. Assessing 3-D Spatial Extent of Near-Road Air Pollution around a Signalized Intersection Using Drone Monitoring and WRF-CFD Modeling. Int. J. Environ. Res. Public Health. 2020, 17, 6915. [Google Scholar] [CrossRef]
  37. Kwak, K.-H.; Woo, S.; Kim, K.; Lee, S.-B.; Bae, G.-N.; Ma, Y.-I.; Sunwoo, Y.; Baik, J.-J. On-Road Air Quality Associated with Traffic Composition and Street-Canyon Ventilation: Mobile Monitoring and CFD Modeling. Atmosphere 2018, 9, 92. [Google Scholar] [CrossRef]
  38. Sim, S.; Jeong, S.; Park, H.; Park, C.; Kwak, K.-H.; Lee, S.-B.; Kim, C.H.; Lee, S.; Chang, J.S.; Kang, H.; et al. Co-benefit potential of urban CO2 and air quality monitoring: A study on the first mobile campaign and building monitoring experiments in Seoul during the winter. Atmos. Pollut. Res. 2020, 11, 1963–1970. [Google Scholar] [CrossRef]
  39. Jeong, J.-C. A spatial distribution analysis and time series change of PM10 in Seoul city. J. KAGIS 2014, 17, 61–69. (In Korean) [Google Scholar]
  40. TOPIS. Seoul Transport Operation & Information Service Center. Seoul, Korea. 2020. Available online: https://topis.seoul.go.kr/refRoom/openRefRoom_2.do (accessed on 12 February 2025). (In Korean).
  41. Kim, K.H.; Lee, S.-B.; Woo, D.; Bae, G.-N. Influence of wind direction and speed on the transport of particle-bound PAHs in a roadway environment. Atmos. Pollut. Res. 2015, 6, 1024–1034. [Google Scholar] [CrossRef]
  42. Kim, K.H.; Woo, D.; Lee, S.-B.; Bae, G.-N. On-Road Measurements of Ultrafine Particles and Associated Air Pollutants in a Densely Populated Area of Seoul, Korea. Aerosol. Air Qual. Res. 2015, 15, 142–153. [Google Scholar] [CrossRef]
  43. Kim, K.H.; Kwak, K.-H.; Lee, J.Y.; Woo, S.H.; Kim, J.B.; Lee, S.-B.; Ryu, S.H.; Kim, C.H.; Bae, G.-N.; Oh, I. Spatial Mapping of a Highly Non-Uniform Distribution of Particle-Bound PAH in a Densely Populated Urban Area. Atmosphere 2020, 11, 496. [Google Scholar] [CrossRef]
  44. Baik, J.-J.; Kim, J.-J.; Fernando, H.J.S. A CFD Model for Simulating Urban Flow and Dispersion. J. Appl. Meteorol. 2003, 42, 1636–1648. [Google Scholar] [CrossRef]
  45. Park, S.-J.; Kim, J.-J. Development of a computational fluid dynamics model adopting a nested grid system: Flow simulations for ideal and real urban settings. Urban Clim. 2024, 53, 101801. [Google Scholar] [CrossRef]
  46. Tutar, M.; Oguz, G. Large eddy simulation of wind flow around parallel buildings with varying configurations. Fluid Dyn. Res. 2002, 31, 289–315. [Google Scholar] [CrossRef]
  47. Kast, D.; Stalder, M.; Rüegsegger, A.; Galli, U.; Brunold, C. Effects of NO₂ and Nitrate on Sulfate Assimilation in Maize. J. Plant Physiol. 1995, 147, 9–14. [Google Scholar] [CrossRef]
  48. Carlson, R.W. Interaction between SO2 and NO2 and Their Effects on Photosynthetic Properties of Soybean Glycine max. Environ. Pollut. Ser. A Ecol. Biol. 1983, 32, 11–38. [Google Scholar] [CrossRef]
  49. Nowak, D.J. Air Pollution Removal by Chicago’s Urban Forest. In Chicago’s Urban Forest Ecosystem: Results of the Chicago Urban Forest Climate Project; United States Department of Agriculture: Radnor, PA, USA, 1994; pp. 63–81. [Google Scholar]
  50. Vos, P.E.; Maiheu, B.; Vankerkom, J.; Janssen, S. Improving local air quality in cities: To tree or not to tree? Environ. Pollut. 2013, 183, 113–122. [Google Scholar] [CrossRef]
  51. Gonzalez Olivardia, F.G.; Matsuo, T.; Shimadera, H.; Kondo, A. Impacts of the Tree Canopy and Chemical Reactions on the Dispersion of Reactive Pollutants in Street Canyons. Atmosphere 2020, 12, 34. [Google Scholar] [CrossRef]
  52. Hong, B.; Qin, H.; Lin, B. Prediction of Wind Environment and Indoor/Outdoor Relationships for PM2.5 in Different Building–Tree Grouping Patterns. Atmosphere 2018, 9, 39. [Google Scholar] [CrossRef]
  53. Santiago, J.-L.; Buccolieri, R.; Rivas, E.; Sanchez, B.; Martilli, A.; Gatto, E.; Martín, F. On the Impact of Trees on Ventilation in a Real Street in Pamplona, Spain. Atmosphere 2019, 10, 697. [Google Scholar] [CrossRef]
  54. Santiago, J.-L.; Rivas, E.; Sanchez, B.; Buccolieri, R.; Martin, F. The Impact of Planting Trees on NOx Concentrations: The Case of the Plaza de la Cruz Neighborhood in Pamplona (Spain). Atmosphere 2017, 8, 131. [Google Scholar] [CrossRef]
  55. Buccolieri, R.; Gromke, C.; Di Sabatino, S.; Ruck, B. Aerodynamic effects of trees on pollutant concentration in street canyons. Sci. Total Environ. 2009, 407, 5247–5256. [Google Scholar] [CrossRef] [PubMed]
  56. Katul, G.G.; Mahrt, L.; Poggi, D.; Sanz, C. One- and two-equation models for canopy turbulence. Bound. -Layer Meteorol. 2004, 113, 81–109. [Google Scholar] [CrossRef]
  57. Fu, R.; Pađen, I.; García-Sánchez, C. Should we care about the level of detail in trees when running urban microscale simulations? Sustain. Cities Soc. 2024, 101, 105143. [Google Scholar] [CrossRef]
  58. National Air Emission Inventory and Research Center (NAIR). 2019 National Air Pollutant Emissions Inventory; NAIR: Osong, Republic of Korea, 2022. Available online: https://www.air.go.kr (accessed on 12 February 2025).
  59. Kim, S.; Kim, J.; Jung, S.; Sung, K.; Kim, J.; Kim, I. Experimental Study on the NO2/NOx Ratio from Exhaust of Diesel Vehicles by Chassis Dynamometer. Korean Hydrog. New Energy Soc. 2017, 28, 220–224. (In Korean) [Google Scholar]
  60. Park, J.; Shin, M.; Lee, J.; Lee, J. Estimating the Effectiveness of Vehicle Emission Regulations for Reducing NOx from Light-Duty Vehicles in Korea Using On-Road Measurements. Sci. Total Environ. 2021, 767, 144250. [Google Scholar] [CrossRef]
  61. Hong, B.; Lin, B.; Qin, H. Numerical Investigation on the Coupled Effects of Building-Tree Arrangements on Fine Particulate Matter (PM₂.₅) Dispersion in Housing Blocks. Sustain. Cities Soc. 2017, 34, 358–370. [Google Scholar] [CrossRef]
  62. Miao, C.; Li, P.; Yu, S.; Chen, W.; He, X. Does street canyon morphology shape particulate matter reduction capacity by street trees in real urban environments? Urban For. Urban Green. 2022, 78, 127762. [Google Scholar] [CrossRef]
  63. Wang, X.; Chen, X.; Ma, B.; Zhou, Z.; Peng, C. Observed Vertical Dispersion Patterns of Particulate Matter in Urban Street Canyons and Dominant Influencing Factors. Forests 2024, 15, 1319. [Google Scholar] [CrossRef]
  64. Zhang, L.; Zhang, Z.; Feng, C.; Tian, M.; Gao, Y. Impact of various vegetation configurations on traffic fine particle pollutants in a street canyon for different wind regimes. Sci. Total Environ. 2021, 789, 147960. [Google Scholar] [CrossRef]
  65. Buccolieri, R.; Jeanjean, A.P.; Gatto, E.; Leigh, R.J. The Impact of Trees on Street Ventilation, NOx and PM2.5 Concentrations across Heights in Marylebone Rd Street Canyon, Central London. Sustain. Cities Soc. 2018, 41, 227–241. [Google Scholar] [CrossRef]
  66. Buccolieri, R.; Jeanjean, A.P.; Buccolieri, R.; Eddy, J.; Monks, P.S.; Leigh, R.J. Air Quality Affected by Trees in Real Street Canyons: The Case of Marylebone Neighbourhood in Central London. Urban For. Urban Green. 2017, 22, 41–53. [Google Scholar]
  67. Morakinyo, T.E.; Lam, Y.F. Study of Traffic-Related Pollutant Removal from Street Canyon with Trees: Dispersion and Deposition Perspective. Environ. Sci. Pollut. Res. 2016, 23, 21652–21668. [Google Scholar] [CrossRef]
  68. Wesely, M.L.; Hicks, B.B. A Review of the Current Status of Knowledge on Dry Deposition. Atmos. Environ. 2000, 34, 2261–2282. [Google Scholar] [CrossRef]
  69. Dasch, J.M. Measurement of Dry Deposition to Surfaces in Deciduous and Pine Canopies. Environ. Pollut. 1987, 44, 261–277. [Google Scholar] [CrossRef] [PubMed]
  70. Vranckx, S.; Vos, P.; Maiheu, B.; Janssen, S. Impact of Trees on Pollutant Dispersion in Street Canyons: A Numerical Study of the Annual Average Effects in Antwerp, Belgium. Sci. Total Environ. 2015, 532, 474–483. [Google Scholar] [CrossRef]
  71. Santiago, J.L.; Martilli, A.; Martin, F. On Dry Deposition Modelling of Atmospheric Pollutants on Vegetation at the Microscale: Application to the Impact of Street Vegetation on Air Quality. Bound.-Layer Meteorol. 2017, 162, 451–474. [Google Scholar] [CrossRef]
Figure 1. Study area and CFD model domain (camera icon: traffic recording point, magenta rectangle: CFD model domain, red rectangle: street canyon within the domain).
Atmosphere 16 00344 g001
Figure 2. Box plots comparing ML measurements and CFD model results in the noAero_noDep scenario.
Atmosphere 16 00344 g002
Figure 3. Horizontal distributions of (a) NOx concentrations in the noAero_noDep, (b) ΔNOx in the Aero, (c) ΔNOx in the Dep, and (d) ΔNOx in the Aero_Dep scenarios at the pedestrian height. The plots represent the average simulation results at 07:00 and 09:00 on 28 January and 14:00 on 29 January.
Atmosphere 16 00344 g003
Figure 4. (a) Horizontal and (b) vertical ΔNOx profiles in the Aero scenario. The green area represents the location of the trees. The plots represent the average simulation results at 07:00 and 09:00 on 28 January and 14:00 on 29 January.
Atmosphere 16 00344 g004
Figure 5. (a) Horizontal and (b) vertical ΔTKE profiles in the Aero scenario. The green area represents the location of the trees. The plots represent the average simulation results at 07:00 and 09:00 on 28 January and 14:00 on 29 January.
Atmosphere 16 00344 g005
Figure 6. Horizontal ΔNOx profiles in the tree effect scenarios. The green area represents the location of the trees.
Atmosphere 16 00344 g006
Figure 7. Vertical ΔNOx profiles in the sidewalk and roadway segments in the (a) Aero, (b) Dep, and (c) Aero_Dep scenarios. The plots represent the average simulation results at 07:00 and 09:00 on 28 January and 14:00 on 29 January.
Atmosphere 16 00344 g007
Figure 8. Horizontal ΔNOx profiles in sensitivity scenarios. (a) Aerodynamic effect with respect to wind speed, (b) dry deposition effect with respect to wind speed, and (c) dry deposition effect with respect to dry deposition velocity. The plots represent the average simulation results at 07:00 and 09:00 on 28 January and 14:00 on 29 January.
Atmosphere 16 00344 g008aAtmosphere 16 00344 g008b
Figure 9. Vertical ΔNOx profiles in sensitivity scenarios. (a) Aerodynamic effect with respect to wind speed, (b) dry deposition effect with respect to wind speed, and (c) dry deposition effect with respect to dry deposition velocity. The plots represent the average simulation results at 07:00 and 09:00 on 28 January and 14:00 on 29 January.
Atmosphere 16 00344 g009
Figure 10. Average ΔNOx on roadway and sidewalk segments in sensitivity scenarios. (a) Aerodynamic effect with respect to wind speed, (b) dry deposition effect with respect to wind speed, and (c) dry deposition effect with respect to dry deposition velocity.
Atmosphere 16 00344 g010
Table 1. A summary of input data in the CFD model.
Date
(DD-MM-YY)
Time
(LST)
Wind
Direction
(°)
Wind
Speed
(m·s−1)
Air
Temperature
(°C)
Surface
Temperature
(°C)
Emission Rate
(ppb·s−1)
Traffic
Volume
(car·h−1)
28-01-1907:00262 * 4.4 *3.4 *2.211.74123
09:00295 *3.4 *−0.7 *1.213.15147
29-01-1914:0071 *0.7 *−0.8 *5.525.98630
* Initial and boundary input data at 10 m height in the CFD model domain.
Table 2. Summary of CFD simulation scenarios considering the effects of roadside trees.
ScenarioEffects of Roadside TreesWind Speed
(m·s−1)
Dry Deposition Velocity
(cm·s−1)
Aerodynamic EffectDry Deposition Effect
noAero_noDepX 1X W S i n  30
Aero_DepO 2O0.5
AeroOX0
DepXO0.5
1 X: Not considered in the CFD model. 2 O: Considered in the CFD model. 3 W S i n : Initial boundary wind speeds listed in Table 1.
Table 3. Summary of sensitivity scenarios.
ScenarioEffects of Roadside TreesWind Speed
(m·s−1)
Dry Deposition Velocity
(cm·s−1)
Aerodynamic EffectDry Deposition Effect
Aero_Ctrl ( W S i n 2 )O 1X W S i n × 2 0
Dep_Ctrl ( W S i n 2 )X 2O W S i n × 2 0.5
Aero_Ctrl ( W S i n 3 )OX W S i n × 3 0
Dep_Ctrl ( W S i n 3 )XO W S i n × 3 0.5
Dep_Ctrl (Dp0.125)XO W S i n 0.125
Dep_Ctrl (Dp0.25)XO W S i n 0.25
Dep_Ctrl (Dp1.0)XO W S i n 1.0
1 X: Not considered in the CFD model. 2 O: Considered in the CFD model.
Table 4. Average ΔNOx (%) via the aerodynamic and dry deposition effects of roadside trees.
Time
(DD-MM-HH)
Aerodynamic EffectDry Deposition EffectAerodynamic Effect
+
Dry Deposition Effect
RoadwaySidewalkRoadwaySidewalkRoadwaySidewalk
28-01-07−0.15−0.17−0.79−2.77−0.82−3.03
28-01-090.462.09−0.59−2.60−0.11−0.53
29-01-140.66−0.02−0.64−2.690.09−3.10
Disclaimer/Publisher’s Note: The statements, opinions and data contained in all publications are solely those of the individual author(s) and contributor(s) and not of MDPI and/or the editor(s). MDPI and/or the editor(s) disclaim responsibility for any injury to people or property resulting from any ideas, methods, instructions or products referred to in the content.

