Article

Impacts of Low-Carbon Policies on Air Quality in China’s Metropolitan Areas: Evidence from a Difference-in-Differences Study

School of Management, Lanzhou University, Lanzhou 730000, China
*
Author to whom correspondence should be addressed.
Atmosphere 2025, 16(3), 339; https://doi.org/10.3390/atmos16030339
Submission received: 14 January 2025 / Revised: 9 March 2025 / Accepted: 12 March 2025 / Published: 17 March 2025
(This article belongs to the Special Issue Air Quality in Metropolitan Areas and Megacities (Second Edition))

Abstract

:
Climate change and air pollution are intrinsically interconnected as carbon dioxide and air pollutants are co-emitted during fossil fuel combustion. Low-carbon policies, aimed at mitigating carbon emissions, are also anticipated to yield co-benefits for air quality; however, the extent to which regional low-carbon policies can effectively achieve significant reductions in air pollutant levels remains uncertain. In China, the implementation of the low-carbon city pilot (LCCP) policy has reduced carbon emissions, but further research is needed to examine its effectiveness regarding achieving air quality co-benefits. Adopting a difference-in-differences model with a 19-year national database of air quality, this study examines whether the LCCP policy improves air quality in China’s metropolitan areas and explores how these policy initiatives address their air pollution challenges. The results indicate that, following the implementation of the LCCP policy, the mean, maximum, and standard deviation of the AQI in pilot cities decreased significantly by 9.3%, 20.8%, and 19.8%, respectively, compared to non-pilot cities. These results suggest that the LCCP policy significantly improves air quality and provide evidence that this improvement is facilitated by advancements in green technology, industrial restructuring, and the optimization of urban planning and landscape design.

1. Introduction

Mitigating carbon dioxide emissions and air pollution from fossil fuel combustion in metropolitan areas presents a significant challenge with complex implications for climate change and atmospheric environmental quality [1,2,3]. Although low-carbon policies are primarily designed to reduce greenhouse gas emissions, they are also expected to achieve co-benefits by lowering concentrations of air pollutants such as particulate matter (PM2.5), nitrogen oxides (NOx), and sulfur dioxide (SO2) [4,5,6].
Recent studies highlight the potential air quality co-benefits of low-carbon policies, while also emphasizing the complexities and uncertainties involved in their implementation. Studies indicate that policy initiatives may positively contribute to air pollution control through, for example, reducing carbon dioxide emissions, decreasing reliance on fossil fuels, and facilitating clean and efficient energy transitions across various sectors such as transportation, building construction, and household energy use [7,8]. Measures such as promoting renewable energy adoption, energy efficiency improvements, and emissions trading schemes have been shown to significantly reduce both carbon dioxide and key air pollutants, including PM2.5, NOx, and SO2 [7,8].
The extent to which regional low-carbon policies can effectively achieve substantial reductions in urban air pollution remains highly uncertain. Metropolitan areas, as major economic and industrial hubs, are characterized by dense transportation networks, concentrated energy consumption, and diverse emission sources. These factors create complex pollution dynamics, which may not respond uniformly to carbon reduction measures, leading to disparities in air quality improvements across urban regions. Moreover, integrating climate mitigation actions with air pollutant control frequently faces significant challenges, as it usually requires extensive cross-boundary and cross-sector collaborations [7,9]. Studies of European cities indicate that while decarbonization measures often reduce air pollution, unintended consequences—such as increased reliance on biomass fuels—can offset gains in certain pollutants like ozone and secondary PM2.5 [9]. Evidence also indicates that air quality is sometimes unintentionally affected by certain low-carbon initiatives, such as the net-zero measures of the United Kingdom [9,10]. Therefore, examining whether and how low-carbon policies improve air quality is essential for addressing critical environmental challenges and advancing sustainable urban development.
As the world’s largest emitter of carbon dioxide, China has initiated the most extensive low-carbon city pilot (LCCP) policy, which not only aims to achieve carbon reduction targets promptly but is also expected to improve air quality [11,12]. The policy encompasses three rounds of low-carbon pilot programs, involving 86 cities with populations exceeding one million, including 15 of China’s 17 megacities [13]. These initiatives are some of the recent important environmental reform programs in China, including adjusting the industrial structure, encouraging circular economy, using green energy, advocating building energy conservation, and developing a low-carbon transportation system. Since the implementation of the LCCP policy, substantial evidence has demonstrated its effectiveness in terms of carbon reduction in China, but comprehensive and systematic analyses of its ancillary benefits, particularly concerning improvements in air quality, remain limited [14,15]. Therefore, understanding the extent to which low-carbon initiatives influence air quality in China provides crucial insights into their broader environmental co-benefits and strengthens their strategic importance within integrated environmental governance [14].
This study examines the effectiveness of the LCCP policy in improving China’s air quality by addressing two primary research questions: Has the LCCP policy improved air quality in China? If so, what mechanisms facilitate this improvement? Using a 10-year national panel dataset on the air quality index (AQI) from the China National Environmental Monitoring Center and the China National Meteorological Information Center, we employ a heterogeneous robust difference-in-differences (DID) methodology to assess the impact of the LCCP policy on air quality. Previous studies have largely relied on single indicators, such as fine particulate matter (PM2.5) or inhalable particulate matter (PM10), to evaluate the policy’s effects on air quality. However, single indicators only reflect the concentration of specific pollutants, failing to account for the interactions or cumulative effects of multiple pollutants [16]. Since air pollution often arises from the combined influence of various pollutants, over-reliance on single indicators may lead to misjudgments about overall air quality [17]. To address this limitation, our study uses a comprehensive air quality indicator for a clearer picture of overall air pollution.
Our study strengthens the empirical foundation and advances understanding of the environmental outcomes and policy effectiveness of low-carbon initiatives by presenting initial evidence based on a composite air quality index. In the following sections, we first outline the impact of low-carbon actions on air quality, then discuss the theoretical and practical rationale behind the LCCP policy and its effect on air pollution control. After describing the methods and results, we discuss the theoretical and policy implications of our findings, concluding with an evaluation of the study’s significant contributions and limitations.

2. Low-Carbon Policies on Air Quality in China’s Metropolitan Areas

2.1. The Impact of Low-Carbon Actions on Air Quality

Low-carbon initiatives have a profound impact on air quality in metropolitan areas by addressing the interconnected challenges of climate change and air pollution. Since greenhouse gases and air pollutants are co-emitted during fossil fuel combustion, efforts to reduce carbon emissions inherently improve air quality. For instance, transitioning from coal-fired power plants to renewable energy sources such as wind and solar not only lowers carbon dioxide (CO2) emissions but also significantly reduces pollutants like sulfur dioxide (SO2) and nitrogen oxides (NOx), which contribute to acid rain and urban smog. Similarly, promoting clean transportation solutions, such as electric vehicles and expanded public transit systems, decreases tailpipe emissions of particulate matter (PM2.5) and ozone precursors, leading to cleaner urban air. Furthermore, energy efficiency improvements in industries and buildings reduce overall fossil fuel consumption, thereby reducing harmful emissions in densely populated metropolitan areas [18].
Beyond directly reducing emissions, low-carbon initiatives address climate-related factors that exacerbate air pollution in cities. Rising global temperatures accelerate photochemical reactions that increase ground-level ozone concentrations, while shifting atmospheric circulation patterns influence the dispersion and accumulation of pollutants. By curbing greenhouse gas emissions, low-carbon policies contribute to stabilizing climate conditions, reducing the frequency and severity of extreme weather events such as heatwaves and wildfires, which often trigger severe air pollution episodes. Furthermore, urban greening projects associated with low-carbon development enhance natural carbon sequestration while filtering airborne pollutants, thereby improving air quality. Integrating low-carbon strategies into urban planning, transportation systems, and energy infrastructures not only advances climate mitigation efforts but also delivers substantial benefits for air pollution control, promoting healthier and more sustainable metropolitan environments.
In addition to reducing emissions at the source, low-carbon actions help regulate atmospheric processes that influence pollution levels in metropolitan areas. For example, greenhouse gas reductions contribute to moderating urban heat island effects, which slows the chemical reactions responsible for ground-level ozone formation. Urban greening initiatives, including afforestation and the expansion of green spaces, complement low-carbon policies by absorbing pollutants and enhancing natural air filtration. Thus far, many studies show that integrating low-carbon policies into urban planning and infrastructure development enables metropolitan areas to achieve long-term air quality improvements while fostering sustainable and resilient urban environments. Growing evidence shows that metropolitan cities worldwide are increasingly adopting low-carbon initiatives such as carbon-neutral and zero-carbon projects to mitigate air pollution and enhance urban sustainability [1].

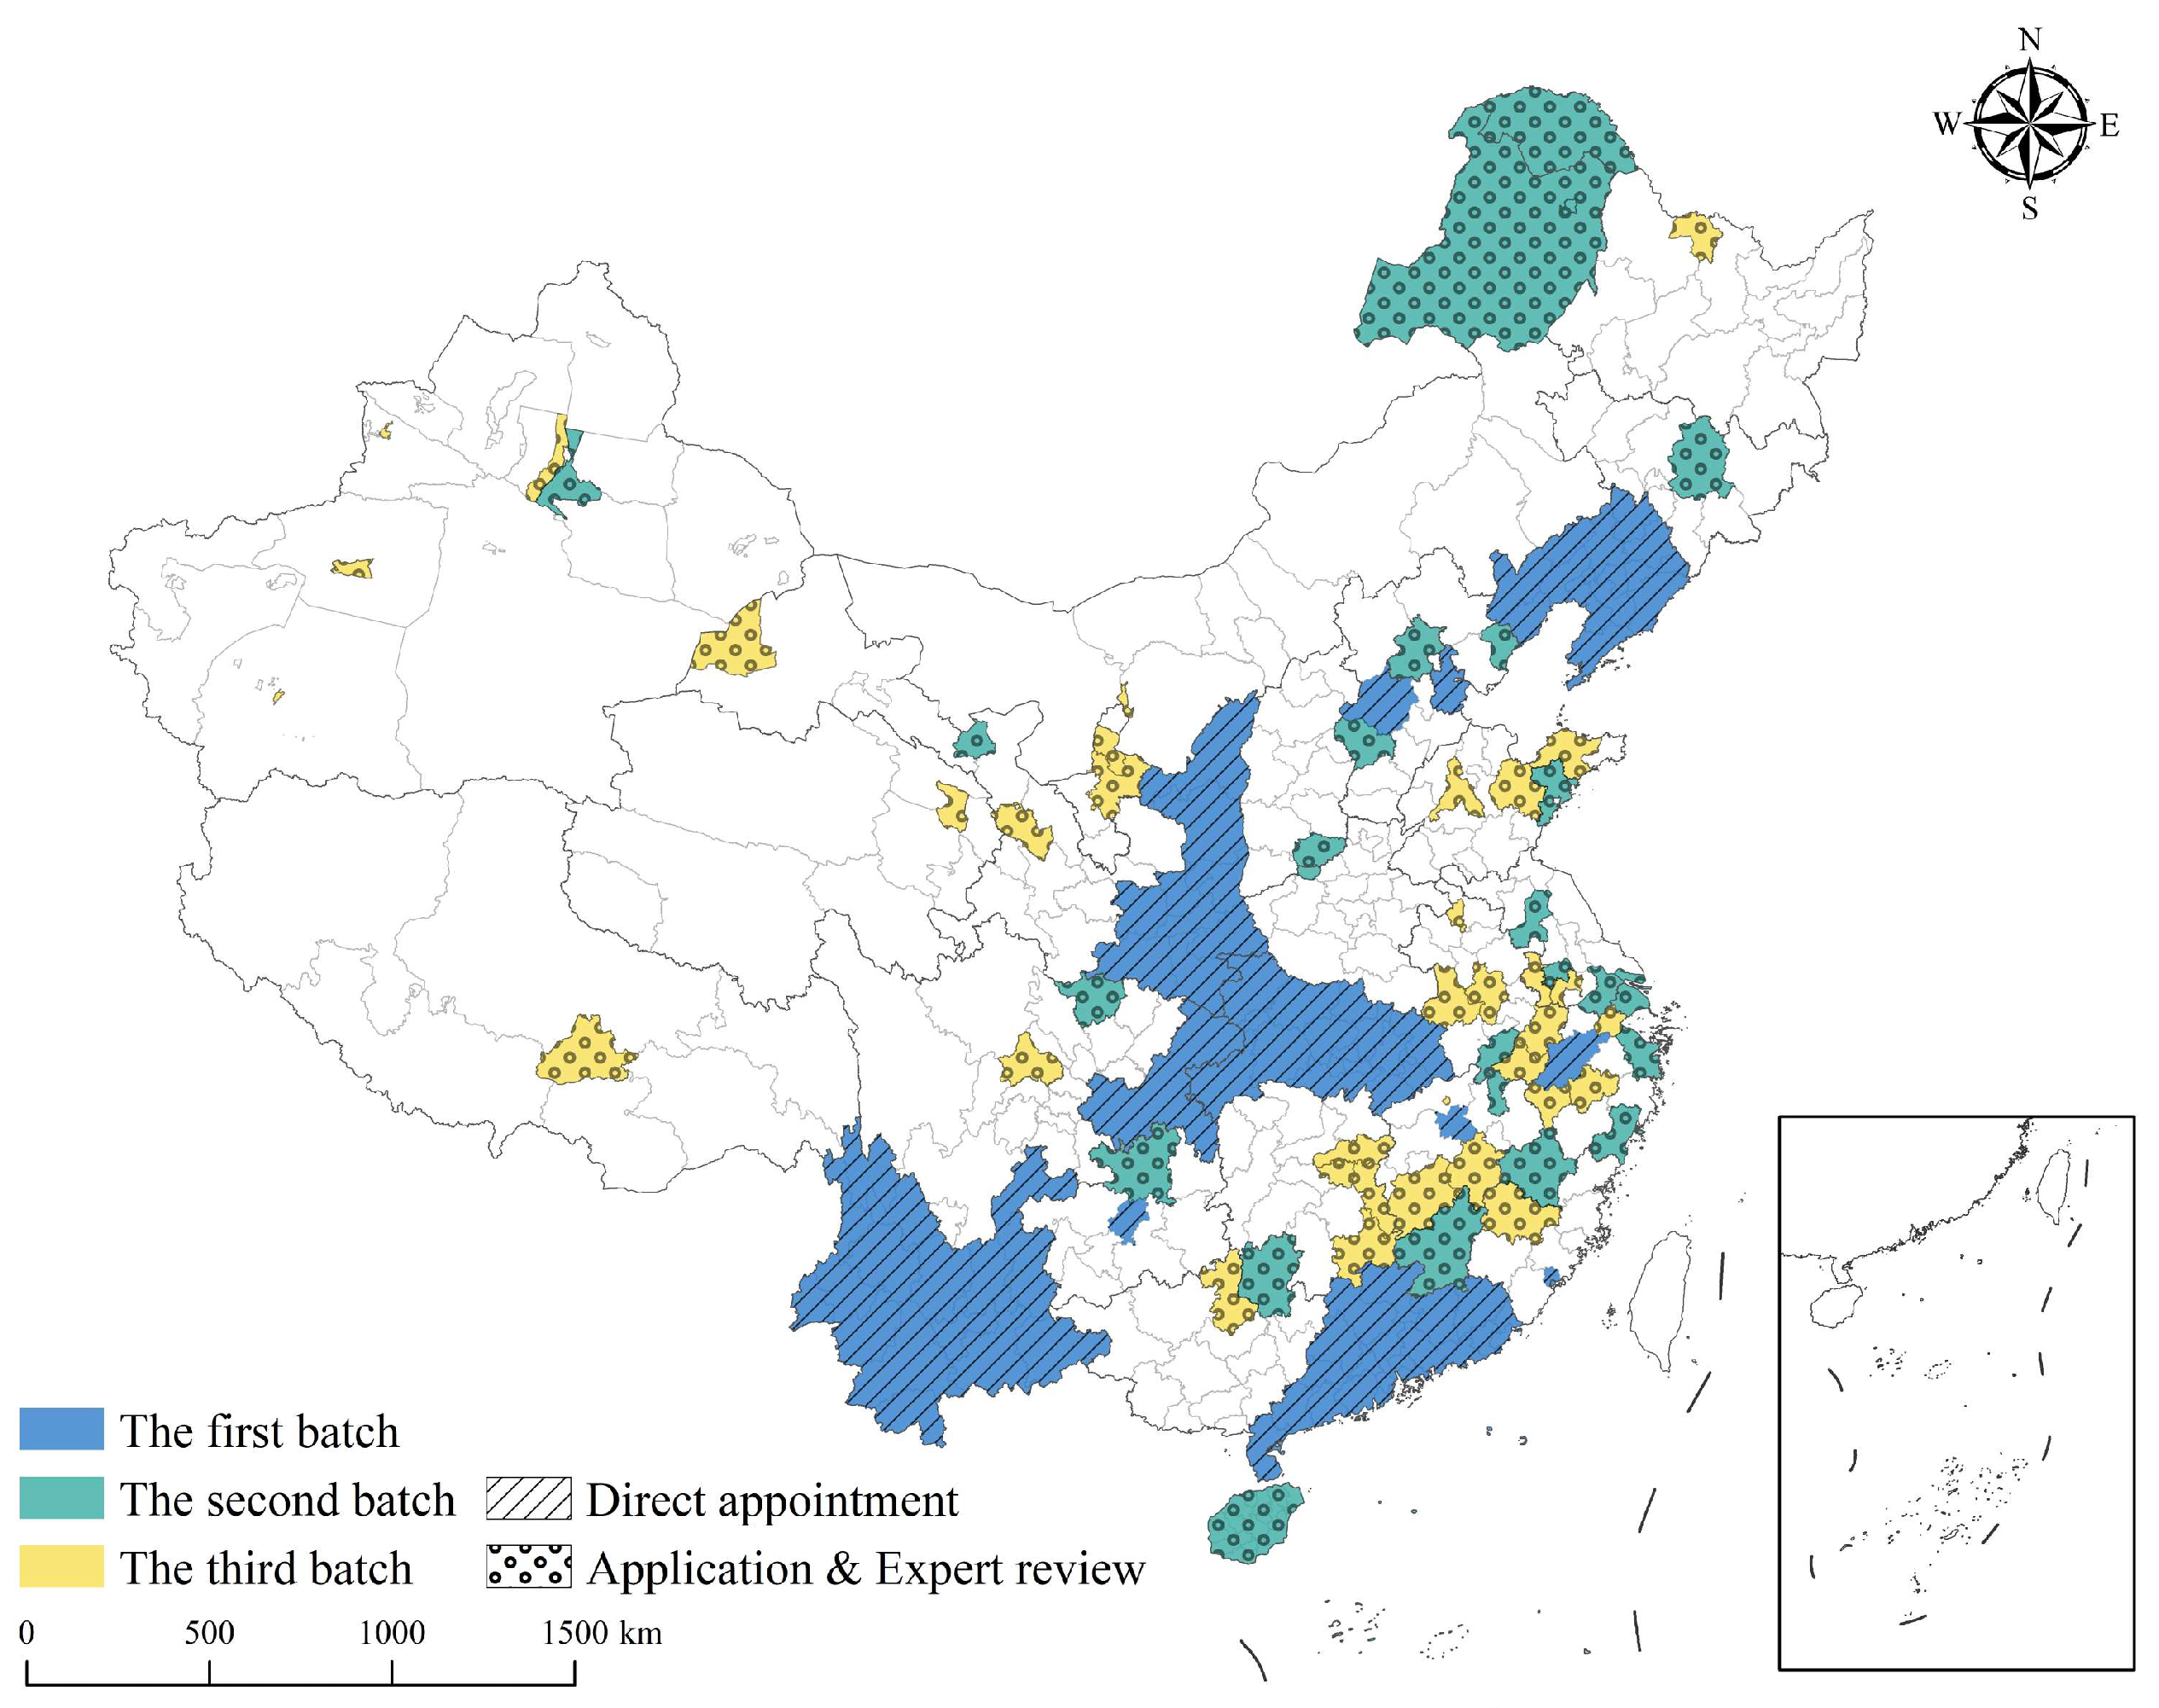
2.2. Low-Carbon City Pilot Policy in China

The LCCP policy is a significant policy experimentation initiative in China, aimed at addressing both carbon emissions and air pollution. Implemented by the National Development and Reform Commission of China (NDRC), the policy targets the optimization of co-emission sources to achieve carbon reduction and air quality improvements [19]. A central component of the LCCP policy is the promotion of renewable energy, with cities investing in wind, solar, and hydropower projects to reduce dependence on fossil fuels. Additionally, the policy emphasizes enhancing energy efficiency across industries, buildings, and households by encouraging technological upgrades, enforcing stricter energy consumption regulations, and adopting smart grid technologies [20,21]. These measures aim to curb greenhouse gas emissions while simultaneously lowering urban air pollutants, such as sulfur dioxide (SO2) and nitrogen oxides (NOx), thereby improving air quality. Beyond energy sector reforms, the LCCP policy drives the transformation of transportation systems and the implementation of sustainable urban planning. Pilot cities have introduced measures to expand public transit networks, promote electric and hybrid vehicles, and develop non-motorized transport infrastructure, such as cycling lanes and pedestrian-friendly urban spaces [20,22]. Concurrently, urban planning initiatives focus on increasing green spaces, optimizing land use, and integrating low-carbon development principles into city expansion projects.
The policies implemented in low-carbon city pilots fall into four main categories at both national and local levels: improving energy efficiency, promoting renewable energy development, restructuring sectoral compositions, and enhancing carbon sequestration capacity [20]. Thus far, China has launched three batches of LCCPs across metropolitan areas at the provincial and municipal levels, incorporating a total of 87 provinces, cities, districts, and counties into the pilot scope, including 15 of China’s 17 megacities. The selection of policy sites (shidian) in China primarily involves direct designation by the central government or a combination of central designation and local application [19,23] (see Figure 1).
The selection of the initial batch of pilot cities was conducted through direct appointment by higher authorities, and the second and third batches involved applications and expert reviews [24,25,26]. In 2008, the Ministry of Housing and Urban-Rural Development of China, in collaboration with the World Wildlife Fund (WWF), launched a low-carbon city pilot program in Shanghai and Baoding City, marking the commencement of the LCCPs’ pre-pilot phase. In 2010, the NDRC selected eight cities—Tianjin, Chongqing, Shenzhen, Xiamen, Hangzhou, Nanchang, Guiyang, and Baoding—as the initial pilot regions. The second and third pilot batches were launched in November 2012 and February 2017, respectively, encompassing a total of 27 and 45 cities [25,26]. The initially assigned pilot cities were all provincial capitals. The scope of the pilot policy has progressively encompassed second-, third-, and fourth-tier cities at the prefecture level in the subsequent batches.
During the implementation of the LCCPs, the “top-level design” approach of the central government plays a critical role. Central authorities primarily adopt command-mandatory tools within a target-based environmental and energy management system to eliminate outdated production capacities, enhance energy efficiency in green buildings, establish vehicle emission control standards, and shape government procurement practices [19,23]. Specifically, through the Target Responsible System (TRS), the NDRC sets ambitious energy-saving and emission-reduction goals in a top-down approach, and local governments are mandated to commit to these targets and strive to fulfill them [23,27] (The Target Responsibility System (TRS) is a widely adopted policy mechanism in China designed to ensure the effective implementation of government initiatives, including environmental and low-carbon policies. Under the TRS, specific quantitative targets related to carbon emission reductions, energy efficiency improvements, and pollution control are assigned to local governments, enterprises, and key stakeholders. These targets are integrated into performance evaluations, holding officials accountable for their achievement. Failure to meet the designated goals may result in administrative penalties, reputational damage, or career advancement restrictions, whereas successful implementation can lead to rewards and incentives.). In the context of the low-carbon city pilot policy, the TRS serves as a key enforcement tool by embedding carbon reduction objectives into local governance. Municipal governments participating in the LCCP are required to submit detailed action plans outlining strategies for emission reduction, renewable energy adoption, and sustainable urban development. Their progress is regularly monitored through a combination of self-reporting, third-party evaluations, and governmental inspections. The TRS ensures that local authorities actively engage in policy implementation and adopt effective measures to meet national climate goals, ultimately driving the transition toward a low-carbon economy in Chinese metropolitan areas. Achieving these targets is important, as they significantly impact performance assessments and career advancement for local officials [28]. According to the Ministry of Ecology and Environment of the People’s Republic of China [29], more than half of the pilot cities have already established a greenhouse gas assessment target responsibility system.
Since the introduction of the second batch of LCCPs, the central authorities have significantly advanced efforts to foster collaborative innovation in pollution control and carbon reduction [12]. Many pilot cities have developed an evaluation index to synergistically reduce pollution and carbon emissions. This index, as part of the TRS, outlines specific measures for initiating pilot projects in pollution control and carbon reduction, including energy structure adjustments and coordinated governance enhancement, water environments, and solid waste management [29]. Although governmental agencies at various levels have emphasized the importance of air quality control and reported on the effects of the LCCP policy [12], there remains a noticeable gap in the literature, with few comprehensive and systematic studies have examined the policy’s impact on air quality [15,27,30].

3. Methodology

3.1. Data

This study draws on daily air pollution data from the China National Environmental Monitoring Center (CNEMC), the official government source for air quality data in China. The dataset includes daily air quality index (AQI) scores for 114 prefecture-level cities over the period from 2001 to 2019, resulting in 2166 city-year observations. The CNEMC dataset is publicly available, widely used in environmental research, and recognized as an authoritative source. It comprises data from 1376 monitoring stations distributed across the country, ensuring extensive and consistent coverage across all sample cities. For each city, we calculated the mean, minimum, maximum, and standard deviation of the daily mean AQI. Additionally, exogenous control variables, including the secondary industry rate, urbanization rate, and green coverage rate, were obtained from the China City Statistical Yearbook for the years 2002 to 2020. Information on the three batches of LCCPs, including their implementation years, were retrieved from the official website of the National Development and Reform Commission of China. In this study, cities included on the LCCPs list are classified as being under the “low-carbon policy”. The dataset contains 216 treated event units and 1905 untreated event units (see Figure 2). The majority of event units fall within the untreated group, which consists of cities either never-treated (non-LCCPs) or not-yet-treated (see Figure 2). This classification enhances the precision of the estimated treatment effects.
Figure 3 presents the average values for air quality indicators in each batch of LCCPs and non-LCCPs, including the mean, minimum, maximum, and standard deviation of the daily mean AQI at the year level. Notably, a peak in these four AQI indicators appears around 2013, which can be attributed to a combination of regulatory changes, economic activities, and improvements in air quality monitoring. Specifically, the implementation of the new Ambient Air Quality Standard in 2013 introduced stricter environmental regulations and included PM2.5 as a monitored pollutant [31]. Since PM2.5 is a major contributor to air pollution, its inclusion caused a technical increase in recorded AQI values rather than a true deterioration in air quality. In addition, the expansion of the air quality monitoring network significantly increased the number of monitoring stations, particularly in heavily polluted areas, resulting in more comprehensive and accurate pollution measurements. A comparison of the average values of the mean, minimum, and standard deviation of the AQI shows no systematic difference in trends between LCCPs and non-LCCPs prior to the introduction of the LCCP policy in 2011, as indicated by the negligible gap between the two groups. This indicates that these three indicators followed similar trends for both groups before policy implementation, supporting the assumption of parallel pre-treatment trends, which is essential for the validity of the difference-in-differences (DID) estimation. These initial findings provide support for the rationality of the chosen methodology.
Discrepancies in the trends of maximum AQI values between LCCPs and non-LCCPs were observed, indicating that the parallel trend assumption might not hold for this specific indicator. However, two heterogeneity-robust estimates were calculated to evaluate the effects of the LCCP policy on the maximum AQI value. This method enables unbiased estimation of the effects, even when the parallel trend assumption is relaxed.
Notably, LCCP cities generally exhibit higher mean, maximum, and standard deviation AQI values compared to non-LCCP cities. However, after being designated as LCCPs, their corresponding AQI indicators become lower than those of non-LCCP cities (see Figure 3). This shift may be attributed to the implementation of the LCCP policy. In contrast, the minimum AQI values for LCCPs consistently remain lower than those of non-LCCPs throughout the period from 1999 to 2021, suggesting that the LCCP policy may have no significant effect on the minimum AQI value.

3.2. Benchmarking Estimation

3.2.1. Difference-in-Differences with Two-Way Fixed Effects (TWFE-DID)
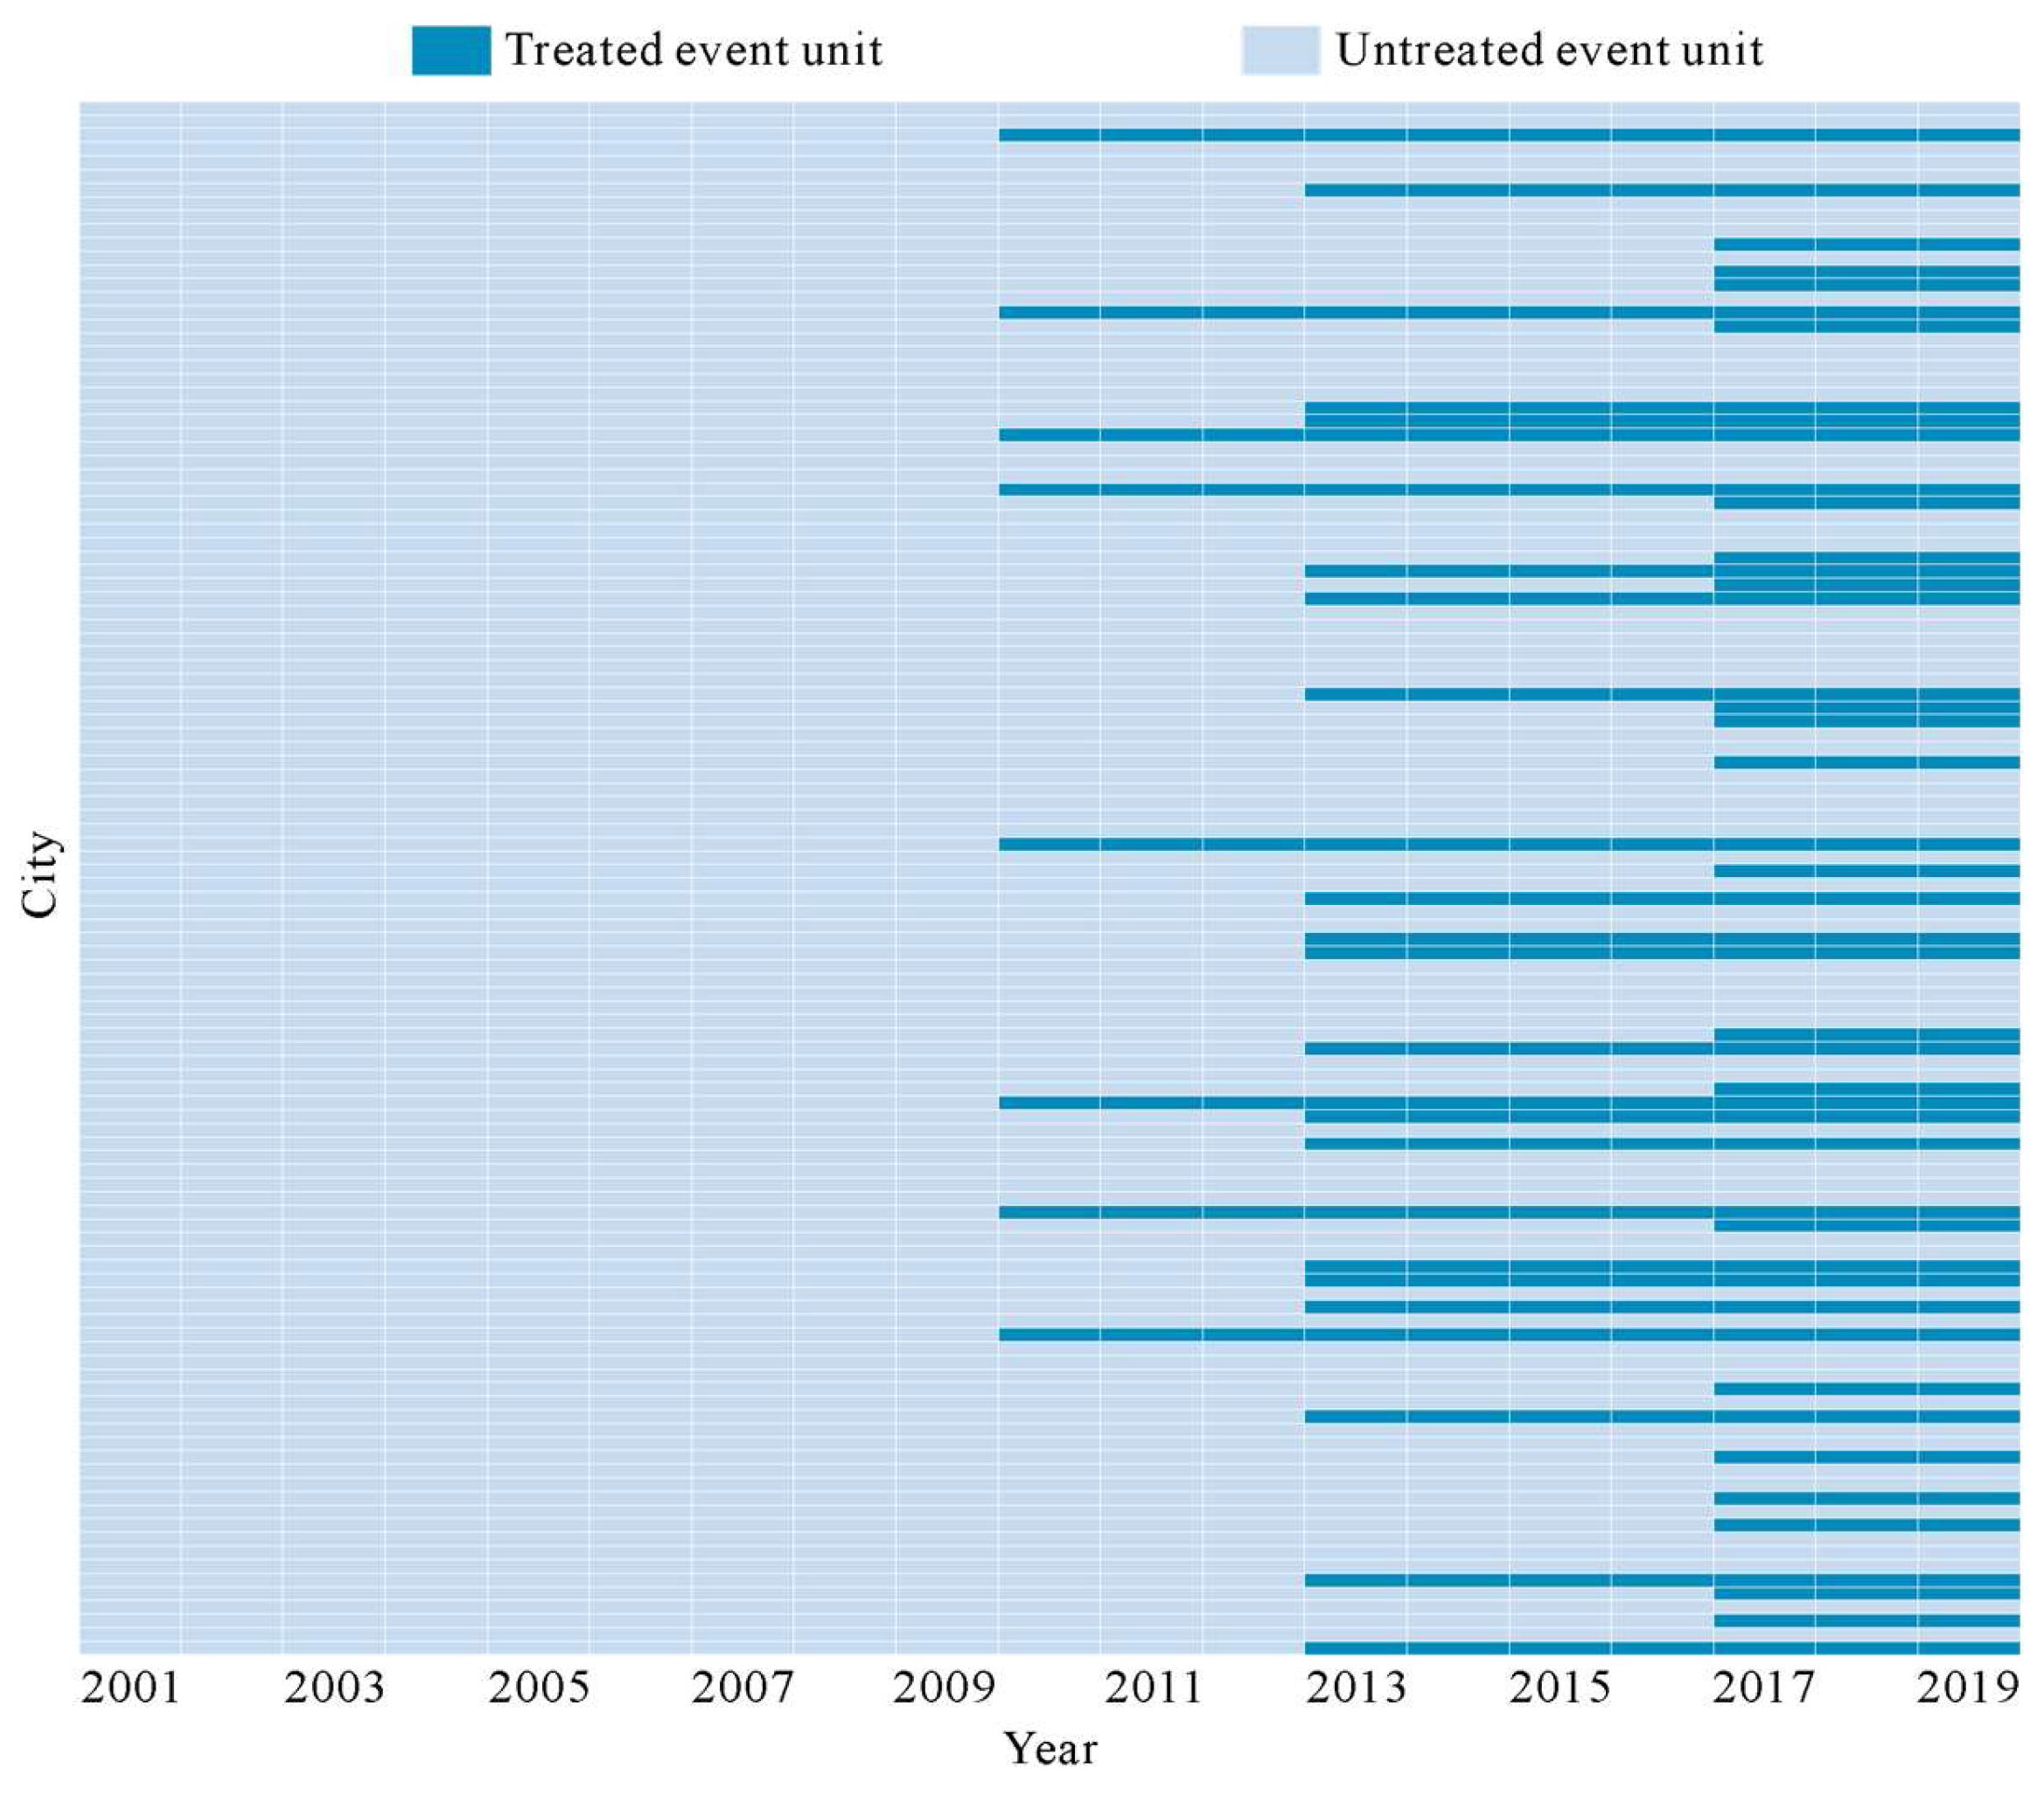
Since the LCCP policy has already been implemented in China, the available data are observational, making a fully experimental design infeasible for assessing the policy’s effects on air quality. The difference-in-differences (DID) model, a quasi-experimental approach, is employed to compare changes in outcomes between the treatment group (units that implemented the policy) and the control group (units that did not implement the policy) before and after policy implementation [32]. This method effectively addresses selection bias arising from the non-random assignment of policy implementation by controlling for time-invariant confounding factors, thereby enabling robust causal inference on the impact of the LCCP policy on air quality. The DID model is particularly well-suited for research contexts where random assignment of policies or interventions is not feasible. Accordingly, the impact of the LCCP policy is evaluated using a DID specification, following the approach outlined by Beck et al. [33], to accommodate the time-varying nature of the treatment periods in this study. The assessment is based on the following regression set-up:
l n A Q I i t = α + β P o l i c y i t + δ C o n t r o l i t + μ i + λ t + ε i t
where AQIit represents the air quality measure for city i (i = 1, …, 114) in year t (t = 2001, …, 2019), expressed in the logarithm form of the mean, minimum, maximum, and standard deviation of the daily mean AQI at the annual level; Policyit is a dummy variable that equals 1 for the years after city i became an LCCP and 0 otherwise; Controlit includes a set of time-varying city-level control variables, including the secondary industry rate, urbanization rate, and green coverage rate; μi and λt represent city and year fixed effects, respectively; while β and δ are coefficients, and εit is the random disturbance term. Notably, β captures the impact of the LCCP policy on air quality.
The TWFE-DID estimation technique effectively addresses omitted variable bias in this study. City-specific dummy variables are incorporated into the model to account for unobserved city characteristics that remain constant over time but impact air quality. Meanwhile, year-specific dummy variables are employed to control for nationwide shocks and trends that shape air quality changes over time, such as the global economic crisis in 2008 and China’s central heating project in 2013 [15]. In addition, to address the correlation of error terms within cities over time, Equation (1) is estimated with clustered standard errors at the city level.

3.2.2. Event Study

The parallel assumption is a prerequisite for unbiased estimation of the treatment effect using the TWFE-DID method. To test this assumption, an event study is conducted following the approach outlined by Jacobson et al. [34]. Subsequently, the average treatment effects for each period are estimated using the following equation:
l n A Q I i t = α + k 15 8 β k P o l i c y i t k + δ C o n t r o l i t + μ i + λ t + ε i t
where AQIit, Controlit, μi, λt, δ, and εit are defined as in Equation (1). P o l i c y i t k is a dummy variable representing the LCCP appointment event, defined as 1 when the relative event time is k, and 0 otherwise (relative event time = year − the year the city was designated as an LCCP); the relative event time k = −16 is automatically dropped; βk is the corresponding treatment effect for the appointment event P o l i c y i t k .

3.2.3. Variable Descriptions

The statistical descriptions of the main variables in this study are presented in Table 1. Four dependent variables are examined: the mean AQI, the minimum AQI, the maximum AQI, and the standard deviation of AQI. The primary policy variable of interest is the treatment status. The LCCP policy potentially influences various domains, including advancing green science and technology, restructuring industrial frameworks, promoting urban development, and enhancing landscape engineering, all of which collectively contribute to improved air quality. Consequently, the secondary industry rate, urbanization rate, and green coverage rate are included as control variables. Missing values are identified in the minimum value and standard deviation of the AQI, the secondary industry rate, the urbanization rate, and the green coverage rate. Observations with missing values are excluded from the analysis.

3.3. Heterogeneity Treatment Effect Test

3.3.1. DID Decomposition Estimates

Conventional regression-based estimators fail to yield unbiased estimates of treatment heterogeneity within the TWFE-DID framework due to the presence of negative weights and forbidden comparisons, as highlighted by De Chaisemartin and d’Haultfoeuille [35] and Borusyak et al. [36]. Consequently, the TWFE-DID analysis of LCCPs may also produce biased estimates, particularly when treatment effects vary across years and cities. To address this issue, we adopt the approach outlined by Goodman-Bacon [37], which decomposes the TWFE-DID estimate of LCCPs into a series of two-group/two-period DID estimators, each associated with specific weights.
β ^ D I D = S k U β ^ k U 2 × 2 + S l U β ^ l U 2 × 2 + S k l k β ^ k l 2 × 2 , k + S k l l β ^ k l 2 × 2 , l
where β ^ D I D represents the TWFE-DID estimate; k denotes the early treatment group, which corresponds to the first and second batch of LCCPs here; l is the late group treatment, corresponding to the second and third batch of LCCPs here; U is the group of non-LCCPs, which never receives treatment; β ^ k U 2 × 2 , β ^ l U 2 × 2 , β ^ k l 2 × 2 , k , and β ^ k l 2 × 2 , k are the 2 × 2 (two-group/two-period) DID estimators, and S k U , S l U , S k l k , and S k l l are their corresponding weights.
The weights of each 2 × 2 DID estimator can be calculated using the following formula set:
S k U = n k + n U 2 n k U 1 n k U D ¯ k 1 D ¯ k S l U = n l + n U 2 n l U 1 n l U D ¯ l 1 D ¯ l S k l k = n k + n l 1 D ¯ l 2 n k l 1 n k l D ¯ k D ¯ l 1 D ¯ l 1 D ¯ k 1 D ¯ l S k l l = n k + n l D ¯ k 2 n k l 1 n k l D ¯ l D ¯ k D ¯ k D ¯ l D ¯ k
where n represents the group size and D is the treatment variance based on the share of time.

3.3.2. DID Estimation Based on Nonparametric Identification

To ensure the robustness of our results to treatment effect heterogeneity and dynamics, we employ a DID estimation framework based on nonparametric identification, as introduced by Callaway and Sant’Anna [38]. Specifically, we use estimators derived from Callaway and Sant’Anna [38], referred to as CS-DID, to test the robustness of the TWFE-DID estimates. This approach provides a concise summary of heterogeneity in the treatment effects across different groups and periods, denoted as ATT (g, t), which represents group–time treatment effects. The group-time average effects (ATTs) are nonparametrically point-identified using the not-yet-treated group (or the never-treated group, though the not-yet-treated group is selected here) and are calculated using the following formula set:
A T T g , t u n c n e v = E Y t Y g 1 G g = 1 E Y t Y g 1 C = 1 A T T g , t u n c n y = E Y t Y g 1 G g = 1 E Y t Y g 1 D t = 0
where g is the year when a city first became an LCCP; G is the group of cities that first became LCCPs in year g; Gg is a binary variable defined as 1 if a city was first nominated as an LCCP in year g, and 0 otherwise; Yt is the AQI of a city (belonging to group G) in year t; Yg−1 is the AQI of a city (belonging to group G) in the year prior to its LCCP designation; C is a binary variable defined as 1 if a city has never been treated as an LCCP and 0 otherwise; Dt is a binary variable defined as 1 in the years following a city’s designation as an LCCP, and 0 otherwise; nev refers to the control group consisting of never-treated cities (C = 1); ny refers to the control group of not-yet-treated cities (Dt = 0); and unc indicates that control variables are not considered.
The ATT (g, t) is estimated using a doubly robust DID approach that combines stabilized inverse probability weighting and ordinary least squares regression with the inclusion of control variables [39]. In this study, the not-yet-treated group is adopted as the control group.

3.3.3. DID Estimation Based on Imputation

To further check the robustness of the TWFE-DID estimates, this study employs a method developed by Borusyak et al. [36], designed specifically for settings with staggered treatment adoption and unrestricted treatment-effect heterogeneity through an intuitive “imputation” approach. This method is referred to as IP-DID in our analysis. The average treatment effects of LCCPs on the AQI are calculated using Equation (2) and follow the steps outlined below.
First, the untreated observations are used to fit the city fixed effects ( μ ^ i ) and the year fixed effects ( λ ^ t ) through the regressions specified in Equation (2). Second, the untreated potential outcomes are imputed using these fixed effects, and the estimated treatment effect for each treated observation is calculated as:
β ^ i t = l n A Q I i t μ ^ i λ ^ t
Finally, the average treatment effects (ATTs) are calculated with a weighted sum of these treatment effect estimates:
A T T = Ω 1 w i t β i t
where Ω 1 denotes the set of treated observations in a panel for city i and year t; wit is the weights corresponding to the estimation target.

4. Results

This study examines the impacts of the LCCP on air quality using a TWE-DID model, incorporating multiple robustness-check strategies to ensure the reliability of the findings. Specifically, (1) a dynamic event study was conducted to test the parallel trend assumption; (2) a placebo test was performed to check the randomness of the LCCP policy effects; (3) the heterogeneity treatment effects of the LCCP were examined through a DID decomposition and heterogeneity-robust DID models; (4) the mechanism through which the LCCP policy influences AQI was thoroughly investigated; (5) the effects of the LCCP on the AQI were estimated across various city groups, categorized based on specific grouping standards, to assess the differential impacts of the policy.

4.1. Benchmarking Impacts

4.1.1. Results of the TWFE-DID Estimation

The results of the TWFE-DID estimation show that the LCCP policy significantly reduces the mean, maximum, and standard deviation of the AQI, while having no notable effect on the minimum AQI (refer to Table 2). These findings are robust across models without control variables (Model 1, Model 3, and Model 7) and those with control variables (Model 2, Model 4, and Model 8), as evidenced by the close similarity in their coefficients. Controlling for the secondary industry rate, urbanization rate, and green coverage rate at the city level and fixing fixed effects at the city–year level, the LCCP policy is associated with reductions of 9.3%, 20.8%, and 19.8% in the mean, maximum, and standard deviation of the AQI, respectively. Furthermore, a one percentage point increase in the secondary industry rate significantly increases the mean, maximum, and standard deviation of the AQI by 0.3%, 0.7%, and 0.6%, respectively, while decreasing the minimum AQI by 0.3%. Similarly, a one-percentage-point increase in the urbanization rate increases the mean, maximum, and standard deviation of the AQI by 0.2%, 0.4%, and 0.3%, respectively. A one-percentage-point increase in the green coverage rate decreases the mean, maximum, and standard deviation of the AQI by 0.2%, 0.5%, and 0.5%, respectively. Overall, these findings are consistent with theoretical predictions.
The results further indicate that the LCCP policy not only improves overall air quality but also reduces fluctuations in air quality. These effects may be attributed to efforts by LCCPs in industrial structure adjustment, urban development, and landscape engineering. However, the LCCP policy may have potential to slightly increase the minimum AQI, although this effect is statistically insignificant.

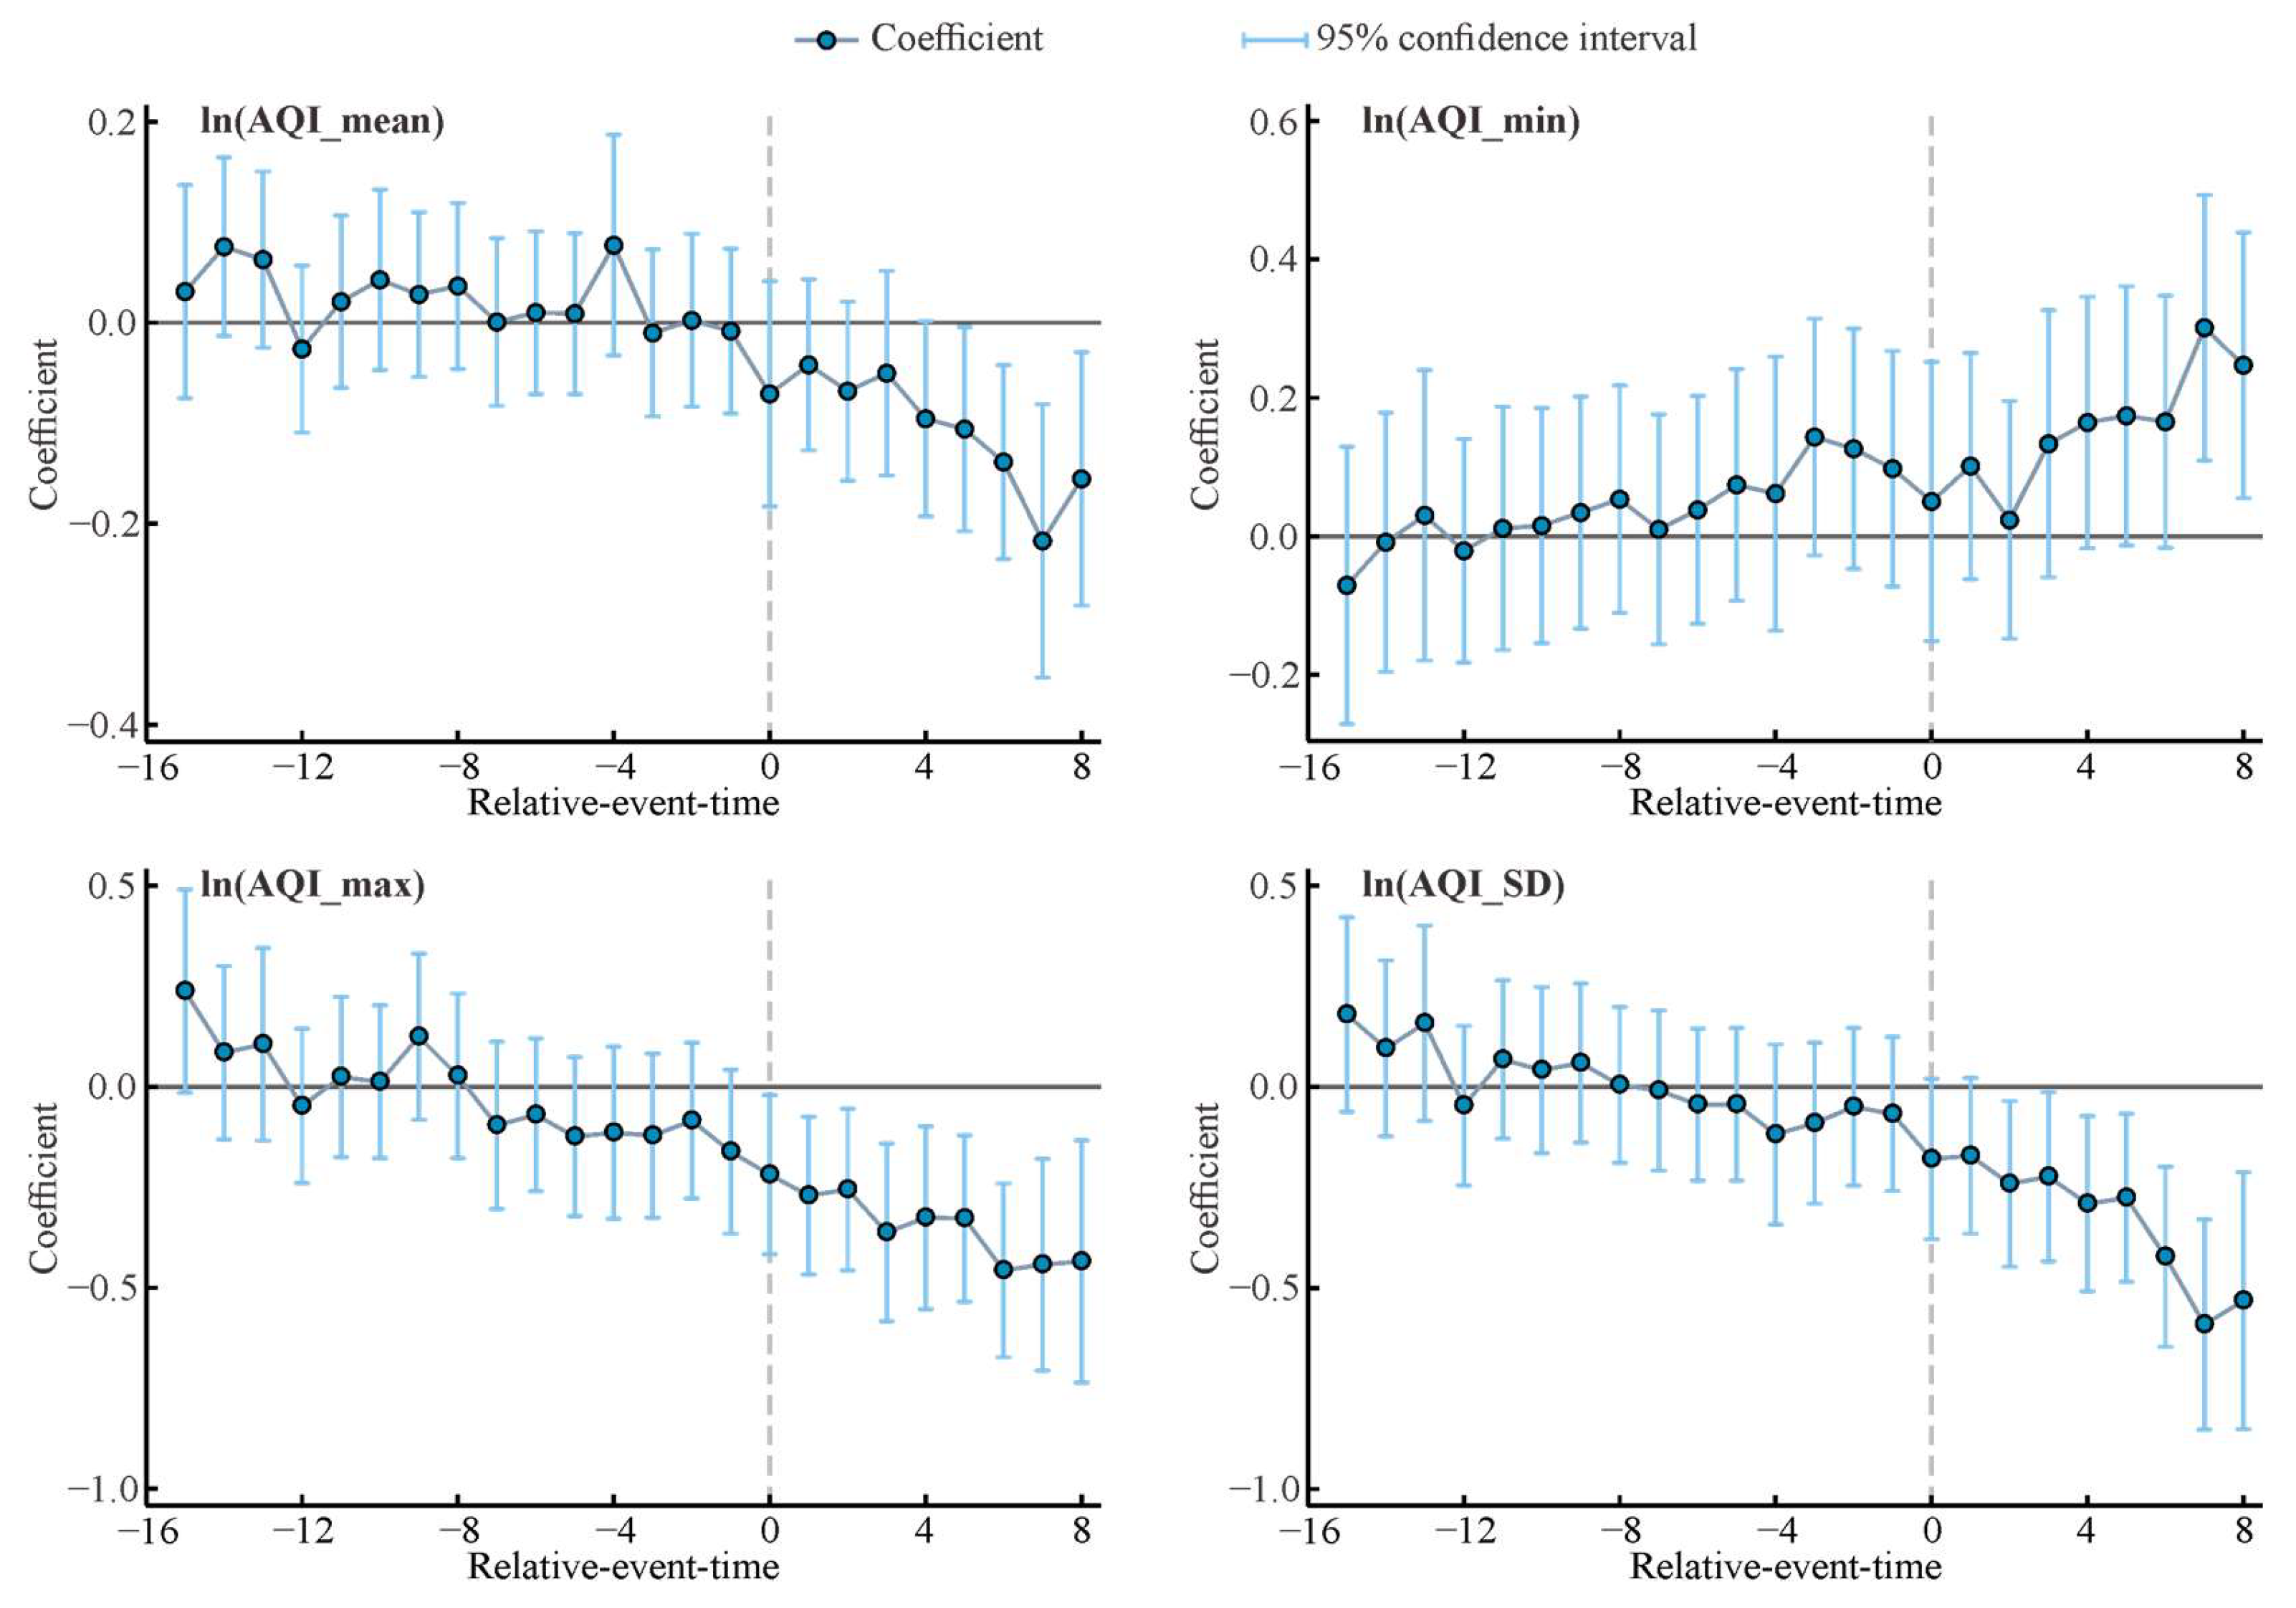
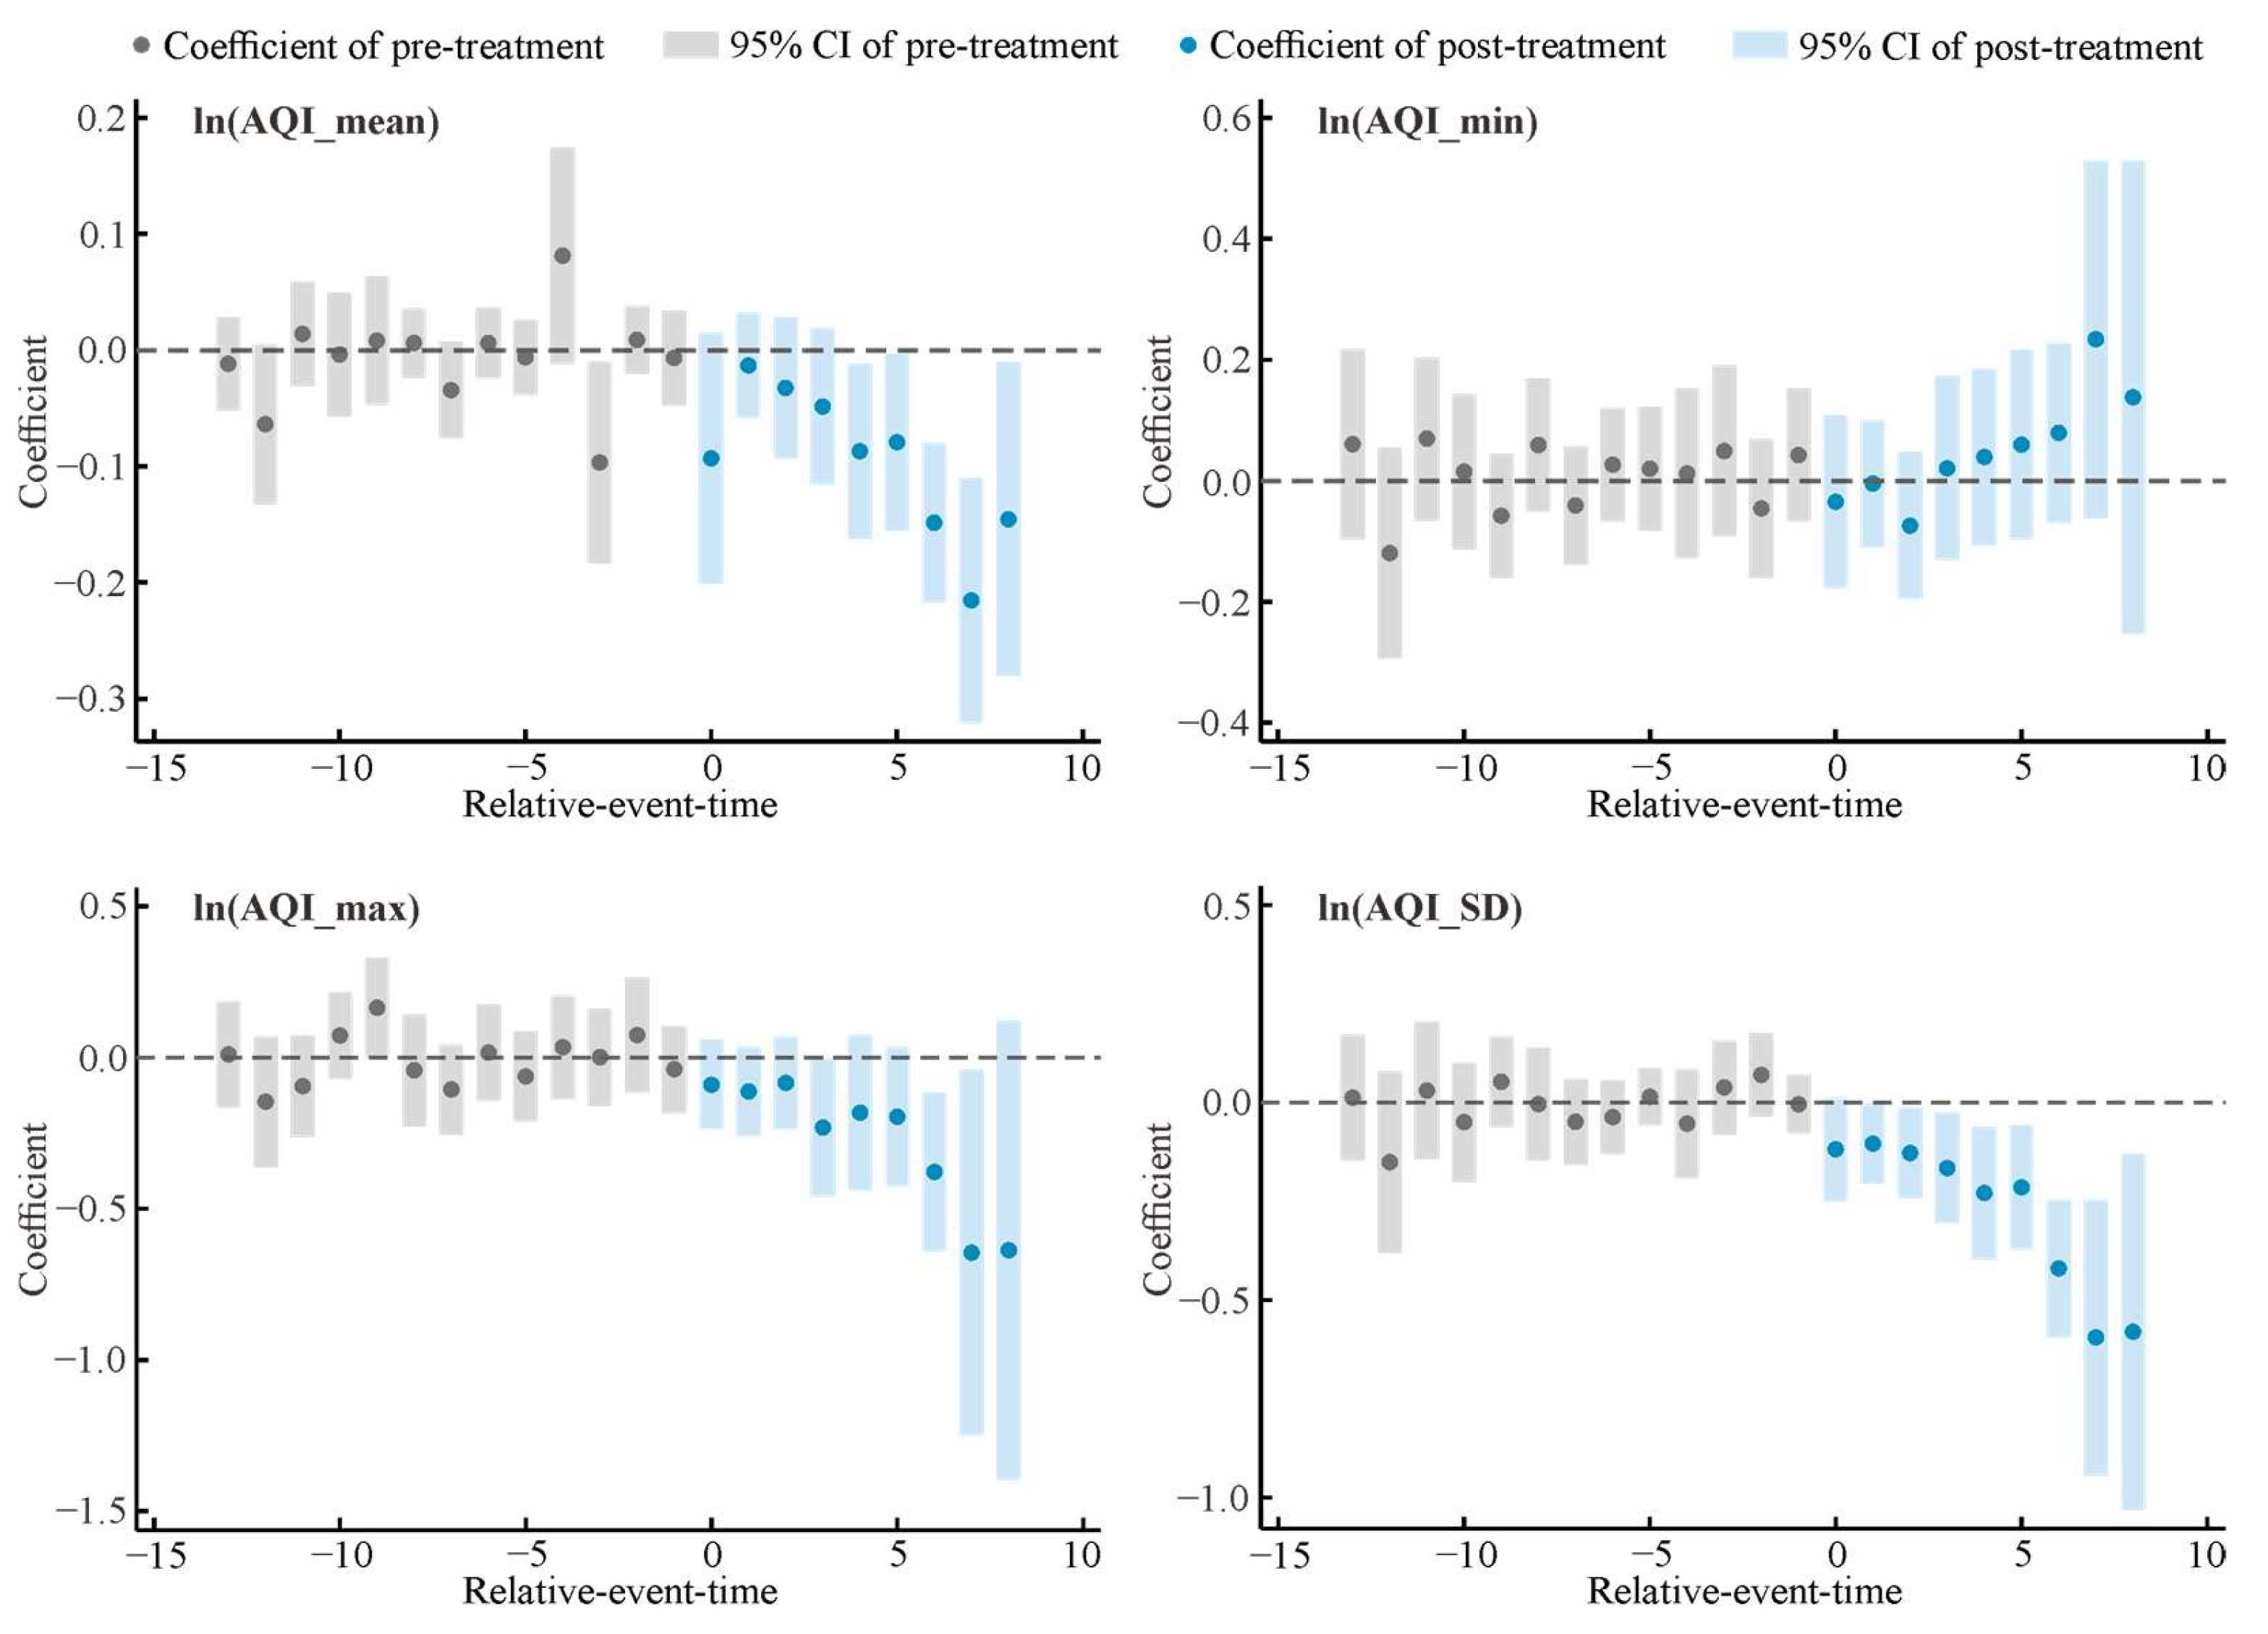
4.1.2. The Dynamic Effects

The dynamic effects of the LCCP policy, estimated through an event study, are presented in Figure 4. The charts reveal that the effects prior to the policy implementation are insignificant at the 0.05 level, indicating similar pre-event AQI trends between LCCP and non-LCCP cities. This finding validates the parallel trend assumption required for DID estimation, thereby strengthening the reliability of the results [40].
The results reveal a lagged effect of the policy, with improvements in air quality becoming more pronounced over time. The stabilization of the LCCP policy’s effects is delayed, taking approximately four years for the mean AQI and two years for the standard deviation of the AQI, as illustrated in Figure 4. This delay may stem from challenges cities encounter in transforming their environmental profiles within a short timeframe. Conversely, the policy exerts an immediate impact on the maximum AQI in the year of implementation, underscoring the maximum AQI value’s sensitivity to the LCCP policy.

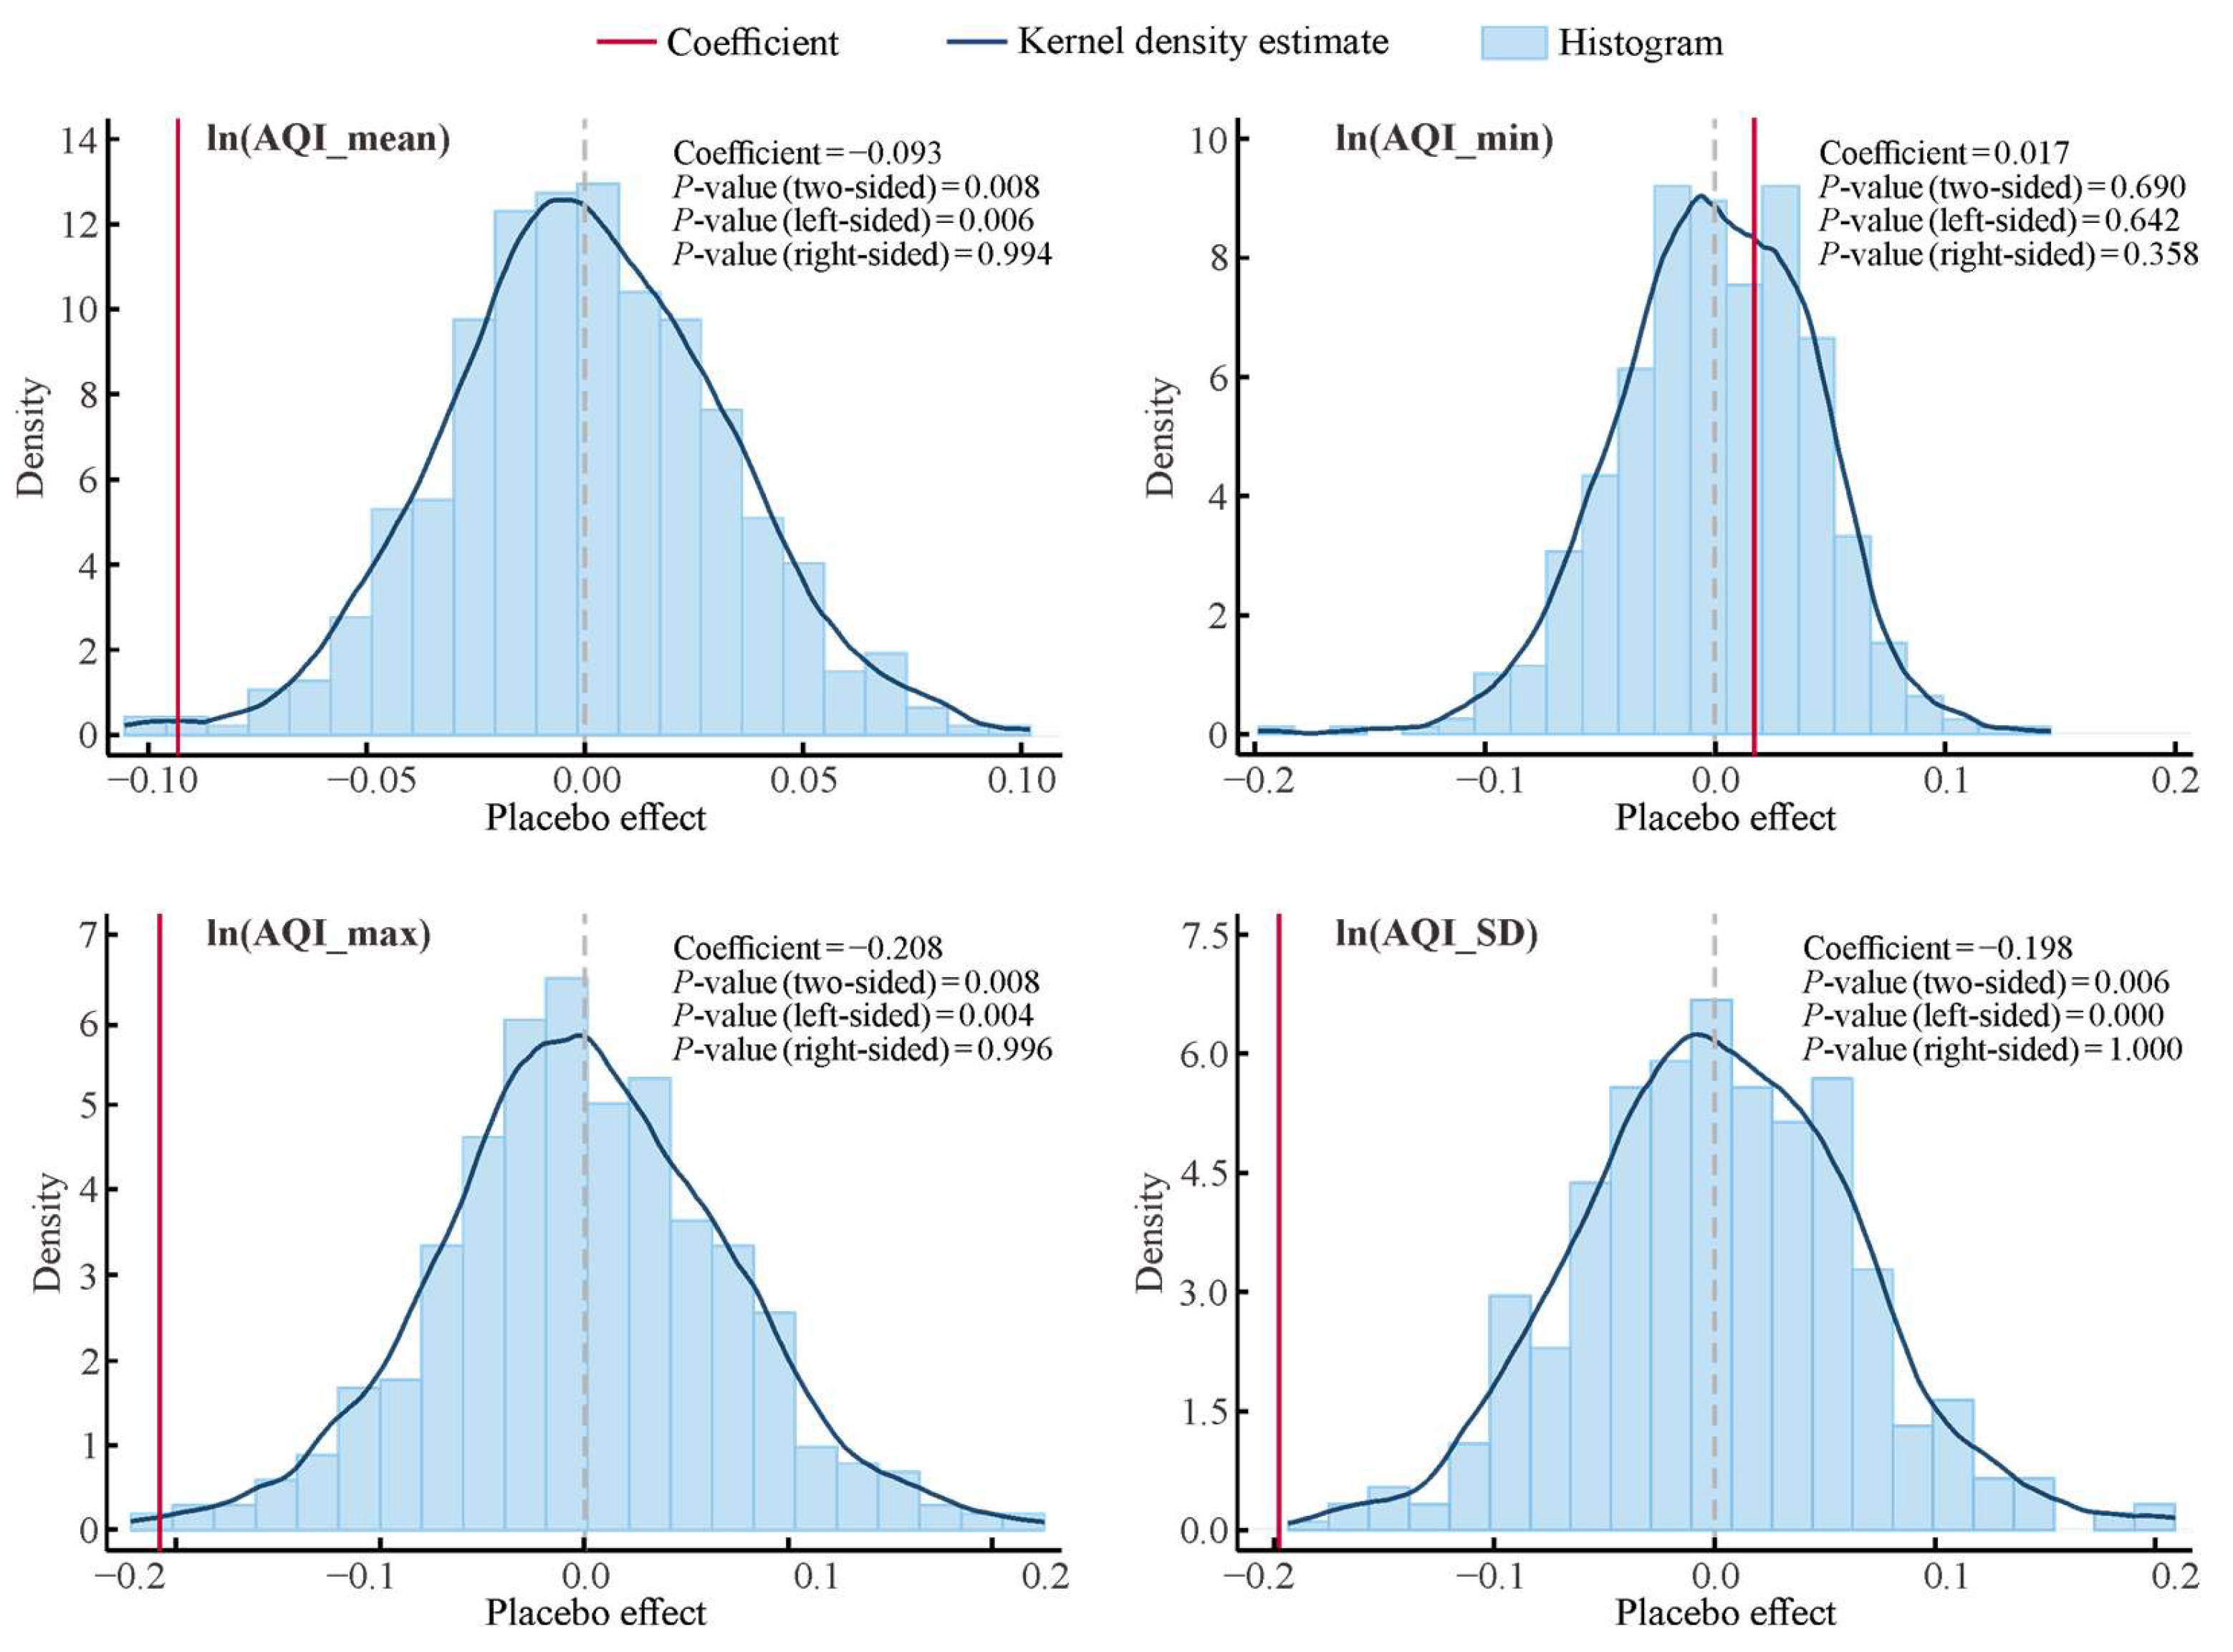
4.1.3. Results of Placebo Test

To address potential estimation bias in policy effects caused by unobserved factors, restricted mixed placebo tests (mixed both in time and in space) were performed for each AQI indicator. These tests involved 500 regressions on treatment groups with randomly assigned treatment cities and policy start dates [41]. Figure 5 displays the distributions of these 500 estimates for the core coefficients for each AQI indicator. The results indicate that the coefficients for the false reforms follow normal distributions with a mean of zero, while the real policy effects on the mean (−0.093), maximum (−0.208), and standard deviation (−0.198) of the AQI, represented by red lines, lie at the extreme end of the distribution and fall below the 1% quantile (p-value of the left side is less than 0.01). Consistent with the results of the TWFE-DID, the real policy effect on the minimum AQI is non-significant, as its red line is close to zero, and the p-values on the left side (0.642) and right side (0.358) are both larger than 0.1. These findings confirm that unobserved factors do not significantly influence the results.

4.2. Results of Heterogeneity Treatment Effects Estimation

4.2.1. DID Decomposition Result

To address potential bias on the TWFE-DID estimators caused by contaminations from causal effects of other relative time periods [37,42], we performed a DID decomposition on the logarithm of the AQI mean. The TWFE-DID estimate of −0.091 is derived as a weighted average of the values on the y-axis, based on their corresponding values on the x-axis (see Figure 6), showing that 20.2% of the estimate comes from timing variation. Comparisons of treated units to never-treated units contribute 84.8% of the weight to the TWFE-DID estimate, while comparisons of earlier-treated units to later-treated units account for 16.6%. Conversely, comparisons of later-treated units to earlier-treated units, which could introduce bias into the overall TWFE-DID estimate, carry a minimal weight of 3.6%. Consequently, the potential bias from “bad comparisons” in our findings is considerably limited.

4.2.2. Heterogeneity-Robust Estimates

Heterogeneity-robust estimates for the effects of the LCCP policy on the AQI are calculated using methods proposed by Callaway and Sant’Anna [38] and Borusyak et al. [36], denoted as CS-DID and IP-DID, respectively (see Table 3). Compared with the ATTs estimated by the TWFE-DID model for the mean and maximum AQI (−0.093 and −0.208), the CS-DID model produces smaller effects (−0.074 and −0.193), while the IP-DID model yields larger effects (−0.097 and −0.217). Additionally, both the CS-DID and IP-DID models estimate larger effects on the minimum AQI (−0.205 and −0.207) than those estimated by the TWFE-DID model (−0.198). Despite these variations, the heterogeneity-robust estimates align with the TWFE-DID model’s overall findings that the LCCP policy significantly decreases the mean, maximum, and standard deviation of the AQI while showing no significant effect on its minimum value. Therefore, the robustness of the TWFE-DID estimators is confirmed in this study.
The dynamic effects of the LCCP policy on the AQI, analyzed using the CS-DID model (see Figure 7), closely align with those derived from the TWFE-DID model (see Figure 4). Specifically, the policy’s impact on the mean AQI becomes statistically significant four years after the implementation, and its effect on the AQI’s standard deviation emerges two years after the implementation. For both indicators, outside these specified periods, the effects remain non-significant, indicating a delayed but tangible policy impact on air quality improvement and variability reduction.
Differences are observed between the dynamic estimators derived from the CS-DID (see Figure 7) model and those from the TWFE-DID model (see Figure 4). For the minimum AQI, the CS-DID model yields non-significant results for all estimators, while the TWFE-DID model identifies two significant estimators in 2018 and 2019. Regarding the dynamic effects on the maximum AQI, the CS-DID model produces two significant estimators (2017 and 2018), while the TWFE-DID model shows significant estimators for every year from 2012 to 2019.
It is evident that previously significant policy impacts on the minimum and maximum AQI during certain periods become non-significant after adjusting for heterogeneity. This is particularly noticeable in the estimation of the policy’s effects on the maximum AQI, where the results from the two models differ significantly. The variance in trends for the maximum AQI between LCCP and non-LCCP cities may also contribute to these differences, as shown in Figure 7 and Figure 8.

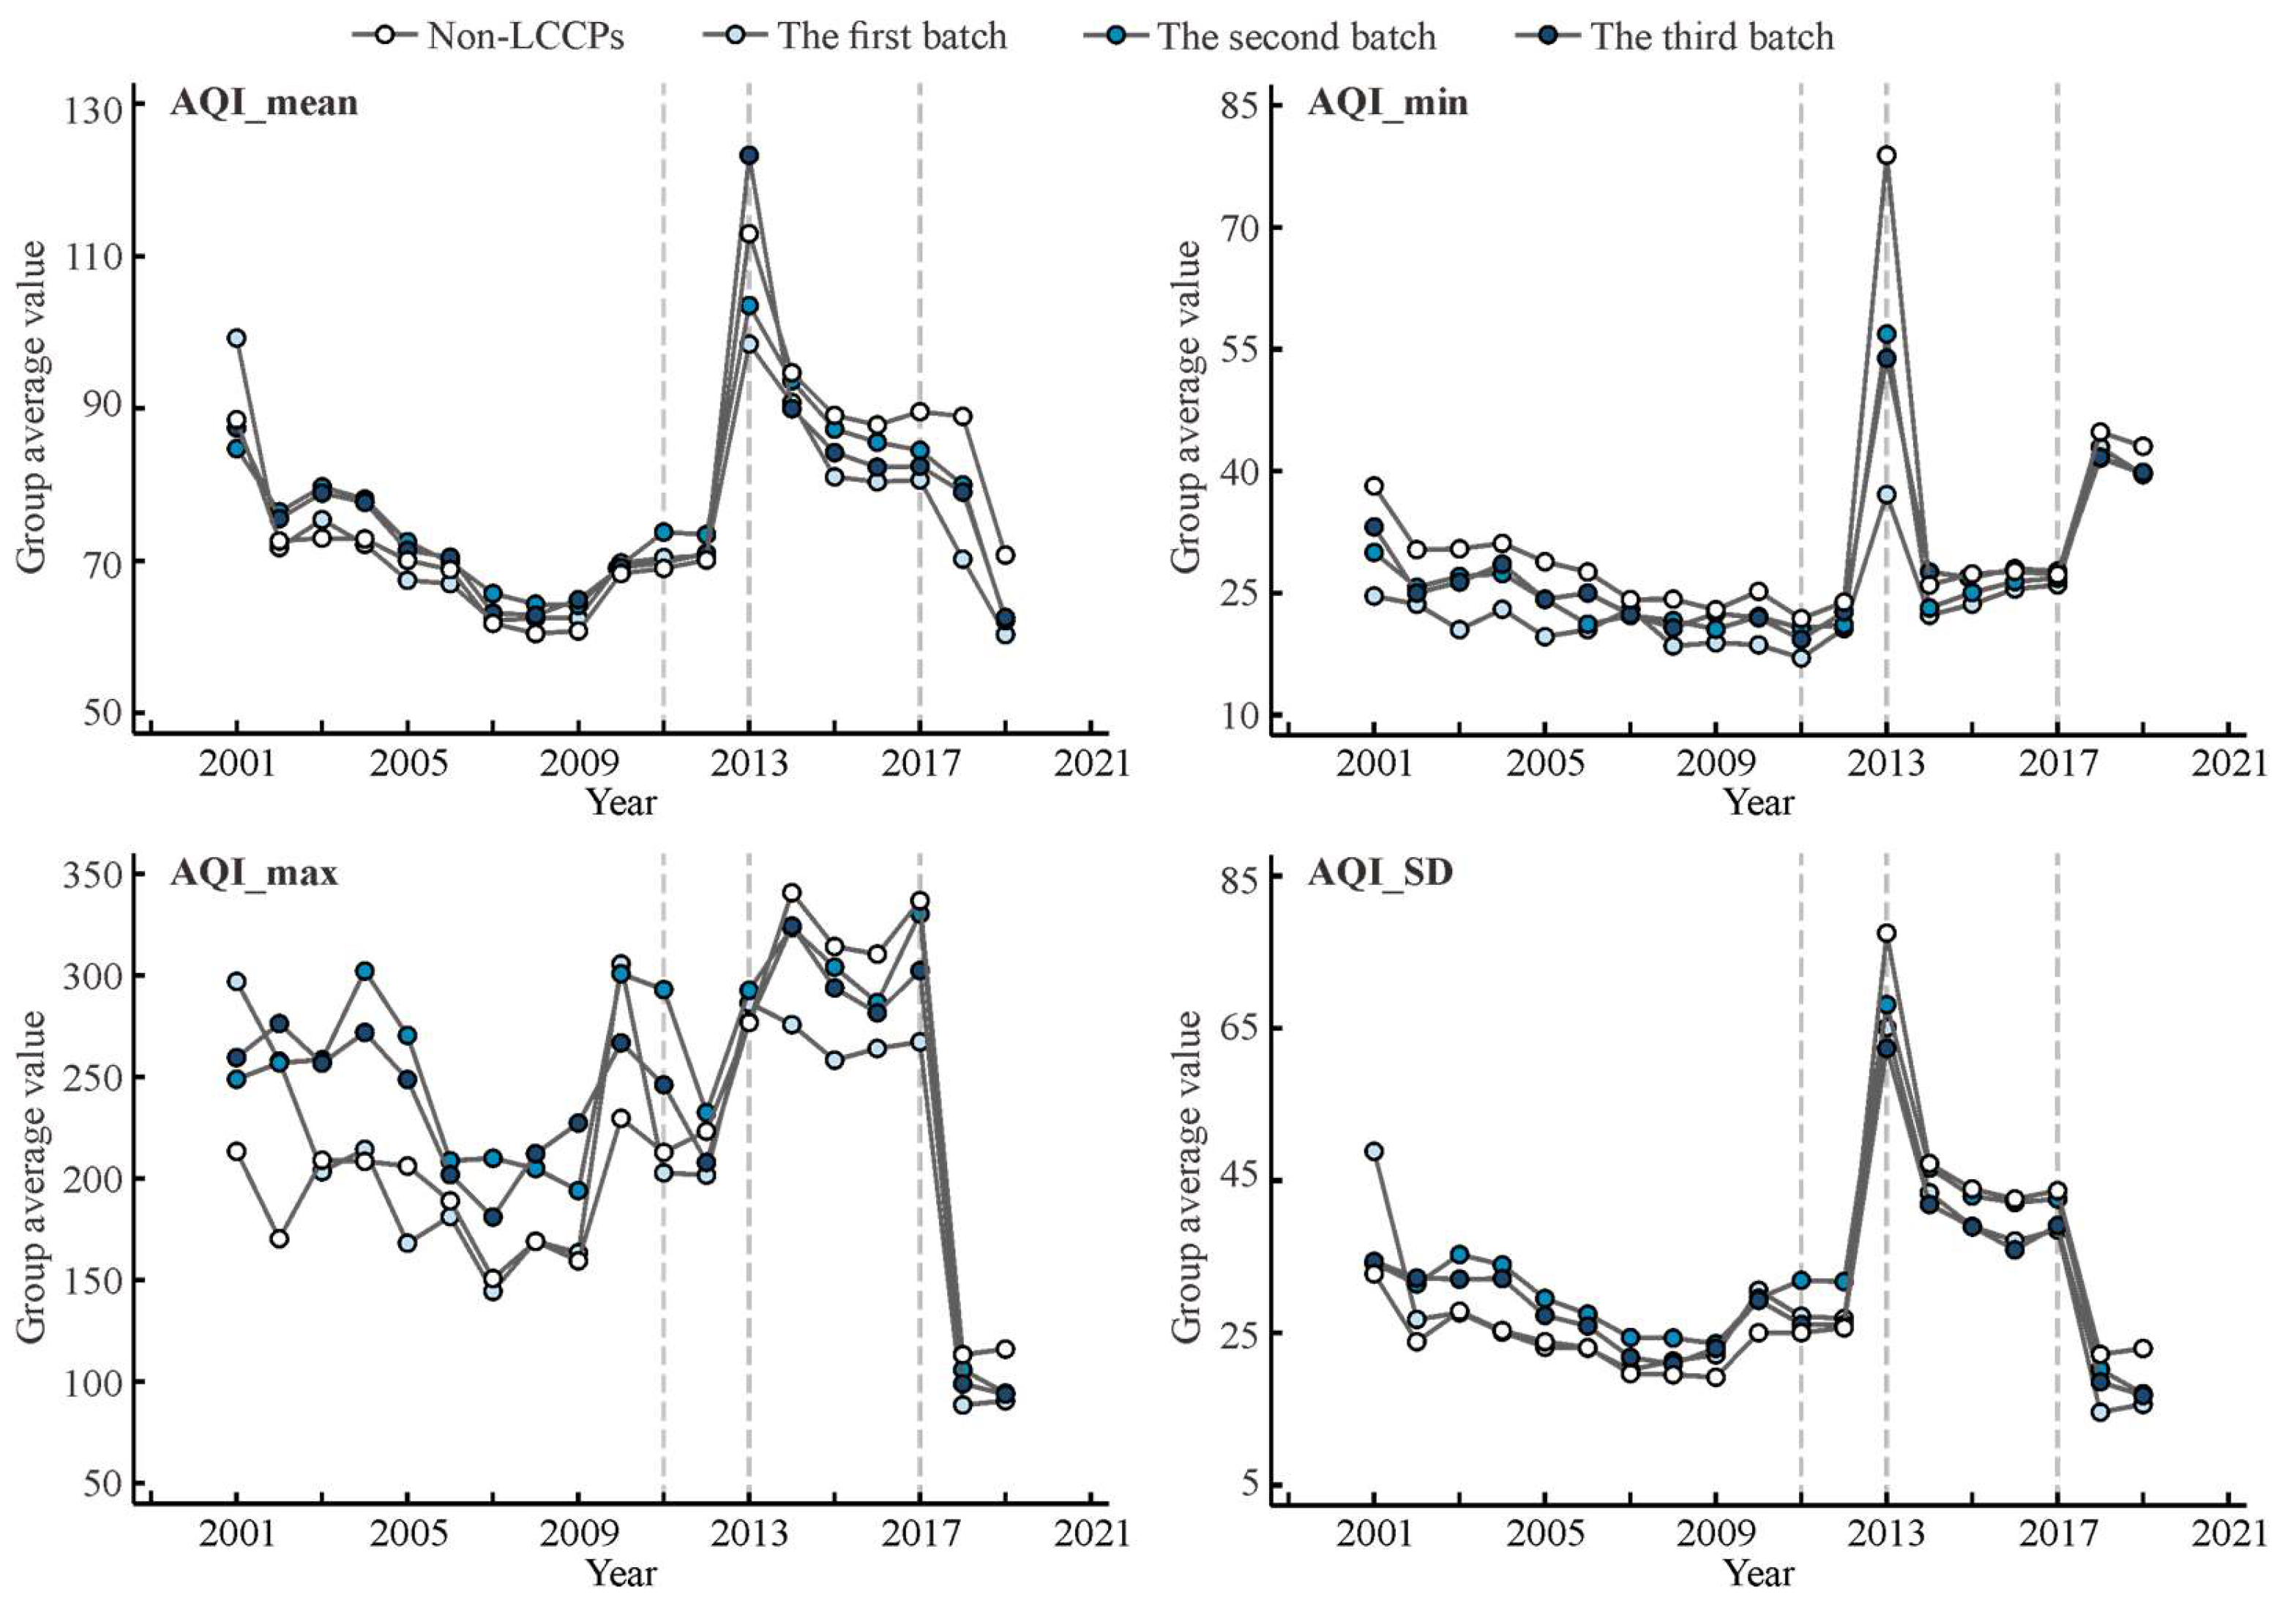
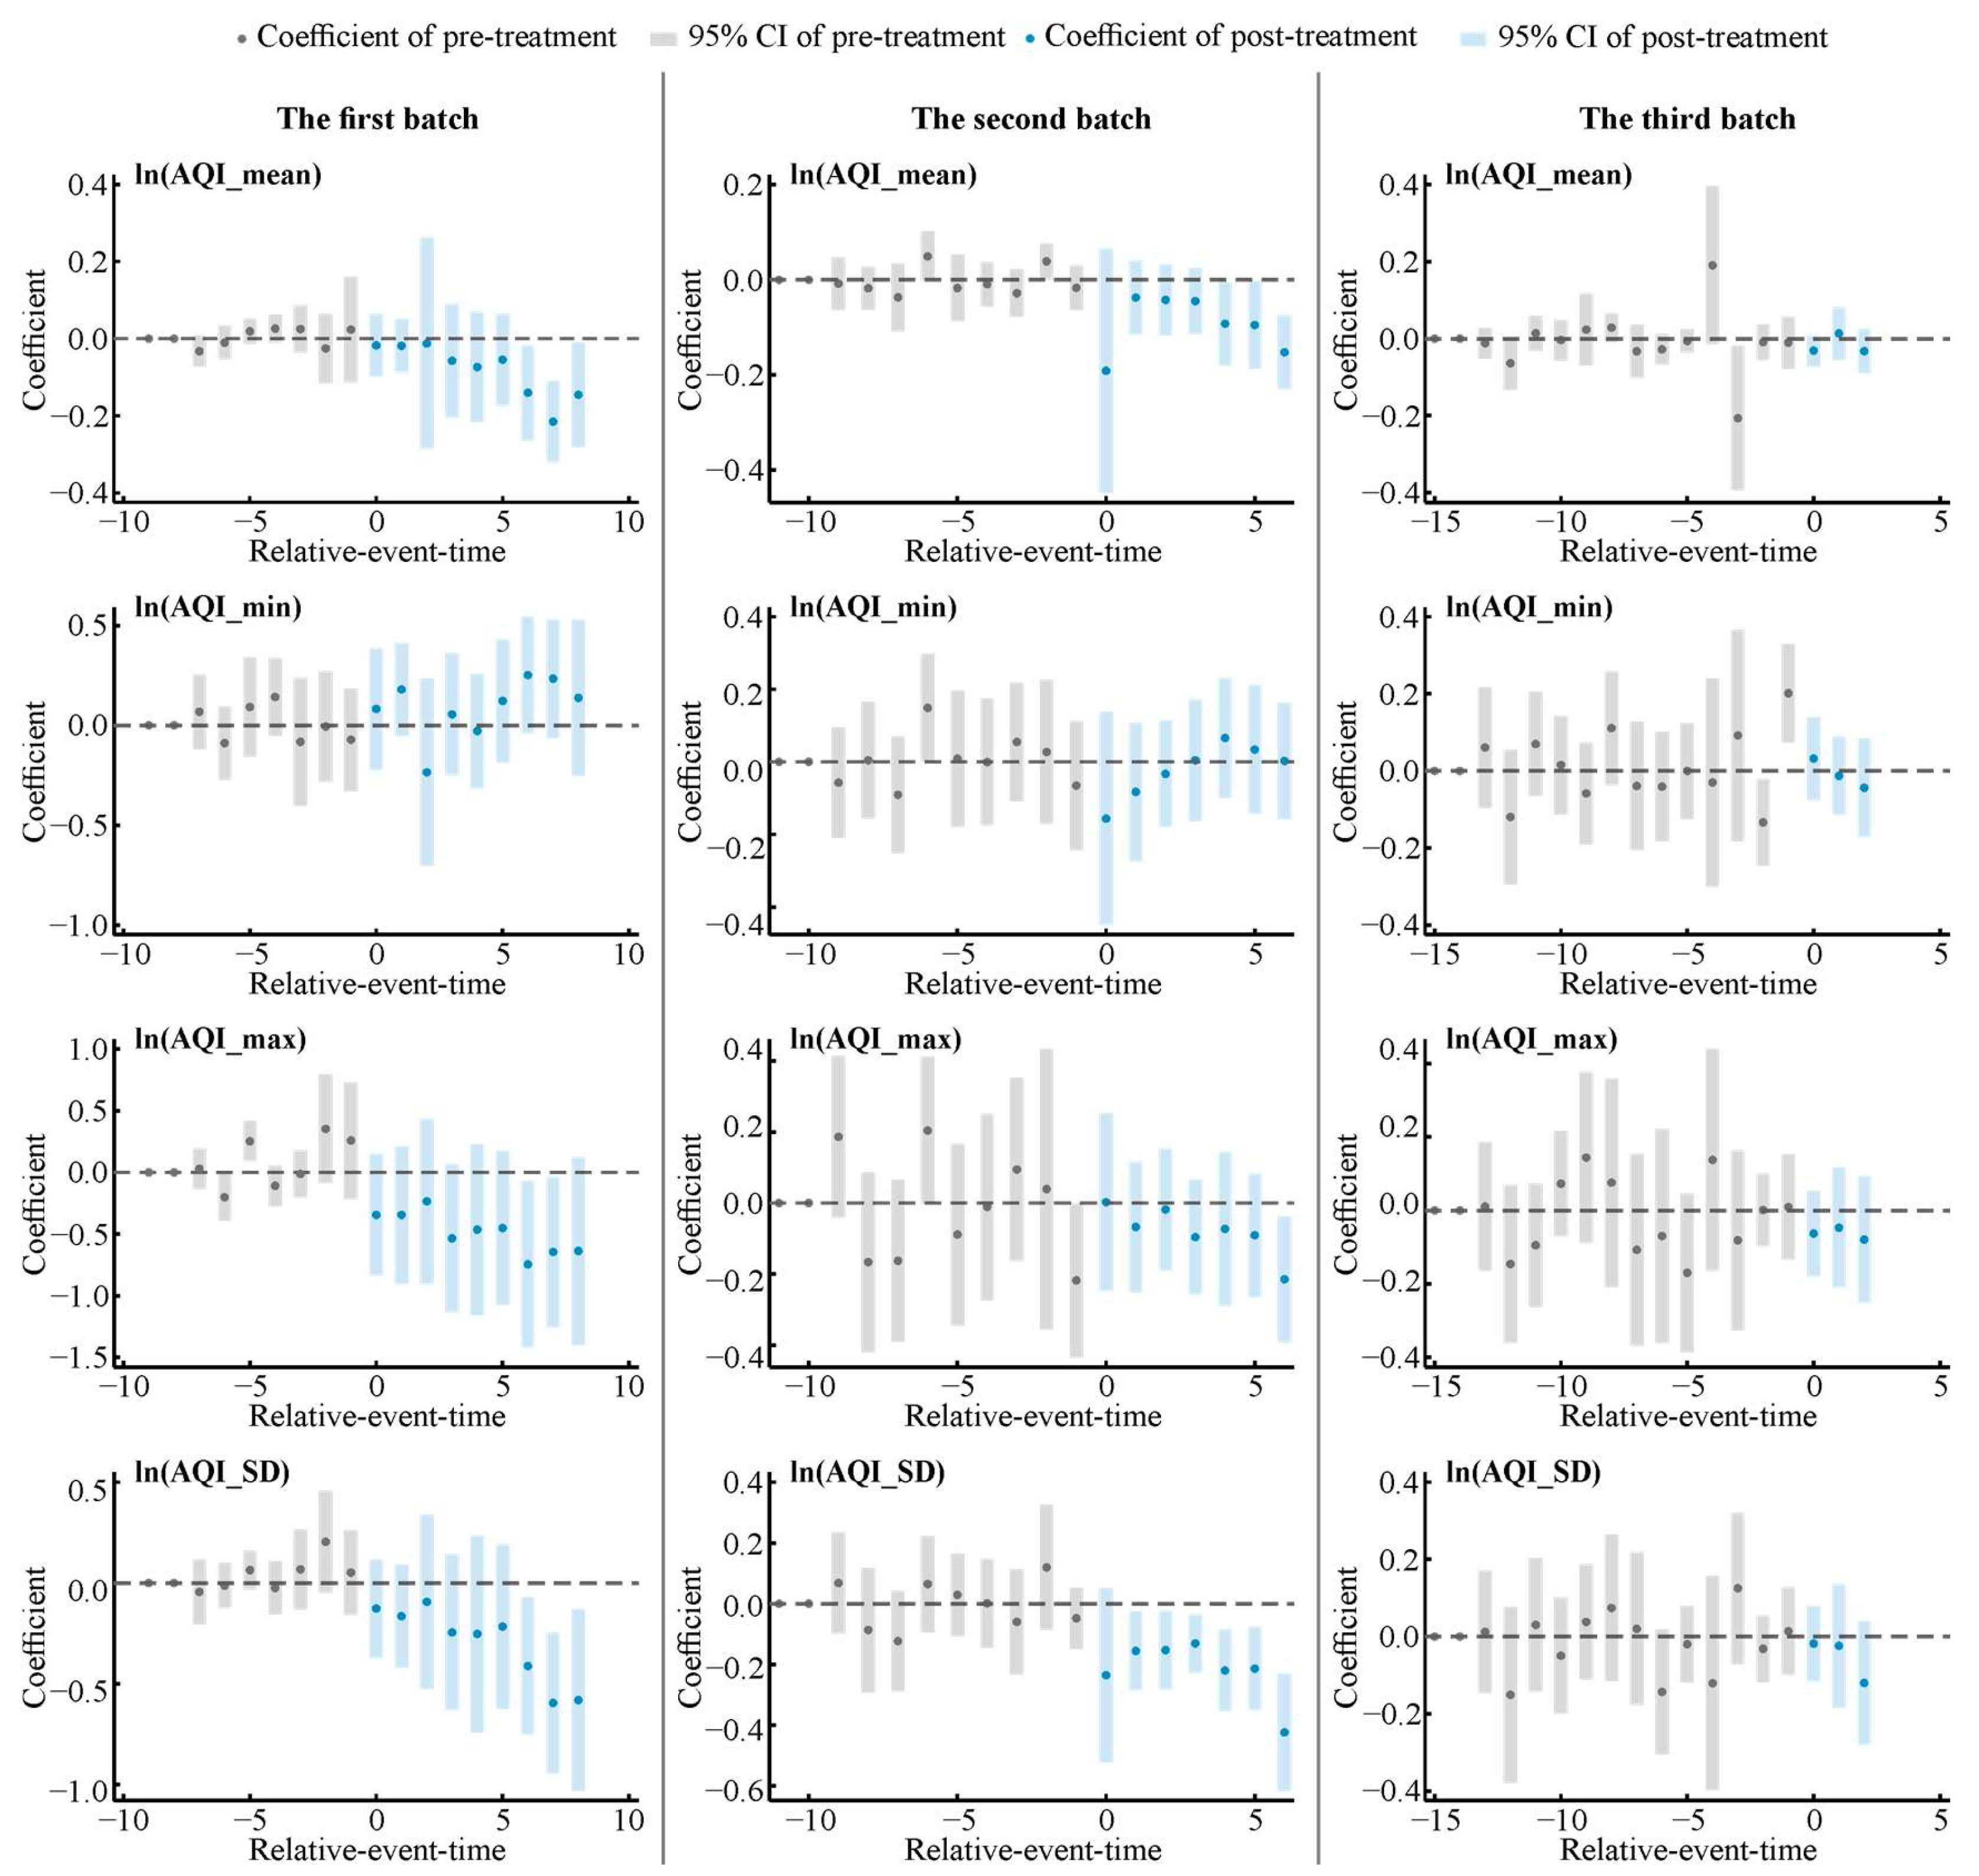
4.2.3. Effects of Different LCCP Batches on AQI

An analysis of the CS-DID model (see Table 4) reveals that the first and second batches of the LCCP program significantly impacted the mean and standard deviation of the AQI, while the third batch had non-significant effects. Notably, the second LCCP batch achieved a more salient reduction in both the mean (9.1% at the 0.05 significance level) and the standard deviation (22.1% at the 0.01 significance level) of the AQI compared to the first batch, which showed reductions of 8.1% and 29.4% at the 0.1 significance level, respectively. The average effects across all batches indicate a significant reduction in the mean (6.1%) and standard deviation (16.5%) of the AQI at the 0.01 significance level. However, no significant effects were observed on the minimum AQI for any individual or on average.
Moreover, although individual batches did not significantly affect the maximum AQI, the average effect across all batches showed a significant reduction of 14.7% at the 0.05 significance level.
The dynamic effects of each LCCP batch were estimated using the CS-DID model (see Figure 8). For the AQI mean, both the first and second batches exhibited significant negative effects in 2017, 2018, and 2019, while the third batch showed no significant effects in any treated year. None of the three LCCP batches had a significant effect on the minimum AQI in any treated year. Regarding the maximum AQI, the first batch exhibited significant negative effects in 2017 and 2018, the second batch showed significant negative effects in 2019, and the third batch had no significant effect in any treated year. For the standard deviation of the AQI, the first batch exhibited significant negative effects in 2017, 2018, and 2019, the second batch showed significant negative effects from 2014 to 2019, while the third batch had no significant effect in any treated year.

4.3. Mechanism Testing and Heterogeneity Analysis

4.3.1. Mechanism Testing

The LCCP policy potentially influences various aspects, including green science and technology development, industrial structure adjustment, urban development, and landscape engineering, all of which contribute to improved air quality. To explore the mechanisms underlying these improvements, this study examines the policy’s impacts on these factors.
The results indicate that the LCCP policy significantly influences three of the four factors, with the exception of the green coverage rate (see Table 5). Specifically, the LCCP policy is associated with an average annual increase of RMB 2.833 billion in science and technology expenditure at the city level. Moreover, cities implementing the LCCP policy observed an average reduction of 1.374% in the secondary industry rate compared to non-LCCP cities. The policy also resulted in an average increase of 7.8 million buses, thereby enhancing urban mobility. Nonetheless, the policy’s effect on the green coverage rate was not significant, indicating that improvements in certain environmental aspects may not directly translate to increased green spaces [14].

4.3.2. Heterogeneity Analysis

This study examines the heterogeneous impacts of the AQI, secondary industry rate, urbanization rate, green coverage rate, total CO2 emissions, GDP, and area on the effects of the LCCP policy (see Table 6). The results indicate that the LCCP policy has a minimal impact on groups with low AQI and urbanization rates but exerts significant negative effects on groups with high AQI and urbanization rates. Furthermore, the policy’s influence is more salient and substantial in groups with high secondary industry rate, total CO2 emissions, and GDP compared to those with lower values for these indicators. The analysis of the green coverage rate yields distinct outcomes, showing that the LCCP policy has more significant and substantial impacts on groups with either low or high green coverage rates than on those with medium green coverage rates. Geographically, the policy’s effects on the AQI are more pronounced in eastern areas than in central and western regions, with the smallest impacts observed in western areas.

5. Conclusions and Discussions

Employing heterogeneous robust DID analysis on a 19-year national dataset covering three batches of LCCP policy pilot regions, we found that the LCCP policy significantly improves overall air quality in China. Our study not only corroborates existing literature on the effectiveness of the LCCP policy in enhancing air quality, but also expands it by highlighting its role in stabilizing air quality fluctuations. The results show that the LCCP policy has immediate effects on controlling air quality fluctuations. However, achieving a stable and lasting improvement in overall air quality requires three to four years. Furthermore, the initial two batches of the LCCP policy significantly improved air quality, with the second batch having a more salient effect, whereas the third batch has yet to show significant improvements. The LCCP policy has a more pronounced effect on reducing AQI levels in cities with poor air quality, high urbanization rates, extensive green coverage, and elevated total carbon dioxide emissions. Similar policies should prioritize cities with poor air quality and high carbon emissions, as these areas are likely to achieve the most substantial improvements in air quality. Additionally, increasing urban green coverage and fostering sustainable urbanization can enhance the co-benefits of low-carbon policies, thereby supporting broader environmental goals.
Delving deeper, we provide initial evidence of the mechanisms through which the LCCP policy enhances air quality, including advancements in green science and technology, as well as adjustments to industrial structures, urban development, and landscape engineering. Industrial emissions remain the primary source of air pollution in many Chinese cities, particularly in regions with a high concentration of heavy industries such as steel, cement, and petrochemicals [9,15]. Therefore, adjusting the industrial mix is likely the most influential mechanism, given the substantial emissions reductions associated with transitioning away from heavy industry [2]. Low-carbon policies in China often drive structural adjustments in the economy, shifting industrial activities from pollution-intensive sectors to cleaner industries and services, thereby improving air quality. Research on China’s low-carbon city pilot (LCCP) policy indicates that participating cities have experienced significant reductions in PM2.5 and SO2 levels, primarily due to industrial restructuring. For example, Wei et al. found that LCCP cities experienced a decline in high-emission industries, leading to measurable air quality improvements [11]. Similarly, Yang et al. used a difference-in-differences approach to demonstrate that a 10% decrease in the share of heavy industry corresponded to a 4–6 µg/m3 reduction in PM2.5 concentrations [6].
Beyond industrial restructuring, several additional factors play crucial roles in improving air quality in China. First, technological investments have been a key strategy, with the Chinese government establishing dedicated funds for green technology R&D, subsidizing renewable energy development, and promoting collaborations between enterprises, universities, and research institutions [43] Policies such as subsidies for energy-efficient technologies and tax incentives for low-carbon industries encourage cleaner production methods. Moreover, in China’s pilot low-carbon zones, the government provides policy rewards and tax benefits to accelerate the industrialization of low-carbon technologies [12]. Our findings emphasize the importance of capital and industrial structure upgrades as essential components in the transformation and development of low-carbon cities, providing empirical evidence for the necessity of establishing clear air quality management objectives when designing low-carbon city initiatives.
To maximize the air quality benefits of low-carbon policies, we recommend that local governments refine and expand these initiatives by integrating renewable energy, optimizing urban transportation systems, and enhancing industrial emission controls. Specifically, metropolitan areas should accelerate the adoption of renewable energy by setting stricter targets, incentivizing distributed solar and wind power, and phasing out coal-fired power plants. In the transportation sector, expanding public transit networks and promoting zero-emission vehicles, such as electric buses and taxis, through subsidies and investments in charging infrastructure can significantly reduce urban air pollution. Additionally, strengthening industrial emission standards and enforcing cleaner production technologies, particularly in energy-intensive industries, will support long-term air quality improvements.
This study provides empirical evidence supporting the effectiveness of low-carbon approaches in air pollution control within emerging economies. By analyzing the impact of low-carbon policies in China, we demonstrate that industrial restructuring, technological investments, public transportation expansion, and urban greening are crucial to improving air quality. Given the economic heterogeneity of emerging economies, where regions vary in their reliance on heavy industry and service sectors, our findings underscore the importance of region-specific strategies. Metropolitan areas with advanced service economies benefit more readily from low-carbon transitions, while industrial hubs require targeted policies to mitigate economic disruptions. The insights from this study can inform other emerging economies facing similar challenges, emphasizing the need for sustainable economic transitions to achieve long-term environmental benefits. We advocate for a research agenda that emphasizes low-carbon initiatives in emerging economies, promoting collaborative activities to pool resources and expertise in the face of resource shortage and significant environmental challenges. The significance of these findings also extends to a broader understanding of the environmental policymaking in China, where institutional design and policy arrangements are dynamically shaped by political relationships between the central and local governments. While some scholars argue that the ongoing (re)centralization process [27,44] has reduced the quality of policy experimentation [20,43], our study finds that increased central control over the policy experimentation process has been effective in improving overall air quality under the LCCP policy.
Several limitations and caveats of this study should be acknowledged. First, other low-carbon policies may also contribute to air quality improvement. Future research will examine the impact of these overlapping policies and their interaction effects. Second, our analysis shows that the effect of the LCCP policy on air quality exhibits a lag of approximately three to four years. However, the current database includes only two years of data for the third batch of pilot cities, which limits our ability to evaluate its long-term effects. The varying impacts of the LCCP policy across income groups, locations, and industries within cities remain insufficiently understood, and these policies may also produce spatial spillover effects. Future studies will incorporate updated data for the third batch to improve the accuracy of impact estimates. Moreover, future research could provide more detailed institutional insights into how the policy experimentation approach effectively achieves the synergistic goals of air pollution control and low-carbon initiatives. Exploring the distributional impacts of the LCCP policy within cities—such as its effects on groups with different incomes, neighborhoods, or industries—along with its spatial spillover effects, would offer a deeper understanding of the equity of policy outcomes. However, this would require more granular data beyond the scope of this study. Finally, the generalizability of this study’s findings should be further explored by incorporating more diverse data and expanding the research scope. Despite these limitations, this study demonstrates the effectiveness of the LCCP policy in achieving air quality co-benefits over the past decades.

Author Contributions

Conceptualization, X.N.; methodology, Y.L. and X.N.; software, Y.L.; formal analysis, Y.L.; data curation, Y.L. and X.N.; writing—original draft preparation, X.N. and Y.L.; writing—review and editing, X.N. and Y.L.; funding acquisition, X.N. & Y.L. All authors have read and agreed to the published version of the manuscript.

Funding

The National Natural Science Foundation of China (72204102; 32001406).

Institutional Review Board Statement

Not applicable.

Informed Consent Statement

Not applicable.

Data Availability Statement

Data available upon request.

Acknowledgments

We appreciate the anonymous reviewers for their invaluable contributions to improving our manuscript. We also extend our gratitude to Baoli Miao and Xiaolin Mo for their dedicated efforts in data sorting and manuscript editing. Special thanks also go to Hongru Niu for his delicate support throughout the research.

Conflicts of Interest

The authors declare no conflict of interest.

References

  1. De Jong, M.; Joss, S.; Schraven, D.; Zhan, C.; Weijnen, M. Sustainable–smart–resilient–low carbon–eco–knowledge cities: Making sense of a multitude of concepts promoting sustainable urbanization. J. Clean. Prod. 2015, 109, 25–38. [Google Scholar] [CrossRef]
  2. Shan, W.; Chen, S.; Wang, G.; Li, J.; Bo, X. Clearing the Air: Assessing the Effectiveness of Emission Policy in Qinhuangdao’s Key Industries. Atmosphere 2023, 14, 1218. [Google Scholar] [CrossRef]
  3. Kamińska, J.A.; Turek, T.; Van Poppel, M.; Peters, J.; Hofman, J.; Kazak, J.K. Whether cycling around the city is in fact healthy in the light of air quality: Results of black carbon. J. Environ. Manag. 2023, 337, 117694. [Google Scholar] [CrossRef] [PubMed]
  4. Shu, Y.; Hu, J.; Zhang, S.; Schöpp, W.; Tang, W.; Du, J.; Cofala, J.; Kiesewetter, G.; Sander, R.; Winiwarter, W.; et al. Analysis of the air pollution reduction and climate change mitigation effects of the Three-Year Action Plan for Blue Skies on the “2 + 26” Cities in China. J. Environ. Manag. 2022, 317, 115455. [Google Scholar] [CrossRef]
  5. Zhong, J.; Hodgson, J.R.; Bloss, W.J.; Shi, Z. Impacts of net zero policies on air quality in a metropolitan area of the United Kingdom: Towards world health organization air quality guidelines. Environ. Res. 2023, 236, 116704. [Google Scholar] [CrossRef]
  6. Yang, S.; Jahanger, A.; Hossain, M.R. How effective has the low-carbon city pilot policy been as an environmental intervention in curbing pollution? Evidence from Chinese industrial enterprises. Energy Econ. 2023, 118, 106523. [Google Scholar] [CrossRef]
  7. Weko, S.; Goldthau, A. Bridging the low-carbon technology gap? Assessing energy initiatives for the Global South. Energy Policy 2022, 169, 113192. [Google Scholar] [CrossRef]
  8. Hosein, A.S.; Whale, J.; Simsek, Y.; Urmee, T. Exploring energy policy scenarios to transition to a low carbon economy by 2050: A case study on the Northern Territory of Australia. Energy Policy 2023, 180, 113663. [Google Scholar] [CrossRef]
  9. Räihä, J.; Clarke, S.; Sankelo, P.; Ruokamo, E.; Kangas, H.L. The importance of organization type: Construction sector perceptions of low-carbon policies and measures. Environ. Sci. Policy 2024, 151, 103602. [Google Scholar] [CrossRef]
  10. The Royal Society. Effects of Net-Zero Policies and Climate Change on Air Quality. 2021. Available online: https://royalsociety.org/-/media/policy/projects/air-quality/air-quality-and-climate-change-report.pdf (accessed on 12 April 2024).
  11. Wei, X.; Tong, Q.; Magill, I.; Vithayasrichareon, P.; Betz, R. Evaluation of potential co-benefits of air pollution control and climate mitigation policies for China’s electricity sector. Energy Econ. 2020, 92, 104917. [Google Scholar] [CrossRef]
  12. Li, X.; Xing, H. Better cities better lives: How low-carbon city pilots can lower residents’ carbon emissions. J. Environ. Manag. 2024, 351, 119889. [Google Scholar] [CrossRef] [PubMed]
  13. Office of the Leading Group of the State Council for the Seventh National Population Census. China Population Census Yearbook 2020; China Statistics Press: Beijing, China, 2020.
  14. Zhang, J.; Gao, L.; Wang, W.; Deng, Z.; Zhang, X. The impact of low-carbon city pilot policies on air quality: Quasi-natural experimental evidence from China. Atmosphere 2022, 13, 1355. [Google Scholar] [CrossRef]
  15. Lyu, J.; Liu, T.; Cai, B.; Qi, Y.; Zhang, X. Heterogeneous effects of China’s low-carbon city pilots policy. J. Environ. Manag. 2023, 344, 118329. [Google Scholar] [CrossRef]
  16. Chen, J.; Luo, W.; Ren, X.; Liu, T. The local-neighborhood effects of low-carbon city pilots program on PM2.5 in China: A spatial difference-in-differencess analysis. Sci. Total Environ. 2023, 857, 159511. [Google Scholar] [CrossRef] [PubMed]
  17. Zhao, S.; Zhang, L.; An, H.; Peng, L.; Zhou, H.; Hu, F. Has China’s low-carbon strategy pushed forward the digital transformation of manufacturing enterprises? Evidence from the low-carbon city pilot policy. Environ. Impact Assess. Rev. 2023, 102, 107184. [Google Scholar] [CrossRef]
  18. Odman, M.T.; Hu, Y.; Russell, A.G.; Hanedar, A.; Boylan, J.W.; Brewer, P.F. Quantifying the sources of ozone, fine particulate matter, and regional haze in the Southeastern United States. J. Environ. Manag. 2009, 90, 3155–3168. [Google Scholar] [CrossRef]
  19. Wang, Y.; Song, Q.; He, J.; Qi, Y. Developing low-carbon cities through pilots. Clim. Policy 2015, 15, S81–S103. [Google Scholar] [CrossRef]
  20. Teets, J.C.; Hasmath, R. The evolution of policy experimentation in China. J. Asian Public Policy 2020, 13, 49–59. [Google Scholar] [CrossRef]
  21. Song, Q.; Liu, T.; Qi, Y. Policy innovation in low carbon pilot cities: Lessons learned from China. Urban Clim. 2021, 39, 100936. [Google Scholar] [CrossRef]
  22. Tsai, W.H.; Dean, N. Experimentation under hierarchy in local conditions: Cases of political reform in Guangdong and Sichuan, China. China Q. 2014, 218, 339–358. [Google Scholar] [CrossRef]
  23. Luo, X.; Lin, G.; Wan, Q.; Jin, G. Inspiration or perspiration: Diffusion of China’s low-carbon city pilot policies nationwide. J. Clean. Prod. 2023, 428, 139291. [Google Scholar] [CrossRef]
  24. National Development and Reform Commission of China (NDRC). Notice on Carrying out Pilot Projects in Low-Carbon Provinces and Low-Carbon Cities. (NDRC Climate [2010] No. 1587). 2010. Available online: https://www.ndrc.gov.cn/xxgk/zcfb/tz/201008/t20100810_964674.html (accessed on 18 February 2024).
  25. National Development and Reform Commission of China (NDRC). Notice on Carrying out the Second Batch of National Low-Carbon Provinces and Low-Carbon City Pilot Projects. (NDRC Climate [2012] No. 3760). 2012. Available online: https://www.ccchina.org.cn/Detail.aspx?newsId=73289&TId=285 (accessed on 18 February 2024).
  26. National Development and Reform Commission of China (NDRC). Notice on Carrying out the Third Batch of National Low-Carbon City Pilot Projects. (NDRC Climate [2017] No. 66). 2017. Available online: https://www.gov.cn/xinwen/2017-01/24/content_5162933.htm (accessed on 18 February 2024).
  27. Wu, Q.; Sun, Z.; Jiang, L.; Jiang, L. “Bottom-up” abatement on climate from the “top-down” design: Lessons learned from China’s low-carbon city pilot policy. Empir. Econ. 2024, 66, 1223–1257. [Google Scholar] [CrossRef]
  28. Zhao, S.; Shi, A.; An, H.; Zhou, H.; Hu, F. Does the low-carbon city pilot contribute to the blue sky defense? Evidence from China. Environ. Sci. Pollut. Res. 2023, 30, 84595–84608. [Google Scholar] [CrossRef]
  29. Ministry of Ecology and Environment of the People’s Republic of China. National Low-Carbon City Pilot Progress Evaluation Report. 2023. Available online: https://www.mee.gov.cn/ywgz/ydqhbh/wsqtkz/202307/W020230713602785966247.pdf (accessed on 18 February 2024).
  30. Mewes, C.; Unger, C. Learning by doing: Co-benefits drive national plans for climate and air quality governance. Atmosphere 2021, 12, 1184. [Google Scholar] [CrossRef]
  31. Ministry of Environmental Protection of the People’s Republic of China; General Administration of Quality Supervision; Inspection and Quarantine of the People’s Republic of China. Ambient Air Quality Standards/GB3095-2012; China Environmental Sciences Press: Beijing, China, 2012.
  32. Yu, Y.; Zhang, N. Low-carbon city pilot and carbon emission efficiency: Quasi-experimental evidence from China. Energy Econ. 2021, 96, 105125. [Google Scholar] [CrossRef]
  33. Beck, T.; Levine, R.; Levkov, A. Big bad banks? The winners and losers from bank deregulation in the United States. J. Financ. 2010, 65, 1637–1667. [Google Scholar] [CrossRef]
  34. Jacobson, L.S.; LaLonde, R.J.; Sullivan, D.G. Earnings losses of displaced workers. Am. Econ. Rev. 1993, 83, 685–709. [Google Scholar] [CrossRef]
  35. De Chaisemartin, C.; d’Haultfoeuille, X. Two-way fixed effects estimators with heterogeneous treatment effects. Am. Econ. Rev. 2020, 110, 2964–2996. [Google Scholar] [CrossRef]
  36. Borusyak, K.; Jaravel, X.; Spiess, J. Revisiting event study designs: Robust and efficient estimation. Rev. Econ. Stud. 2024, 91, 3253–3285. [Google Scholar] [CrossRef]
  37. Goodman-Bacon, A. Difference-in-differencess with variation in treatment timing. J. Econom. 2021, 225, 254–277. [Google Scholar] [CrossRef]
  38. Callaway, B.; Sant’Anna, P.H. Difference-in-differences with multiple time periods. J. Econom. 2021, 225, 200–230. [Google Scholar] [CrossRef]
  39. Sant’Anna, P.H.; Zhao, J. Doubly robust difference-in-differencess estimators. J. Econom. 2020, 219, 101–122. [Google Scholar] [CrossRef]
  40. Roth, J. Pretest with caution: Event-study estimates after testing for parallel trends. Am. Econ. Rev. Insights 2022, 4, 305–322. [Google Scholar] [CrossRef]
  41. Chen, Q.; Qi, J.; Yan, G. DIDPLACEBO: Stata Module for In-Time, In-Space and Mixed Placebo Tests for Estimating Difference-in-Differencess (DID) Models. EconPapers. 2023. Available online: https://econpapers.repec.org/software/bocbocode/s459225.htm (accessed on 1 March 2025).
  42. Sun, L.; Abraham, S. Estimating dynamic treatment effects in event studies with heterogeneous treatment effects. J. Econom. 2021, 225, 175–199. [Google Scholar] [CrossRef]
  43. Guo, S.; Song, Q.; Qi, Y. Innovation or implementation? Local response to low-carbon policy experimentation in China. Rev. Policy Res. 2021, 38, 555–569. [Google Scholar] [CrossRef]
  44. Kostka, G.; Nahm, J. Central–local relations: Recentralization and environmental governance in China. China Q. 2017, 231, 567–582. [Google Scholar] [CrossRef]
Figure 1. The spatial distribution of three batches of low-carbon pilot.
Atmosphere 16 00339 g001
Figure 2. The treatment process period.
Atmosphere 16 00339 g002
Figure 3. The changing trends of AQI indicators across different groups.
Atmosphere 16 00339 g003
Figure 4. Coefficient diagram of the dynamic event study.
Atmosphere 16 00339 g004
Figure 5. Results of spatiotemporal placebo tests.
Atmosphere 16 00339 g005
Figure 6. DID decomposition for the LCCP policy’s effect on the logarithm of the AQI mean.
Atmosphere 16 00339 g006
Figure 7. The dynamic estimators of the CS-DID model.
Atmosphere 16 00339 g007
Figure 8. Dynamic effects of different LCCP policy batches in the CS-DID model.
Atmosphere 16 00339 g008
Table 1. Descriptive statistics of main variables.
Variable NameVariable DefinitionObs.MeanMin.Max.SD
Dependent variable
AQI_meanMean of AQI216677.10918.070346.66724.547
AQI_minMinimum of AQI215830.0006.000240.00017.788
AQI_maxMaximum of AQI2166226.31328.000500.000135.330
AQI_SDStandard deviation of AQI124130.8403.576162.81918.782
Treatment variable
PolicyTreatment status21660.119010.324
Control variable
Sec_ind (%)Secondary industry rate215848.3987.43084.40012.699
Urbanization (%)Urbanization rate193256.87814.990100.00017.488
Green cover (%)Green coverage rate211938.4901.06092.8707.315
NOTE. AQI_mean, AQI_min, AQI_max, and AQI_SD represent the mean, minimum, maximum, and standard deviation of the daily mean AQI, respectively; the secondary industry rate refers to the proportion of secondary industry GDP to the total GDP; the urbanization rate is defined as the percentage of nonagricultural population relative to the total population; the green coverage rate represents the proportion of green coverage in the municipal districts of the corresponding cities.
Table 2. Estimators of TWFE-DID.
Variableln(AQI_Mean)ln(AQI_Min)ln(AQI_Max)ln(AQI_SD)
Model 1Model 2Model 3Model 4Model 5Model 6Model 7Model 8
Policy−0.091 ***
(0.016)
−0.093 ***
(0.016)
0.035
(0.026)
0.017
(0.027)
−0.230 ***
(0.032)
−0.208 ***
(0.033)
−0.209 ***
(0.028)
−0.198 ***
(0.028)
Sec_ind0.003 ***
(0.001)
−0.003 *
(0.001)
0.007 ***
(0.002)
0.006 ***
(0.001)
Urbanization0.002 ***
(0.001)
−0.000
(0.001)
0.004 ***
(0.002)
0.003 **
(0.001)
Green cover−0.002 ***
(0.001)
−0.001
(0.001)
−0.005 ***
(0.002)
−0.005 ***
(0.002)
Constant4.312 ***
(0.004)
4.161 ***
(0.049)
3.282 ***
(0.007)
3.445 ***
(0.106)
5.272 ***
(0.009)
4.890 ***
(0.129)
3.304 ***
(0.007)
3.040 ***
(0.102)
Obs.21661894215818862166189421411869
R-squared0.7430.7470.6410.6550.6570.6690.7080.728
Control variableNoYesNoYesNoYesNoYes
NOTE. Standard errors are clustered at the city level; *, **, and *** indicate statistical significance at the 0.1, 0.05, and 0.01 levels, respectively.
Table 3. Estimators of heterogeneity-robust estimation.
Itemln(AQI_Mean)ln(AQI_Min)ln(AQI_Max)ln(AQI_SD)
CS-DIDIP-DIDCS-DIDIP-DIDCS-DIDIP-DIDCS-DIDIP-DID
ATT−0.074 ***
(0.025)
−0.097 ***
(0.034)
0.013
(0.055)
0.028
(0.041)
−0.193 *
(0.101)
−0.217 ***
(0.072)
−0.205 ***
(0.062)
−0.207 ***
(0.064)
Obs.18811894187218861881189418561894
Control variableYesYesYesYesYesYesYesYes
NOTE. Standard errors are clustered at the city level; * and *** indicate statistical significance at the 0.1 and 0.01 levels, respectively; CS-DID is the model introduced by Callaway and Sant’Anna [38], and IP-DID is the model introduced by Borusyak et al. [36].
Table 4. Effects of each LCCP batch.
ln(AQI_Mean)ln(AQI_Min)ln(AQI_Max)ln(AQI_SD)
The first batch−0.081 *
(0.044)
0.093
(0.134)
−0.490
(0.305)
−0.294 *
(0.174)
The second batch−0.091 **
(0.041)
−0.023
(0.071)
−0.082
(0.074)
−0.221 ***
(0.057)
The third batch−0.016
(0.019)
−0.008
(0.050)
−0.063
(0.065)
−0.054
(0.059)
Batch average−0.061 ***
(0.021)
0.004
(0.044)
−0.147 **
(0.068)
−0.165 ***
(0.048)
Obs.1881187218811856
NOTE. Standard errors are clustered at the city level; *, **, and, *** indicate statistical significance at the 0.1, 0.05, and 0.01 levels, respectively. The results are estimated using the CS-DID model.
Table 5. Effects of the LCCP policy on different factors.
FactorCoefficientS.E.
Expenditure on science and technology (×109 RMB)2.833 ***0.334
The secondary industry rate (%)−1.374 ***0.477
Number of buses (×108 buses)0.078 ***0.023
Green coverage rate (%)0.0090.504
NOTE. The effects of the LCCP policy are estimated using the TWFE-DID; standard errors are clustered at the city level; *** indicates statistical significance at the 0.01 level.
Table 6. Effects of the LCCP policy on different city groups.
IndicatorGroupln(AQI_Mean)ln(AQI_Min)ln(AQI_Max)ln(AQI_SD)
AQILow−0.027
(0.029)
0.005
(0.051)
−0.099 *
(0.052)
−0.071
(0.046)
Medium−0.132 ***
(0.021)
−0.087 *
(0.047)
−0.222 ***
(0.063)
−0.227 ***
(0.047)
High−0.107 ***
(0.033)
0.129 ***
(0.043)
−0.295 ***
(0.062)
−0.235 ***
(0.552)
Secondary industry rate (%)Low−0.078 **
(0.033)
−0.018
(0.052)
−0.110 *
(0.058)
−0.165 ***
(0.053)
Medium−0.078 ***
(0.025)
0.069 *
(0.040)
−0.231 ***
(0.054)
−0.170 ***
(0.043)
High−0.116 ***
(0.023)
0.022
(0.048)
−0.238 ***
(0.068)
−0.299 ***
(0.053)
Urbanization rate (%)Low−0.044
(0.057)
−0.054
(0.083)
0.105
(0.082)
−0.065
(0.086)
Medium−0.053 **
(0.025)
0.034
(0.042)
−0.053
(0.054)
−0.032
(0.412)
High−0.096 ***
(0.023)
0.010
(0.041)
−0.331 ***
(0.050)
−0.234 ****
(0.044)
Green coverage rate (%)Low−0.165 ***
(0.029)
−0.079
(0.048)
−0.142 **
(0.063)
−0.235 ***
(0.055)
Medium−0.028
(0.023)
0.062
(0.038)
−0.130 **
(0.053)
−0.078 *
(0.042)
High−0.084 ***
(0.032)
0.067
(0.059)
−0.316 ***
(0.062)
−0.270 ***
(0.048)
Total CO2 emissions (megaton) Low−0.067 *
(0.037)
0.011
(0.070)
−0.077
(0.082)
−0.158 **
(0.074)
Medium−0.112 ***
(0.027)
0.036
(0.048)
−0.139 **
(0.056)
−0.227 ***
(0.047)
High−0.117 ***
(0.026)
−0.017
(0.040)
−0.311 ***
(0.059)
−0.204 ***
(0.048)
GDP (×109 RMB)Low−0.100 ***
(0.035)
−0.095
(0.060)
0.041
(0.091)
−0.084
(0.077)
Medium−0.085 ***
(0.032)
0.124 **
(0.050)
−0.199 ***
(0.057)
−0.279 ***
(0.051)
High−0.112 ***
(0.024)
−0.035
(0.041)
−0.290 ***
(0.054)
−0.217 ***
(0.044)
AreaEastern areas−0.230 ***
(0.058)
−0.063
(0.079)
−0.342 ***
(0.102)
−0.436 ***
(0.098)
Middle areas−0.171 ***
(0.050)
−0.046
(0.068)
−0.293 ***
(0.085)
−0.310 ***
(0.074)
Western areas−0.071 ***
(0.018)
0.041
(0.032)
−0.192 ***
(0.040)
−0.170 ***
(0.031)
NOTE. Standard errors are clustered at the city level; *, **, and *** indicate statistical significance at the 0.1, 0.05, and 0.01 levels, respectively; the low, medium, and high groups represent city groups with the top 30% lowest, 30%~40%, and top 30% of corresponding indicator values; these results are estimated using the TWFE-DID model; all GDP values are converted into the real values of 1978 using GDP deflators.
Disclaimer/Publisher’s Note: The statements, opinions and data contained in all publications are solely those of the individual author(s) and contributor(s) and not of MDPI and/or the editor(s). MDPI and/or the editor(s) disclaim responsibility for any injury to people or property resulting from any ideas, methods, instructions or products referred to in the content.

