Abstract
Negative air ions (NAIs) have the effect of improving environmental quality and human health. This study for the first time constructed an evaluation system for forest release of NAIs employing five capacity indicators: release contribution rate (L), release coefficient (n), release rate (s), instantaneous standing stock (v), and total release amount (Z). These were applied to evaluate the forest’s ability to release NAIs in the suburban urban green space of Beijing—Xishan National Forest Park. The results showed that: (1) during the growing season of the forest, the value ranges of these indicators were as follows: L: 6.04~9.71%, n: 6.63~11.05%, s: 4.53 × 10³~7.49 × 10³/cm2/min, v: 4.48 × 10⁴~7.34 × 10⁴/cm2, Z: 2.70 × 10⁵~4.40 × 10⁵/cm2, with the spring and autumn “noon and evening” and summer “morning and evening” forests having the strongest effect and the highest release capacity of NAIs; (2) the daily changes of L, n, s, v, and Z are generally in a “bimodal” pattern, and the overall trend of “rise and fall, rise and fall” among various indicators is consistent, showing a “linkage”; (3) weather characteristics affect release capacity in the order of sunny > rainy > cloudy, with the strongest NAI release ability from forests at 6:00 on cloudy days (0.53%, 1.7%, 877.19/cm2/min, 3.56 × 10⁴/cm2, 9.67 × 10⁴/cm2) and at 18:00 on rainy days (4.58%, 4.83%, 3.16 × 10³/cm2/min, 3.16 × 10⁴/cm2, 1.90 × 10⁵/cm2), with poorer NAI release ability in the afternoon on cloudy and rainy days; (4) forests can produce over 100 million levels of NAIs throughout the year, with an average daily production of over one million levels of NAIs. From 2019 to 2021, NAI production showed an increasing trend year by year, and the increase rate increased year by year to 19.6% and 56.5%.; and (5) the five indicators are significantly positively correlated with solar radiation and temperature in the range of 0–200 w/m2 and 5–20 °C, respectively. This study provides a new method to reveal the ability of forests to release NAIs, providing strong evidence for creating a livable ecological environment.
1. Introduction
Negative air ions (NAI), referring to the collection of individual gas molecules or ion clusters with negative charge in the air, constitute an extremely important air component and play a significant role in maintaining the charge balance in the atmosphere [1]. The most basic units that make up matter are atoms, from which molecules are formed. Under some specific circumstances, such as radiation exposure, electric shock, and other external conditions, weakly energized electrons on the periphery of the nucleus are caused to break away from the atom and form free electrons [2]. The main components of the air are nitrogen and oxides, which account for about 99%, while those such as oxygen molecules themselves are characterized by strong electronegativity, which makes it easy to capture free electrons, thus forming negatively charged air ions [3,4], which can be divided into those that are naturally occurring as well as those that are generated by anthropogenic processing. Cosmic space itself is a large body of energy, including radiation excitation from outer cosmic rays as well as from Earth’s radioactive minerals, which energizes the electrons of the outer nucleus and puts them in an excited state. In this excited state, the electron is extremely unstable, and a slight energy perturbation can change its original form of movement so that it escapes the nucleus into free space. This method of generating free electrons by providing energy from outside nature, and then forming intermediates such as superoxide radicals to promote the generation of negative air ions, is called the naturally occurring method.
Research on negative air ions (NAIs) began at the end of the 19th century, when German scientists Elster and Geitel first demonstrated their existence. Since then, research on negative air ions has centered on their anthropological effects and biological significance. According to statistics from the World Health Organization, the number of premature deaths caused by air pollution each year has exceeded 7 million, and the number of sub-healthy individuals has exceeded 900 million [5,6,7]. Negative air ions (NAI) have the ability to improve the atmospheric ecological environment and enhance human functional abilities [8,9,10,11]. They have been widely used in various fields such as environmental governance and medical treatment [12,13,14,15,16], and have become one of the standards for evaluating air quality [17]. Research has shown that plants are the main stable source of negative air ions [18]. Currently, the concentration of negative ions in forests can reach 7500–8000 cm3 [19], far exceeding the standard for fresh negative air ion concentration [20]. As a gathering place for plant growth and human activities, forests have a significant ability to release and absorb negative ions, and forest ecosystem functions have always been a popular research topic in the field of ecosystems. How to fully utilize the negative ion resources in forests is an urgent problem that needs to be solved.
At present, research has mainly focused on two dimensions: “natural state” and “artificial control”. The former focuses on the spatiotemporal variation patterns of negative air ion concentration (NAIC) in different regions [21,22,23,24,25,26,27], the impact mechanism of plant physiological and ecological functions on NAIC [28,29,30,31,32], and the impact of environmental meteorological factors on plant release of NAIs [33,34,35,36]. The latter focuses on the comparative analysis of the effects of NAI production and physiological characteristics of different tree species under artificial control conditions [37], and related studies have combined the two to explore more accurately how plants release negative ions [38]. Previous studies have mostly focused on the changes in NAIC patterns, with little research on NAI release capacity. The blank control experiment is an effective method to explore the NAI content released by single-tree-scale plants, and it is of great significance in studying the ability of plants to release negative ions themselves. This method can only compare NAICs from a macro perspective and cannot specifically distinguish differences in the ability of plants to release negative ions.
In order to explore the ability of plants to release negative ions, stripping out the role of the forest itself, this study proposes a new evaluation system for negative ion release capacity based on the changes in NAI production inside and outside the forest. For the first time, five capacity indicators (release contribution rate (L), release coefficient (n), release rate (s), instantaneous standing quantity (v), and total release amount (Z)) were constructed, with Xishan National Forest Park in the suburbs of Beijing as the research object. Given the deciduous tree species in the study area, there is no photosynthesis in winter. The ability of forests to release NAIs is extremely weak, and therefore, continuous observation data of NAIs and related meteorological factors during the growing season from 2019 to 2021 were selected to explore the mechanism of the ability of forests to release negative ions.
1.1. Construction and Model Establishment of “Five Capacity Indicators”
Based on the NAI measurement data of previous years, this study intends to construct 5 “ability indicators” of plants to release NAI, and evaluate the ability of plants to release NAI.
Indicator model and parameters:
Release contribution rate:
L = (GTreat − GCK)/GTreat × 100%
This is the ratio of the percentage of NAIs released by forests to the total NAI, i.e., the contribution of forests to the total NAI amount (%).
Release coefficient:
n = (GTreat − GCK)/GCK × 100%
This is the ratio of the number of NAIs released by the forest to the number of blank control groups, i.e., the ability of the forest to release NAIs immediately (%).
Release rate:
s = (GTreat − GCK) × S1 × h/(t survival × LAI × S2)
This is the number of NAI increases per unit leaf area per unit time in a forest, i.e., the rate of NAI release from the forest (number/cm2/min).
Instantaneous stock on hand:
V = (GTreat − GCK) × S1 × h/(LAI × S2)
This is the difference between the number of NAIs released by a forest per unit area and the number of blank groups, representing the effect of NAIs released by the forest at a certain moment (number/cm2).
Total release:
Z = (GTreat − GCK) × S1 × h × Total T/(t Survival × LAI × S2)
This is the total amount of NAIs released by the forest during a certain period of time (number/cm2).
In Equations (1)–(5): GTreat is the average NAIC value during this period in the forest (number/cm3); GCK is the average NAIC value (number/cm3) in the open area outside the forest during this period; S1 is the footprint of the test site; h is the average tree height of the forest stand; t survival is the survival time of NAIs in air (min) [39]; LAI is the leaf area index; S2 is the area occupied by the forest stand area of the experimental site; and Total T is the sampling frequency (min) for this period of time.
1.2. Assumptions Based on the Evaluation Index System Model
By continuously observing the NAIC inside and outside the forest in the study area, a change model was established (Figure 1). It was found that its daily fluctuation trend showed a “bimodal” pattern, with higher NAIC both inside and outside the forest during noon and evening. Based on this, we mainly speculate on the changing trends and interrelationships of the “five capacity indicators”, which have two hypothetical results:
- Linkage: The dynamic characteristics of L, n, s, v, and Z have a consistent trend of change, with one eliminating the other and the other rising (Figure 2).
- Unilaterality: The fluctuation trends of L, n, s, v, and Z are inconsistent, with one fluctuating and the other increasing.
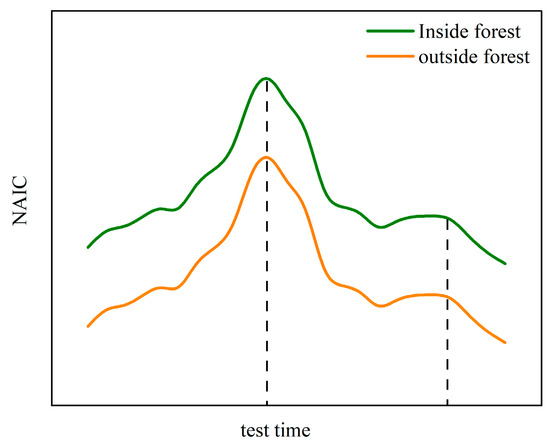
Figure 1.
NAIC variation model.
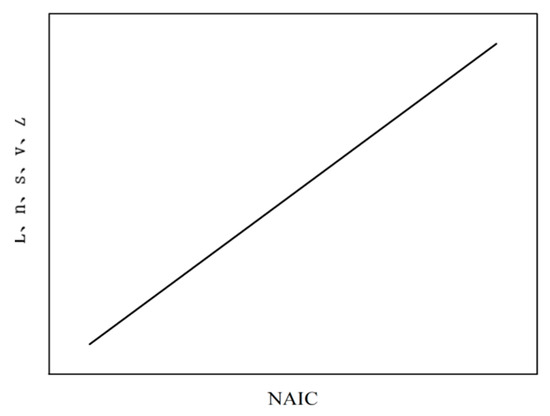
Figure 2.
Linkage model.
Our aim is to apply the NAIC change model and the “five capacity indicators” to calculate parameters and their correlation in forest parks to test the following hypotheses: (1) the change trends of L, n, s, v, and Z are consistent with NAIC and all exhibit a “bimodal” pattern; (2) the trends of L, n, s, v, and Z are consistent and have linkage. To that end, our study consists of analyzing the ability of forests to release NAIs under seasonal and weather conditions and verifying whether there is “linkage” under these conditions, evaluating the effect of forest release of NAIs using the total release parameter, and exploring the response mechanism between the main environmental factors (solar radiation, temperature) and the “five capacity indicators”.
2. Materials and Methods
2.1. Overview of the Research Area
Beijing Xishan National Forest Park is east of the Fifth Ring Road (39°58′18.17″ N and 116°11′51.20″ E). It is the closest 4A-level national forest park to the urban area of Beijing and is known as the “urban forest”. Covering an area of approximately 5970 hectares, with a coverage rate of 98.5%, it belongs to a warm temperate semi-humid continental monsoon climate with four distinct seasons. The average annual temperature is 16.2 °C, the average humidity is 80%, and the annual precipitation is 644 mm. In 2014, the negative ion content in the air had reached 4000 cm3 (Beijing Municipal Bureau of Landscape and Greening, 2014).
The vegetation of Xishan Forest Park covers a vast area of mountains and forests, with over 250 species of plants belonging to 73 families and a forest area of approximately 4500 hectares. Common tree species include Pinus tabuliformis Carr., Platycladus orientalis, Pinus bungeana, Salix babylonica, Ligustrum lucidum, and Quercus variabilis, all of which are widely distributed and representative landscaping tree species in Beijing.
2.2. Test Methods
Using a control experiment, ecological environment monitoring stations were set up in the “vegetation area” inside the forest (including species such as Pinus tabuliformis, Platycladus orientalis, and Quercus variabilis with an age of 45 years and a height of about 11 m) and in the “open space” outside the forest (30 m away from the edge of the forest, with lawn as the ground cover).NAI automatic detector and Weather Meter automatic weather station are installed inside, solar radiation (w/m2), temperature (°C), atmospheric humidity (%), and rainfall (mm) were monitored simultaneously. The sampling frequency was 1 h per session, and sampling was conducted 24 h a day without interruption. According to the rainfall regulations in Beijing, this study is based on an assumption of light rain (less than 10 mm rainfall in 1 day).
2.3. Statistical Analysis
We used an Excel spreadsheet to filter and organize the obtained NAI data. The specific filtering method is as follows: (1) Discard abnormal data caused by instrument failure. (2) Multiple consecutive identical values are discarded. (3) Discard if there is a difference of three times or less than one-third between the values before and after. (4) Missing values are filled using the interpolation method [40]. We performed Pearson correlation analysis on the five capacity indicators with solar radiation and temperature using SPSS26.0 (IBM, Armonk, NY, USA) software. We plotted the release characteristics of the five capacity indicators with Origin2021 Pro (OriginLab, Northampton, MA, USA) software and linearly fit them with solar radiation and temperature.
3. Results
3.1. Characteristics of Forest’s Ability to Release NAIs
3.1.1. Release Contribution Rate
L represents the contribution of stripped forests to the total atmospheric NAIs (Figure 3), with a contribution capacity of 6.04–9.71% during the growing season. The daily average NAI contributions of forests in spring, summer, and autumn are 7.32 ± 4.17%, 6.04 ± 4.40%, and 9.71 ± 5.41%, respectively. At 11:00 (9.75%) and 17:00 (7.61%) in spring, 12:00 (12.03%) and 16:00 (10.63%) in autumn, and 9:00 (9.55%) and 19:00 (6.94%) in summer, forests have the strongest effect and the highest ratio of contribution to atmospheric NAI amount.
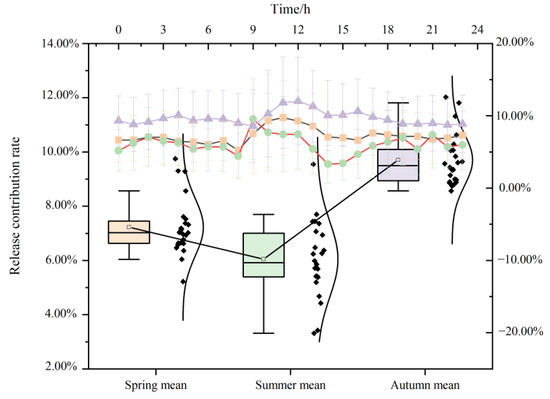
Figure 3.
Daily variation of forest NAI release contribution rate.
3.1.2. Release Coefficient
The ability of the forest to immediately release NAIs is represented by n (Figure 4), with a fluctuation range of 6.63–11.05% during the growing season. The seasonal daily average is 7.94 ± 3.55% in spring, 6.63 ± 3.78% in summer, and 11.05 ± 4.30% in autumn. The strongest ability to release NAIs immediately is at 11:00 in spring, with a second peak (8.86%) appearing at 17:00. The instant release ability is highest at 12:00 (14.22%) and 16:00 (12.17%) in autumn. The first peak (10.95%) appears at 9:00 in summer, and the second peak (8.20%) appears at 21:00.
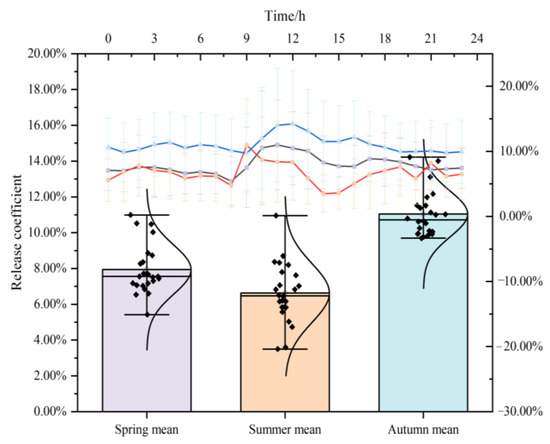
Figure 4.
Daily variation of forest NAI release coefficient.
3.1.3. Release Rate
S represents the speed at which the forest releases NAIs (Figure 5). The release rate range during the growing season is 4.53 × 10³~7.49 × 10³/cm2/min. The daily release rate of forest NAIs is highest, reaching 9.72 × 10³/cm2/min, in autumn (12:00), followed by 7.89 × 10³/cm2/min in summer (9:00) and a lower rate in spring (7.88 × 10³/cm2/min (12:00). The release rate of NAIs gradually slows down in the afternoon, especially in summer. The release rate of NAIs accelerates in the evening during the spring and autumn seasons, with spring (8103.46/cm2/min) > autumn (5683.65/cm2/min). The release rate accelerates at 3:00 pm in summer, reaching up to 5000 cells/cm2/min.
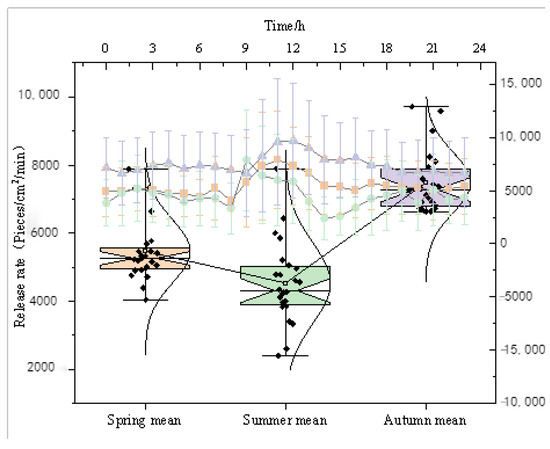
Figure 5.
Daily variation of forest NAI release rate.
3.1.4. Instantaneous Stock on Hand
V represents NAIs released by the forest at a certain moment (Figure 6). The instantaneous standing stock range during the growing season is 4.48 × 10⁴~7.34 × 10³ pieces/cm2. The forest’s ability to release NAIs is most effective at 11:00 in the spring and autumn seasons, with the highest instantaneous standing stock (7.76 × 10⁴ pieces/cm2, 9.17 × 10⁴ pieces/cm2). In summer, the optimal values occur at 9:00 and 21:00, with instantaneous standing stock of 7.57 × 10⁴ pieces/cm2 and 5.35 × 10⁴ pieces/cm2, respectively. In the afternoon, the instantaneous standing stock significantly decreases, and the release effect is poor.
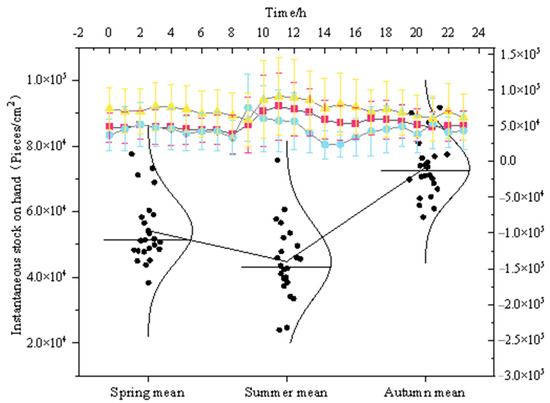
Figure 6.
Daily variation of instantaneous standing stock of forest NAIs.
3.1.5. Total Release
Taking the calculation of the total amount of NAIs released by forests per hour as an example, we analyze its trend changes (Figure 7). The range of hourly release during the growing season is 2.70 × 10⁵~4.40 × 10⁵ cells/cm2. The trend of total release in spring, summer, and autumn is relatively consistent, but the peak time is slightly different. At 9:00 in spring, the hourly release rate continued to gradually increase, reaching the first peak at 12:00 (4.40 × 10⁵/cm2). The total release amount significantly decreased in the afternoon, and the second peak appeared at 17:00 (3.41 × 10⁵/cm2). At 11:00 in autumn, the first peak (5.66 × 10⁵/cm2) appeared, and at 17:00, the second peak (4.35 × 10⁵/cm2) appeared. The peak time in summer has advanced, with the highest total release occurring between 8:00 and 9:00 (4.54 × 10⁵ cells/cm2) and between 20:00 and 21:00 (3.21 × 10⁵ cells/cm2), followed by further NAI release in the early morning and evening.
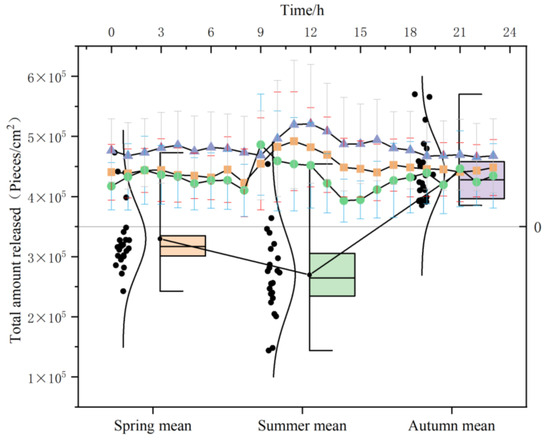
Figure 7.
Daily variation of total NAI release from forests.
3.1.6. Correlation Analysis of Five Indicators
In summary, the daily variation trend of the five capacity indicators for forest release of NAIs is consistent with the NAIC model, indicating that the overall concentration of NAIs is mainly influenced by plants, and forests are the main source of total atmospheric NAI amount, which is less affected by other factors. From the trend chart of the five capacity indicators in Figure 8, it can be found that L, n, s, v, and Z fluctuate synchronously, indicating that as the forest contribution increases, the immediate release ability also strengthens, the release rate increases, and the release amount increases. The “change trend” of each indicator is consistent (Figure 8), indicating a “linkage” relationship between these indicators.
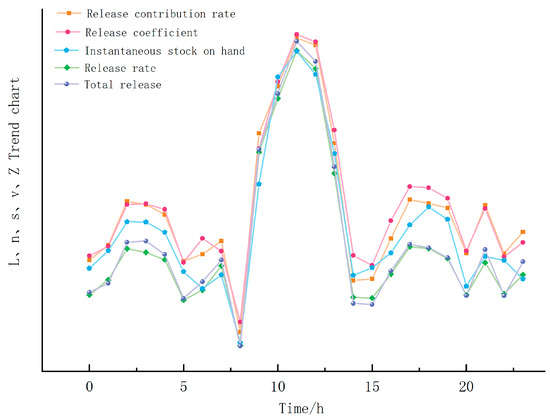
Figure 8.
Daily variation trend of the five capacity indicators for forest release of NAIs.
3.1.7. Assessment of NAI Release Effects from Forests
We explored the impact of forests on NAI production from the perspective of total release, and evaluated the effects of forest release of NAIs, as shown in Figure 9. The average daily “million level” NAI production can reach a minimum of “billion level” throughout the year. In different seasons, forests produce the highest daily NAI amount in autumn, with an average of 5.12 × 10⁶/cm2, followed by spring at 3.93 × 10⁶/cm2, and the lowest production in summer at 3.58 × 10⁶/cm2. From 2019 to 2021, the production volume of NAIs has been increasing year by year, and the rates have been increasing by 19.6% in 2019–2020 and 56.5% in 2020–2021, respectively.
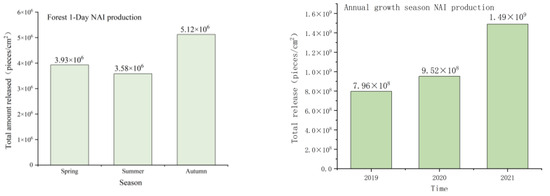
Figure 9.
Forest release of NAI production.
3.2. Characteristics of Forest NAI Release Capacity Under Different Weather Conditions
According to the rainfall specifications in the Beijing area, rainy days (less than 10 mm rainfall in 1 day) and cloudy days (atmospheric humidity > 80%) were selected to collect NAIC during the rainfall process and study the impact of weather on the forest’s ability to release NAIs. As shown in Figure 10, the dynamic characteristics of L, n, s, v, and Z under the influence of weather show a “double peak” trend on sunny days, with peaks appearing at noon and evening, and a “V” shape on cloudy and rainy days.
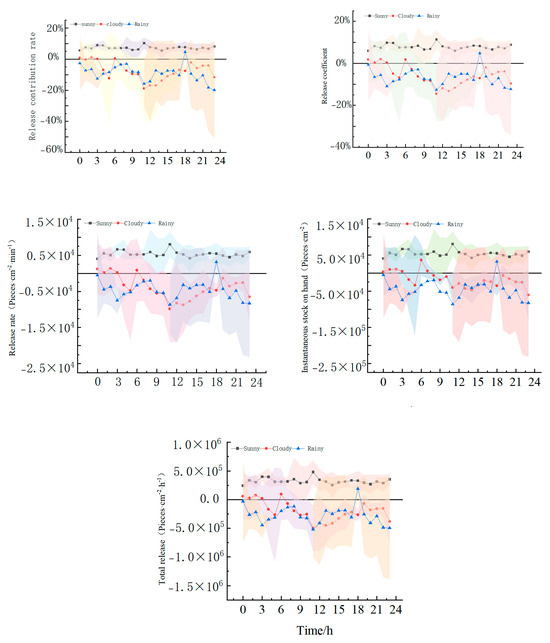
Figure 10.
Characteristics of the forest’s ability to release NAIs under different weather conditions.
Daily release capacity: At 6:00 on cloudy days, the release capacity is the strongest, with L, n, s, v, and Z at 0.53%, 1.7%, 877.19 cells/cm2/min, 3.56 × 10⁴ cells/cm2, and 9.67 × 10⁴ cells/cm2, respectively. At 18:00 on rainy days, the release capacity is highest, with L, n, s, v, and Z values of 4.58%, 4.83%, 3.16 × 10³ cells/cm2/min, 3.16 × 10⁴ cells/cm2, and 1.90 × 10⁵ cells/cm2, respectively.
In summary, the ability of forests to release NAIs under different weather conditions is manifested as sunny > rainy > cloudy. On sunny days, the release capacity is strongest at noon, while on rainy and cloudy days, it is higher in the morning and evening and the worst at noon. Moreover, on rainy and cloudy days, the overall NAI release capacity is higher outside the forest, indicating that the atmospheric NAI production by forests is lower during this weather. There are differences between the daily variation trend of cloudy and rainy days and the NAIC model, indicating that the release of NAIs from forests is weakened by other natural environmental factors such as rainfall, temperature and humidity, and wind speed. However, the fluctuations of L, n, s, v, and Z are still consistent under different weather conditions, showing a linear relationship, and the linkage is established.
3.3. Correlation Analysis Between Five NAI Release Capacity Indicators and Meteorological Factors in Forests
We performed linear regression fitting and correlation analysis on the five capacity indicators of forest release of NAIs with solar radiation (strongest radiation intensity time 11:30–14:00) and temperature (0–30 °C) (Figure 11). Research has found a positive correlation with L, n, s, v, and Z. The impact range of various indicators and meteorological factors varies. When the temperature was between 5–20 °C, the 5 indexes of NAI released by forest showed an increasing trend with the increase of temperature. The solar radiation is positively correlated with L, n, s, v, and Z in the range of 0–200 w/m2. As the solar radiation continues to strengthen, the forest’s ability to release NAIs significantly increases.
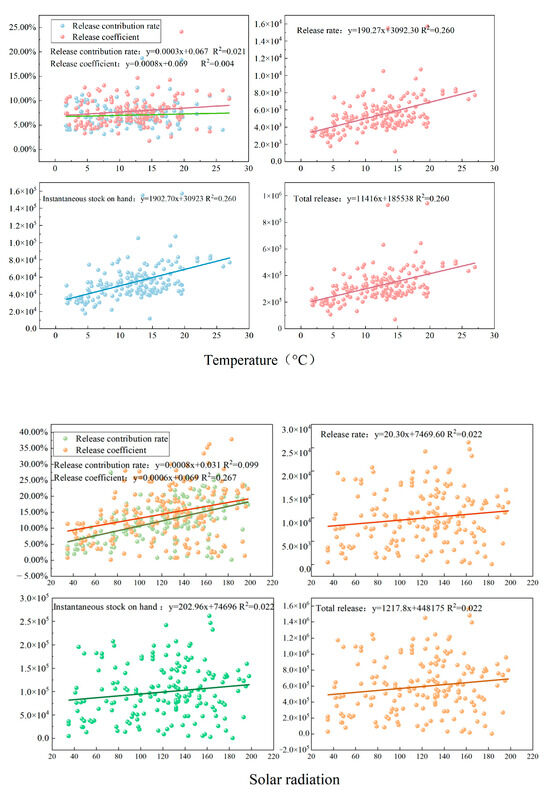
Figure 11.
Linear fitting of five capacity indicators with solar radiation and temperature.
4. Analysis and Discussion
4.1. Establishment of the Relationship Between the “Five Capacity Indicators”
Based on continuous observation, we constructed an NAIC change model, studied whether the “five capacity indicators” of forest release of NAIs are consistent with the NAIC change model for different seasons and weather conditions, and analyzed the relationship among the “five capacity indicators”. Research has found that the daily variation trend of the “five capacity indicators” under clear weather is consistent with the NAIC model, indicating that forests are the main source of atmospheric NAIs in the natural environment, mainly influenced by vegetation. The diurnal variation shows a “bimodal” pattern, with zero nighttime photosynthesis and a decrease in the contribution of vegetation to atmospheric NAIs. The strongest midday light intensity leads to enhanced photosynthesis, which releases a large amount of NAIs. There are differences between the rainy and cloudy days and the NAIC model, indicating that the release of NAIs from forests is weakened due to environmental factors. The trend of changes among L, n, s, v, and Z is consistent and has linkage, which may be influenced by the combined effects of plant physiological activities and environmental factors, resulting in good consistency between the indicators.
4.2. The Ability of Forests to Release NAIs in Different Seasons
This study explores new dimensions that have not been studied in the field of NAIs, constructs five capacity indicators, evaluates the forest’s ability to release NAIs from different perspectives, and obtains the magnitude of the forest’s ability to release NAIs. Research has found that the ability of forests to release NAIs (L, n, s, v, Z) is higher in autumn at different scales, followed by spring and lowest in summer. The results of the study on NAIC are similar to those of Tang Jinqian [41], and others, but different from the results of Feng Yanzhu’s study (“summer NAIC > spring NAIC > autumn NAIC”). Due to the influence of summer shade, the human flow inside the forest has increased compared to open areas outside the forest, greatly affected by human interference. In autumn, the degree of environmental pollution is relatively low, and air humidity rises. Oxygen atoms in the atmosphere are rapidly ionized, producing more negative air ions.
This study also found that the peak values of the daily variation of the NAI release capacity index in forests generally occur in the afternoon and evening, showing a “double peak” variation. This research result is similar to the bimodal pattern of NAIC daytime variation observed by Si Tingting et al. [42]. in tropical rainforests and the peak results of NAIC at noon and evening in Beijing Xiangshan Park [43]. The results of Guo Yun’s (2016) [44] study (“higher morning and evening NAIC, lower noon”) and Wang Lijun’s [45], and Wu Yifei’s (2022) studies showing “early, middle, and late” W-shaped changes are significantly different. This is because at noon, the solar radiation is strong, and photosynthesis is at its highest. Under the dual effects, NAI amount increases rapidly. In the afternoon, it is affected by solar ultraviolet radiation and plant photosynthesis [46]. With strong sunlight, vegetation stomata close, photosynthetic midday rest occurs, and the contribution of forests to NAI amount gradually decreases. As the intensity of solar ultraviolet radiation and forest photosynthesis gradually decreases, the air humidity increases. The release of NAIC from forests is gradually increasing [47], and the NAI contribution capacity is strengthening. Due to the significant influence of temperature on the ability to release NAIs, the peak time in summer evenings is delayed compared to spring and autumn. The formation of peaks and valleys may be closely related to the physiological activities of vegetation itself, and the NAIC produced by different vegetation over time varies throughout the day [45,48].
4.3. Differences in the Ability of Forests to Release NAIs Under Different Weather Conditions
In this study, the five capacity indicators of forest release of NAIs under different weather conditions were all shown to follow the trend of sunny > rainy > cloudy, which is similar to the research results of Cao Shucai et al., which showed that NAIC was significantly higher on sunny days than on cloudy days [49]. The results of the study by Xu Meng et al. regarding the NAIC for urban green spaces (“rainy day > sunny day > cloudy day”) are significantly different from those of Wang L et al. [50]. (“rainy day > cloudy day > sunny day”). However, the results of the study by Cao Shucai et al. show that the NAIC for sunny days is significantly higher than that for cloudy days.
Secondly, this study found that the ability to release NAIs is strongest in the afternoon on sunny days, and worst in the afternoon on cloudy and rainy days, with the greatest amount of NAIs released at 6:00 (cloudy) and 18:00 (rainy). Wang Lei et al. had different results, with the highest NAI concentration on sunny days in the morning and evening, on rainy days from 8:00 to 12:00, and on cloudy days at 9:00, and with the highest NAI concentration on rainy days reaching 11,432/cm3. Li Jimei et al. also found that the concentration of negative air ions in different regions under different weather conditions in the Tarim Basin followed the pattern of rainy > sunny > cloudy.
The above differences between previous research results and this study may be influenced by different observation points and meteorological conditions such as rainfall. When the rainfall is very small, within 2 mm, there is no significant difference in NAIC compared to non-rainfall conditions [51]; in rainstorm weather (when the rainfall reaches more than 500 mm), the negative ion concentration shows a downward trend [52]. Related studies have found that under sunny conditions, if the direction of the atmospheric electric field is perpendicular to the ground, it can release more negative charges [53]. A phenomenon of increased NAI release under sunny conditions has also been observed.
4.4. Correlation Between Forest’s Ability to Release NAIs and Meteorological Factors
Firstly, this study found that the ability of forests to release NAIs (L, n, s, v, Z) is positively correlated with solar radiation, temperature, and other factors. This is consistent with the findings of Shi Cong et al. [54]. on the response relationship between forest negative ion concentration and meteorological factors in different regions of Beijing, as well as Shi Guangyao et al.’s study on the relationship between photosynthetic energy and negative ion concentration in Platycladus orientalis. Temperature and solar radiation have been significantly positively correlated with NAIC, which is consistent with the results of this study. In the summer study of different plant communities in Hohhot, Jiang Ruixin et al. found a significant negative correlation between negative air ion concentration and temperature. Hou Xiujuan [55] and Yan X. [56] also found negative correlation results in urban park green spaces. Secondly, this study found that the influence ranges of temperature, solar radiation, and the five capacity indicators are 5–20 °C and 0–200 w/m2. Previous studies have rarely explored the impact of meteorological factor classification on NAI concentration, although there are slight similarities with the results of Shi Cong’s research. In the shallow mountainous areas of the suburbs, the correlation is strong when the temperature range is 0–10 °C, weak when it is 10–15 °C, and negative when it is above 15 °C; the temperature influence mechanism is very complex.
The different research results mentioned above may be due to different observation locations, high human flow in suburban forests, susceptibility to air pollution, and prominent environmental issues. Alternatively, the rapid diffusion of particulate matter in the atmosphere due to temperature rise may also result in the adsorption of some NAIs during the diffusion process [57], leading to an increase in temperature and a decrease in negative ion concentration.
5. Conclusions and Outlook
This study proposes a new evaluation system for negative ion release capacity based on the changes in NAI production inside and outside the forest. For the first time, five capacity indicators (release contribution rate (L), release coefficient (n), release rate (s), instantaneous standing quantity (v), and total release amount (Z)) were constructed, with Xishan National Forest Park in the suburbs of Beijing as the research object. The research results demonstrated the following: (1) The five capacity indicators showed a “bimodal” trend, with the strongest release ability in the afternoon and evening, and there was linkage between the various indicators, with consistent changing trends. (2) Forests can release more NAIs in autumn, with production at its lowest in summer, stronger in spring and autumn at noon, and stronger during summer in the morning. (3) The ability of forests to release NAIs is manifested as sunny > rainy > cloudy, with stronger release ability on cloudy mornings and rainy nights. (4) The five capacity indicators are positively correlated with solar radiation and temperature, with an impact range of 0–200 w/m2 and 5–20 °C, respectively.
This study establishes a new NAI capability evaluation system to explore forests’ ability to release NAIs at the single-tree scale. The conclusions of this study regarding the NAIC model, changes in the “five capacity indicators”, and the establishment of relationships between indicators are mainly relevant to the experimental environment of this study area. Since the study area is deciduous tree species, the five ability indicators in winter are basically zero, so this paper does not do research. Coniferous tree species continue to photosynthesize in winter, and further research is therefore needed. Moreover, the research site is affected by the natural environment and other influences, and there are many interference factors to consider. The contribution of forest vegetation itself is difficult to distinguish, and further control experiments are needed to study the ability of vegetation to release NAIs under more precise conditions.
Author Contributions
S.L. (Shaoning Li): methodology, writing—review and editing, supervision. T.L.: conceptualization, methodology, data curation, investigation, writing—original draft, visualization. D.Y.: formal analysis, writing—review and editing, investigation. N.Z.: formal analysis, writing—review and editing, investigation. X.X.: methodology, validation, writing—review and editing, visualization. B.L.: formal analysis, writing—review and editing, investigation. S.L. (Shaowei Lu): conceptualization, resources, supervision, project administration, funding acquisition. All authors have read and agreed to the published version of the manuscript.
Funding
National Natural Science Foundation of China (32171844, 32071843); Beijing Academy of Agricultural and Forestry Sciences (BAAFS) Innovation Capacity Building Special Project (KJCX20230306).
Institutional Review Board Statement
Not applicable.
Informed Consent Statement
Not applicable.
Data Availability Statement
Data will be made available on request.
Acknowledgments
We would like to thank the following institutions for fostering: Institute of Forestry and Pomology, Beijing Academy of Agriculture and Forestry Sciences; Beijing Yanshan Forest Ecosystem Observation and Research Station; and Forestry College of Shenyang Agricultural University. We are grateful for the financial support from the following grants: Natural Science Foundation of China (32071834); Beijing Municipal Natural Science Foundation (8212044).
Conflicts of Interest
The authors declare that they have no known competing financial interests or personal relationships that could have appeared to influence the work reported in this paper.
References
- Henderson, J.V. Effects of air quality regulation. Am. Econ. Rev. 1995, 86, 789–813. [Google Scholar]
- Yates, A.; Gray, F.B.; Misiaszek, J.I.; Wolman, W. Air ions: Past problems and future directions. Environ. Int. 1986, 12, 99–108. [Google Scholar] [CrossRef]
- Kappos, A.D.; Bruckmann, P.; Eikmann, T.; Englert, N.; Heinrich, U.; Höppe, P.; Koch, E.; Krause, G.H.; Kreyling, W.G.; Rauchfuss, K.; et al. Health effects of particles in ambient air. Int. J. Hyg. Environ. Health 2004, 207, 399–407. [Google Scholar] [CrossRef]
- Saldiva, P.H.N.; Clarke, R.W.; Coull, B.A.; Stearns, R.C.; Lawrence, J.; Murthy, G.G.K.; Diaz, E.; Koutrakis, P.; Suh, H.; Tsuda, A.; et al. Lung inflammation induced by concentrated ambient air particles is related to particle composition. Am. J. Respir. Crit. Care Med. 2002, 165, 1610–1617. [Google Scholar] [CrossRef]
- Hu, B. Environmental pollution trend assessment based on big data. Compr. Util. Resour. China 2018, 36, 128–130. [Google Scholar]
- WHO. 2019 World Health Statustics; WHO: Geneva, Switzerland, 2020. [Google Scholar]
- Song, W. Reflection on the inevitability and path of the development of forest health industry. For. Econ. 2020, 42, 3–8. [Google Scholar]
- Liu, R.; Lian, Z.; Lan, L.; Qian, X.; Chen, K.; Hou, K.; Li, X. Effects of negative oxygen ions on sleep quality. Procedia Eng. 2017, 205, 2980–2986. [Google Scholar] [CrossRef]
- Bowers, B.; Flory, R.; Ametepe, J.; Staley, L.; Patrick, A.; Carrington, H. Controlled trial evaluation of exposure duration to negative air ions for the treatment of seasonal affective disorder. Psychiatry Res. 2018, 259, 7–14. [Google Scholar] [CrossRef]
- Nadali, A.; Arfaeinia, H.; Asadgol, Z.; Fahiminia, M. Indoor and outdoor concentration of PM10, PM2.5 and PM1 in residential building and evaluation of negative air ions (NAIs) in indoor PM removal. Environ. Pollut. Bioavailab. 2020, 32, 47–55. [Google Scholar] [CrossRef]
- Yang, B. Research on Urban Green Space Suitability Design Strategy Based on Key Elements of Air Quality. Ph.D. Thesis, Southeast University, Dhaka, Bangladesh, 2023. [Google Scholar]
- Deng, L.; Deng, Q. The basic roles of indoor plants in human health and comfort. Environ. Sci. Pollut. Res. 2018, 25, 36087–36101. [Google Scholar] [CrossRef]
- Liu, S.; Huang, Q.; Wu, Y.; Song, Y.; Dong, W.; Chu, M.; Yang, D.; Zhang, X.; Zhang, J.; Chen, C.; et al. Metabolic linkages between indoor negative air ions, particulate matter and cardiorespiratory function: A randomized, double-blind crossover study among children. Environ. Int. 2020, 138, 105663. [Google Scholar] [CrossRef] [PubMed]
- Lin, W.; Zeng, C.; Nie, W.; Nan, X.; Shen, S.; Shi, Y.; Yan, H.; Yang, F.; Wu, R.; Bao, Z. Study of the vertical structures, thermal comfort, negative air ions, and human physiological stress of forest walking spaces in Summer. Forests 2022, 13, 335. [Google Scholar] [CrossRef]
- Han, H.S.; Jeong, G.J.; Lee, H.W.; Shim, J.H.; Seo, S.J.; Park, K.Y. Innovative Use of Negative Air Ions As an Alternative Therapy for Acne Vulgaris: A Report of Three Cases. Ann. Dermatol. 2022, 34, 216–220. [Google Scholar] [CrossRef]
- Hu, Y.Q.; Niu, T.T.; Xu, J.M.; Peng, L.; Sun, Q.H.; Huang, Y.; Zhou, J.; Ding, Y.Q. Negative air ion exposure ameliorates depression-like behaviors induced by chronic mild stress in mice. Environ. Sci. Pollut. Res. 2022, 29, 62626–62636. [Google Scholar] [CrossRef]
- Wang, H.; Wang, B.; Niu, X.; Song, Q.; Li, M.; Luo, Y.; Liang, L.; Du, P.; Peng, W. Study on the change of negative air ion concentration and its influencing factors at different spatio-temporal scales. Glob. Ecol. Conserv. 2020, 23, e01008. [Google Scholar] [CrossRef]
- Jiang, S.Y.; Ma, A.L.; Ramachandran, S. Negative air ions and their effects on human health and air quality improvement. Int. J. Mol. Sci. 2018, 19, 2966. [Google Scholar] [CrossRef] [PubMed]
- Yang, H. Air negative ions and forest health. Shanxi For. Technol. 2022, 51, 74–75. [Google Scholar]
- Zhao, X.; Li, C.; Ge, J. Research progress on air negative ions in forest environments. J. Northwest For. Univ. 2007, 57–61. [Google Scholar]
- Yun, J.; Yao, W.; Wang, X.; Chen, F.; Wang, S. Daily dynamics of forest air negative ion concentration in spring and the relationship of influencing factors: Results of field monitoring. Air Qual. Atmos. Health 2024, 17, 501–511. [Google Scholar] [CrossRef]
- Li, Z.; Li, C.; Chen, B.; Hong, Y.; Jiang, L.; He, Z.; Liu, J. Temporal Dynamics of Negative Air Ion Concentrations in Nanjing Tulou Scenic Area. Atmosphere 2024, 15, 258. [Google Scholar] [CrossRef]
- Xu, L. Spatial and Temporal Variation of Negative Ion Concentration in Urban Forest Air in Beijing and Its Influencing Factors. Ph.D. Thesis, Shenyang Agricultural University, Shenyang, China, 2019. [Google Scholar]
- Wu, C.-F.; Chu, T.-Y.; Chen, S.-H.; Wu, S.-Y. Generating negative air ions in construction waterscapes at a garden scale. Environments 2019, 6, 100. [Google Scholar] [CrossRef]
- Li, Y.; Li, F.; Xiao, N. The variation law of negative ion concentration in urban forest air of Qiqihar City. J. Northeast For. Univ. 2020, 48, 71–75. [Google Scholar]
- Wang, Y.; Ni, Z.; Wu, D. Factors influencing the concentration of negative air ions during the year in forests and urban green spaces of the Dapeng Peninsula in Shenzhen, China. J. For. Res. 2020, 31, 2537–2547. [Google Scholar] [CrossRef]
- Gao, T.; Lu, J.; Li, J.; Han, X.; Baima, Y. Air quality evaluation of typical ecological land in the main urban area of Linzhi City. J. Southwest Norm. Univ. Nat. Sci. Ed. 2020, 45, 130–137. [Google Scholar]
- Wu, R.; Sun, Y.; Zheng, J.; Deng, C.; Ye, D.; Wang, Q. The relationship between the release of NAI from plants and stomatal characteristics under the action of pulsed electric fields. Acta Bot. Sin. 2017, 52, 744–755. [Google Scholar]
- Tikhonov, V.P.; Tsvetkov, V.D.; Litvinova, E.G.; Sirota, T.V.; Kondrashova, M.N. Generation of negative air ions by plants upon pulsed electrical stimulation applied to soil. Russ. J. Plant Physiol. 2004, 51, 414–419. [Google Scholar] [CrossRef]
- Wang, Y.; Liu, S.; Zhou, X.; Liu, Q.; Li, B. Air negative ion levels and their evaluation of the main forest types in Chongqing region. J. Northeast For. Univ. 2014, 42, 38–42. [Google Scholar]
- Feng, P.; Yu, X.; Zhang, X. Analysis of Air Negative Ion Concentrations and Influencing Factors of Different Plant Types in Beijing Area. J. Ecol. Environ. 2015, 24, 818–824. [Google Scholar]
- Li, S.; Lu, S.; Zhao, Y.; Ding, J.; Liu, B.; Chen, B. A study on the characteristics of air negative ions in seven economic forests in Beijing. J. Southwest For. Univ. 2018, 38, 85–90. [Google Scholar]
- Li, A.; Li, Q.; Yang, Y.; Hu, Y.; Xiao, S.; Li, Z.; Zhou, B. Stand structure and environment jointly determine negative air ion concentrations in forests: Evidence from concurrent on-site monitoring in four typical subtropical forests during the growing season. Environ. Exp. Bot. 2024, 220, 105684. [Google Scholar] [CrossRef]
- Zhang, X.; Cao, J.; Zhang, S. Distribution characteristics of air anions in Beidaihe in different ecological environments. J. Geosci. Environ. Prot. 2018, 6, 133–150. [Google Scholar] [CrossRef]
- Cai, L.; Wang, C.; Zhang, J.; Meng, P.; Shi, G. Empirical analysis of the influence mechanism of vegetation and environment on negative air ion in warm temperate forest ecosystems. Environ. Pollut. 2024, 363, 125273. [Google Scholar] [CrossRef] [PubMed]
- Feng, Y. A Study on the Characteristics of Air Negative Ion Changes in Different Plant Configuration Communities in Parks. Fujian AF Univ. 2018, 34, 95–103. [Google Scholar]
- Li, A.; Zhou, B.; Li, C.; Ye, M.; Yang, Z.; Zhao, X.; Tong, R.; Cao, Y.; Zhao, Y. Air negative ion effects of six typical subtropical tree species based on control experiments. For. Sci. Res. 2019, 32, 120–128. [Google Scholar]
- Huang, X.; Zeng, H.; Chen, H.; Wang, T.; Yang, Y. Research on the Source and Influencing Factors of Negative Ion in Urban Lawn Air Based on Static Box Method. J. Appl. Environ. Biol. 2021, 27, 949–955. [Google Scholar]
- Li, S.; Xu, X.; Lu, S.; Zhao, N. Research on the Ecological Function of Economic Forests in Beijing; Science and Technology Literature Press: Beijing, China, 2020. [Google Scholar]
- Li, A.; Li, Q.; Yang, Y.; Hu, Y.; Xiao, S.; Li, Z.; Zhou, B. Associations of forest negative air ions exposure with cardiac autonomic nervous function and the related metabolic linkages: A repeated-measuer-panel study. Sci. Total Environ. 2022, 850, 158019. [Google Scholar] [CrossRef] [PubMed]
- Tang, J.; Wang, M.; Hu, X.; Luo, Z.; Wu, J. The spatiotemporal distribution and influencing factors of air negative ion concentration in the urban area of Shanghang. J. Nat. Sci. Hunan Norm. Univ. 2023, 46, 124–135. [Google Scholar]
- Si, T.; Luo, Y.; Zhao, Z.; Ou, Y. The Relationship between Air Negative Ion Concentration and Meteorological Elements in Tropical Yulin of Diaoluo Mountain. Resour. Sci. 2014, 36, 788–792. [Google Scholar]
- Du, W.; Wang, C.; Wang, Q.; Bao, H.; He, R.; Xu, C.; Gao, F.; Xie, J. Summer Environmental Impact Assessment of Main Vegetation Types in Beijing Xiangshan Park. For. Sci. 2018, 54, 155–164. [Google Scholar]
- Guo, Y. The spatiotemporal distribution characteristics of air negative ion concentration in Hubei Province and its relationship with meteorological elements. Meteorol. Hydrol. Ocean. Instrum. 2016, 33, 68–72. [Google Scholar]
- Wang, L.; Han, Z.; Bai, Y.; Li, X.; Mu, Y.; Sun, G. Research on the spatiotemporal variation characteristics of air negative ion concentration in Honghuaerji Forest Park. For. Technol. Commun. 2018, 12, 46–48. [Google Scholar]
- Wu, Y.; She, S. Research on the spatiotemporal variation characteristics of air negative ions in Longjia Mountain National Forest Park based on GIS. Hubei For. Technol. 2022, 51, 7–12. [Google Scholar]
- Tang, Q.; Xing, H.; Zhang, D. Air negative ion concentration and its relationship with meteorological factors in the Pinus sylvestris and Larix gmelinii forest areas of Arctic Village. Chin. J. Agron. 2017, 33, 107–111. [Google Scholar]
- Xu, W.; Weng, Y.; Liao, R.; Zhu, J. Differences in negative oxygen ions and air quality among five typical green plants in office spaces. Tianjin Agric. Sci. 2016, 22, 140–144. [Google Scholar]
- Cao, S.; Su, Z.; Chen, B. Air negative ion levels and influencing factors in Guangzhou green spaces. J. Ecol. 2007, 26, 1049–1053. [Google Scholar]
- Wang, L.; Wan, X.; Huang, L.; Jiang, H. A study on the dynamic changes of negative ions in the air of forests in the suburbs of Nanjing. Jiangsu For. Technol. 2016, 43, 24–28+55. [Google Scholar]
- Si, T.; Luo, Y.; Bi, H.; Zhao, Z.; Huang, Y.; Zhang, Z. Preliminary Study on the Changes of Air Negative Ion Content in the Tropical Rainforest of Diaoluo Mountain. For. Resour. Manag. 2015, 4, 139–144. [Google Scholar]
- Fang, Y.; Zhang, F.; Chen, L. Correlation analysis between air negative ion concentration characteristics and meteorological factors in Jiangxi Province. Meteorol. Sci. 2022, 42, 254–260. [Google Scholar]
- Meng, J.; Zhang, Y. The air negative ions on the ground mainly come from the tip discharge of plants. Environ. Sci. Technol. 2005, 28, 113112–113120. [Google Scholar]
- Shi, C.; Lu, S.; Zhao, N.; Zhao, X.; Li, S. The response of air negative ion concentration in urban forests of Beijing to temperature. J. Ecol. 2023, 42, 1365–1372. [Google Scholar]
- Hou, X.; Yan, X.; Wang, B.; Li, X.; Bao, H. The variation characteristics of negative ions and particulate matter in the air of urban parks and green spaces in arid and semi-arid summer. J. Nanjing For. Univ. Nat. Sci. Ed. 2022, 46, 212–220. [Google Scholar]
- Yan, X.; Wang, H.; Hou, Z.; Wang, S.; Zhang, D.; Xu, Q.; Tokola, T. Spatial analysis of the ecological effects of negative air ions in urban vegetated areas:A case study in Maiji, China. Urban Green. 2015, 14, 636–645. [Google Scholar] [CrossRef]
- Zhu, B.; Sun, S.; Wang, L.; Li, Y.; Jing, L.; Ca, W. Analysis on the concentration of negative oxygen ions and its influencing factors of Pinus camphor forest in Hulunbuir Sandy land. J. Northwest For. Coll. 2021, 36, 55–59+79. [Google Scholar]
Disclaimer/Publisher’s Note: The statements, opinions and data contained in all publications are solely those of the individual author(s) and contributor(s) and not of MDPI and/or the editor(s). MDPI and/or the editor(s) disclaim responsibility for any injury to people or property resulting from any ideas, methods, instructions or products referred to in the content. |
© 2025 by the authors. Licensee MDPI, Basel, Switzerland. This article is an open access article distributed under the terms and conditions of the Creative Commons Attribution (CC BY) license (https://creativecommons.org/licenses/by/4.0/).