Article

Evaluating Sampling Materials for Atmospheric Volatile Organosulfur Compounds Measurement and Application in the Power Battery Recycling Industry

1
State Key Laboratory of Advanced Environmental Technology, Guangdong Key Laboratory of Environmental Protection and Resources Utilization, Guangzhou Institute of Geochemistry, Chinese Academy of Sciences, Guangzhou 510640, China
2
Changsha Center for Mineral Resources Exploration, Guangzhou Institute of Geochemistry, Chinese Academy of Sciences, Changsha 410013, China
3
Institute of Atmospheric Environment, Hunan Research Academy of Environmental Sciences, Changsha 410004, China
*
Author to whom correspondence should be addressed.
Atmosphere 2025, 16(12), 1341; https://doi.org/10.3390/atmos16121341 (registering DOI)
Submission received: 23 October 2025 / Revised: 20 November 2025 / Accepted: 26 November 2025 / Published: 27 November 2025
(This article belongs to the Section Air Quality)

Abstract

Volatile organosulfur compounds (VSCs) play significant roles in atmospheric chemistry and malodorous pollution. Accurate measurement of VSCs is challenging due to their high reactivity and adsorption tendencies, which are strongly influenced by sampling materials. This study comprehensively evaluates the performance of six types of sampling bags and passivated canisters for measuring nine VSCs. The results indicate that passivated canisters provide stable storage for all target VSCs for up to 7 days under dry conditions. Among the bags, polyvinyl fluoride (PVF) bags exhibited the lowest blank levels and preserved most VSCs (except disulfides) stably for 8 h. Field comparisons in a power battery recycling plant showed good agreement between PVF bag and canister measurements under dry conditions. However, in high-humidity stack gases, canisters showed severe losses of methanethiol and ethanethiol, likely due to humidity-driven conversion on metal surfaces, underscoring the necessity of drying humid-air samples. The application of these methods revealed significant VSCs emissions and distinct compositional profiles from power battery recycling processes, particularly pyrolysis drying, lithium leaching, and nickel–cobalt leaching processes, with concentrations of total VSCs reaching up to 1046.86 ppb. This work provides crucial guidance for selecting appropriate sampling methods for reliable VSCs measurement and offers the first emissions characteristics of VSCs from the power battery recycling industry, supporting future environmental monitoring and pollution control.

Graphical Abstract

1. Introduction

Volatile organosulfur compounds (VSCs), such as methanethiol, ethanethiol, dimethyl sulfide, and carbon disulfide, are an important category of volatile organic compounds (VOCs) in the atmosphere, playing significant roles in the global sulfur cycle and atmospheric chemistry [1,2]. VSCs like methanethiol, ethanethiol, and thiophene are key malodorous substances with extremely low odor thresholds, making them primary culprits in odor pollution incidents [3,4,5]. The other VSCs such as dimethyl sulfide (DMS), carbon disulfide (CS2), and dimethyl disulfide (DMDS) can be oxidized in the atmosphere and ultimately form sulfate aerosols, which significantly influence global radiation balance and climate change [6,7,8]. Therefore, accurate measurement of VSCs is of considerable importance.
Currently, analysis methods of VSCs primarily include offline sampling followed by gas chromatography (GC) or gas chromatography-mass spectrometer (GC-MS) analysis [9,10,11] and online techniques such as proton transfer reaction-mass spectrometer (PTR-MS) [12,13]. Due to the scarcity of online instruments, offline sampling methods remain widely used in both ambient air and pollution source monitoring [14,15]. Moreover, because of their high reactivity and adsorption tendencies, VSCs sampling and analysis are influenced by multiple factors such as container material, storage time, and initial concentration [16,17,18,19,20,21]. Several types of containers, such as gas tight syringes, glass bulbs, sampling bags, and stainless steel canisters, can be used for sampling and storing atmospheric gases. Syringes and glass bulbs are cheap and easy to use, but they are also fragile and have a limited volume [14]. Alternatively, due to their durability and good stability, passivated canisters and sampling bags made of many materials (e.g., polyethylene glycol terephthalate, fluorinated ethylene propylene, polyvinyl fluoride) were widely used for field sampling of VOCs species in previous studies [16,17,18,19]. For example, Mochalski et al. [18] found that flexfoil bags were the best choice for VSCs storage up to 24 h and Tedlar bags were good alternatives with 6–8 h storing time, while Jo et al. [17] compared the storage stability of sulfur compounds between polyvinyl fluoride and polyester aluminum at five initial concentrations. For canister sampling, the loss of methanethiol because of humidity [19] and coating age [16] were also reported. However, these evaluation experiments were conducted over a decade ago with focus on the storage stabilities in several materials; the comparison between various bags and canisters was limited, especially in field observation comparison. Furthermore, the humidity and matrix artifacts in ambient air or industrial exhaust gas can interfere with the accurate measurement of VSCs through competitive adsorption and chemical reactions [19,22,23], yet their effects remain a significant gap in prior research.
VSCs in the atmosphere could be emitted from both natural [24,25,26] and anthropogenic sources [27,28]. For example, ocean emissions are the largest global source of DMS [24,29], while subtropical forest soils can also release certain amounts of DMS and DMDS through land–atmosphere exchange [26]. Besides natural sources, anthropogenic sources such as fossil fuel combustion [27,30], landfill operations [22,31], wastewater treatment [32], and industrial activities [33,34] could also emit a large amount of VSCs, especially in developed regions. For instance, malodorous incidents caused by VSCs like methanethiol and ethanethiol emitted from the rubber products industry and paper manufacturing industry are frequently reported [34,35]. In recent years, emerging industries such as the power battery recycling sector have experienced rapid development, yet greater efforts are needed to assess and control the environmental and health impacts of their emissions [36,37,38]. According to statistics, the volume of recycled power batteries in China exceeded 300,000 tons in 2024, and it is projected that the domestic market scale for power battery recycling will double by 2030 due to the coming of a large-scale battery retirement phase [39]. The battery recycling process may generate a series of pollutants, such as particulate matter, heavy metals, sulfuric acid mist, SO2, VOCs, and potentially VSCs [40]. Incidents of odor nuisance caused by power battery recycling plants have already been reported, but the contribution and characteristics of VSCs in these cases have not yet been documented.
To address these gaps, this study comprehensively evaluates the performance of six types of sampling bags and canisters for measuring VSCs. We assess blank background levels, storage stability under controlled and field conditions, and the influence of relative humidity. Furthermore, the selected methods are applied to quantify VSCs emissions across different workshops and stacks of the power battery recycling industry. Our findings aim to provide practical guidance for selecting appropriate sampling methods and to support accurate VSCs monitoring in atmospheric pollution prevention and control.

2. Materials and Methods

2.1. Information on Sampling Materials

In this study, six types of sampling bags made of different materials were evaluated and compared with canisters (Table 1). PET, AL, FEP, and PVF bags, made of polyethylene glycol terephthalate, aluminum foil composite film, fluorinated ethylene propylene, and polyvinyl fluoride, respectively, were commonly used for sampling of odor pollutants and volatile organic compounds (VOCs) in atmospheric studies [41]. Therefore, these four types of sampling bags were purchased from three different manufacturers to evaluate their performance in VSCs measurement. The other two types of bags developed in recent years, namely polyvinylidene fluoride (PVDF) and polychlorotrifluoroethylene (PCTFE) bags, were also purchased for comparative evaluation. Due to the excellent passivation treatment of its inner surface, canisters exhibit exceptional chemical inertness and extended sample stability, making them the “gold standard” method for VOC sampling and analysis in both ambient air and emission source studies [42,43]. Hence, this study selected the canister method as the benchmark to further evaluate the analytical performance of these sampling bags for VSCs measurement through comparative analysis. To ensure reliability, three to five sampling bags or canisters from each manufacturer were used for evaluation. The performance of glass bulbs for VSCs analysis was not evaluated in this study due to their fragility and unsuitability for field transport, which should be addressed in future research.

2.2. Experimental Scheme

It has been found that a non-negligible background is a problematic issue for VOCs analysis in previous studies, especially when sampling bags are used [14,18,44]. Hence, background experiments were also performed for VSCs analysis in this study to identify potential baseline contamination. Before the experiments, the sampling bags were repeatedly flushed with high-purity nitrogen (99.999%) and evacuated using a pump (MZ 2 NT, Vacuubrand, Wertheim, Germany). The cleaning cycle of each sampling bag was at least ten times. The canisters were also cleaned at least four times by repeated filling and evacuating with high-purity nitrogen using the Canister-Cleaning-Systems (3100D, Entech Instruments Inc., Simi Vally, CA, USA). After the cleaning procedure, all vacuumed bags and canisters were refilled with high-purity nitrogen and then analyzed by the same methods as the field samples to check their blank background.
Diluted VSCs standard gases (10 ppbv) were introduced into each sampling bag for stability experiments. After storage periods of 1 h, 4 h, 8 h, and 24 h, respectively, the detected concentrations of VSCs in the bags were analyzed by GC-MS and compared with the initial diluted concentrations. To evaluate long-term storage performance, the stability testing of VSCs standard gases in the canisters was extended to 1 h, 4 h, 8 h, 24 h, 2 days, 4 days, and 7 days. All experiments were repeated at least three times.
Finally, sampling bags and canisters with high stability were selected for analyzing VSCs in exhaust emissions from the power battery recycling industry to validate their reliability in practical atmospheric monitoring applications. Prior to sampling, the bags were repeatedly purged by the sampling gases four times. Then, the gas samples were introduced into sampling bags through a Vacuum Chamber Gas Sampler (Model 3036, Laoying Co., Ltd., Qingdao, China), with a sampling time of 5 min. For canister sampling, the collection was conducted over a 30–60 min period following the established procedure in our prior work [45]. A total of 27 samples were collected, among which 12 paired sets of bag and canister samples were collected for comparison. These samples were returned to the laboratory for VSCs analysis within 8 h for bags samples and 1 day for canister samples, respectively.

2.3. Volatile Organosulfur Compounds Analysis

The VSCs standard gases and samples were analyzed with a Model 7200 Preconcentrator (Entech Instrument Inc., Simi Vally, CA, USA) coupled with an Agilent 7890/5977 gas chromatography-mass selective detector/flame ionization detector (GC-MSD/FID, Agilent Technologies, Santa Clara, CA, USA). Detailed analytical steps are described elsewhere [46,47]. Briefly, 250 mL samples were first drawn through a primary trap at −40 °C and a secondary trap at −80 °C in sequence. After trapping, the primary trap was heated to 10 °C to remove the redundant H2O and CO2 through a micro-purge-and-trap step. The secondary trap was then heated to 220 °C, and all target compounds were transferred by helium to a third cryo-focus trap at −180 °C. After the focusing step, the third trap was rapidly heated to 80 °C, and the VSCs were transferred to the GC-MSD/FID system. The mixture was separated by a DB-1 capillary column (60 m × 0.32 mm × 1.0 μm, Agilent Technologies, Santa Clara, CA, USA) and then split into two streams: one directed through a 0.35 m × 0.10 mm empty column to the MSD, and the other through an HP PLOT-Q column (30 m × 0.32 mm × 20.0 μm, Agilent Technologies, Santa Clara, CA, USA) to the FID. The GC oven temperature was initially programmed to be at 10 °C (held for 3 min), then increased to 120 °C at 5 °C/min, and then to 250 °C at 10 °C/min with a final hold time of 20 min. The MSD was operated in scan and selected ion monitoring (SIM) mode, and the ionization method was electron impacting (EI, 70 eV).
Target compounds were identified based on their retention times and mass spectra and quantified by external calibration methods. In the complex field measurements, both quantifier and qualifier ions are monitored simultaneously to ensure accurate identification. The VSCs standard mixtures with nine species (1 ppm, Wuhan Newradar Special Gas Co., Ltd., Wuhan, China) were dynamically diluted to 1, 2, 5, 10, and 20 ppbv, respectively. The calibration curves were obtained by running the five diluted standards, plus the high-purity nitrogen, the same way as the field samples. The correlation coefficients were all larger than 0.99 (Table 2). The measurement precisions for target compounds were all <15%, which were determined by repeated analysis of a standard mixture (5 ppb) seven times. The method detection limits (MDLs) for the target VSCs species ranged from 0.008 to 0.105 ppbv (Table 2). Details of quality assurance and quality control procedures could be found in our previous studies [48,49].

3. Results and Discussion

3.1. Blank Background of Sampling Materials

After cleaning ten times, quantitative results utilizing SIM ions from mass spectrometry revealed that no target VSCs species were detected—or their concentrations were below the MDLs—in blank test samples from six different types of sampling bags. This result is consistent with blank test results from sampling canisters. However, as illustrated in Figures S1–S6 in the Supplementary Materials, the full-scan chromatograms of the sampling bag blanks exhibited numerous peaks, with abundance responses reaching up to 107. In contrast, the canisters’ blank chromatograms showed no significant peaks, indicating that the background contamination level of the sampling bags is considerably higher. It should also be noted that certain interfering compounds co-eluted at or near the retention times of the target VSCs species (dash lines in Figures S1–S6). This suggests that when the total ion chromatogram (TIC) in full-scan mode is used for VSCs quantification in sampling bags, the measured concentrations of VSCs may be overestimated due to the presence of these co-eluted interferences. A similar issue may also arise when other non-selective detectors—such as FID or flame photometric detector (FPD)—are employed for VSCs detection. Therefore, it is recommended to prioritize quantification of VSCs using characteristic ions in SIM mode when sampling bags are used, and blank subtraction should also be applied where necessary. For example, the peak times of methyl ethyl sulfide and ethyl acetate are relatively close, indicating a co-elution effect (Figure S4). However, the quantitative ion (m/z 76) of methyl ethyl sulfide is not found in the characteristic ions of ethyl acetate (m/z 43/61/45/70/88). Therefore, the influence of ethyl acetate co-elution on the quantification of methyl ethyl sulfide is negligible by using m/z 76 as a quantitative ion. In the other complex environment, both quantifier and qualifier ions should also be monitored simultaneously to ensure accurate identification and reduce potential interference from co-eluting compounds.
Among the sampling bags made of different materials (Figures S1–S6), PVF bags exhibited the fewest chromatographic peaks in their blank analyses, with response abundances 1 to 3 orders-of-magnitude lower than those of other bag types. In contrast, aluminum foil bags displayed the highest number of peaks and the greatest response intensities in their blank chromatograms (Figure S2). Previous studies have also reported elevated levels of blank contamination in aluminum foil bags [18]. The blank interferences also varied across different bag materials. According to qualitative results, the primary blank interferences were identified as follows: ethanol, acetone, and 2,2,4,6,6-pentamethyl heptane in PET bags; ethanol, acetone, ethyl acetate, n-octane, 2,2,4,4-tetramethyl octane, and 2,2,4,6,6-penamethyl heptane in aluminum foil bags; ethanol, acetone, and polyfluoroalkanes in FEP bags; ethanol, acetone, and toluene in PVF bags; acetone, cis-2-butene, butanal, methyl ethyl ketone, and tetrachloroethylene in PVDF bags; and ethanol, CFC-113, HCFC-123a, and perfluoroallyl chloride in PCTFE bags. Several sources may potentially contribute to background contaminations of sampling bags, such as polymer additives and residual solvents from manufacturing, and atmospheric contamination due to permeation or handling [14]. In this study, the interferences like polyfluoroalkanes in FEP bags are generally from polymer additives; the oxygenated OVOCs such as ethanol and acetone are probably related to the solvent residual, the interferences of isopentane and n-butane are probably from atmospheric contamination during handing, while the other interferences may be attributable to the bag manufacturing process. The blank interferents from bags with the same material but produced by different manufacturers were also varied (Figures S1–S6). This may be related to differences in membrane materials, valves, production processes, and other factors [18,50]. Following previous studies [51], the concentrations of interferences were semi-quantitatively estimated using toluene as a surrogate standard, and the results showed the following order: canister (0 ppbv) < PVF bags (0.8 ± 0.3 ppbv) < PET bags (7.4 ± 5.3 ppbv) < PVDF bags (19.4 ± 8.5 ppbv) < FEP bags (41.6 ± 6.1 ppbv) < PCTFE bags (93.0 ± 28.7 ppbv) < AL bags (230.3 ± 160.2 ppbv). Applying a stronger vacuum or other cleaning procedures could help minimize or eliminate these contaminants. Nevertheless, 10% of carryover may still be non-negligible in the case of compounds at concentration levels close to the detection limit [14]. In addition, the decontamination procedures may be tedious, time-consuming, and do not always guarantee acceptable reproducibility. Therefore, the best solution appears to be the use of either canisters or PVF sampling bags for the analysis of VSCs in ambient air or source exhaust.

3.2. Stability of Volatile Organosulfur Compounds in Sampling Bags and Canisters

Figure 1 shows the measured stability of VSCs in sampling bags and canisters during different storage times. Following previous studies [41,52], the ratios of measurement results to standard concentrations were calculated to evaluate storage stability. For the PET bags, the average ratios of MeSH, EtSH, DMS, and MES ranged from 0.6 to 0.8 after 1 h storage and deceased with increasing storage time, while the ratios of other VSCs species rapidly decreased to 0.2–0.5 after 1 h storage and remained at relatively stable concentration levels for the next 23 h. This result reveals that the widespread use of PET bag as the sampling material for odor detection could lead to an underestimation of actual odor concentration due to the loss of some VSCs species. For the AL bags (Figure 1), conspicuous losses of VSCs were observed during storage processes. For example, the ratios of the nine VSCs species were all below 0.6, and some were even lower than 0.2 after 1 h storage. Previous studies also observed the initial rapid decrease in VOCs in the AL bags and ascribed it to the strong adsorption between VOCs and the inner wall [41,53]. For the FEP bags, methanethiol (MeSH) and ethanethiol (EtSH) showed good stabilities (ratio > 0.8) while the other VSCs species demonstrated a measurable loss during storage of 8 h. Liu et al. [41] found that VOCs in the FEP bags gradually decreased as the carbon number increased. In this study, the ratios of VSCs in the FEP bags also showed a decreased trend as the molecular weight increased. In contrast, the ratios of most VSCs in the PVF bags ranged from 0.8 to 1.0, indicating stable concentrations of VSCs during 8 h of storage. Meng et al. also reported that the adsorption between reduced sulfide compounds and PVF bags was weaker than FEP bags [21]. Additionally, it should also be note that PVF bag storage could incur losses of disulfide compounds (e.g., DMDS, MEDS), which is likely because disulfide compounds are easily adsorbed onto the inner surface of bag materials [21]. As shown in Figure 1, PVDF bags have good storage stabilities for MeSH, EtSH, DMS, and MES, while the PCTFE bags could only store MeSH and EtSH well during periods of 8 h. For the canister storage experiment, the ratios of all target VSCs were approximately 1.0 during 8 h storage, and these ratios (except MeSH and EtSH) were still greater than 0.9 even after 7 days of storage (Figure 1). Therefore, canisters exhibited the greatest long-term stabilities for VSCs storage in this study, which was consistent with prior works [19,54]. The losses of MeSH and EtSH during storage in canisters may be caused by both physical adsorption and chemical transformation occurring on the inner surface of stainless steel [13,16]. For examples, previous studies have suggested that methanethiol could react on metal surfaces to produce dimethyl disulfide and, in the present of hydrogen sulfide, even dimethyl trisulfide [13,16]. In addition, the error bars in Figure 1 are derived from the standard deviations of over nine repeated tests for each sampling material. The sources of error primarily include variations among sampling containers, dilution errors, GC-MS analytical errors, and other random errors during the storage period. Considering that dilution errors and analytical errors are generally similar throughout the entire experimental period, the smaller standard deviations observed in the test results for PVF bags, FEP bags, and canisters indicate that these sampling materials could offer relatively stable product performance for VSCs detection. Moreover, the error bars of canisters tests suggested the over-estimation of the recoveries of DMDS and MEDS as the storage time increased. This may be related to the chemical generation of DMDS and MEDS within the canisters, which requires further in-depth investigation.
Assuming a required recovery rate of 70–130% for the VSCs analytical method, the allowable ratio for VSCs storage in sampling equipment is at least 0.7. Based on the storage stability results in this study, we summarized the time for which VSCs could be stably stored (ratio ≥ 0.7) in various types of sampling bags and canisters (Table S1). As can be seen, AL bags cannot stably preserve any of the target VSCs. PET, FEP, and PCTFE bags can only stably preserve MeSH and EtSH for 4 h, 4 h, and 8 h, respectively. PVF bags can stably preserve all VSCs except DMDS and MEDS for 8 h, while PVDF bags can stably preserve five species for 8 h. Canisters provide the longest stable storage time for VSCs, up to 7 days. Therefore, we recommend that canister sampling should be the preferred method for VSCs analysis. When bags must be used, PVF bags should be selected, and analysis should be completed within 8 h. Otherwise, samples in PVF bags should be promptly transferred to canisters for storage, and analysis should be completed within 7 days.

3.3. Field Comparison and the Impact of Humidity

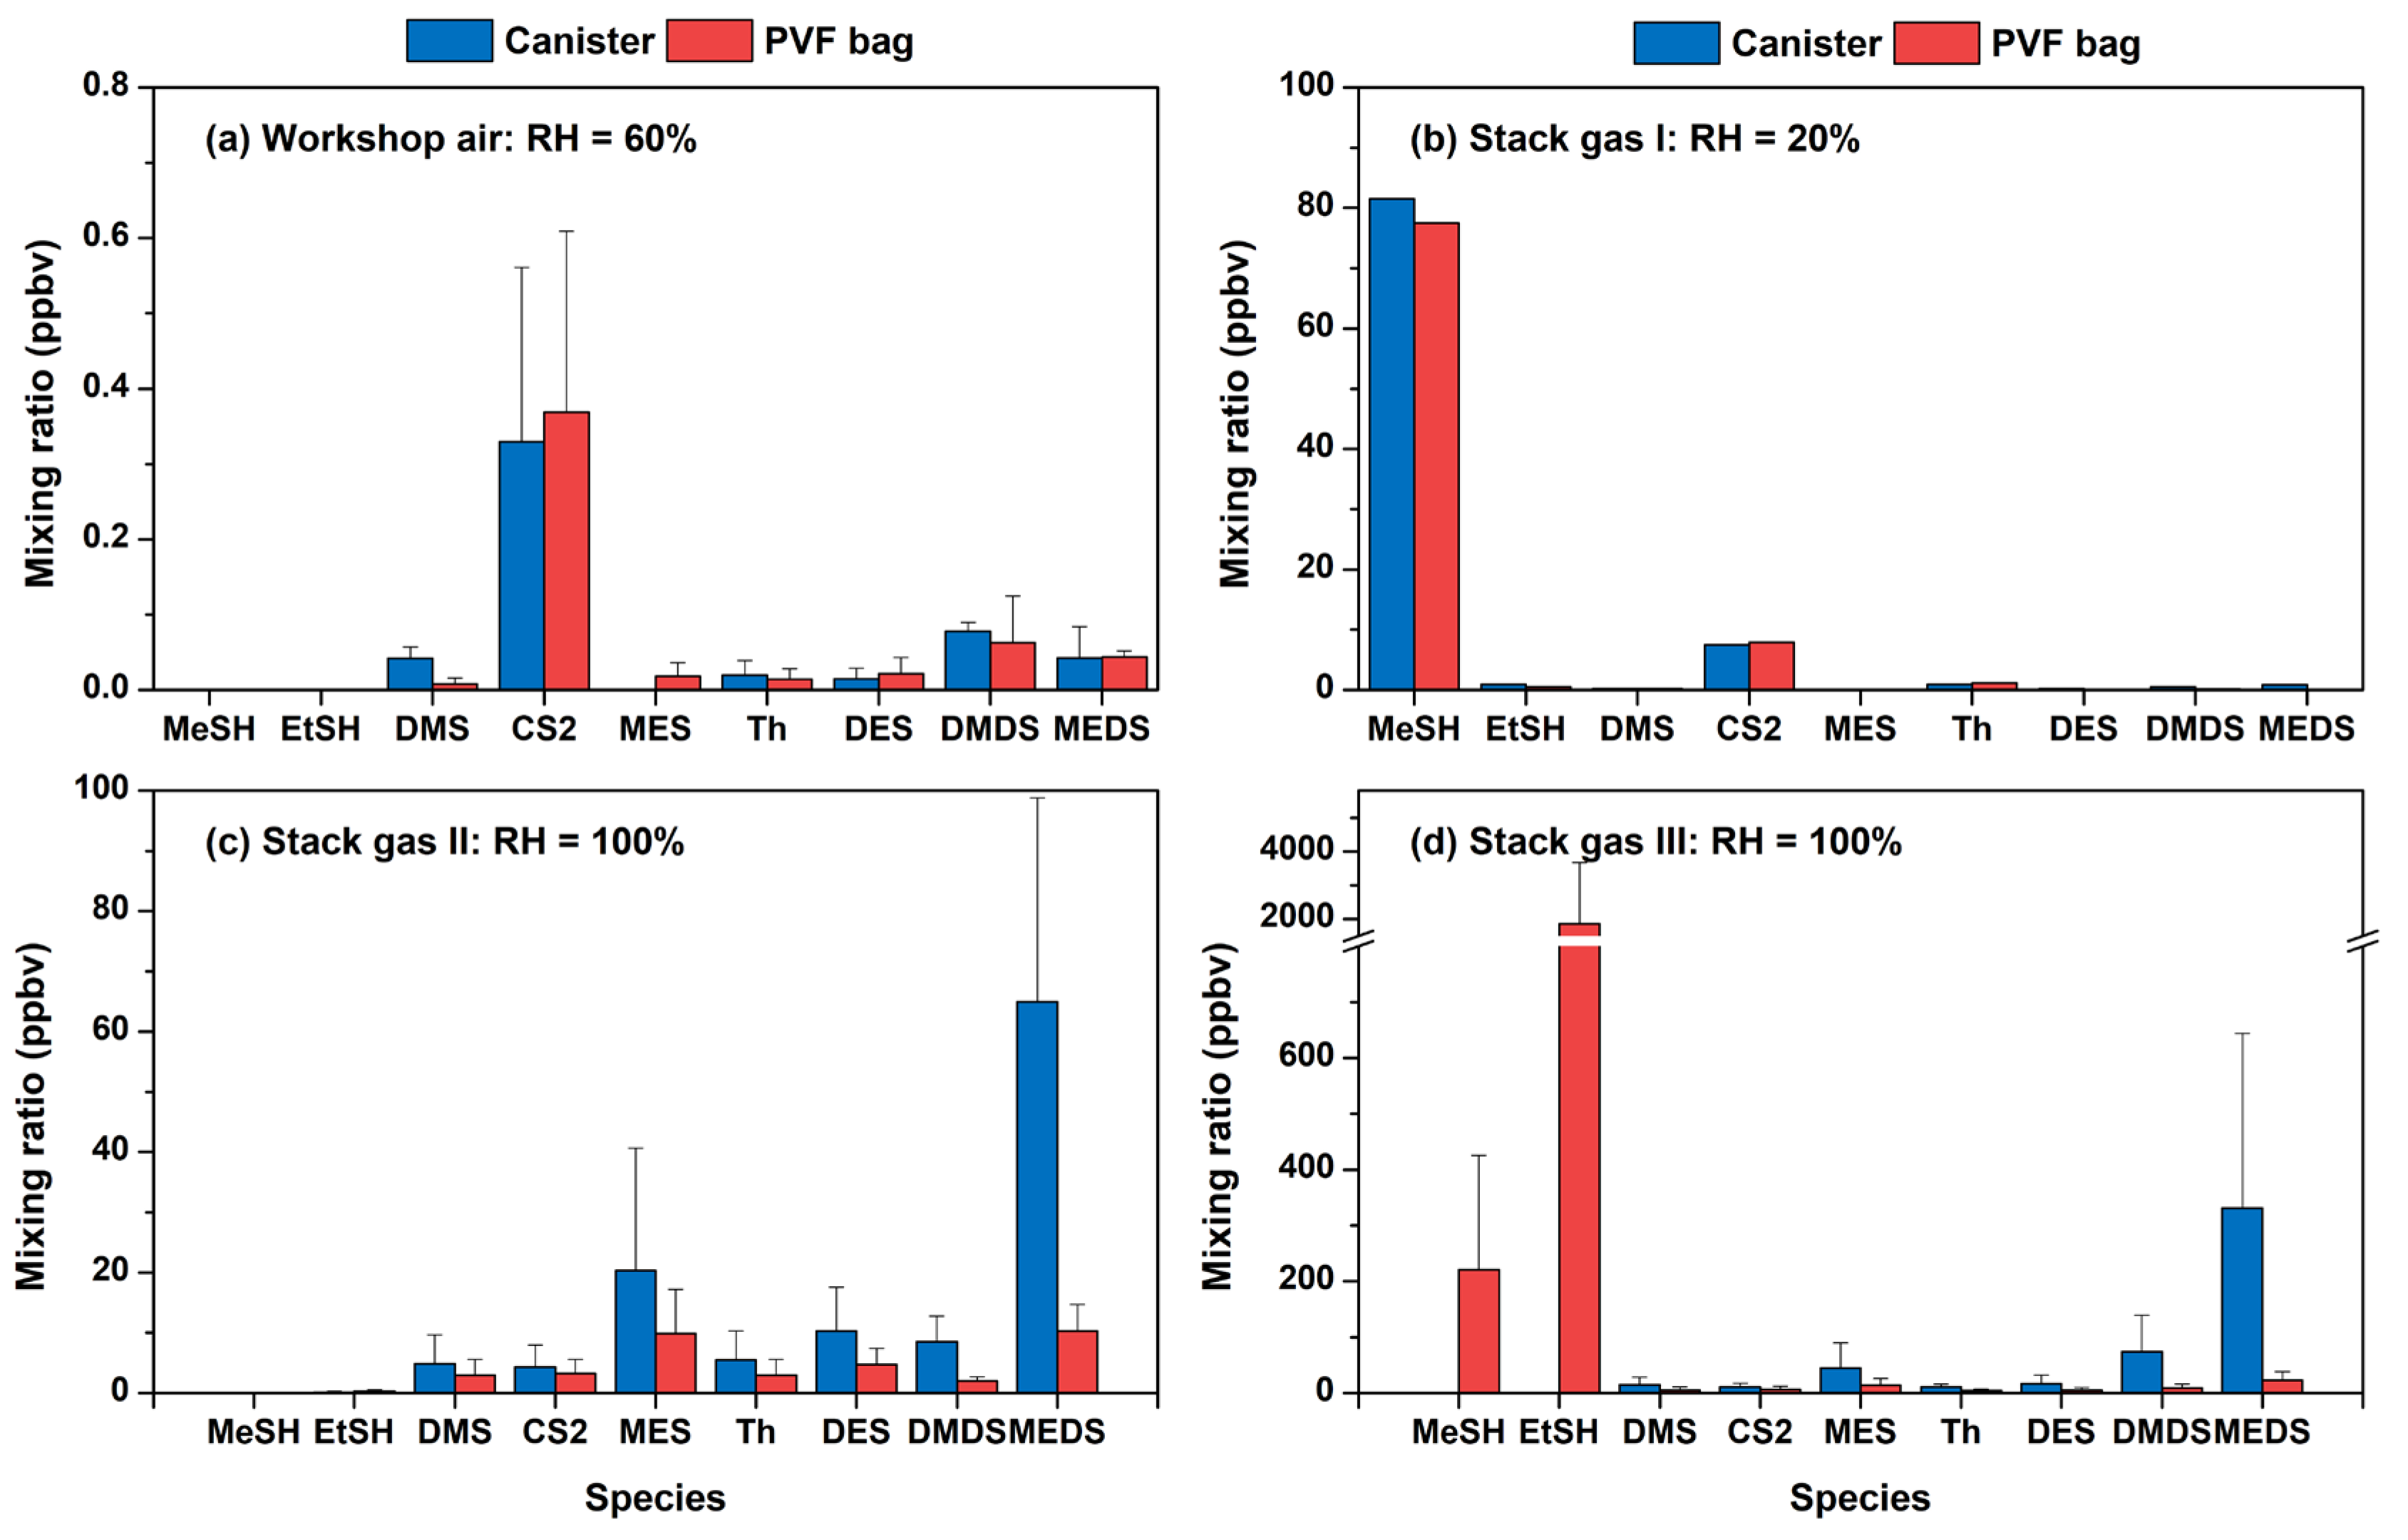
Based on the results of blank tests and stability experiments, PVF bags and canisters were selected for field observation in a power battery recycling factory. As shown in Figure 2 and Table S2, different comparisons results were observed among paired sets of PVF and canister samples collected at various sites. For indoor air of the workshop (Figure 2a), the canister sampling and the PVF bag sampling both reported very low mixing ratios of total VSCs (0.53 ± 0.13 ppbv and 0.54 ± 0.11 ppbv, respectively). In the stack gas at site I (Figure 2b), the VSCs results from the two sampling methods also demonstrated strong agreement. For example, the canister-measured concentration of methanethiol was 81.53 ppbv, while the PVF bag measurement was 77.52 ppbv, indicating a very close match. In stack gas II (Figure 2c), MeSH and EtSH were all very low (<0.3 ppbv) in both PVF bags and canisters samples; however, the concentrations of other VSCs in the canisters were 1.3–6.3 times those in the PVF bags. In stack gas III, canister sampling also showed much higher mixing ratios of these VSCs than PVF bag sampling, with concentration ratios ranging from 1.7 to 14.4 (Figure 2d). The faster loss rate in the PVF bags may explain the lower concentrations of these VSCs compared to canisters, particularly at high concentrations [17,21]. As shown in Figure 2d, a more significant discrepancy was observed for MeSH and EtSH: the PVF bags reported 220.87 ± 204.76 ppbv of MeSH and 1863.29 ± 1811.41 ppbv of EtSH, respectively, whereas the canisters reported only 0.38 ± 0.37 ppbv and 0.12 ± 0.13 ppbv, differing by 3 to 4 orders of magnitude. In addition, the error bars in Figure 2 represent the standard deviation of multiple observed concentrations at different sampling points, indicating the dispersion degree of the observed concentrations. The relatively large standard deviations for some VSC (Figure 2) may be primarily attributed to significant concentration fluctuations caused by unstable industrial process conditions, a common phenomenon in pollution source monitoring.
Humidity is a critical factor affecting the sampling and analysis of VSCs [19]. During the field observation, stack I gas was extremely dry, with a relative humidity of only about 20%; whereas stack II and III gases contained significant moisture (relative humidity 100%), even leading to the formation of condensate. Under dry conditions (stack gas I), VSCs analysis agreed well between canisters and PVF bags (Figure 2b). In humid environments (stack gas II and III), however, canisters yielded significantly lower concentrations of MeSH and EtSH, yet higher concentrations of the other VSCs, relative to the PVF bags (Figure 2c,d). A possible reason is that methanethiol or ethanethiol could undergo chemical reactions with water and other substances on metal surfaces, converting into disulfides and other sulfur compounds (personal communications with the canister manufacturers). Previous studies also suggested that methanethiol could react on metal surfaces to produce dimethyl disulfide and, in the present of hydrogen sulfide, even dimethyl trisulfide [13,16,23]. For example, Khan et al. [16] found that DMDS was simultaneously produced in the older generation of the SilcoCan canister with decreasing methanethiol and hydrogen sulfide. In addition, the complex acidic environment, particulate matter, and other impurities in the stack gas may also affect the measurement of VSCs in field observation [18,19,22]. Future experiments on the preservation of individual or several organic sulfur compounds under different complex conditions inside canisters are needed to verify the chemical transformations among these organosulfur compounds. This will allow for a more accurate assessment of the impact of such complex reactions on the analysis of organosulfur mixtures.
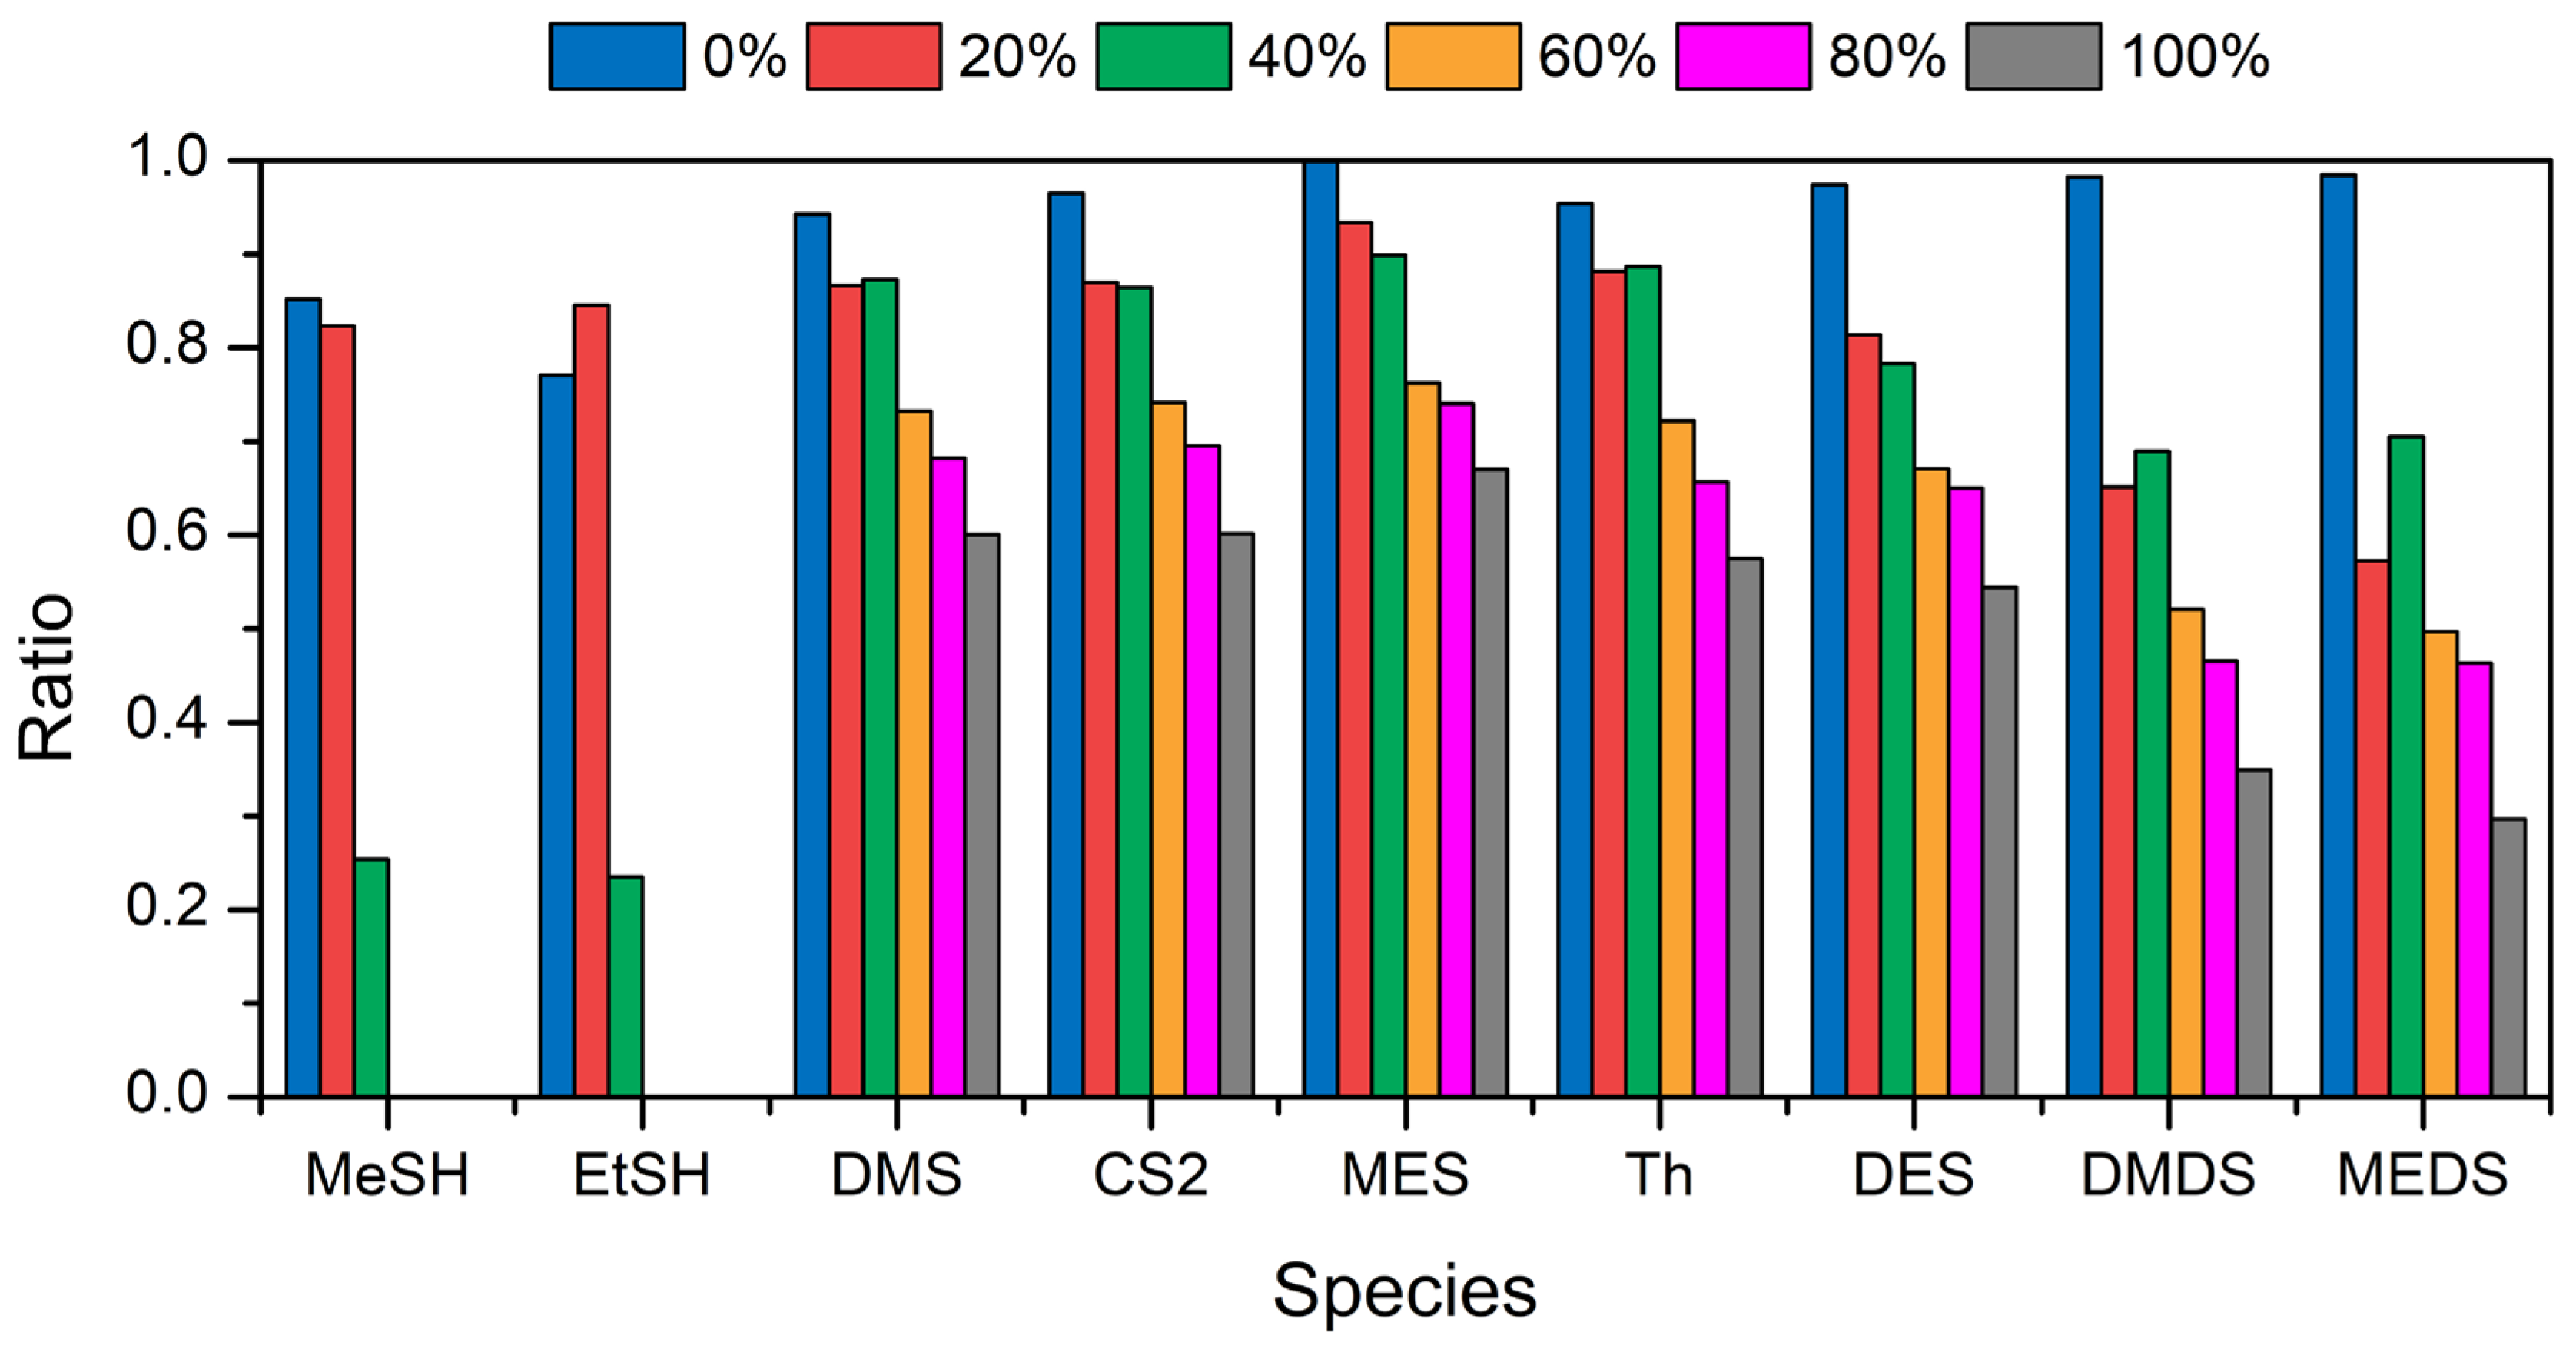
In this study, we further simulated the effects of humidity on VSCs analysis in canisters. Calculated amounts of ultrapure water were introduced into the canisters with the diluted VSCs standard gases (10 ppbv) to obtain VSCs standard samples at different relative humidity (RH) levels (0%, 20%, 40%, 60%, 80%, and 100%). After 1 day’s storage in the canister, these samples were then analyzed by GC-MS, and the variations in VSCs stabilities at different RH are shown in Figure 3. Obviously, the ratios of methanethiol and ethanethiol sharply decreased from 0.8–0.9 at dry condition to 0.2–0.3 at RH of 40%. Furthermore, when the RH was 60–100%, MeSH and EtSH were completely lost and undetectable in the canister, suggesting the significant influence of humidity on MeSH and EtSH storage stabilities. Trabue et al. [19] also found that the introduction of water into canisters resulted in methanethiol’s rapid degradation, with less than 60% recovered after 4 h. This could explain the field observation (Figure 2d) that at 100% relative humidity, very high concentrations of MeSH and EtSH were detected with the PVF bags, whereas the canister method showed particularly low or even non-detectable levels of these compounds. For the other VSCs, the storage stabilities generally decreased with the increased humidities in canisters (Figure 3). For example, when the RH was above 60%, the ratios of VSCs were below 0.7. Therefore, drying of humid air is necessary for VSCs sampling and storage. The effect of humidity at different concentration levels and more efficient water removal techniques should be studied and developed in future research.

3.4. VSCs Emissions from Power Battery Recycling Industry

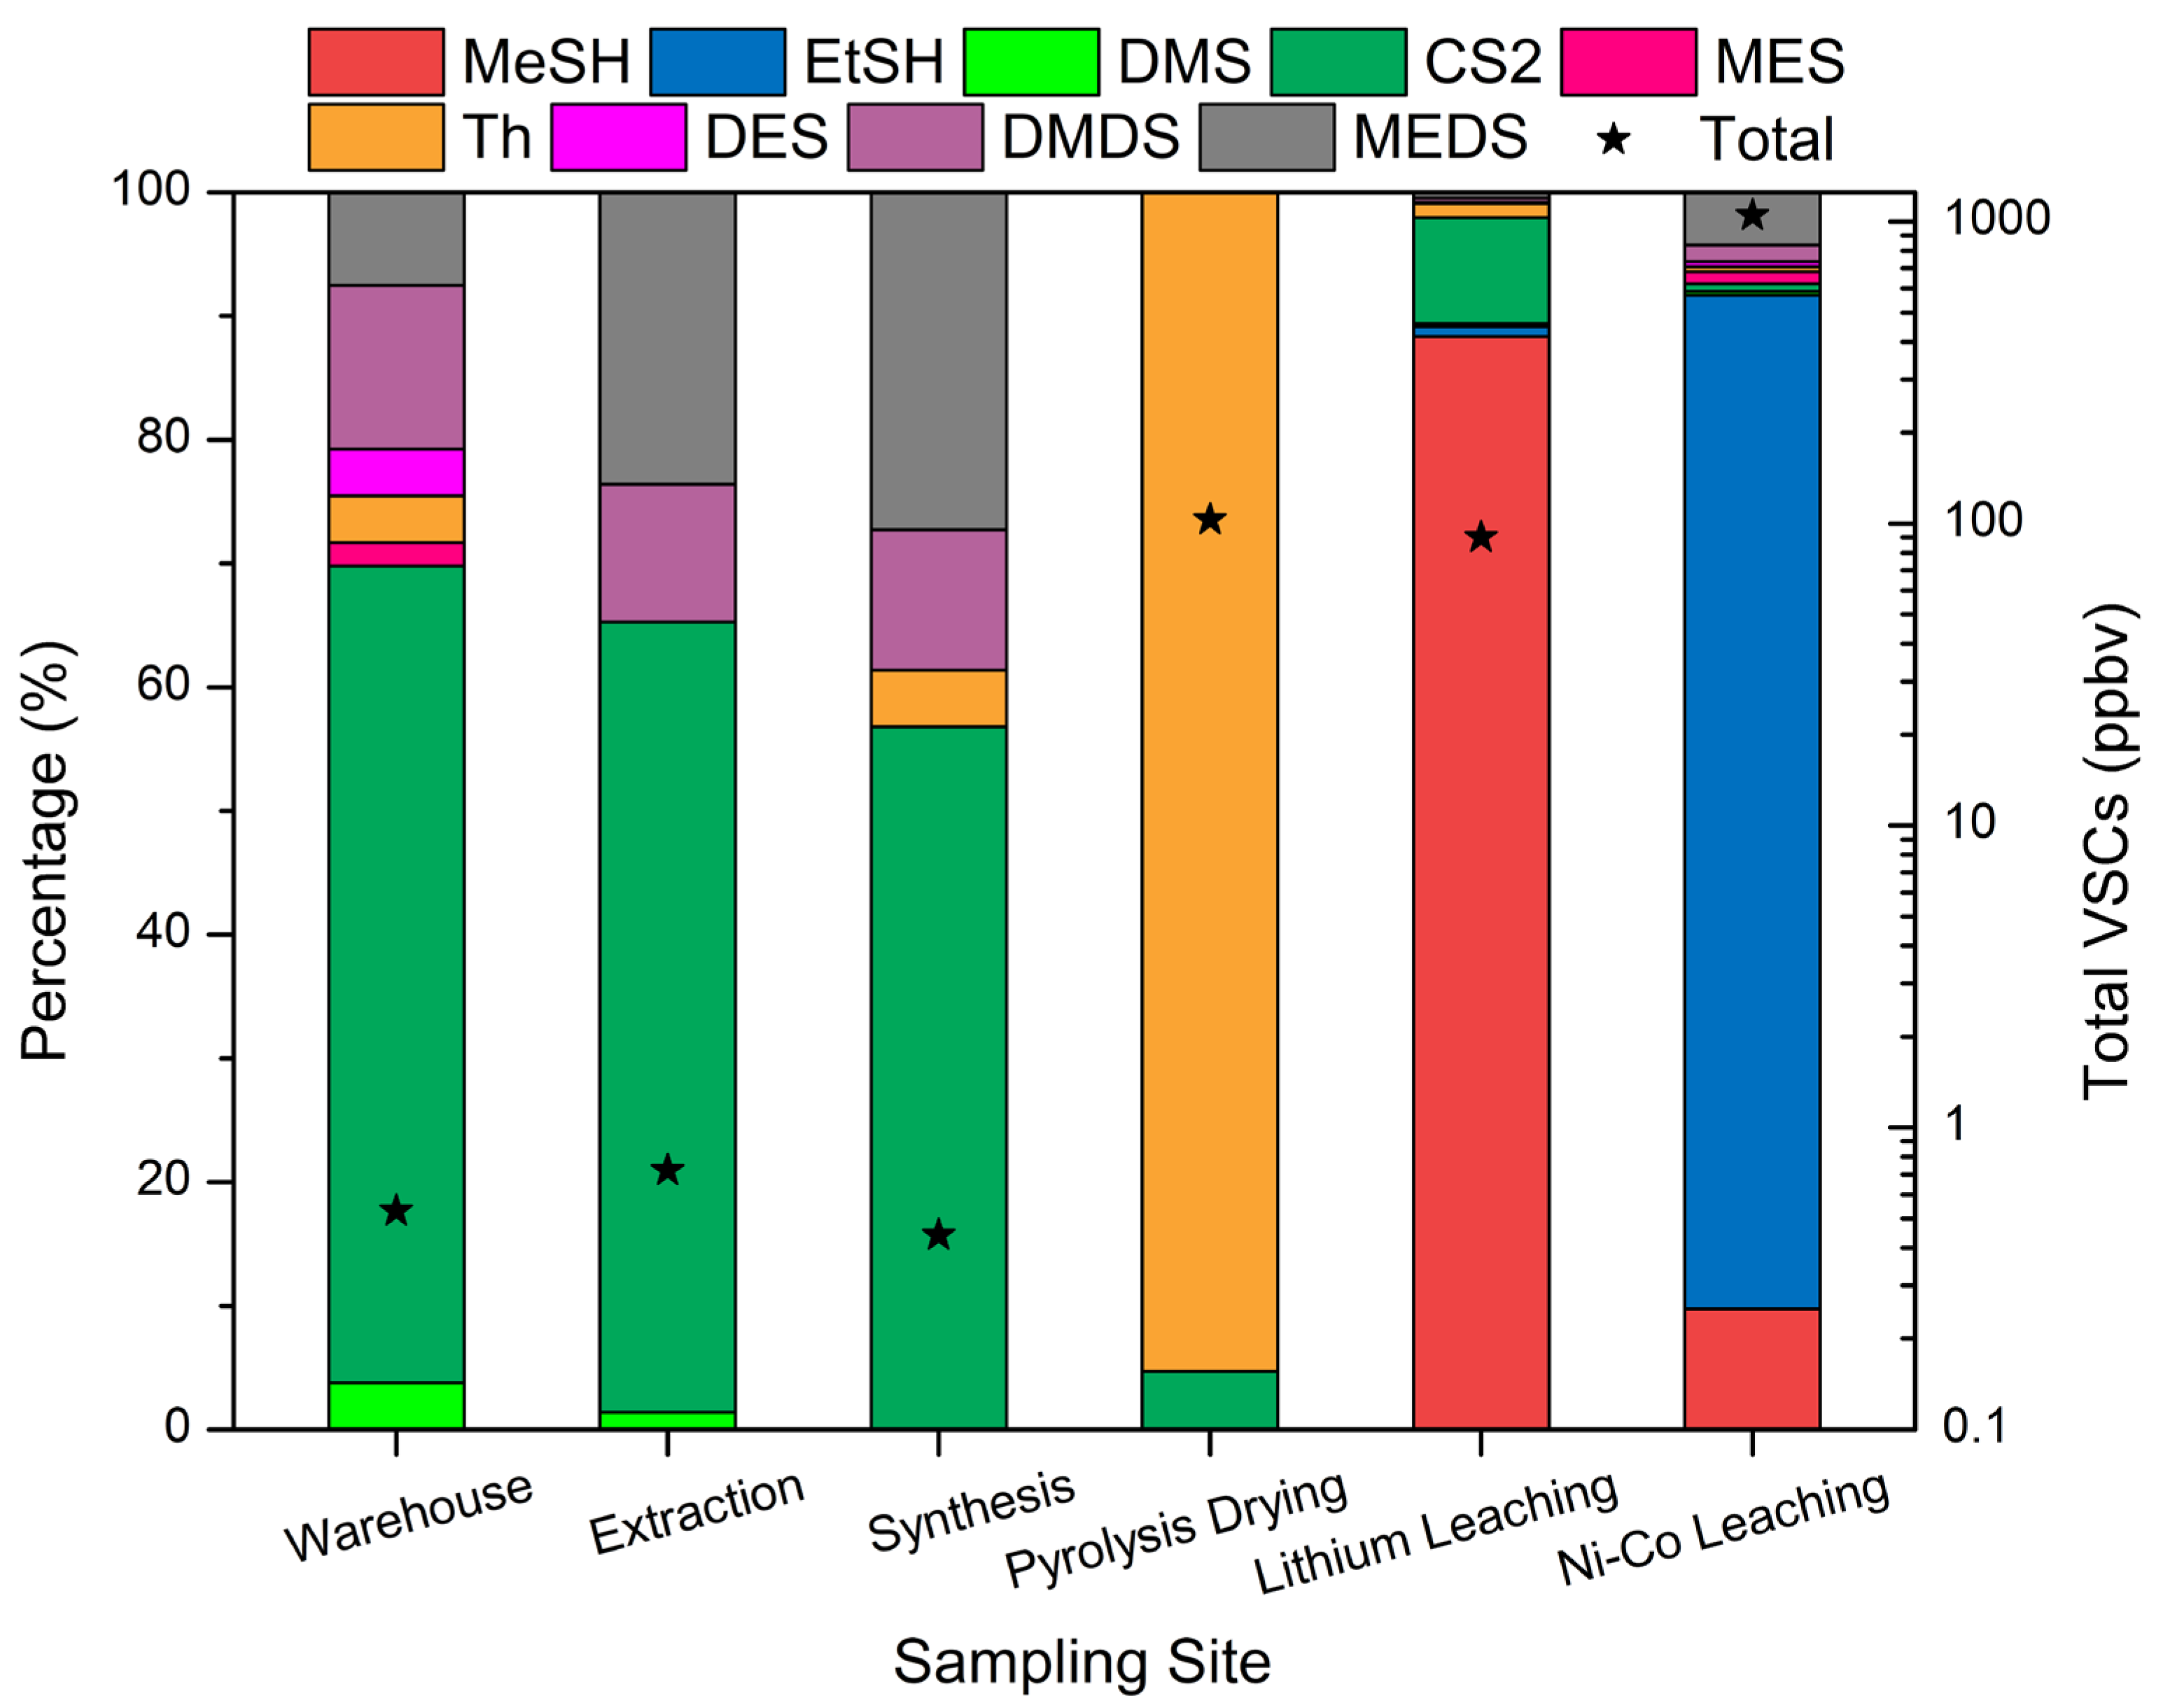
The averaged concentrations and compositions of VSCs measured at various sampling sites of a power battery recycling factory are illustrated in Table 3 and Figure 4. VSCs measurement results from PVF bags were used here, which may represent the low values of actual emission concentrations. In the workshops of warehouse, extraction, and synthesis, the total mixing ratios of VSCs were all very low (<1 ppbv). However, the concentrations of VSCs in the organized emissions from the pyrolysis drying, lithium leaching, and nickel–cobalt leaching processes were exceptionally high, recorded at 102.96 ppb, 90.01 ppb, and 1046.86 ppb, respectively (Table 3). Given that these VSCs are odorous substances with generally low odor thresholds [3], such high concentrations of VSCs released into the atmosphere can easily lead to odor pollution in the surrounding areas or downwind regions of the facility. Therefore, it is imperative to enhance the control and treatment of VSCs in organized emissions from these processes in the power battery recycling industry.
Different characteristics of VSCs were also found among these stack gases (Figure 4), which may be useful for pollution source identification. In the stack gas of pyrolysis drying process, thiophene was the overwhelmingly dominant compound with a contribution of 95.3%, while in the stack gas of lithium leaching, methanethiol was the most abundant species and contributed up to 88.3%. For the Ni-Co leaching stack gas, ethanethiol showed the largest contribution, followed by methanethiol and methyl ethyl disulfide. In addition, the concentrations of VSCs in Ni-Co leaching exhaust gas exhibited a wide range of variation, with total VSCs mixing ratios ranging from 19.76 ppb to 4313.04 ppb. This indicated that the generation of VSCs may be intermittent and unstable during the production process. Therefore, continuous online monitoring systems would be more effective for accurately assessing VSCs emission in the power battery recycling industry.

4. Conclusions

This study systematically evaluated the performance of various sampling materials for volatile organosulfur compounds (VSCs) measurement and investigated VSCs emissions from the power battery recycling industry. The results demonstrated that canisters provide optimal stability for long-term (≤7 days) VSCs preservation, while PVF bags serve as a practical alternative for short-term (≤8 h) sampling under dry conditions. High relative humidity was found to significantly degrade light VSCs in canisters, particularly methanethiol and ethanethiol, highlighting the necessity of developing effective drying protocols. Field application revealed substantial VSCs emissions and distinct compositional profiles from power battery recycling processes, with Ni-Co leaching showing the highest concentrations exceeding 1000 ppb. For future research on VSCs analysis methods, efforts should focus on (1) developing efficient water removal techniques that minimize VSCs loss during sampling, (2) elucidating the transformation pathways and mechanisms of VSCs under complex industrial matrix conditions, and (3) establishing standardized sampling and analysis protocols for emerging industrial sources including online monitoring system. Additionally, further investigation is needed to understand the seasonal and operational variations in VSCs emissions from power battery recycling facilities. These steps are crucial for developing accurate emission inventories and formulating effective odor control strategies for the rapidly growing renewable energy sector.

Supplementary Materials

The following supporting information can be downloaded at: https://www.mdpi.com/article/10.3390/atmos16121341/s1, Table S1: Stable storage time for VSCs in different sampling bags and canisters; Table S2: Comparisons of VSCs mixing ratios (ppbv) by canister and PVF sampling during field observation (data of Figure 2); Figure S1: Total ion chromatograms and top five peaks of blank backgrounds from PET bags. The information of manufacturers is in the footnotes of Table 1, and the dashed lines show the retention times of target VSCs species in Table 2; Figure S2: The same as Figure S1 but from AL bags; Figure S3: The same as Figure S1 but from FEP bags; Figure S4: The same as Figure S1 but from PVF bags; Figure S5: The same as Figure S1 but from PVDF bags and PCTFE bags; Figure S6: The same as Figure S1 but from canisters.

Author Contributions

Conceptualization, Z.Z. and X.W.; methodology, Z.O., T.F. and S.L.; writing—original draft preparation, T.F. and Z.Z.; writing—review and editing, Z.Z., Y.Z. and X.W.; funding acquisition, X.W., Z.Z. and S.L. All authors have read and agreed to the published version of the manuscript.

Funding

This research was funded by the Department of Science and Technology of Guangdong (No. 2023B0303000007), the Guangzhou Municipal Science and Technology Bureau (No. 202206010057), the Guangdong Foundation for Program of Science and Technology (2023B1212060049), National Natural Science Foundation of China (42207135), and Hunan Provincial Natural Science Foundation (2023JJ40361).

Institutional Review Board Statement

Not applicable.

Informed Consent Statement

Not applicable.

Data Availability Statement

The data presented in this study are available on request from the corresponding author. The data are not publicly available due to the internal policy of the university.

Conflicts of Interest

The authors declare no conflicts of interest.

References

  1. Chin, M.; Davis, D.D. Global sources and sinks of OCS and CS2 and their distributions. Glob. Biogeochem. Cycle 1993, 7, 321–337. [Google Scholar] [CrossRef]
  2. Charlson, R.J.; Lovelock, J.E.; Andreae, M.O.; Warren, S.G. Oceanic phytoplankton, atmospheric sulphur, cloud albedo and climate. Nature 1987, 326, 655–661. [Google Scholar] [CrossRef]
  3. Susaya, J.; Kim, K.-H.; Phan, N.-T.; Kim, J.-C. Assessment of reduced sulfur compounds in ambient air as malodor components in an urban area. Atmos. Environ. 2011, 45, 3381–3390. [Google Scholar] [CrossRef]
  4. Leonardos, G.; Sullivan, F.; Levine, S.P.; Stordeur, R.T.; Harvey, T.M.; Schuetzle, D. A Comparison of Polymer Adsorbent and Bag Sampling Techniques for Paint Bake Oven Odorous Emissions. J. Air Pollut. Control Assoc. 1980, 30, 22–29. [Google Scholar] [CrossRef]
  5. Hellman, T.M.; Small, F.H. Characterization of the Odor Properties of 101 Petrochemicals Using Sensory Methods. J. Air Pollut. Control Assoc. 1974, 24, 979–982. [Google Scholar] [CrossRef]
  6. Wohl, C.; Villamayor, J.; Galí, M.; Mahajan, A.S.; Fernández, R.P.; Cuevas, C.A.; Bossolasco, A.; Li, Q.; Kettle, A.J.; Williams, T.; et al. Marine emissions of methanethiol increase aerosol cooling in the Southern Ocean. Sci. Adv. 2024, 10, eadq2465. [Google Scholar] [CrossRef] [PubMed]
  7. Jacob, L.S.D.; Giorio, C.; Archibald, A.T. Extension, development, and evaluation of the representation of the OH-initiated dimethyl sulfide (DMS) oxidation mechanism in the Master Chemical Mechanism (MCM) v3.3.1 framework. Atmos. Chem. Phys. 2024, 24, 3329–3347. [Google Scholar] [CrossRef]
  8. Barnes, I.; Hjorth, J.; Mihalopoulos, N. Dimethyl Sulfide and Dimethyl Sulfoxide and Their Oxidation in the Atmosphere. Chem. Rev. 2006, 106, 940–975. [Google Scholar] [CrossRef]
  9. Pandey, S.K.; Kim, K.-H. A Review of Methods for the Determination of Reduced Sulfur Compounds (RSCs) in Air. Environ. Sci. Technol. 2009, 43, 3020–3029. [Google Scholar] [CrossRef]
  10. Kim, K.-H. Some Insights into the Gas Chromatographic Determination of Reduced Sulfur Compounds (RSCs) in Air. Environ. Sci. Technol. 2005, 39, 6765–6769. [Google Scholar] [CrossRef]
  11. Polvara, E.; Gallego, E.; Invernizzi, M.; Perales, J.F.; Sironi, S. Chemical characterization of odorous emissions: A comparative performance study of different sampling methods. Talanta 2023, 253, 124110. [Google Scholar] [CrossRef]
  12. Wang, Z.; Huang, Z.; Zhang, H.; Zhang, Y.; Wang, X. High time resolution online detection of reduced sulfur compounds (RSCs) in ambient air in Guangzhou by proton transfer reaction time-of-flight mass spectrometry ( PTR-ToF-MS). Environ. Chem. 2018, 37, 2425–2432. [Google Scholar]
  13. Perraud, V.; Meinardi, S.; Blake, D.R.; Finlayson-Pitts, B.J. Challenges associated with the sampling and analysis of organosulfur compounds in air using real-time PTR-ToF-MS and offline GC-FID. Atmos. Meas. Tech. 2016, 9, 1325–1340. [Google Scholar] [CrossRef]
  14. Ghimenti, S.; Lomonaco, T.; Bellagambi, F.G.; Tabucchi, S.; Onor, M.; Trivella, M.G.; Ceccarini, A.; Fuoco, R.; Di Francesco, F. Comparison of sampling bags for the analysis of volatile organic compounds in breath. J. Breath Res. 2015, 9, 047110. [Google Scholar] [CrossRef]
  15. Li, X.; Sun, Q.; Yu, L.; Wang, X.; Feng, L.; Wang, K. Influence of Field Sampling Methods on Measuring Volatile Organic Compounds in a Swine Facility Using SUMMA Canisters. Atmosphere 2024, 15, 1021. [Google Scholar] [CrossRef]
  16. Khan, M.A.H.; Whelan, M.E.; Rhew, R.C. Analysis of low concentration reduced sulfur compounds (RSCs) in air: Storage issues and measurement by gas chromatography with sulfur chemiluminescence detection. Talanta 2012, 88, 581–586. [Google Scholar] [CrossRef]
  17. Jo, S.-H.; Kim, K.-H.; Shon, Z.-H.; Parker, D. Identification of control parameters for the sulfur gas storability with bag sampling methods. Anal. Chim. Acta 2012, 738, 51–58. [Google Scholar] [CrossRef]
  18. Mochalski, P.; Wzorek, B.; Śliwka, I.; Amann, A. Suitability of different polymer bags for storage of volatile sulphur compounds relevant to breath analysis. J. Chromatogr. B 2009, 877, 189–196. [Google Scholar] [CrossRef]
  19. Trabue, S.; Scoggin, K.; Mitloehner, F.; Li, H.; Burns, R.; Xin, H. Field sampling method for quantifying volatile sulfur compounds from animal feeding operations. Atmos. Environ. 2008, 42, 3332–3341. [Google Scholar] [CrossRef]
  20. Sulyok, M.; Haberhauer-Troyer, C.; Rosenberg, E.; Grasserbauer, M. Investigation of the storage stability of selected volatile sulfur compounds in different sampling containers. J. Chromatogr. A 2001, 917, 367–374. [Google Scholar] [CrossRef]
  21. Meng, J.; Zhai, Z.; Liu, Y.; Zhang, J.; Han, M. Influence factors and mechanism study on bag sampling method for determination of reduced sulfide compound by gas chromaography-mass spectrometry. Rock Miner. Anal. 2019, 38, 179–185. [Google Scholar] [CrossRef]
  22. Borrás, E.; Tortajada-Genaro, L.A.; Muñoz, A. Determination of reduced sulfur compounds in air samples for the monitoring of malodor caused by landfills. Talanta 2016, 148, 472–477. [Google Scholar] [CrossRef] [PubMed]
  23. Andersen, K.B.; Hansen, M.J.; Feilberg, A. Minimisation of artefact formation of dimethyl disulphide during sampling and analysis of methanethiol in air using solid sorbent materials. J. Chromatogr. A 2012, 1245, 24–31. [Google Scholar] [CrossRef] [PubMed]
  24. Xu, F.; Zhang, H.-H.; Zhong, X.-S.; Yan, S.-B.; Zhang, J.-W.; Yang, G.-P.; Ma, X.; Chen, Z.-H. Revealing the Marine Cycles of Volatile Sulfur Compounds and Their Biogeochemical Controls: A Case of the Western North Pacific. Environ. Sci. Technol. 2024, 58, 3235–3245. [Google Scholar] [CrossRef] [PubMed]
  25. Lehnert, A.-S.; Cooper, R.E.; Ignatz, R.; Ruecker, A.; Gomes-Alves, E.; Küsel, K.; Pohnert, G.; Trumbore, S.E. Dimethyl Sulfide Emissions From a Peatland Result More From Organic Matter Degradation Than Sulfate Reduction. J. Geophys. Res. Biogeosciences 2024, 129, e2023JG007449. [Google Scholar] [CrossRef]
  26. Yi, Z.G.; Wang, X.M.; Ouyang, M.G.; Zhang, D.Q.; Zhou, G.Y. Air-soil exchange of dimethyl sulfide, carbon disulfide, and dimethyl disulfide in three subtropical forests in south China. J. Geophys. Res. Atmos. 2010, 115, D18302. [Google Scholar] [CrossRef]
  27. Lee, C.-L.; Brimblecombe, P. Anthropogenic contributions to global carbonyl sulfide, carbon disulfide and organosulfides fluxes. Earth Sci. Rev. 2016, 160, 1–18. [Google Scholar] [CrossRef]
  28. Guo, H.; Simpson, I.J.; Ding, A.J.; Wang, T.; Saunders, S.M.; Wang, T.J.; Cheng, H.R.; Barletta, B.; Meinardi, S.; Blake, D.R.; et al. Carbonyl sulfide, dimethyl sulfide and carbon disulfide in the Pearl River Delta of southern China: Impact of anthropogenic and biogenic sources. Atmos. Environ. 2010, 44, 3805–3813. [Google Scholar] [CrossRef]
  29. Andreae, M.O.; Raemdonck, H. Dimethyl Sulfide in the Surface Ocean and the Marine Atmosphere: A Global View. Science 1983, 221, 744–747. [Google Scholar] [CrossRef]
  30. Yan, Y.; Li, R.; Peng, L.; Yang, C.; Liu, C.; Cao, J.; Yang, F.; Li, Y.; Wu, J. Emission inventory of carbonyl sulfide (COS) from primary anthropogenic sources in China. Environ. Pollut. 2019, 247, 745–751. [Google Scholar] [CrossRef]
  31. Zou, S.C.; Lee, S.C.; Chan, C.Y.; Ho, K.F.; Wang, X.M.; Chan, L.Y.; Zhang, Z.X. Characterization of ambient volatile organic compounds at a landfill site in Guangzhou, South China. Chemosphere 2003, 51, 1015–1022. [Google Scholar] [CrossRef] [PubMed]
  32. Ma, L.; Zhao, R.; Li, J.; Yang, Q.; Zou, K. Release characteristics and risk assessment of volatile sulfur compounds in municipal wastewater treatment plants. Environ. Pollut. 2024, 350, 123946. [Google Scholar] [CrossRef]
  33. Jongebloed, U.A.; Chalif, J.I.; Tashmim, L.; Porter, W.C.; Bates, K.H.; Chen, Q.; Osterberg, E.C.; Koffman, B.G.; Cole-Dai, J.; Winski, D.A.; et al. Dimethyl sulfide chemistry over the industrial era: Comparison of key oxidation mechanisms and long-term observations. Atmos. Chem. Phys. 2025, 25, 4083–4106. [Google Scholar] [CrossRef]
  34. Han, B.; Liu, Y.-t.; Wu, J.-h.; Feng, Y.-c. Characterization of industrial odor sources in Binhai New Area of Tianjin, China. Environ. Sci. Pollut. Res. 2018, 25, 14006–14017. [Google Scholar] [CrossRef]
  35. Han, B.; Wu, J.; Wang, F.; Zuo, M.; Feng, Y. Characterization of industrial odor sources. China Environ. Sci. 2013, 33, 416–422. [Google Scholar]
  36. Zhou, Y.; Cui, X.-D.; Lin, A.-J.; Dong, Y.; Duan, G.-L. Environmental life cycle assessment on the recycling processes of power batteries for new energy vehicles. J. Clean. Prod. 2025, 488, 144641. [Google Scholar] [CrossRef]
  37. Sun, J.; Peng, Q.; Peng, Z.; Qu, L.; Zhang, Z.; Liu, W.; Ho, S.S.H. Ambient volatile organic compounds in a typical industrial city in southern China: Impacts of aromatic hydrocarbons from new industry. Sci. Total Environ. 2024, 954, 176424. [Google Scholar] [CrossRef] [PubMed]
  38. Harper, G.; Sommerville, R.; Kendrick, E.; Driscoll, L.; Slater, P.; Stolkin, R.; Walton, A.; Christensen, P.; Heidrich, O.; Lambert, S.; et al. Recycling lithium-ion batteries from electric vehicles. Nature 2019, 575, 75–86. [Google Scholar] [CrossRef]
  39. Duan, X.; Zhu, W.; Ruan, Z.; Xie, M.; Chen, J.; Ren, X. Recycling of Lithium Batteries—A Review. Energies 2022, 15, 1611. [Google Scholar] [CrossRef]
  40. Liu, X.; Zhang, J.; Wei, Z.; Yang, L.; Dai, W.; Luo, F.; Wang, C.; Zhou, L. Emission characteristics of gaseous pollutants from typical retired lithium battery recycling enterprises. J. Chem. Eng. Chin. Univ. 2023, 37, 989–997. [Google Scholar]
  41. Liu, Z.; Liu, C.; He, Z.; Mu, Y.; Zhang, C.; Zhang, Y.; Liu, P.; Wang, Y.; Liu, J. Evaluation of offline sampling for atmospheric C3-C11 non-methane hydrocarbons. J. Environ. Sci. 2022, 113, 132–140. [Google Scholar] [CrossRef]
  42. Wang, G.; Zhao, N.; Zhang, H.; Li, G.; Xin, G. Spatiotemporal Distributions of Ambient Volatile Organic Compounds in China: Characteristics and Sources. Aerosol Air Qual. Res. 2022, 22, 210379. [Google Scholar] [CrossRef]
  43. Colman, J.J.; Swanson, A.L.; Meinardi, S.; Sive, B.C.; Blake, D.R.; Rowland, F.S. Description of the Analysis of a Wide Range of Volatile Organic Compounds in Whole Air Samples Collected during PEM-Tropics A and B. Anal. Chem. 2001, 73, 3723–3731. [Google Scholar] [CrossRef]
  44. Trabue, S.L.; Anhalt, J.C.; Zahn, J.A. Bias of Tedlar Bags in the Measurement of Agricultural Odorants. J. Environ. Qual. 2006, 35, 1668–1677. [Google Scholar] [CrossRef]
  45. Zhang, Z.; Zhang, Y.; Zou, L.; Ou, Z.; Luo, D.; Liu, Z.; Huang, Z.; Fei, L.; Wang, X. Intermediate-volatility aromatic hydrocarbons from the rubber products industry in China. Sci. Total Environ. 2023, 898, 165583. [Google Scholar] [CrossRef]
  46. Zhang, Z.; Zhang, Y.; Wang, X.; Lü, S.; Huang, Z.; Huang, X.; Yang, W.; Wang, Y.; Zhang, Q. Spatiotemporal patterns and source implications of aromatic hydrocarbons at six rural sites across China’s developed coastal regions. J. Geophys. Res. Atmos. 2016, 121, 6669–6687. [Google Scholar] [CrossRef]
  47. Wu, T.; Wang, X.; Li, D.; Yi, Z. Emission of volatile organic sulfur compounds (VOSCs) during aerobic decomposition of food wastes. Atmos. Environ. 2010, 44, 5065–5071. [Google Scholar] [CrossRef]
  48. Zhang, D.; Huang, X.; Xiao, S.; Zhang, Z.; Zhang, Y.; Wang, X. Characterization and Sources of VOCs during PM2.5 Pollution Periods in a Typical City of the Yangtze River Delta. Atmosphere 2024, 15, 1162. [Google Scholar] [CrossRef]
  49. Zhang, Z.; Wang, X.; Zhang, Y.; Lü, S.; Huang, Z.; Huang, X.; Wang, Y. Ambient air benzene at background sites in China’s most developed coastal regions: Exposure levels, source implications and health risks. Sci. Total Environ. 2015, 511, 792–800. [Google Scholar] [CrossRef]
  50. Sulyok, M.; Haberhauer-Troyer, C.; Rosenberg, E. Observation of sorptive losses of volatile sulfur compounds during natural gas sampling. J. Chromatogr. A 2002, 946, 301–305. [Google Scholar] [CrossRef]
  51. Zheng, J.; Yu, Y.; Mo, Z.; Zhang, Z.; Wang, X.; Yin, S.; Peng, K.; Yang, Y.; Feng, X.; Cai, H. Industrial sector-based volatile organic compound (VOC) source profiles measured in manufacturing facilities in the Pearl River Delta, China. Sci. Total Environ. 2013, 456–457, 127–136. [Google Scholar] [CrossRef] [PubMed]
  52. Harreveld, A.P.v. Odor Concentration Decay and Stability in Gas Sampling Bags. J. Air Waste Manage. Assoc. 2003, 53, 51–60. [Google Scholar] [CrossRef] [PubMed]
  53. Kim, Y.-H.; Kim, K.-H.; Jo, S.-H.; Jeon, E.-C.; Sohn, J.R.; Parker, D.B. Comparison of storage stability of odorous VOCs in polyester aluminum and polyvinyl fluoride Tedlar® bags. Anal. Chim. Acta 2012, 712, 162–167. [Google Scholar] [CrossRef] [PubMed]
  54. Shi, Y.; Li, G. Analysis of the stench sulfide components in the environmental air by GC/MS. Arid Environ. Monit. 2014, 28, 174–177+181. [Google Scholar]
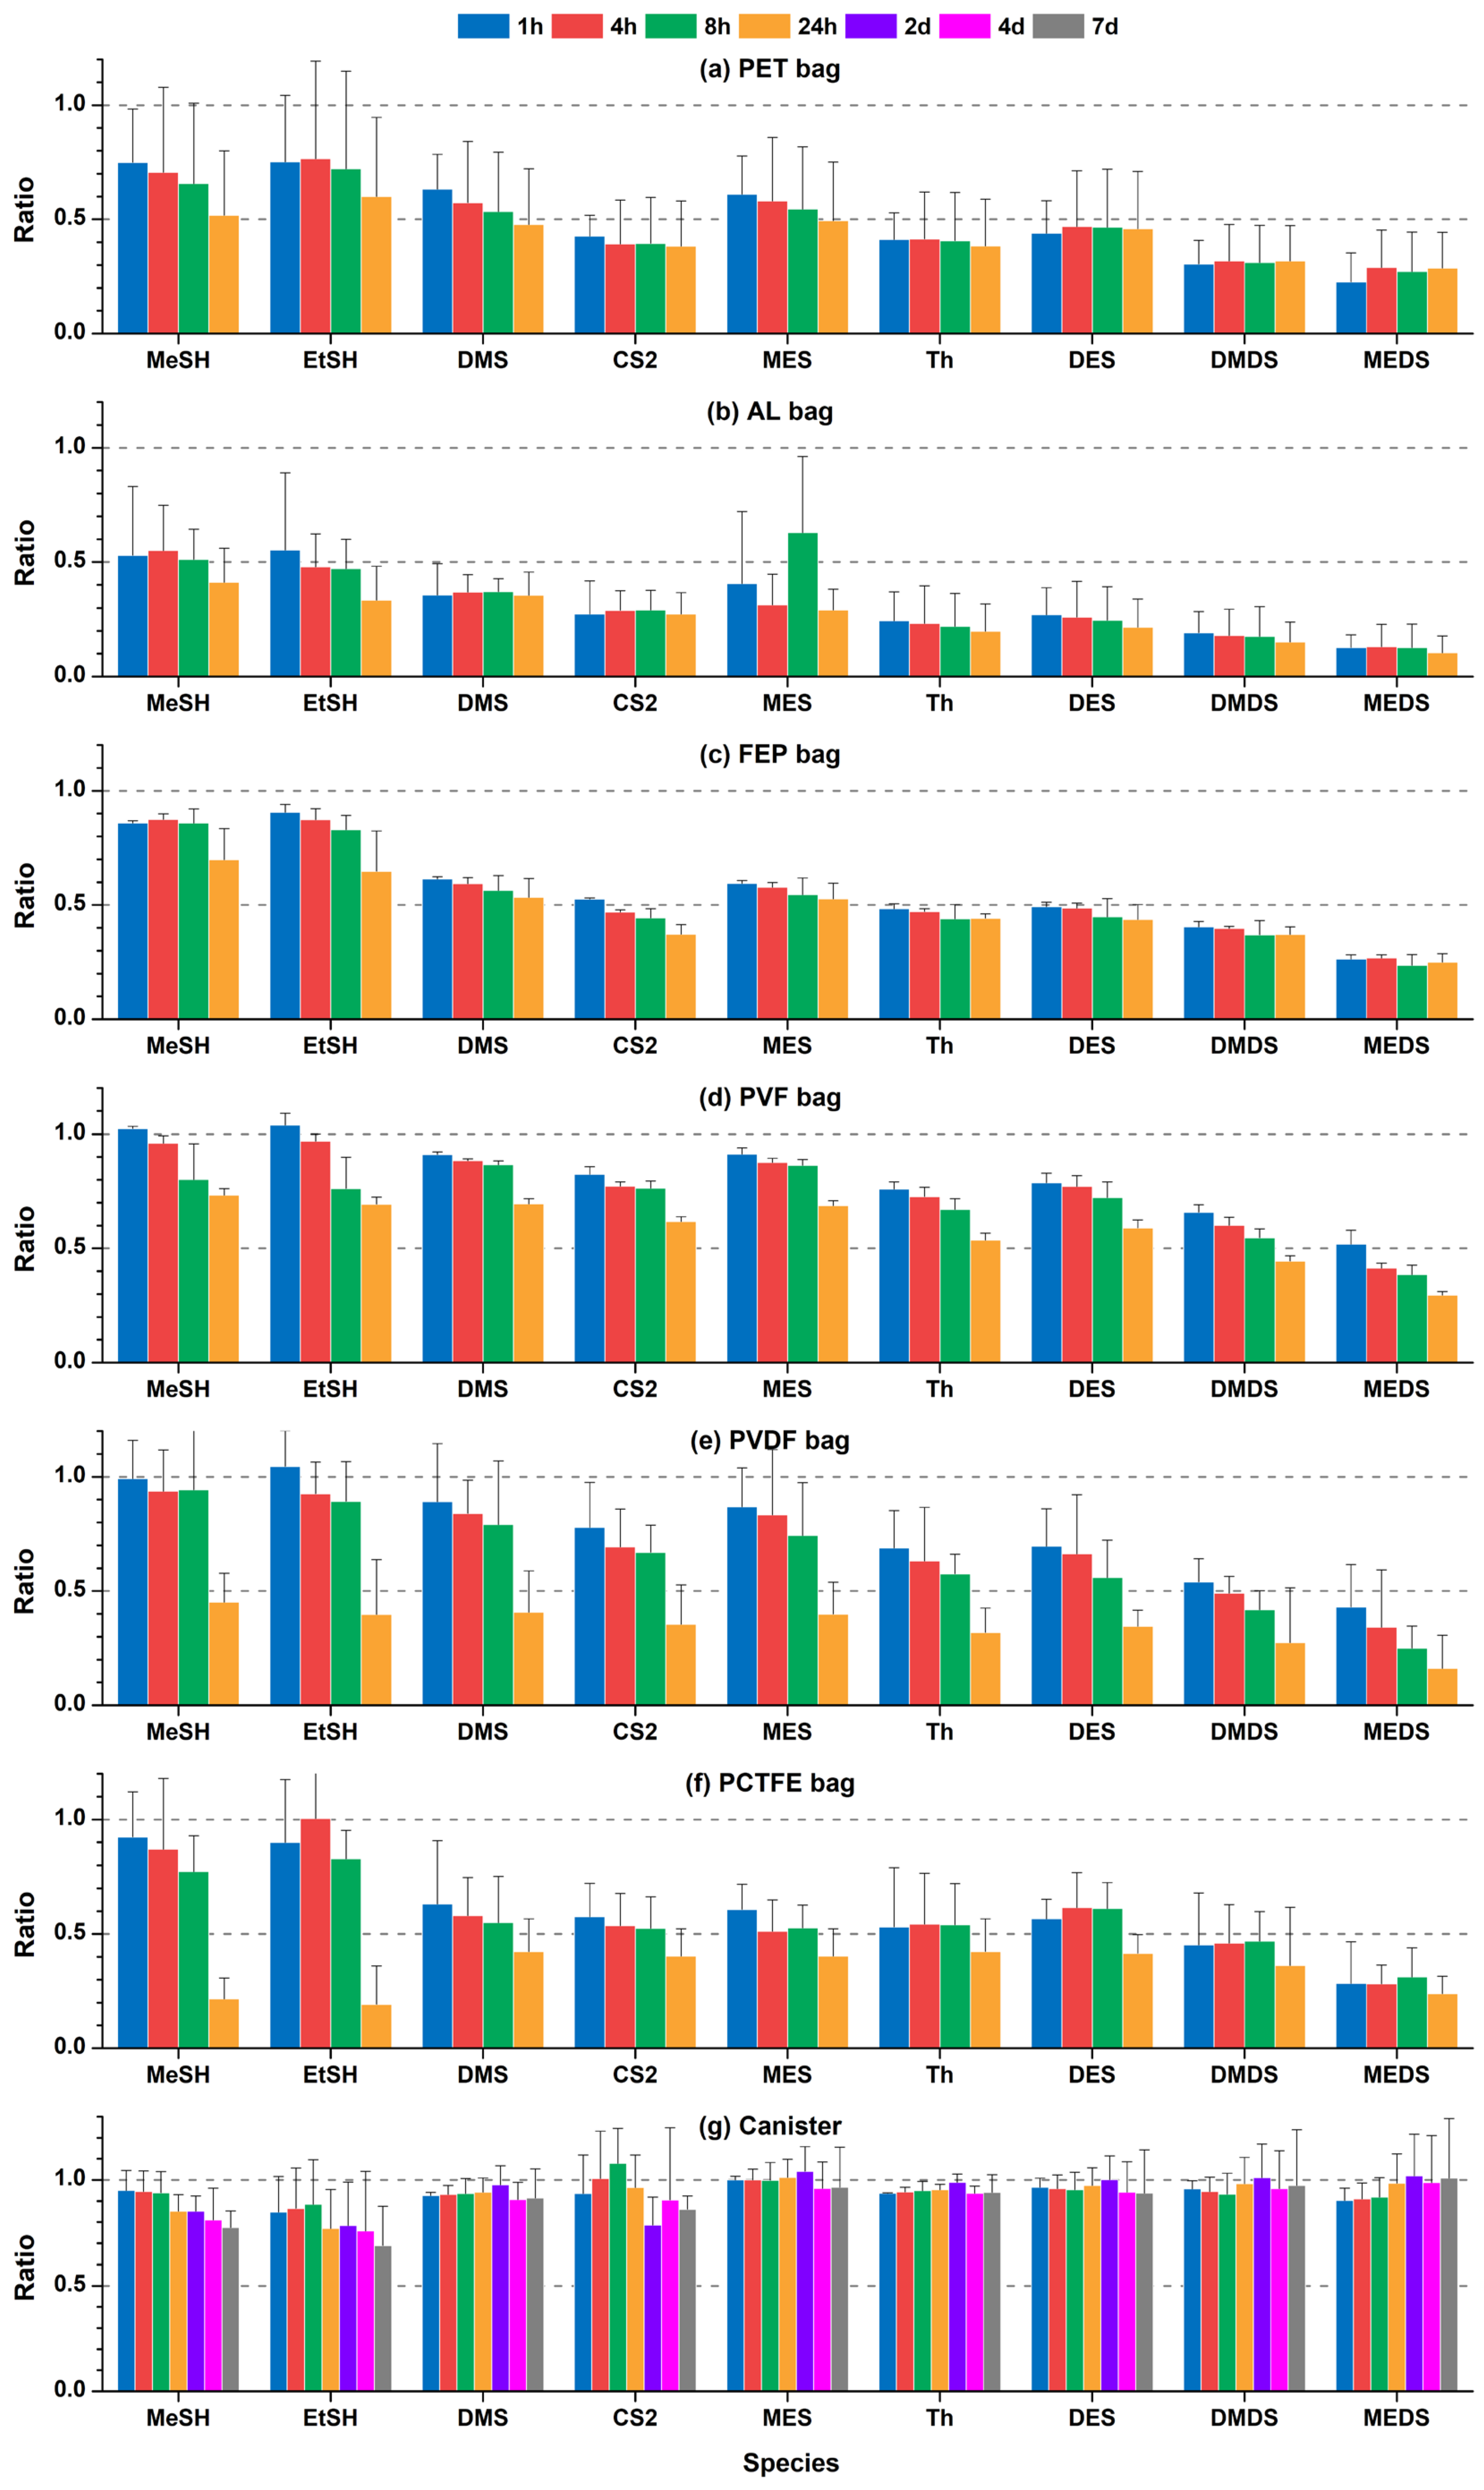
Figure 1. Ratios of measurements to standard concentration of VSCs in the sampling bags and canisters during different storage times.
Atmosphere 16 01341 g001
Figure 2. Comparisons of VSCs analysis by canister and PVF sampling during field observation.
Atmosphere 16 01341 g002
Figure 3. Effects of relative humidity (0–100%) on storage stability of VSCs in the canister.
Atmosphere 16 01341 g003
Figure 4. Compositions of VSCs at various sampling sites in the power battery recycling industry.
Atmosphere 16 01341 g004
Table 1. The information on sampling materials for VSCs evaluation.
NameMaterialVolumeManufacturer 1
PET bagpolyethylene glycol terephthalate10 LA/B/C
AL bagaluminum foil composite film3 LA/B/C
FEP bagfluorinated ethylene propylene3 LA/B/C
PVF bagpolyvinyl fluoride (Tedlar®)3 LA/B/C
PVDF bagpolyvinylidene fluoride3 LB
PCTFE bagpolychlorotrifluoroethylene3 LA
Canisterstainless steel with passivated inner surface of a fused silica layer (Silonite®/Siltek®/InertSi®)6 LD/E/F
1 Manufacturer: A—Dalian Hede Technologies Ltd., Dalian, China; B—Nanjing Kaver Scientific Instruments Co., Ltd., Nanjing, China; C—Dalian Delin Gas Packaging Co., Ltd., Dalian, China; D—Entech Instruments Inc., Simi Valley, CA, USA; E—Restek Corporation, Bellefonte, PA, USA; F—Zhejiang Aqtech Environmental Technology Co., Ltd., Jinhua, China.
Table 2. The measurement information of target VSCs species in the present study.
SpeciesCAS No.FormulaAbbr.RT/minSIM IonR2RSD/%MDL/ppbv
Methanethiol74-93-1CH4SMeSH7.3947/48/450.99411.60.059
Ethanethiol75-08-1C2H6SEtSH8.9362/47/450.99114.20.081
Dimethyl sulfide75-18-3C2H6SDMS9.3462/47/450.9996.30.018
Carbon disulfide75-15-0CS2CS29.9176/440.9984.80.008
Methyl ethyl sulfide624-89-5C3H8SMES12.1476/61/480.9997.60.022
Thiophene110-02-1C4H4STh14.1184/58/450.9994.50.013
Diethyl sulfide352-93-2C4H10SDES15.3275/90/610.9995.50.026
Dimethyl disulfide624-92-0C2H6S2DMDS16.9394/79/450.9998.60.057
Methyl ethyl disulfide20333-39-5C3H8S2MEDS20.48108/80/450.99913.50.105
Note: Abbr. means “abbreviation”; RT means “retention time”; SIM means “selected ion monitoring”; R2 is the correlation coefficient of calibration curve; RSD is the relative standard deviation for precision assessment; MDL is the method detection limit.
Table 3. Emission concentrations (ppbv) of VSCs at various sampling sites in the power battery recycling industry.
SiteWarehouse
Workshop
Extraction
Workshop
Synthesis
Workshop
Pyrolysis Drying
Stack
Lithium Leaching
Stack
Ni-Co Leaching
Stack
MeSHBDL 1BDLBDLBDL79.52102.10 (BDL-464.99) 2
EtSHBDLBDLBDLBDL0.72857.71 (BDL-3784.68)
DMS0.020.01BDLBDL0.233.37 (0.24–16.43)
CS20.350.460.254.837.716.47 (0.51–30.41)
MES0.01BDLBDLBDLBDL9.85 (1.00–55.20)
Th0.02BDL0.0298.131.024.30 (0.74–18.69)
DES0.02BDLBDLBDL0.094.35 (0.64–22.76)
DMDS0.070.080.05BDL0.2914.13 (0.32–80.27)
MEDS0.040.170.12BDL0.4344.58 (1.25–250.68)
Total VSCs0.530.720.45102.9690.011046.86 (19.76–4313.04)
1 BDL means “below detection limit”; 2 mean values (minimum—maximum).
Disclaimer/Publisher’s Note: The statements, opinions and data contained in all publications are solely those of the individual author(s) and contributor(s) and not of MDPI and/or the editor(s). MDPI and/or the editor(s) disclaim responsibility for any injury to people or property resulting from any ideas, methods, instructions or products referred to in the content.