Abstract
Warm-cloud hygroscopic seeding is widely used in precipitation enhancement, but the conditions under which seeding amplifies or suppresses rainfall remain unclear. Here, we use a two-dimensional slab-symmetric spectral bin microphysics model from Tel Aviv University to simulate a warm convective cloud that occurred over Hainan, China, on 11 May 2024, and design three sets of sensitivity experiments in which hygroscopic particles of different characteristic diameters are introduced under a fixed-mass injection constraint. We find that seeding with submicrometer particles (0.1–0.9 µm) systematically suppresses precipitation, with the strongest reduction for 0.1 µm particles. When super-micrometer particles (1–9 µm) are used, the precipitation response transitions from suppression to enhancement as particle size increases, and this transition occurs at about 2 µm. Seeding with ultra-giant particles (>10 µm) generally enhances rainfall and also advances its onset, with the enhancement strengthening up to ~60 µm before weakening for even larger particles. We further show that the transitional particle size at which the seeding effect changes sign decreases with increasing background aerosol loading, from maritime to polluted urban conditions. These results identify an environment-dependent critical particle size that governs the sign and efficiency of hygroscopic seeding in warm convective clouds.
1. Introduction
Weather modification refers to deliberate human intervention aimed at influencing atmospheric processes to achieve desired outcomes [1]. As a major approach, precipitation enhancement is widely applied to increase water resources in many regions. However, natural clouds exhibit low conversion efficiency, as nearly 80% of droplets do not reach the ground [2], motivating continued research into effective seeding strategies. Cloud-seeding techniques are generally classified into glaciogenic seeding for cold clouds [3] and hygroscopic seeding for warm clouds [4].
Convective clouds serve as the primary targets for hygroscopic seeding [5], in which aerosols function as cloud condensation nuclei (CCN). CCN determine the initial droplet spectrum and influence subsequent microphysical development [6,7,8,9,10,11,12]. Prior studies show that giant CCN (GCCN; >1 μm) can accelerate warm-rain formation [11]. Seeding particles within 0.5–6 μm were found most effective [13], while several studies identified 1.5–2.5 μm or >10 μm as optimal under different conditions [14,15]. These discrepancies reflect variations in background aerosol and seeded particle spectra. Moreover, the efficacy of GCCN is strongly modulated by natural aerosol concentrations; under clean environments, the enhancement may be greatly reduced [16,17,18,19,20,21,22,23].
These findings demonstrate that the rainfall response to CCN is fundamentally nonlinear, and the optimal seeding size depends on both particle concentration and environmental conditions. Motivated by these gaps, this study examines a typical warm-convective cloud using a mass-conserved monodisperse seeding spectrum. Single-diameter particles of varying concentrations are introduced to isolate microphysical effects and precipitation responses. We also simulate the natural cloud development under uniform lower-boundary conditions, with winds derived from the vorticity–stream-function formulation. The goal is to provide guidance for selecting particle size and dosage for hygroscopic seeding [24,25].
To address these scientific questions, this study adopts a numerical-simulation-based methodology. A two-dimensional warm-cloud bin microphysics model is used to simulate the formation and evolution of a warm convective cloud under controlled lower-boundary conditions. A set of mass-conserved, single-diameter hygroscopic seeding sensitivity experiments is then designed to isolate the effects of particle size and number concentration. By comparing the microphysical responses and precipitation outcomes among the sensitivity experiments, the study systematically evaluates how seeded particle size modulates warm-cloud development and rainfall production.
2. Model Description and Initialization
2.1. Model Description
Using the two-dimensional slab-symmetric detailed spectral bin microphysical model of Tel Aviv University (Yin et al., 2000) [15], this study aims to simulate the formation and evolution of a warm convective cloud under uniform lower-boundary conditions. The horizontal and vertical winds are solved from the vorticity equation and stream function. The model prognoses the wind field, perturbation potential temperature, perturbation specific humidity, CCN number concentration, and the number and mass mixing ratios of hydrometeors. Four hydrometeor categories are represented—cloud droplets, ice crystals, graupel, and snow—each discretized into 34 mass bins with a factor-of-two mass increment between adjacent bins. The first and last liquid bins have masses of 1.598 × 10⁻¹⁴ kg and 1.7468 × 10⁻⁴ kg, corresponding to particle diameters of 3.125 µm and 8064 µm, respectively. The CCN spectrum is divided into 67 bins with a minimum radius of 4.1 × 10⁻³ µm. Liquid-phase microphysical processes include droplet activation, condensation/evaporation, collision–coalescence, and breakup [26,27].
To simulate hygroscopic seeding, the model introduces an independent seeding particle spectrum together with its prognostic concentration equation. This allows the natural CCN spectrum and the seeding spectrum to be treated simultaneously, with the activation of both considered. The seeding spectrum can be injected at prescribed times, heights, and horizontal ranges to realize the seeding operation. Relative to the natural CCN, the hygroscopic seeding agent is assigned larger particle sizes and higher solubility, giving it a competitive advantage for available water vapor: it can inhibit activation of natural CCN while promoting more rapid formation of larger cloud droplets. In this study, natural CCN are assumed to be (NH4)2SO4, and the seeding material is KCl (the principal component of hygroscopic flares used in South African experiments). By the Köhler equation, KCl requires a lower supersaturation than (NH4)2SO4 for particles of the same size and is therefore more readily activated [28].
Both horizontal and vertical grid spacings are 300 m; the model domain spans 30 km horizontally with a top at 12 km. The time step is 2.5 s for condensation/evaporation and 5 s for other processes, and the integration length is 40 min. Initial conditions are taken from radiosonde data, including vertical profiles of temperature and relative humidity and the vertical wind. Convection is triggered by a thermal bubble centered in the middle of the domain at a height of 900 m, with a maximum temperature perturbation of 3 °C.
2.2. Mode Initialization Settings
A warm-convective cloud that developed over Sanya, Hainan, around 14:00 Beijing Time on 11 May 2024, was selected in this study. The initial thermodynamic profiles for the simulation were derived from the 12:00 (BT) radiosonde at Sanya station (WMO 59948). The sounding indicates a surface pressure of about 980 hPa, a lifting condensation level near 900 hPa (≈900 m), and a 0 °C level near 520 hPa (≈5.5 km) (Figure 1). The wind field is predominantly zonal; therefore, the observed wind speeds were projected onto the east–west direction and used to initialize the model’s environmental wind [29,30,31].
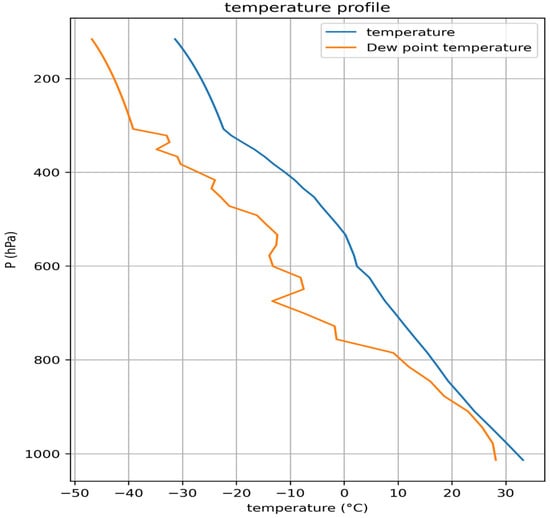
Figure 1.
Initial temperature (blue line) and dew point temperature (orange line) profiles obtained from the sounding data of Sanya station (59,948) at 12:00 on 11 May 2024.
Following the aerosol source-apportionment analysis by Tian et al. [32], which shows that Sanya is strongly influenced by marine aerosols from the South China Sea and by emissions from urban human activities, we prescribed three different background aerosols for the model. Specifically, we adopted the three-mode marine, continental, and urban aerosol dataset of Jaenicke [33] (the parameters in Table 1). The ground-level initial aerosol size spectra were constructed by fitting lognormal distributions [Equation (1)] to the three-mode datasets, which were used as the model’s lower-boundary aerosol inputs. Simulations with these three distinct background aerosol conditions yield maximum cloud-droplet number concentrations of 140, 400, and 1400 cm−3, respectively, which are broadly consistent with the customary definitions of clean, moderately polluted, and polluted natural clouds.

Table 1.
The natural and seeded cloud condensation nuclei spectra parameters.
In Equation (1), , , denote, respectively, the aerosol particle radius, the total number concentration of each mode, the geometric mean radius, and the geometric standard deviation; i indexes the mode.
3. Simulation of a Natural Cloud and Seeding Experiment Design
3.1. Simulation of a Natural Cloud
This section examines an unseeded convective warm cloud developed under an urban aerosol background, analyzing its precipitation and the cloud’s macro- and microphysical structure to provide a baseline and reference for the subsequent seeding experiment design.
Figure 2a presents the time–height evolution of the maximum liquid water mixing ratio at each level within the cloud core over 40 min. The results indicate a complete convective warm-cloud life cycle. During 0–10 min, the liquid water mixing ratio (LWMR) increases slowly, reflecting initial parcel lifting and moisture accumulation in the cloud’s formative stage. Around 12–15 min, larger LWMR values appear in the lower levels (≈1 km), marking cloud-base formation. As the convection intensifies, the LWMR rises rapidly and peaks near 20 min; the high-value region extends upward to about 4 km, and the cloud top lifts markedly, indicating a vigorous development stage. Thereafter, the LWMR decreases and the cloud begins to dissipate; by 30–35 min, the system is in its decay stage, with a rising cloud base and a lowering cloud top—features typical of the late life cycle of a convective cloud. Overall, the cloud depth resides mainly between 1 and 4 km; combined with the temperature profile, showing the whole cloud below the 0 °C isotherm, the simulated system qualifies as a convective warm cloud.
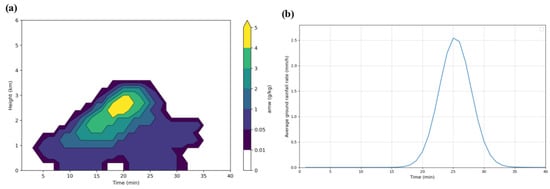
Figure 2.
Time evolution of the maximum liquid water mixing ratio at each height in the core area of the cloud (a) and the average ground rainfall rate (b).
Figure 2b shows the evolution of the domain-averaged surface rainfall intensity. Precipitation initiates at about 15 min, broadly consistent with the time when the LWMR increases markedly (as shown in Figure 2a). The rainfall intensity then rises rapidly and reaches a single peak around 23–24 min, indicating abundant cloud water and active collision–coalescence at that time. Thereafter, rainfall weakens and essentially ceases by ~35 min, yielding a ~20 min precipitation episode with a typical single-peaked structure.
3.2. Seeding Experiment Design
To investigate the impacts of seeding particles with different sizes, three size-range sensitivity groups were designed on the basis of the natural cloud simulation (denoted C00): 0.1–0.9 µm (C01–C09), 1–9 µm (C11–C19), and 10–90 µm (C21–C29). The seeding spectrum employed in this study was referenced to the South African field experiments [17] (parameters in Table 1). Because the present work focuses on monodisperse seeding, whereas the referenced spectrum contains orders-of-magnitude differences in number concentration across sizes (which obscures the size effect), we used the South African spectrum only as a mass reference: for each target single diameter, we computed the number concentration that gives the same total seeding mass as in the South African spectrum, thereby constructing a new mass-conserved, single-diameter seeding spectrum for the sensitivity experiments [22].
Seeding was performed during the initial development stage of the cloud (at 10 min) and at the cloud base (900 m). The seeding location was centered horizontally in the cloud and applied to a single model level, with a horizontal seeding extent of 900 m (i.e., on the central three grid columns). Because a two-dimensional model is used—resolving only the horizontal and vertical—the control width perpendicular to the model plane is assumed to be 300 m per grid column. Thus, the seeding control volume is a rectangular prism of 900 m × 300 m × 300 m. Hygroscopic nuclei were released once every 60 s; each release was executed within one dynamical time step (5 s), and a total of five releases were carried out over a 5 min seeding window. Table 2 lists the settings for the three sensitivity groups and the corresponding precipitation responses.

Table 2.
Parameters and results of sensitive experiments.
4. Experimental Results
4.1. Precipitation Changes in Different Sensitivity Experiments
In this study, three sets of sensitivity experiments were conducted; each set comprises nine monodisperse seeding cases with equal total seeding mass but different particle diameters. Table 2 summarizes the seeding particle diameters, the corresponding number concentrations, and the resulting precipitation responses for all 27 cases. Set 1 comprises the experiments with submicrometer-sized seeding particles (C01–C09, 0.1–0.9 µm). All cases in this set exhibit precipitation suppression, with the suppression generally strengthening as particle size decreases; the strongest suppression occurs at 0.1 µm. Set 2 consists of the experiments with giant-sized seeing particles (C11–C19, 1.0–9.0 µm). The rainfall amounts of this set increase with particle size. A transition from rain suppression to enhancement occurs at a threshold diameter between the 1–2 µm range. Set 3 includes the experiments with ultragiant-sized seeding particles (C21–C29, 10–90 µm). All cases in Set 3 produce precipitation enhancement, but the enhancement does not increase linearly with particle size; the most effective enhancement occurs at 30 µm of the seeding particle diameter. It is also shown that the transition size decreases when the background aerosol concentration varies from maritime to polluted urban conditions.
4.2. The Impact of Seeding Submicrometer-Sized Particles on Cloud Microphysical Processes
In the first set of submicro-particle seeding experiments (C01–C09, 0.1–0.9 µm), the domain-averaged surface rainfall intensity (Figure 3a) shows that all sensitivity runs share nearly the same onset and cessation time as the control case C00 (initiation at about 20 min), with peak times clustered at 24–26 min; however, the peak magnitude—the rainfall amount—decreases as the seeding particle size decreases. Compared with C00, total rainfall changes range from −82% (C01) to −8% (C09). Consistently, the maximum collision–coalescence rate (Figure 3b) peaks several minutes earlier than the rainfall peak, and its peak time tends to advance and its amplitude to increase as particle size decreases, yet this does not translate into a proportional enhancement of surface rainfall, indicating more frequent collisions but limited mass growth. Under the equal-mass constraint, halving the seeding diameter increases the injected number concentration, yielding many small droplets, high collision frequency, but low conversion efficiency to raindrops. This implies that under equal-mass seeding, smaller seeded particles produced higher number concentrations of droplets, but with smaller sizes. Although collisions among small droplets become more frequent, they are less effective at producing sufficient raindrops, so the bulk outcome is reduced rainfall.
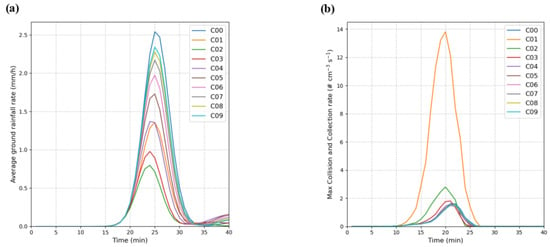
Figure 3.
Time evolution of the average ground rainfall rate (a) and the maximum collision–collection rate of droplets in the core area of the cloud (b) in the first group of experiments (C01–C09) as compared with the control run (C00).
A comparison of the in-cloud mean number size distribution (Figure 4a) with the mass distribution (Figure 4b) further supports the above interpretation. Seeding with submicro particles shifts the number distribution peak markedly toward smaller diameters; correspondingly, the mass distribution reallocates more condensate to small droplets and thus reduces the population within the 20–40 µm diameter range. This spectral restructuring diminishes subsequent rainfall; the collision–coalescence rate is elevated by the abundance of small droplets, but because the mass is concentrated at smaller sizes, precipitation-triggering drops are insufficient, making conversion to raindrops inefficient and ultimately lowering surface rainfall. A comparison between C02 (0.2 µm) and C09 (0.9 µm) makes this even clearer: C02 exhibits the largest increase on the small-drop side of the number spectrum and the most pronounced decrease on the large-drop side of the mass spectrum, yielding an earlier/higher collision–coalescence peak but the weakest rainfall peak; by contrast, C09 having larger particles at equal total mass—shows a marked reduction in seeded number concentration, rightward shifts in both number and mass peaks, and increased mass at larger diameters, so both the collision–coalescence process and rainfall peaks are closer to C00.
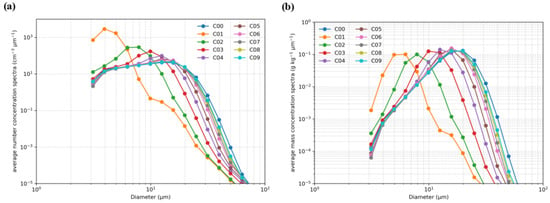
Figure 4.
The average droplet number concentration spectra (a) and mass concentration spectra (b) in the cloud core area after seeding (the 20th minute of simulation) in the first group of experiments (C01–C09) as compared with the control run (C00).
In the mass concentration spectra (Figure 4b), a clear pattern can be observed that as the seeded particle size decreases, the mass concentration in the small-droplet range (<10 μm) significantly increases, while that in the large-droplet range (>10 μm) decreases and remains consistently lower than in the control case (C00). This indicates that smaller particles exert a stronger inhibitory effect on cloud-droplet growth, particularly by reducing the number concentration of droplets >10 μm, which in turn weakens collision–coalescence and the subsequent formation of precipitation.
As the seeding diameter is reduced from 0.9 to 0.1 µm under the equal-mass constraint, the seeded number concentration grows sharply, and the number distribution shifts to smaller sizes, while both number and mass at larger diameters decline; thus, despite an earlier and higher collision–coalescence peak, sustained growth of high-mass raindrops is impeded, manifesting as lower peak intensity and reduced rainfall rate. Therefore, for rain suppression under equal-mass seeding, particles in the 0.1–0.9 µm range are broadly effective, and the suppression generally strengthens with decreasing size.
4.3. The Impact of Seeding Giant-Sized Particles on Cloud Microphysical Processes
In the second set of giant-particle seeding experiments (C11–C19, 1.0–9.0 µm), the domain-averaged surface rainfall intensity (Figure 5a) and maximum collision–coalescence rate (Figure 5b) exhibit strong consistency in magnitude and pattern across cases. In both figures, as the seeding particle diameter increases, the collision–coalescence rate strengthens first and is then converted within several minutes into a stronger surface rainfall response. From the rainfall time series (Figure 5a), the onset and end times are essentially the same among all cases: the total precipitation duration is about twenty minutes, and the rainfall peaks occur near twenty-five minutes. The peak magnitude increases with particle diameter, transitioning continuously from slightly below the control case C00 to distinctly above C00. Consistently, in Figure 5b, the peak collision–coalescence rate in all cases precedes the rainfall peak by about three to four minutes and increases progressively with particle diameter, showing a one-to-one correspondence between a stronger collision–coalescence activity and a stronger rainfall peak. For seeding particles with 1 μm in diameter (C11), the surface rainfall intensity is slightly lower than in C00; entering the 3–6 μm range (C13–C16), rainfall is clearly enhanced and exceeds C00; when the diameter increases to 7–9 μm (C17–C19), both the collision–coalescence rate and the rainfall intensity reach their highest levels within this group. Rainfall transitions from C11 (−4.8%) to C12 (+0.7%), then rises to C19 (+94.32%)
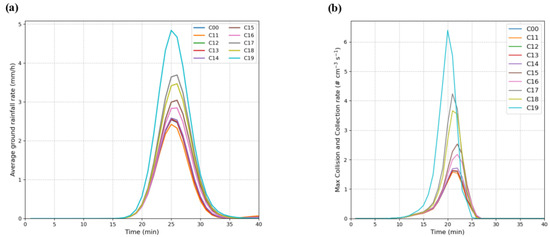
Figure 5.
The average ground rainfall rate (a) and the maximum collision and coalescence rate of droplets in the core area of the cloud (b) in the second group of experiments (C11–C19) as compared with the control run (C00).
Analysis of the in-cloud mean mass size distribution of droplets (Figure 6) shows that, for diameters smaller than about 10 μm, all seeded cases are nearly identical to the control C00, indicating limited structural impact of giant-sized particles seeding on that portion of the droplet spectrum. For droplets larger than about 10 μm in diameter, the curves display a clear, size-dependent pattern: in this range, C11 (1 μm) has slightly lower droplet number concentration and mass concentration than C00; starting from C12 (2 μm), both number and mass concentrations in this range increase continuously and intensify with the seeding particle diameter; by C17–C19 (7–9 μm), the increase is most pronounced, with number concentrations in this range exceeding those of the smaller-diameter cases and the mass-distribution peak shifted toward larger diameters relative to C00.
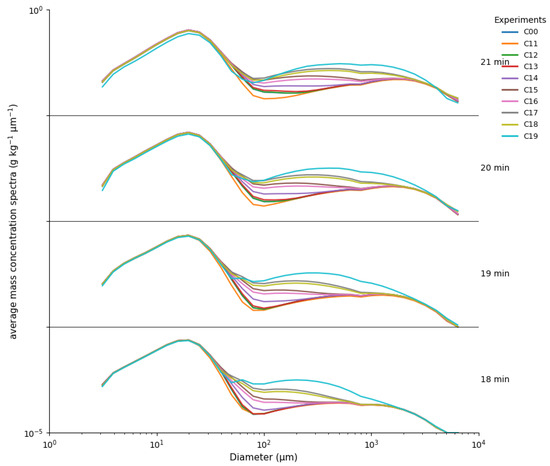
Figure 6.
The average droplet mass concentration spectra in the cloud core area after seeding at the 18th, 19th, 20th, and 21st minute for Set 2 (C11–C19) as compared with the control run (C00).
From 18 to 21 min, the mass concentration spectrum shows a clear time-dependent decrease in the <30 µm droplet diameter range across this set of experiments, with mass shifting toward larger particle sizes. This is most pronounced in experiment C19. Figure 6 clearly shows a reduction at small sizes and an increase at larger sizes. In contrast, experiment C11 exhibits little change, and its mass concentration at large diameters increasingly departs from the other experiments.
Taken together, under the equal-mass constraint, seeding with giant-size particles of 1–9 μm enhances the in-cloud collision–coalescence process and increases mass concentrations for droplets larger than about 30 μm, and after several minutes, into stronger surface rainfall. This strengthening is approximately monotonic with particle diameter within the giant-size range. C12 (2 μm) serves as the transitional case from rainfall suppression to enhancement and represents the critical diameter for this group.
4.4. The Impact of Seeding Ultragiant-Sized Particles on Cloud Microphysical Processes
In the third set of large-particle seeding experiments (C21–C29, 10–90 µm), the domain-averaged surface rainfall intensity (Figure 7a) shows that precipitation onset occurs noticeably earlier than in the control case (C00), and the onset advances as the seeded particle diameter increases. The rainfall peak also occurs earlier than in C00, and its magnitude is markedly larger. From C00 to roughly C26, peak rainfall strengthens rapidly with increasing particle size, after which it decreases at larger sizes. For example, the increase in peak rainfall from C21 to C26 is most pronounced, whereas the peaks in C27–C29 are clearly lower than in C26. Consistently, the maximum collision–coalescence rates (Figure 7b) of all seeded cases peak 3–5 min earlier than C00, attain amplitudes far exceeding C00, and rise quickly with particle size, reaching a maximum in C26. For further larger seeding particle sizes, the amplitude of the peak rainfall no longer increases, although the peak time appears earlier.
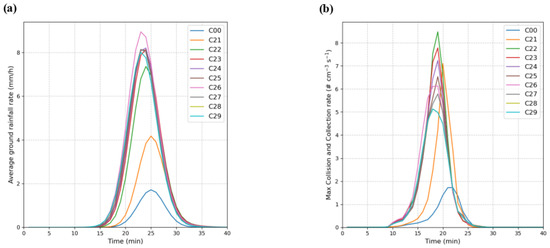
Figure 7.
The average ground rainfall rate (a) and the maximum collision-collection rate of droplets in the core area of cloud (b) in the third group of experiments (C21–C29) as compared with the control run (C00).
Together, the two panels indicate that large-particle seeding substantially advances and intensifies collision–coalescence, which then converts within a few minutes into a higher rainfall peak. The enhancement is strongest near 60 µm; further increases in particle size do not yield additional rainfall gains and instead lead to a reduction, reflecting that under an equal-mass constraint, using ultra-giant particles increases droplet diameter but simultaneously reduces drop number concentration, which lowers the collision–coalescence rate and thereby limits the efficiency of precipitation formation. Under the equal-mass constraint, increasing the seeded diameter reduces the injected particle number dramatically: from 10 µm to 60 µm, the number concentration decreases by a factor of about 27, and from 20 µm to 90 µm, it decreases by a factor of about 91. This reduction in available collectors explains why enhancement declines once the diameter exceeds roughly 60 µm.
The in-cloud mean number size distribution (Figure 8a) and mass size distribution (Figure 8b) clarify the associated spectral changes. On the small-diameter side, the seeded cases are essentially indistinguishable from C00, indicating little influence on the population of small droplets. At larger diameters, however, clear differences emerge: in the 40–1000 µm diameter range, both number concentration and mass concentration decrease as the seeded particle size increases; within this interval, smaller seeding particles exhibit higher number and mass concentrations.
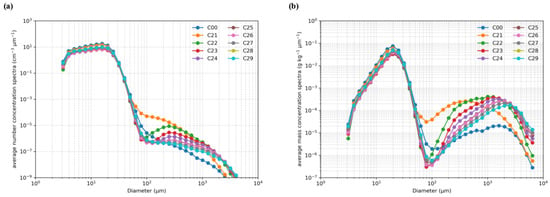
Figure 8.
The average droplet number concentration spectra (a) and mass concentration spectra (b) in cloud core area after seeding (the 20th minute of simulation) in the third group of experiments (C21–C29) as compared with the control run (C00).
A drastic change in the seeding response occurs from C21 to C22. The number and mass concentrations within the 40–1000 µm range for C21 are far higher than in the other runs. Beyond the fact that seeding 10 µm particles yields a larger number concentration for the same mass, another contributing factor is the difference in precipitation onset timing among the experiments. As shown in Figure 9, the onset of precipitation advances with increasing seeded particle diameter. This behavior is most evident for the 10 µm case (C21). From 16 to 22 min, both the C21 and C22 experiments show a clear decrease in mass concentration within this diameter range (Figure 9). However, because precipitation in C21 occurs later than in the other experiments, its number and mass concentrations appear much higher than the others in Figure 8. This indirectly indicates that seeding with larger particles can advance the timing of the precipitation peak.
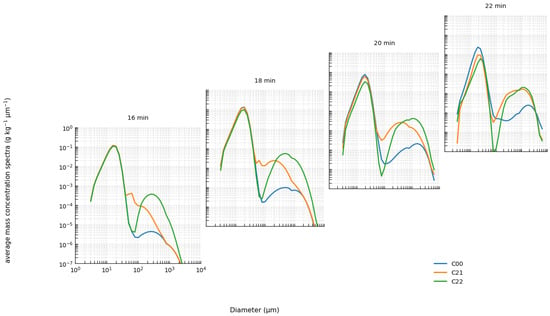
Figure 9.
The average droplet mass concentration spectra in cloud core area after seeding at the 16th, 18th, 20th, and 22nd minute in the third group of experiments (C21 and C22), as compared with the control run (C00).
In the diameter range above 1000 µm, both number and mass concentrations increase as the seeded particle size grows. Overall, as seeding diameter increases, the enhancement of >1000 µm droplets intensifies; as diameter decreases, the enhancement of these large droplets weakens and shifts toward the 40–1000 µm range. However, because the total seeding mass is fixed, larger particles—though more likely to produce bigger drops—yield fewer drops than smaller particles. Consequently, the precipitation enhancement from larger seeds does not vary linearly with seeding particle size; to achieve the optimum seeding effect, particle size and number concentration must be balanced under the constraint of total mass. In this study, the optimal size—producing the greatest rainfall enhancement—corresponds to experiment C26.
4.5. Dependence of the Critical Seeding Diameter on Background Aerosol Regime
In the above analyzed seeding effects for a typical continental cloud (3.3), a critical seeding particle size exists for the seeding effect transition from negative to positive. In order to understand how the critical size is sensitive to the environments of the natural unseeded clouds, two extra sets of sensitivity experiments with different background aerosol concentrations and similar seeding assignments were designed. As shown in Figure 10, the blue curve denotes a typical maritime environment (M series) characterized by a clean atmosphere with a maximum cloud-droplet number concentration of 120 cm−3; the green curve denotes a continental environment (C series, as discussed above) with a maximum cloud-droplet number concentration of 450 cm−3; and the red curve denotes an urban environment (U series) characterized by a highly polluted continental atmosphere with a maximum cloud-droplet number concentration of 1400 cm−3. The experimental results (Figure 11) show that in the M series, seeding exerts only a minor influence on precipitation, apart from a pronounced rain-suppression effect when 1 µm particles are seeded; the other cases show little impact. Even so, the response changes gradually from suppression to enhancement, with the transition occurring at a seeding radius of about 6 µm. In the more polluted C series, the seeding-induced changes are more evident than in the M series, and the critical radius for the shift from suppression to enhancement is smaller, at roughly 3 µm. The U series, which represents the most polluted background, exhibits the clearest response: seeding with 2 µm particles produces a distinct transition from suppression to enhancement, and the ensuing enhancement is stronger than in the other two series. The results show a consistent transition from rainfall suppression to enhancement in all three regimes, but the critical radius decreases markedly with increasing pollution. Also, once the threshold is crossed, the enhancement grows stronger as pollution increases. These findings indicate that more polluted cloud systems are more sensitive to the seeding of smaller particles, and the critical radius is smaller.
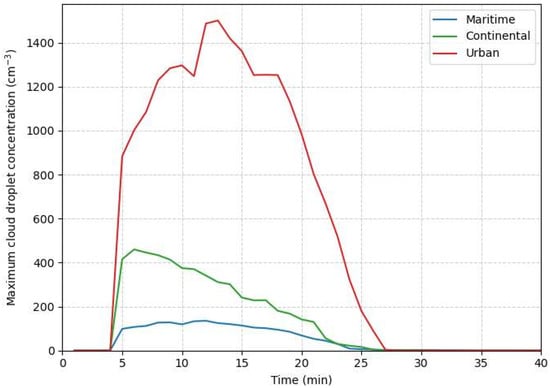
Figure 10.
Temporal evolution of the maximum cloud droplet number concentration in natural clouds under simulations with different background aerosol conditions.
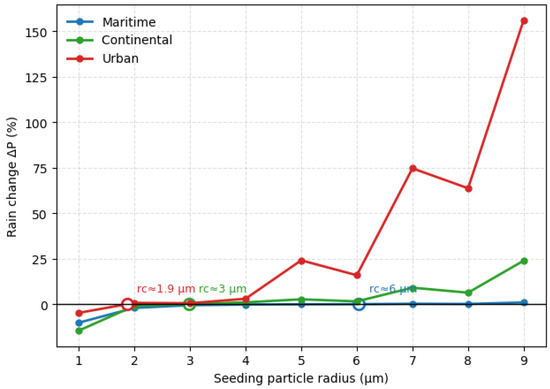
Figure 11.
Rainfall changes induced by seeding giant-sized particles under three different background aerosol conditions (rc is the critical diameter).
Taken together, across the three background aerosol regimes, the transition shifts systematically toward smaller sizes as background aerosol loading increases: the critical diameter is approximately 6 μm under maritime conditions, 3 μm under continental conditions, and 2 μm under urban conditions. In clean maritime clouds, natural droplet numbers are smaller, condensation growth already yields comparatively large ambient droplets, and only very small seeds around 1 μm can still intensify competition for vapor and suppress rainfall. A transition to enhancement only emerges once the seeded radius approaches several micrometers. In continental clouds, higher CCN elevate droplet number and narrow the natural size spectrum; consequently, smaller seeded sizes are able to trigger earlier formation of precipitation, shifting the transition to about 3 μm. In urban clouds, where droplet numbers are highest and condensational growth is most spectrum-narrowing, even 2 μm seeds can rapidly initiate collision–coalescence and translate into surface rainfall increases.
5. Conclusions
Given that convective warm clouds are widely distributed and possess considerable potential for precipitation enhancement, this study used the Tel Aviv University two-dimensional slab-symmetric spectral bin microphysical model to investigate how hygroscopic seeding particle size and dosage modulate warm-cloud microphysics and precipitation development. A warm convective cloud that occurred around 14:00 Beijing Time on 11 May 2024 was simulated, and under an equal-mass (mass-conserved) seeding constraint, three groups of sensitivity experiments were designed for different particle-size ranges. The main conclusions are as follows:
(1) Submicrometer-sized particles seeding (C01–C09, 0.1–0.9 µm) consistently reduces rainfall: the smaller the seeded particles are, the more strongly they constrain the natural cloud aerosol population, making it difficult for large droplets to form and thereby suppressing precipitation. Although decreasing particle size strengthens the peak collision–coalescence rate, the growth is inefficient at producing larger drops, so rainfall remains suppressed; the strongest suppression occurs when seeding with particles of 0.1 µm in diameter, for which the large-drop end of the mass distribution is minimal. This suppression behavior is consistent with previous studies showing that increased CCN concentrations can reduce warm-rain efficiency by shifting the droplet spectrum toward more numerous, smaller droplets [11].
(2) Giant-size seeding (C11–C19, 1.0–9.0 μm) produces an overall transition in precipitation response from suppression to enhancement as particle size increases. Seeding with particles in this size range enhances in-cloud collision–coalescence by increasing the mass concentration of droplets larger than about 30 μm and subsequently converts this microphysical enhancement into stronger surface rainfall. Under the present polluted background, a diameter of about 2 μm represents the threshold at which the seeding effect shifts from rainfall suppression to enhancement; beyond this threshold, the total rainfall generally increases with seeded particle size, although individual experiments exhibit small deviations from strict monotonicity.
(3) Ultragiant-size seeding (C21–C29, 10–90 μm) generally advances the onset of precipitation and produces pronounced rainfall enhancement. Within this range, the enhancement first increases and then decreases with particle size, with 60 μm seeding yielding the most evident increase in rainfall; beyond this optimum, the equal-mass constraint implies fewer seeded particles, so the enhancement weakens despite their larger size. The behavior that sufficiently large hygroscopic particles can strongly accelerate collision–coalescence and enhance warm-cloud rainfall is in line with earlier numerical and field studies [15], while our experiments systematically identify an optimal ultragiant size under a fixed seeding mass.
(4) Under different background aerosol conditions, the transition from rainfall suppression to enhancement systematically shifts toward smaller seeded sizes as background aerosol loading increases: the critical diameter is approximately 6 μm under maritime conditions, 3 μm under continental conditions, and 2 μm under urban conditions. This behavior indicates that more heavily polluted cloud systems are more sensitive to the seeding of relatively small giant particles and that the critical size for reversing the seeding effect decreases as background CCN concentrations increase.
In summary, the findings of this study are helpful for understanding how seeding particles of different sizes influence the evolution of the cloud-droplet spectrum and the precipitation process. The results not only enrich the theoretical understanding of hygroscopic seeding microphysics in warm convective clouds but also provide scientific guidance and parameter references for operational hygroscopic seeding of warm clouds, with broad applicability and practical value. It should be noted that, in addition to the microphysical effects of GCCN examined here, entrainment–mixing processes and turbulence-induced enhancements of collision–coalescence can also influence warm-rain production and may affect the quantitative precipitation response. Future work will incorporate these dynamical mechanisms and confront the simulations with observations and field experiments to further improve the robustness of the seeding impact assessment.
Author Contributions
Conceptualization, X.R. and Y.Y.; methodology, X.R. and Y.Y.; software, Y.Y.; validation, X.R.; formal analysis, X.R.; investigation, Y.Y. and Q.C.; resources, Y.Y., Y.L. and B.C.; data curation, S.H.; writing—original draft preparation, X.R.; writing—review and editing, Y.Y., Q.C., Y.L. and B.C.; visualization, X.R.; supervision, Y.Y. and Q.C.; project administration, Y.L. and B.C.; funding acquisition, Y.L. and B.C. All authors have read and agreed to the published version of the manuscript.
Funding
This research was funded by the National Key Research and Development Program of China, Grant 2023YFC3007605; the Weather Modification Ability Construction Project in central China of China Meteorological Administration, ZQC-T22253, and the National Natural Science Foundation of China, grant No. 42275078.
Data Availability Statement
The raw data supporting the conclusions of this article will be made available by the authors on request.
Acknowledgments
We thank the National Large Scientific and Technological Infrastructure “Earth System Numerical Simulation Facility” (https://cstr.cn/31134.02.EL) (accessed on 21 November 2025) for the technical support.
Conflicts of Interest
The funders had no role in the design of the study; in the collection, analyses, or interpretation of data; in the writing of the manuscript; or in the decision to publish the results.
Abbreviations
The following abbreviations are used in this manuscript:
| CCN | Cloud Condensation Nuclei |
| GCCN | Giant Cloud Condensation Nuclei |
References
- Flossmann, A.I.; Manton, M.; Abshaev, A.; Bruintjes, R.; Murakami, M.; Prabhakaran, T.; Yao, Z. Review of advances in precipitation enhancement research. Bull. Am. Meteorol. Soc. 2019, 100, 1465–1480. [Google Scholar] [CrossRef]
- Lelieveld, J. Multi-phase processes in the atmospheric sulfur cycle. In Interactions of C, N, P and S Biogeochemical Cycles and Global Change; Wollast, R., Mackenzie, F.T., Chou, L., Eds.; Springer: Berlin/Heidelberg, Germany, 1993; pp. 305–331. [Google Scholar] [CrossRef]
- Mazzetti, T.; Geerts, B.; Xue, L. A numerical evaluation of the impact of operational ground-based glaciogenic cloud seeding on precipitation over the Wind River Range, Wyoming. J. Appl. Meteorol. Climatol. 2023, 62, 489–510. [Google Scholar] [CrossRef]
- Lin, K.-I.; Chung, K.-S.; Wang, S.-H.; Chen, L.-H.; Liou, Y.-C.; Lin, P.-L.; Chang, W.-Y.; Chiu, H.-J.; Chang, Y.-H. Evaluation of hygroscopic cloud seeding in warm-rain processes by a hybrid microphysics scheme using a Weather Research and Forecasting (WRF) model: A real case study. Atmos. Chem. Phys. 2023, 23, 10423–10438. [Google Scholar] [CrossRef]
- Prabhakaran, T.; Murugavel, P.; Konwar, M.; Malap, N.; Gayatri, K.; Dixit, S.; Samanta, S.; Chowdhuri, S.; Bera, S.; Varghese, M.; et al. CAIPEEX: Indian Cloud Seeding Scientific Experiment. Bull. Am. Meteorol. Soc. 2023, 104, E2095–E2120. [Google Scholar] [CrossRef]
- Shen, Y.; Virkkula, A.; Ding, A.; Luoma, K.; Keskinen, H.; Aalto, P.P.; Chi, X.; Qi, X.; Nie, W.; Huang, X.; et al. Estimating cloud condensation nuclei number concentrations using aerosol optical properties: Role of particle number size distribution and parameterization. Atmos. Chem. Phys. 2019, 19, 15483–15502. [Google Scholar] [CrossRef]
- Twomey, S. The influence of pollution on the shortwave albedo of clouds. J. Atmos. Sci. 1977, 34, 1149–1152. [Google Scholar] [CrossRef]
- Albrecht, B.A. Aerosols, cloud microphysics, and fractional cloudiness. Science 1989, 245, 1227–1230. [Google Scholar] [CrossRef]
- Rosenfeld, D.; Andreae, M.O.; Asmi, A.; Chin, M.; de Leeuw, G.; Donovan, D.P.; Kahn, R.; Kinne, S.; Kivekäs, N.; Kulmala, M.; et al. Global observations of aerosol–cloud–precipitation–climate interactions. Rev. Geophys. 2014, 52, 750–808. [Google Scholar] [CrossRef]
- Khain, A.P.; Beheng, K.D.; Heymsfield, A.; Korolev, A.; Krichak, S.O.; Levin, Z.; Pinsky, M.; Phillips, V.; Prabhakaran, T.; Teller, A.; et al. Representation of microphysical processes in cloud-resolving models: Spectral (bin) microphysics versus bulk parameterization. Rev. Geophys. 2015, 53, 247–322. [Google Scholar] [CrossRef]
- Dagan, G.; Koren, I.; Altaratz, O. Aerosol effects on the timing of warm rain processes. Geophys. Res. Lett. 2015, 42, 4590–4598. [Google Scholar] [CrossRef]
- Liu, H.; Guo, J.; Koren, I.; Altaratz, O.; Dagan, G.; Wang, Y.; Jiang, J.H.; Zhai, P.; Yung, Y.L. Non-monotonic aerosol effect on precipitation in convective clouds over tropical oceans. Sci. Rep. 2019, 9, 7809. [Google Scholar] [CrossRef]
- Caro, D.; Wobrock, W.; Flossmann, A.I. A numerical study on the impact of hygroscopic seeding on the development of cloud particle spectra. J. Appl. Meteorol. Clim. 2002, 41, 333–350. [Google Scholar] [CrossRef]
- Segal, Y.; Khain, A.; Pinsky, M.; Rosenfeld, D. Effects of hygroscopic seeding on raindrop formation as seen from simulations using a 2000-bin spectral cloud parcel model. Atmos. Res. 2004, 71, 3–34. [Google Scholar] [CrossRef]
- Yin, Y.; Levin, Z.; Reisin, T.; Tzivion, S. The effects of giant cloud condensation nuclei on the development of precipitation in convective clouds—A numerical study. Atmos. Res. 2000, 53, 91–116. [Google Scholar] [CrossRef]
- Mather, G.K.; Terblanche, D.E.; Steffens, F.E.; Fletcher, L. Results of the South African cloud-seeding experiments using hygroscopic flares. J. Appl. Meteorol. 1997, 36, 1433–1447. [Google Scholar] [CrossRef]
- Cooper, W.A.; Bruintjes, R.T.; Mather, G.K. Calculations pertaining to hygroscopic seeding with flares. J. Appl. Meteorol. Clim. 1997, 36, 1449–1469. [Google Scholar] [CrossRef]
- Feingold, G.; Cotton, W.R.; Kreidenweis, S.M.; Davis, J.T. The impact of giant cloud condensation nuclei on drizzle formation in stratocumulus: Implications for cloud radiative properties. J. Atmos. Sci. 1999, 56, 4100–4117. [Google Scholar] [CrossRef]
- Khain, A.; Pokrovsky, A.; Pinsky, M.; Seifert, A.; Phillips, V. Simulation of effects of atmospheric aerosols on deep turbulent convective clouds using a spectral microphysics mixed-phase cumulus cloud model. part i: Model description and possible applications. J. Atmos. Sci. 2004, 61, 2963–2982. [Google Scholar] [CrossRef]
- Teller, A.; Levin, Z. The effects of aerosols on precipitation and dimensions of subtropical clouds: A sensitivity study using a numerical cloud model. Atmos. Chem. Phys. 2006, 6, 67–80. [Google Scholar] [CrossRef]
- Khain, A.P.; Leung, L.R.; Lynn, B.; Ghan, S.J. Effects of aerosols on the dynamics and microphysics of squall lines simulated by spectral bin and bulk parameterization schemes. J. Geophys. Res. 2009, 114, D22203. [Google Scholar] [CrossRef]
- Rosenfeld, D.; Axisa, D.; Woodley, W.L.; Lahav, R. A quest for effective hygroscopic cloud seeding. J. Appl. Meteorol. Clim. 2010, 49, 1548–1562. [Google Scholar] [CrossRef]
- Tao, W.-K.; Chen, J.-P.; Li, Z.; Wang, C.; Zhang, C. Impact of aerosols on convective clouds and precipitation: A review. Rev. Geophys. 2012, 50, RG2001. [Google Scholar] [CrossRef]
- Heikenfeld, M.; White, B.; Labbouz, L.; Stier, P. Aerosol effects on deep convection: The propagation of aerosol perturbations through convective cloud microphysics. Atmos. Chem. Phys. 2019, 19, 2601–2627. [Google Scholar] [CrossRef]
- Morrison, H.; van Lier-Walqui, M.; Fridlind, A.M.; Grabowski, W.W.; Harrington, J.Y.; Hoose, C.; Korolev, A.; Kumjian, M.R.; Milbrandt, J.A.; Pawlowska, H.; et al. Confronting the challenge of modeling cloud and precipitation microphysics. J. Adv. Model. Earth Syst. 2020, 12, e2019MS001689. [Google Scholar] [CrossRef] [PubMed]
- Tzivion, S.; Reisin, T.; Levin, Z. Numerical simulation of hygroscopic seeding in a convective cloud. J. Appl. Meteorol. Clim. 1994, 33, 252–267. [Google Scholar] [CrossRef]
- Reisin, T.; Tzivion, S.; Levin, Z. Seeding convective clouds with ice nuclei or hygroscopic particles: A numerical study using a model with detailed microphysics. J. Appl. Meteorol. Clim. 1996, 35, 1416–1434. [Google Scholar] [CrossRef]
- Padró, L.T.; Asa-Awuku, A.; Morrison, R.; Nenes, A. Inferring thermodynamic properties from CCN activation experiments: Single-component and binary aerosols. Atmos. Chem. Phys. 2007, 7, 5263–5274. [Google Scholar] [CrossRef]
- Jaenicke, R. Tropospheric aerosols. In Aerosol–Cloud–Climate Interactions; Hobbs, P.V., Ed.; Academic Press: Cambridge, MA, USA, 1993; pp. 1–31. [Google Scholar]
- Pruppacher, H.R.; Klett, J.D. Microphysics of Clouds and Precipitation, 2nd ed.; Kluwer Academic Publishers: Dordrecht, The Netherlands, 1997; 954p. [Google Scholar]
- Heintzenberg, J.; Covert, D.C.; VAN Dingenen, R. Size distribution and chemical composition of marine aerosols: A compilation and review. Tellus B Chem. Phys. Meteorol. 2000, 52, 1104–1122. [Google Scholar] [CrossRef]
- Tian, J.; Wang, Q.; Han, Y.; Ye, J.; Wang, P.; Pongpiachan, S.; Ni, H.; Zhou, Y.; Wang, M.; Zhao, Y.; et al. Contributions of aerosol composition and sources to particulate optical properties in a southern coastal city of China. Atmos. Res. 2020, 235, 104744. [Google Scholar] [CrossRef]
- Jaenicke, R. Aerosol physics and chemistry. In Landolt-Börnstein, New Series, Group V: Geophysics and Space Research, Vol. 4b, Meteorology; Fischer, G., Ed.; Springer-Verlag: Berlin/Heidelberg, Germany, 1988; pp. 391–457. [Google Scholar]
Disclaimer/Publisher’s Note: The statements, opinions and data contained in all publications are solely those of the individual author(s) and contributor(s) and not of MDPI and/or the editor(s). MDPI and/or the editor(s) disclaim responsibility for any injury to people or property resulting from any ideas, methods, instructions or products referred to in the content. |
© 2025 by the authors. Licensee MDPI, Basel, Switzerland. This article is an open access article distributed under the terms and conditions of the Creative Commons Attribution (CC BY) license (https://creativecommons.org/licenses/by/4.0/).