Article

Variability in Meteorological Parameters at the Lenghu Site on the Tibetan Plateau

1
National Astronomical Observatories, Chinese Academy of Sciences, Beijing 100101, China
2
Institute of Geology and Geophysics, Chinese Academy of Sciences, Beijing 100029, China
3
School of Physics and Astronomy, West-China Normal University, Nanchong 637001, China
*
Author to whom correspondence should be addressed.
Atmosphere 2025, 16(10), 1210; https://doi.org/10.3390/atmos16101210
Submission received: 31 August 2025 / Revised: 10 October 2025 / Accepted: 16 October 2025 / Published: 20 October 2025
(This article belongs to the Section Climatology)

Abstract

This study presents a comprehensive analysis of key meteorological parameters at the Lenghu site, a premier astronomical observing location, with particular emphasis on understanding their variability patterns and long-term trends. The research systematically investigates regional distribution characteristics, periodic variations, seasonal changes, and the temporal evolution of critical atmospheric parameters that influence astronomical observations. Furthermore, this study explores the potential connections between these parameters and major climate oscillation patterns, including ENSO (El Niño–Southern Oscillation), PDO (Pacific Decadal Oscillation), and AMO (Atlantic Multidecadal Oscillation). Utilizing ERA5 (the fifth-generation atmospheric reanalysis from the European Centre for Medium-Range Weather Forecasts) reanalysis data, we examine the regional atmospheric conditions (82°–102° E and 31°–46° N) surrounding the Lenghu site from 2000 to 2023 (24 years). The analysis focuses on fundamental meteorological parameters: precipitable water vapor (PWV), temperature, wind speed at 200 hPa ( W 200 ), and total cloud cover (TCC). For the Lenghu site specifically, we extend the temporal coverage to 1990–2023 (34 years) to include additional parameters such as high cloud cover (HCC) and total column ozone (TCO). The analysis reveals that the ENSO and PDO indices are negatively correlated with W 200 . The AMO index has a positive correlation with PWV and a slight positive correlation with W 200 , temperature, and TCO. Moreover, a comparative analysis of Lenghu, Mauna Kea, and Paranal reveals distinct variation trends across sites due to regional climate differences. Notably, while all observatory sites are affected by global climate change, their response patterns and temporal characteristics exhibit subtle variations.

1. Introduction

As global temperatures continue to rise, weather patterns around the world are undergoing significant changes. With an increasing number of extreme weather events being linked to climate change, research is increasingly focused on understanding how climate change is affecting specific sectors and industries [1]. Cantalloube et al. [2] emphasized the urgent need for in-depth studies on the impact of climate change on global observatories, particularly concerning meteorological parameters such as temperature and precipitable water vapour. Their findings were based on an investigation of parameters at the Paranal Observatory in Chile, where they observed an increase in temperature and surface turbulence.
Meteorological parameters are closely related to astronomical observations and are one of the key factors considered when selecting and operating an optical observation site. They are also crucial criteria for evaluating the quality of an astronomical site [3]. A good observatory needs to produce high-quality astronomical data and maximize scientific productivity throughout the telescope’s lifetime. To maximize the efficiency and quality of observations, it is necessary to conduct long-term analyses of the site’s meteorological parameters. The long-term variability in the meteorological parameters is very important for the planning of site equipment construction, scientific objectives, and observation plans. For an excellent observatory site, it is extremely important to fully understand the potential changes caused by climate change [4]. Systematic analysis of the meteorological conditions and their long-term trends at candidate observatory sites is fundamental for evaluating the suitability of the locations [5]. Long-term analysis of meteorological parameters helps monitor and understand the impact of climate change on astronomical observations. By analyzing trends in meteorological parameters, the potential impact of future weather conditions on astronomical observations can be assessed, and appropriate measures can be taken in advance.
Many studies have been conducted on the long-term variations in meteorological parameters at astronomical sites. Van Kooten and Izett [1] used precipitable water vapor data from ERA5 and also attempted to analyze the correlation of this parameter with the El Niño–Southern Oscillation (ENSO). Zhao et al. [6] studied the long-term (22-year) variations in temperature and precipitable water vapor at the Lenghu site using ERA5 reanalysis data. Bolbasova et al. [7] analyzed long-term variations in meteorological parameters such as total cloud cover, precipitable water vapor, and wind speed at 200 hPa above the Terskol Observatory using ERA5 reanalysis data. Seidel et al. [4] analyzed the surface-level air temperature, water vapor density, and astronomical seeing at the European Southern Observatory telescope sites in northern Chile. They found a rise in temperature over the past decade and established a correlation between temperature, water vapor density, and the ENSO phases, with El Niño corresponding to drier conditions and higher temperatures, complicating near-infrared observations.
Located on the northern edge of the Tibetan Plateau, the Lenghu site has been identified as an excellent location for optical and infrared observations [8]. The site is situated near Lenghu Town in Qinghai Province, atop Saishiteng Mountain, just 50 km from the town center, with the highest peak reaching an altitude of 4500 m. According to on-site seeing data collected so far, the median seeing is 0.80 arcseconds [9], and approximately 70% of nights are photometric (cloud-free observations which last for at least 6 h [10]). The modeled monthly average distribution of precipitable water vapor at Lenghu shows that 55% of the nighttime precipitable water vapor is below 2 mm. PWV values are high in summer and low in winter, indicating a distinct seasonal variation. A recent study by Li et al. [11] demonstrated that the significant reduction in observational time at Lenghu site during 2023 was primarily caused by the strong El Niño event.
We present a comparative analysis of three premier astronomical sites: Lenghu (93.896° E, 38.607° N, 4200 m asl), Mauna Kea (155.472° W, 19.826° N, 4200 m asl), and Paranal (70.404° W, 24.627° S, 2650 m asl). This systematic comparison serves three primary scientific objectives: first, to characterize the distinctive meteorological properties of the Lenghu site in relation to these well-established world-class observatories; second, to quantify the differential impacts of regional climate systems on observing conditions across sites; and third, to elucidate the relative contributions of global versus local climatic influences on astronomical observing parameters. Such multi-site comparative analyses provide critical benchmarks for the astronomical community, informing both future site selection processes and the development of climate adaptation strategies for existing observatory facilities.
In astronomical site selection, the most critical atmospheric parameters include astronomical seeing, precipitable water vapor, temperature, and cloud cover [3,12]. Previous studies have demonstrated a correlation between optical seeing and wind speed at the 200 hPa pressure level ( W 200 ) [13], while atmospheric extinction is closely associated with ozone absorption [14]. Previous studies at the Lenghu site reported that the best seeing occurs in spring to early summer, when W 200 reaches its minimum, while the worst seeing occurs in winter, when W 200 is stronger ([9]). Similarly, observations at the Muztagh-Ata site showed that better seeing conditions appear in May and October, whereas poorer seeing coincides with stronger upper-level winds in winter and summer [15]. Based on these established relationships, this study focuses on a comprehensive analysis of key meteorological parameters at three sites (Lenghu, Mauna Kea, and Paranal), including precipitable water vapor, temperature, W 200 , cloud cover (both total cloud cover and high cloud cover), and total column ozone. The data used in this work and the algorithm to derive precipitable water vapor are presented in Section 2. The analysis process and results are given in Section 3. Finally, the summary and conclusions are provided.

2. Materials and Methods

The dataset used in this study is ERA5, which is the fifth major atmospheric reanalysis produced by the European Centre for Medium-Range Weather Forecasts (ECMWF). The data is the follow-up product of ERA-Interim provided by the ECMWF [16]. ERA5 provides atmospheric parameters across 37 pressure layers with a high horizontal resolution of 0.25°× 0.25°. For all three sites (Lenghu, Mauna Kea, and Paranal), the nearest grid points from this dataset were adopted to ensure spatial consistency in our analysis. For more detailed information about the data, please refer to the ERA5 file specification document (https://confluence.ecmwf.int/display/CKB/ERA5%3A+data+documentation (accessed on 15 October 2025)).
To comprehensively assess the impacts of large-scale climate variability on astronomical observing conditions, we incorporate three key global climate indices into our analysis: the Niño 3.4 index (representing the ENSO), the Pacific Decadal Oscillation (PDO) index, and the Atlantic Multidecadal Oscillation (AMO) index. These well-established climate indicators enable us to systematically evaluate how different modes of climate variability influence the meteorological parameters at each site across various timescales. The ENSO index is the leading driver of interannual climate variability on Earth, with profound ecological and societal impacts. The Niño 3.4 index is the most commonly used index to define El Niño and La Niña events, and temporal evolution can mainly be captured using it [17]. The PDO index is the primary mode of variability in sea surface temperatures at the decadal scale in the North Pacific, significantly impacting the climate and ecosystems of the North Pacific and its surrounding regions [18]. The AMO index refers to basin-scale sea surface temperature anomalies in the North Atlantic region that exhibit multidecadal oscillations, most prominently observed on a timescale of 50–80 years [19]. The Niño 3.4 index and PDO data can be downloaded from the National Oceanic and Atmospheric Administration: National Centers for Environmental Information (https://www.ncei.noaa.gov/access/monitoring/products/ (accessed on 15 October 2025)), while the AMO data can be downloaded from the NSF (National Science Foundation) National Center for Atmospheric Research (https://climatedataguide.ucar.edu/climate-data/atlantic-multi-decadal-oscillation-amo (accessed on 15 October 2025)).
The meteorological parameters were directly retrieved from the ERA5 database, except for the precipitable water vapor (PWV), which should be calculated based on the altitude profile of specific humidity. For the calculation of PWV, we utilize the methodology outlined in the previous article [6], with the specific formula as follows:
P W V = 1 ρ g p m p z q d p + { ( p m Δ p m 2 p c ) q m , p c p m Δ p m 2 , ( p m 1 + Δ p m 1 2 p c ) q m 1 , p c < p m Δ p m 2 .
where ρ denotes the density of liquid water, g represents the acceleration of gravity, p c and p z denote the lower and upper pressure levels for integration, and q is the specific humidity. The parameters p z and q are obtainable from the data of ERA5. The lower boundary of integration, p c , corresponds to the pressure at each location and is calculated with the elevation data shown in Figure 1f, while the upper boundary, p z , corresponds to that of the reanalysis data. Due to potential mismatches between model levels and the pressure level at each site, additional pressure correction becomes necessary. Assuming p m represents the pressure level nearest to that at each location (the mth pressure level in the dataset with a minimum of zero) with a pressure thickness of Δ p m in the reanalysis data, q m and q m 1 represent the specific humidity at the mth and (m-1)th levels, respectively.

3. Results

3.1. Climate Variations at Lenghu Site Region

To investigate the connections between large-scale climate patterns and local meteorological parameters at the Lenghu site, we conducted a regional analysis focusing on the area spanning 82°–102° E and 31°–46° N near the Lenghu site. The parameters analyzed include PWV, temperature (Tem), zonal wind speed at 200 hPa ( V 200 ), meridional wind speed at 200 hPa ( U 200 ), and total cloud cover (TCC). To clearly show the anomalies in these parameters, we first calculated the average distributions of the five parameters during the 24 years (from 2000 to 2023) as reference distributions in the defined region. Then, these reference distributions were subtracted from the average distributions in each year to obtain the annual relative variations in the following sections. Note that all of the above calculations were based on nighttime data, defined as the period between the end of evening astronomical twilight and the beginning of morning astronomical twilight, when the Sun is more than 18° below the horizon. The averaged distributions of the PWV, Tem, V 200 , U 200 , and TCC in the Lenghu site region are shown in Figure 1. At the Lenghu site (marked by black stars in Figure 1), the 24-year averages of the five parameters are as follows: PWV = 3.17 mm, Tem = −4.52 °C, V 200 = −0.86 m s−1 (southward), U 200 = 31.81 m s−1 (westerly), and TCC = 0.42.
The climate and weather are closely related to the orography. Figure 1f shows the elevation of the region studied. The elevation data were obtained from the AW3D of the Japan Aerospace Exploration Agency (JAXA) with a spatial resolution of 1 arcsec (30 m) and an elevation accuracy of 1 m. The region of Saishiteng Mountain is marked by the white rectangle. As stated before, the Lenghu site is located on the northern edge of the Tibetan Plateau, and the elevation in the southern region is greater than 4500 m, while the elevation in the northern region is generally lower than 2000 m. Therefore, the PWV, Tem, and TCC are significantly modulated by the elevation (Figure 1a–c). Our results are generally consistent with previous studies [20,21], showing that the Tibetan Plateau exhibits overall low precipitable water vapor (PWV) content, with the lowest values occurring in high-altitude areas, providing favorable conditions for millimeter and submillimeter astronomical observations.
Averagely, the Lenghu site is located on the southern edge of the westerly in the Northern Hemisphere. The zonal wind dominates, and the meridional wind is very weak (Figure 1d,e). In the upper tropopause, the westerly jet stream travels around the Northern Hemisphere in mid-latitudes. In the Asian-Pacific regions, the East Asian Jet Stream (EAJS) is an important atmospheric circulation system over subtropical east Asia and the western Pacific [22]. Orography, land–sea thermal contrast, Hadley circulation, and tropical diabatic heating over the Maritime Continent and the western Pacific have been considered to force or exert the EAJS [23,24,25,26]. The seasonal shift in the EAJS marks an abrupt seasonal transition of the atmospheric circulation regimes in Asia [27]. Therefore, the coupling between the East Asian Monsoon/the western North Pacific Subtropical High/the ENSO and the EAJS has an effect on the climate in East Asia, especially on the precipitation over eastern China [28,29,30,31].
Figure 2, Figure 3, Figure 4 and Figure 5 show the annual relative variations in PWV, Tem, W 200 (wind speed at 200 hPa, W 200 = U 200 2 + V 200 2 ), and TCC in the Lenghu region (82°–102° E and 31°–46° N) from 2000 to 2023, respectively. Figure 2 shows that the PWV in the region around the Lenghu site has remained relatively stable over the past 24 years, with the median relative variation ranging from −0.27 to + 0.42 mm, and this is primarily determined by the arid desert climate in this region. During 2019–2023, the Lenghu site exhibited median PWV relative variations of + 0.04 mm (2019), −0.20 mm (2020), −0.02 mm (2021), + 0.24 mm (2022), and + 0.03 mm (2023). Generally, the PWV around the Lenghu site exhibited a pattern of increasing or decreasing with intervals of 2–3 years. Significant increases in PWV occurred around 2002, 2010, 2016, and 2022, closely related to the El Niño events. This pattern will be further elucidated in Section 3.3.
Figure 3 shows the annual relative variations in Tem in the Lenghu region (82°–102° E and 31°–46° N) from 2000 to 2023, with the median relative variation ranging from 0.77 °C to + 0.52 °C. During 2019–2023, the Lenghu site exhibited median Tem variations of 0.01 °C (2019), 0.08 °C (2020), + 0.19 °C (2021), + 0.52 °C (2022), and + 0.48 °C (2023). It is apparent that Tem experienced significant increases in 2022 and 2023. It is also clear that the occurrences of a annual positive anomaly in Tem are almost synchronous with those for PWV in Figure 2, indicating that the increase in Tem might be positively correlated with the PWV. This will be further demonstrated in the following section.
Figure 4 illustrates the annual relative variations in W 200 in the Lenghu region (82°–102° E and 31°–46° N) from 2000 to 2023, complemented by vector arrows depicting the relative changes in the wind field. The median relative variation in wind speed for the Lenghu site region ranges from −1.97 m s−1 to + 1.98 m s−1. During 2019–2023, the Lenghu site exhibited median wind speed variations of 0.90 m s−1 (2019), 0.80 m s−1 (2020), + 1.84 m s−1 (2021), + 0.22 m s−1 (2022), and 0.29 m s−1 (2023). A comparison between Figure 2 and Figure 4 shows that the large positive annual anomalies in PWV and Tem are closely related to the variations in the wind field. For example, during the years of 2002, 2010, 2016, and 2023, the wind field becomes different, and the directions of wind anomalies can be eastward, northward, or southward. For small or negative annual anomalies in PWV and Tem, the direction of the wind anomalies is westward-dominated.
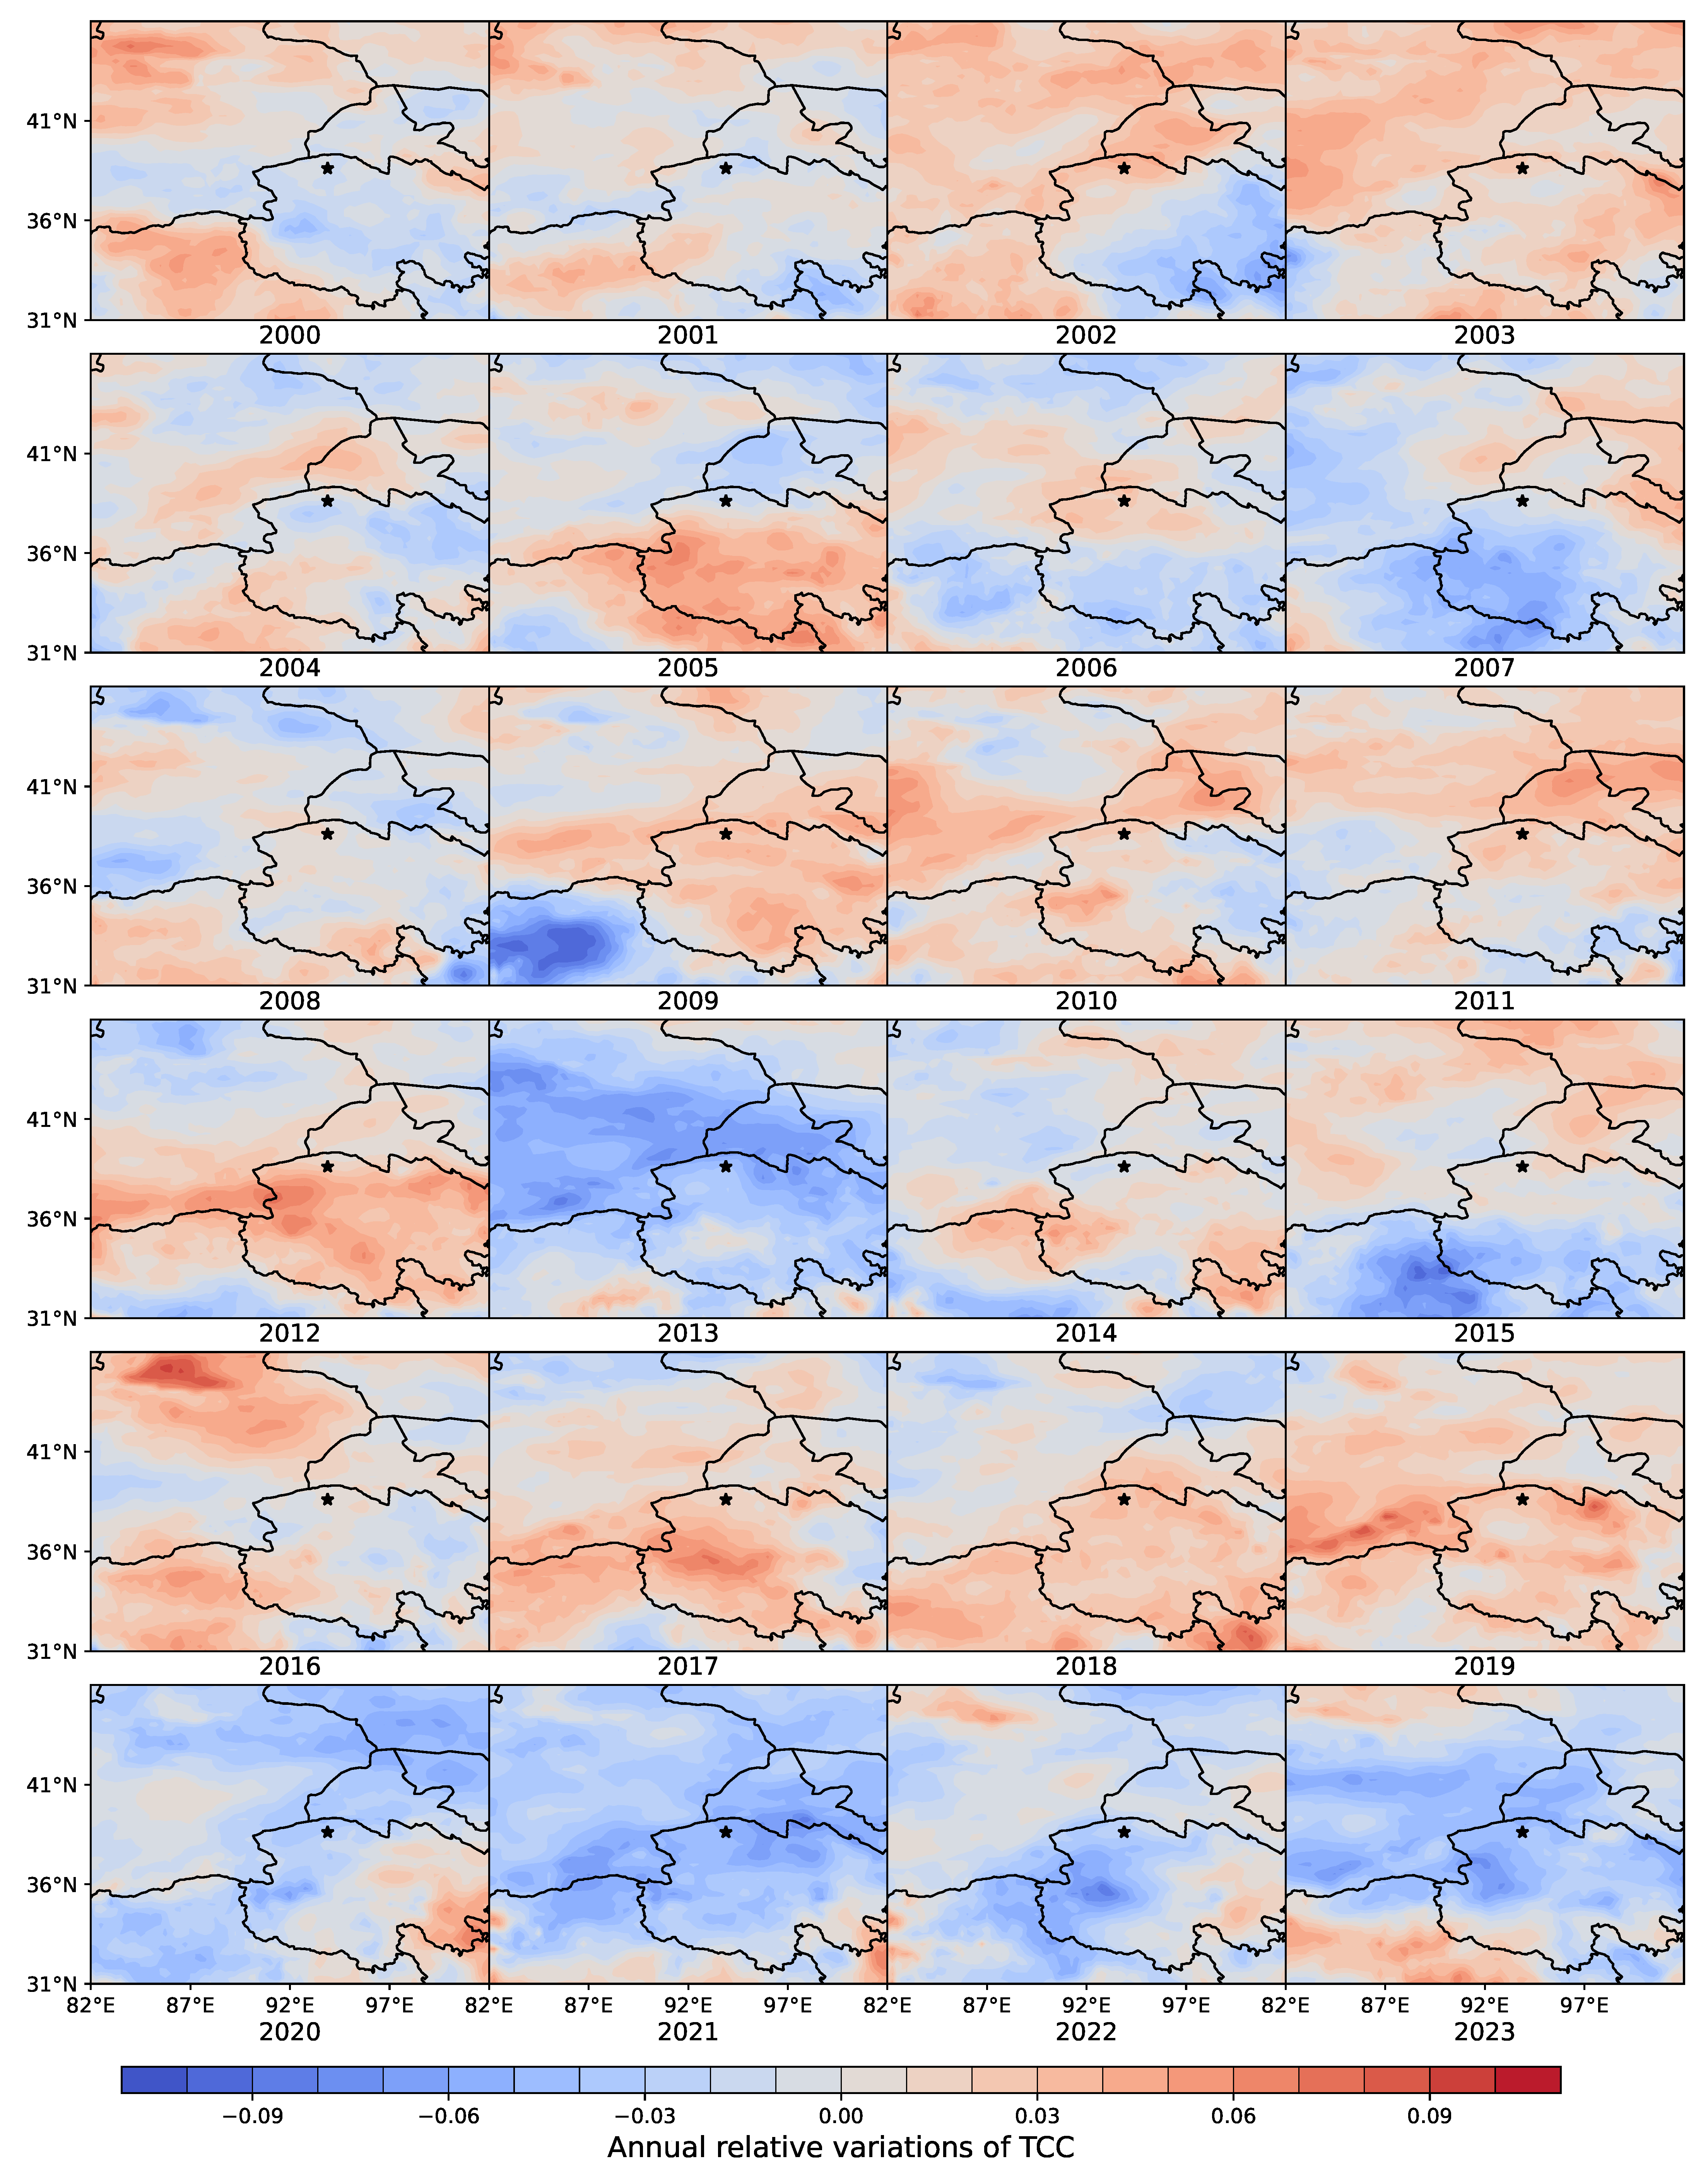
Figure 5 shows the annual relative variations in TCC in the Lenghu region (82°–102° E and 31°–46° N) from 2000 to 2023. The TCC in the Lenghu region remained relatively consistent over this period, with the median relative percentage variation ranging from −0.03 to + 0.03 . During 2019–2023, the Lenghu site exhibited median TCC variations of + 0.01 (2019), 0.02 (2020), 0.03 (2021), 0.01 (2022), and 0.02 (2023). The distribution patterns of TCC seem to be independent of the elevation and other meteorological parameters.

3.2. Seasonal Variations at Three Sites

For the analysis of seasonal variations in the meteorological parameters at three sites (Lenghu, Mauna Kea, and Paranal), we utilized ERA5 data spanning 34 years from 1990 to 2023. The parameters analyzed include PWV, Tem, W 200 , cloud cover (TCC for total cloud cover and HCC for high cloud cover), and total column ozone (TCO). The average values for these parameters were first calculated for each night. Then, all the nights in a specific month across all the years were averaged, and the standard deviations in each month were also calculated. The results are presented in Figure 6.
Most climatic parameters at all three sites exhibit distinct but differing seasonal variations, as shown in Figure 6. At Lenghu, both the PWV and Tem are maximized in July and minimized in January. The difference in the PWV between summer and winter is about 6 mm. There are five months (January, February, March, November, and December) with PWV lower than 2 mm and a nighttime Tem value lower than −10 °C, indicating that these months are more suitable for observations in infrared. At Mauna Kea, the value for PWV is maintained between 2 and 3 mm throughout the year without a significant seasonal variation. At Paranal, the seasonal trend is opposite to that at Lenghu since the two sites are located in different hemispheres. The PWV at Paranal is maintained at a value above 2 mm through out the year. Due to the lower latitudes at Mauna Kea and Paranal, the night Tem at the two sites is obviously higher than that at Lenghu and but with annual changes of less than 5 °C in one year.
The W 200 wind speed has three peaks in January, June, and September, indicating that the wind speed at Lenghu might exhibit a period of approximately 3–4 months. Such a trend is totally different to those in Mauna Kea and Paranal, where the W 200 wind speed has just one peak. The maximum variation in wind speed during one year is ∼10 m s−1 at Lenghu, which is approximately half those at Mauna Kea and Paranal.
Apparently, the TCC at Paranal is generally lower than that at Lenghu and Mauna Kea. Both TCC and HCC are high before July and low after July at Lenghu. The HCC at Lenghu is higher than that at Mauna Kea and Paranal, especially before July, implying that the TCC at Lenghu might mainly be contributed by upper clouds. The TCC and HCC at both Mauna Kea and Paranal exhibit a double-peak signature but with different phases. The seasonal variation in TCO is similar to a sinusoidal curve at the three sites but with different phases, indicating the influence of different climate patterns [32]. A higher TCO possibly indicates lower ultraviolet transmission due to the stronger absorption by ozone.

3.3. Long-Term Trends at Three Sites

3.3.1. Periodic Characteristics of Meteorological Parameters

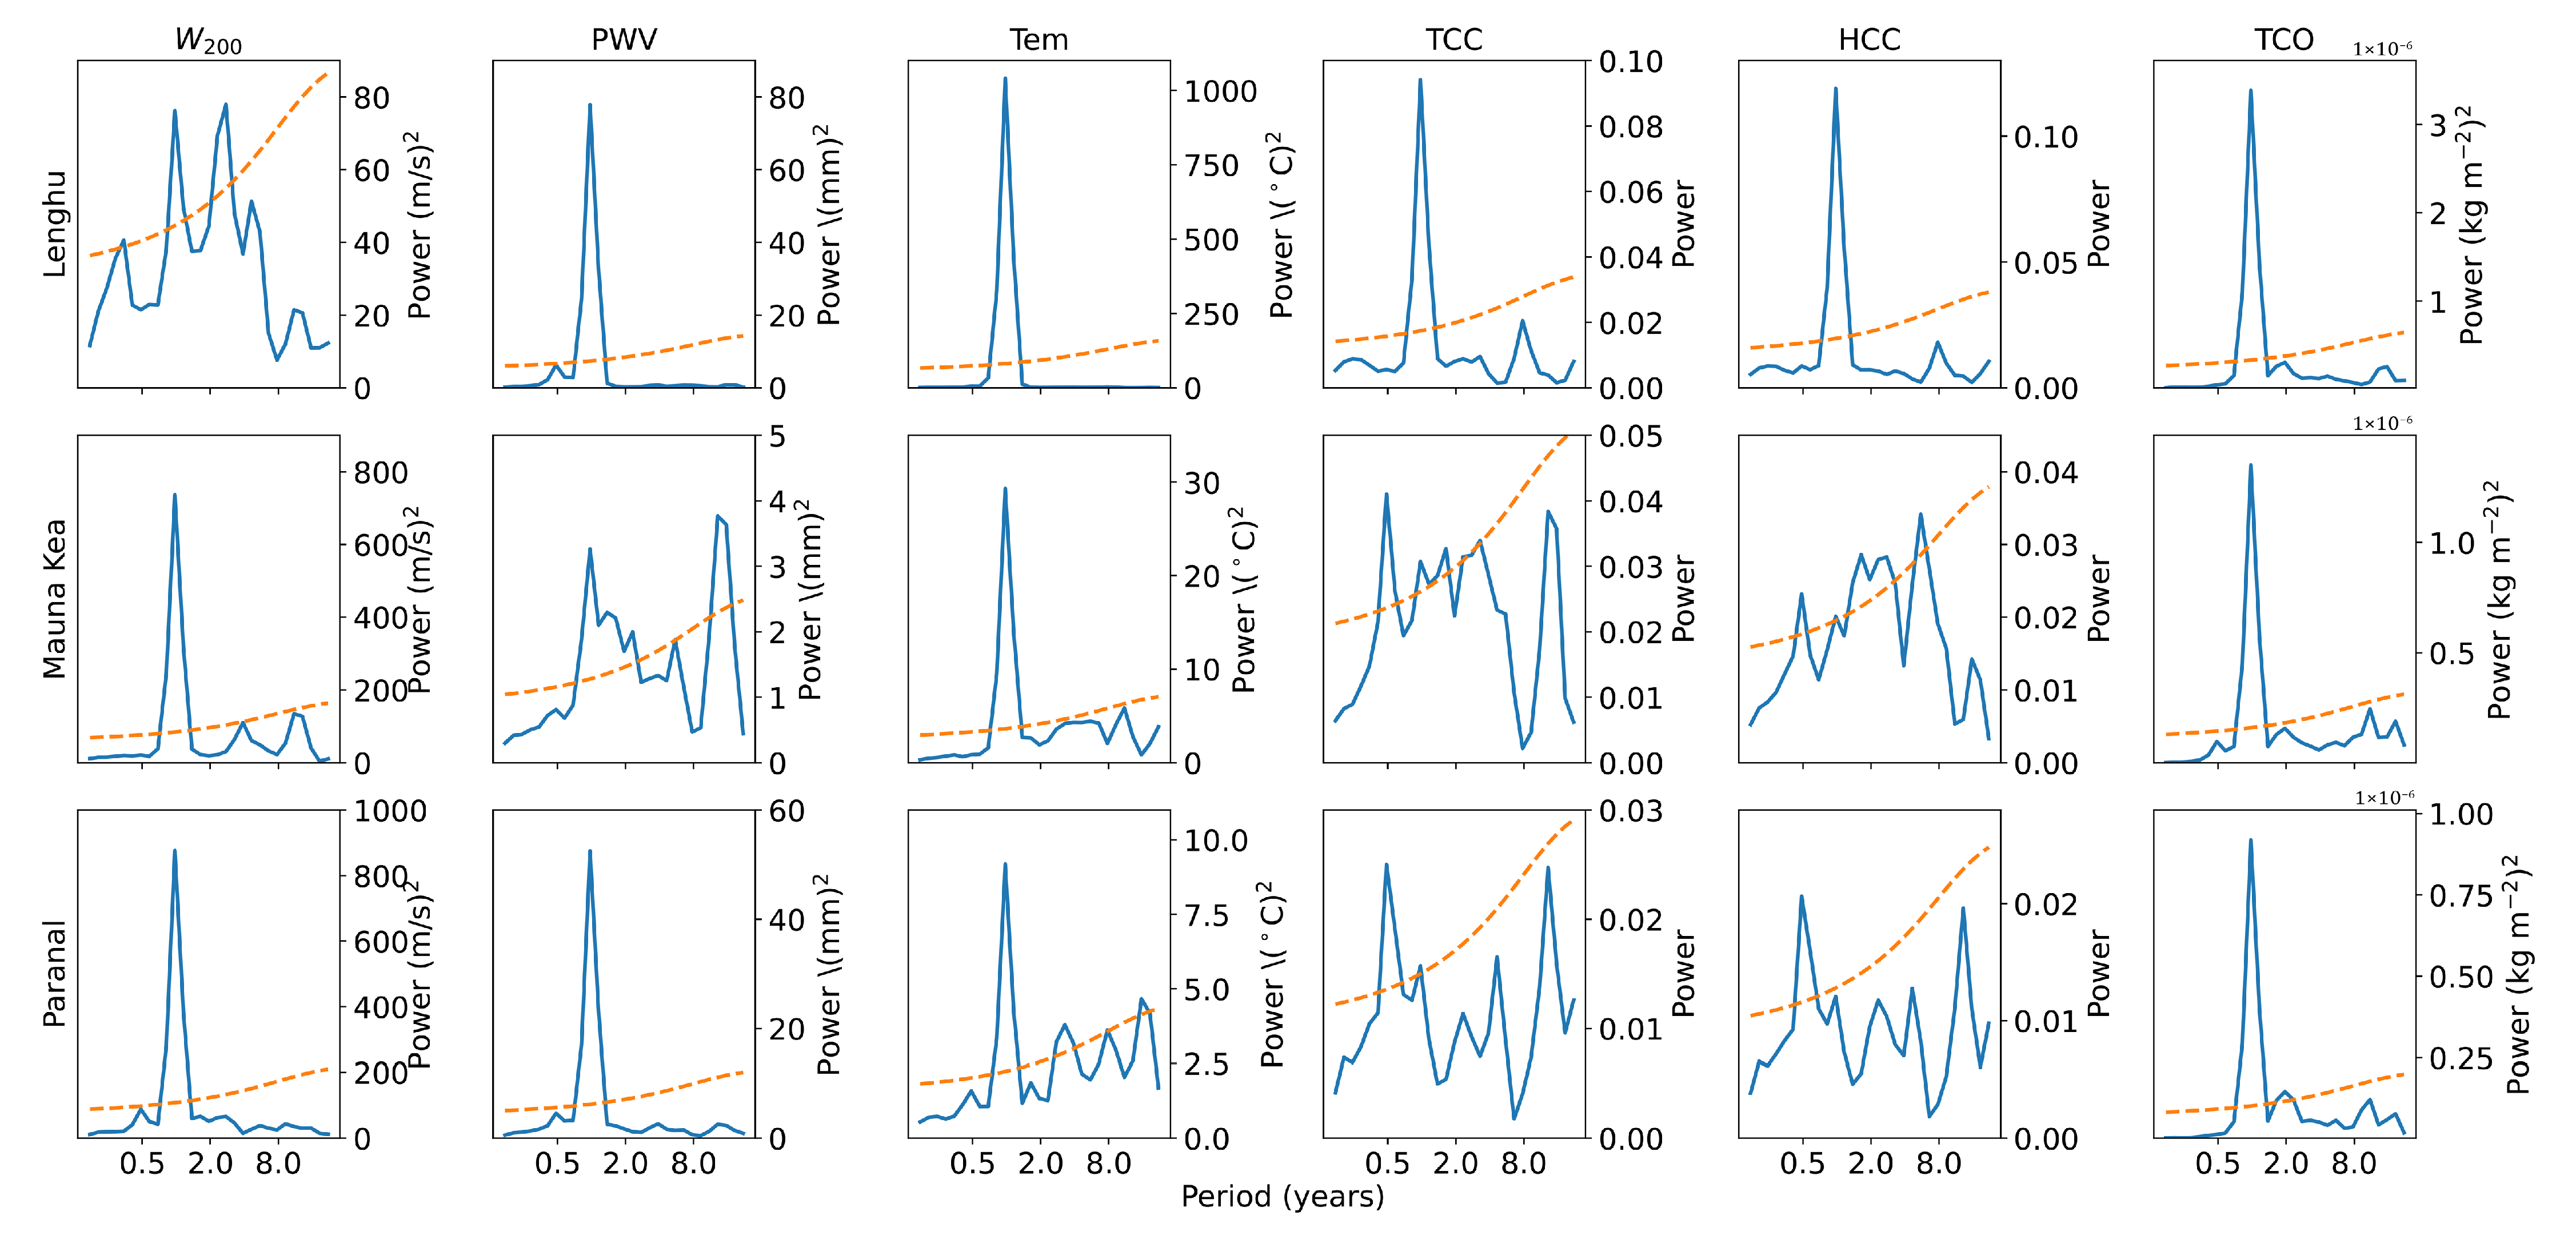
In this section, the nighttime monthly average series of PWV, Tem, W 200 , TCC, HCC, and TCO from 1990 to 2023 are used to analyze the periodic variations in the meteorological parameters at the Lenghu, Mauna Kea, and Paranal sites. The method of analysis was the Morlet wavelet transform. The power spectral densities are shown in Figure 7. All of the parameters (except for the TCC and HCC at Mauna Kea and Paranal) show a significant period at 1 year with confidence levels all above 95%, consistent with the seasonal variations shown in Figure 6. But the parameters at different sites also show different periodicities.
For W 200 at the Lenghu site, two periods at 0.3 years and 3 years are also observed, both above the confidence level of 95%. Both the TCC and HCC at Lenghu site show a period of 8 years, although slightly below the confidence level. Such weak periodicity might be caused by the 8-year period in solar activity [33,34,35,36], which could modulate cosmic ray intensity and thus affect the formation of clouds [37,38]. However, linking the 8-year cycle to solar activity is just a speculation; the specific mechanisms according to which solar activity modulates the climate require in-depth study and fall outside the scope of this paper. Both the TCC and HCC at Mauna Kea and Paranal show a significant period at 0.5 years, consistent with the double-peak seasonal variations shown in Figure 6. Regardless, the periodicities of the TCC and HCC at Mauna Kea and Paranal are the most complex compared with other parameters.
Ground-based observations in the infrared suffer from the background noise created by the radiation from the telescope structure and components. Hence, winter Tem variations are very important for the Lenghu site. Since the minimum Tem at the Lenghu site occurs in January in each year (Figure 6), we selected the Tem data for January of each year at the Lenghu site and analyzed it using the Morlet wavelet transform. It is shown that the predominant period for winter Tem is ∼4 years (Figure 8). There are also two longer periods at approximately ∼8 years and ∼16 years; however, these peaks are weak and do not reach the standard significance level (e.g., 95% confidence). These periods correspond well with the 3–4-year, 6–8-year, and 18-year periods in the East Asian winter monsoon index [39]. This indicates that the interannual and interdecadal variations in the East Asian winter monsoon might control the winter Tem variations at the Lenghu site. Equally, the changing Indian monsoon [40] might also influence the climate at Lenghu. During monsoon season, especially for the southwest monsoon (June to September), more water vapor can be transported to the Tibetan Plateau through the west edge, where this water vapor merges with the westerly and impacts the weather at Lenghu. The combined actions of the East Asian monsoon and the Indian monsoon, as well as global climate change, make the climate pattern at the Lenghu site become complex.

3.3.2. The Weighted Annual Mean Series from 1990 to 2023

Following our previously established methodology (Zhao et al. [6]), the weighted annual means were calculated with enhanced handling of the seasonal variability and observational limits. The specific formula is as follows:
X w a m = y e a r X t w i × ( t e n d t b e g ) t t o t a l
where X t w i represents the mean meteorological parameters (PWV, Tem, W 200 , TCC, HCC, and TCO) during each astronomical night, while t b e g and t e n d represent the beginning and end of astronomical night. The total observation time t t o t a l is the sum of the astronomical night in a year.
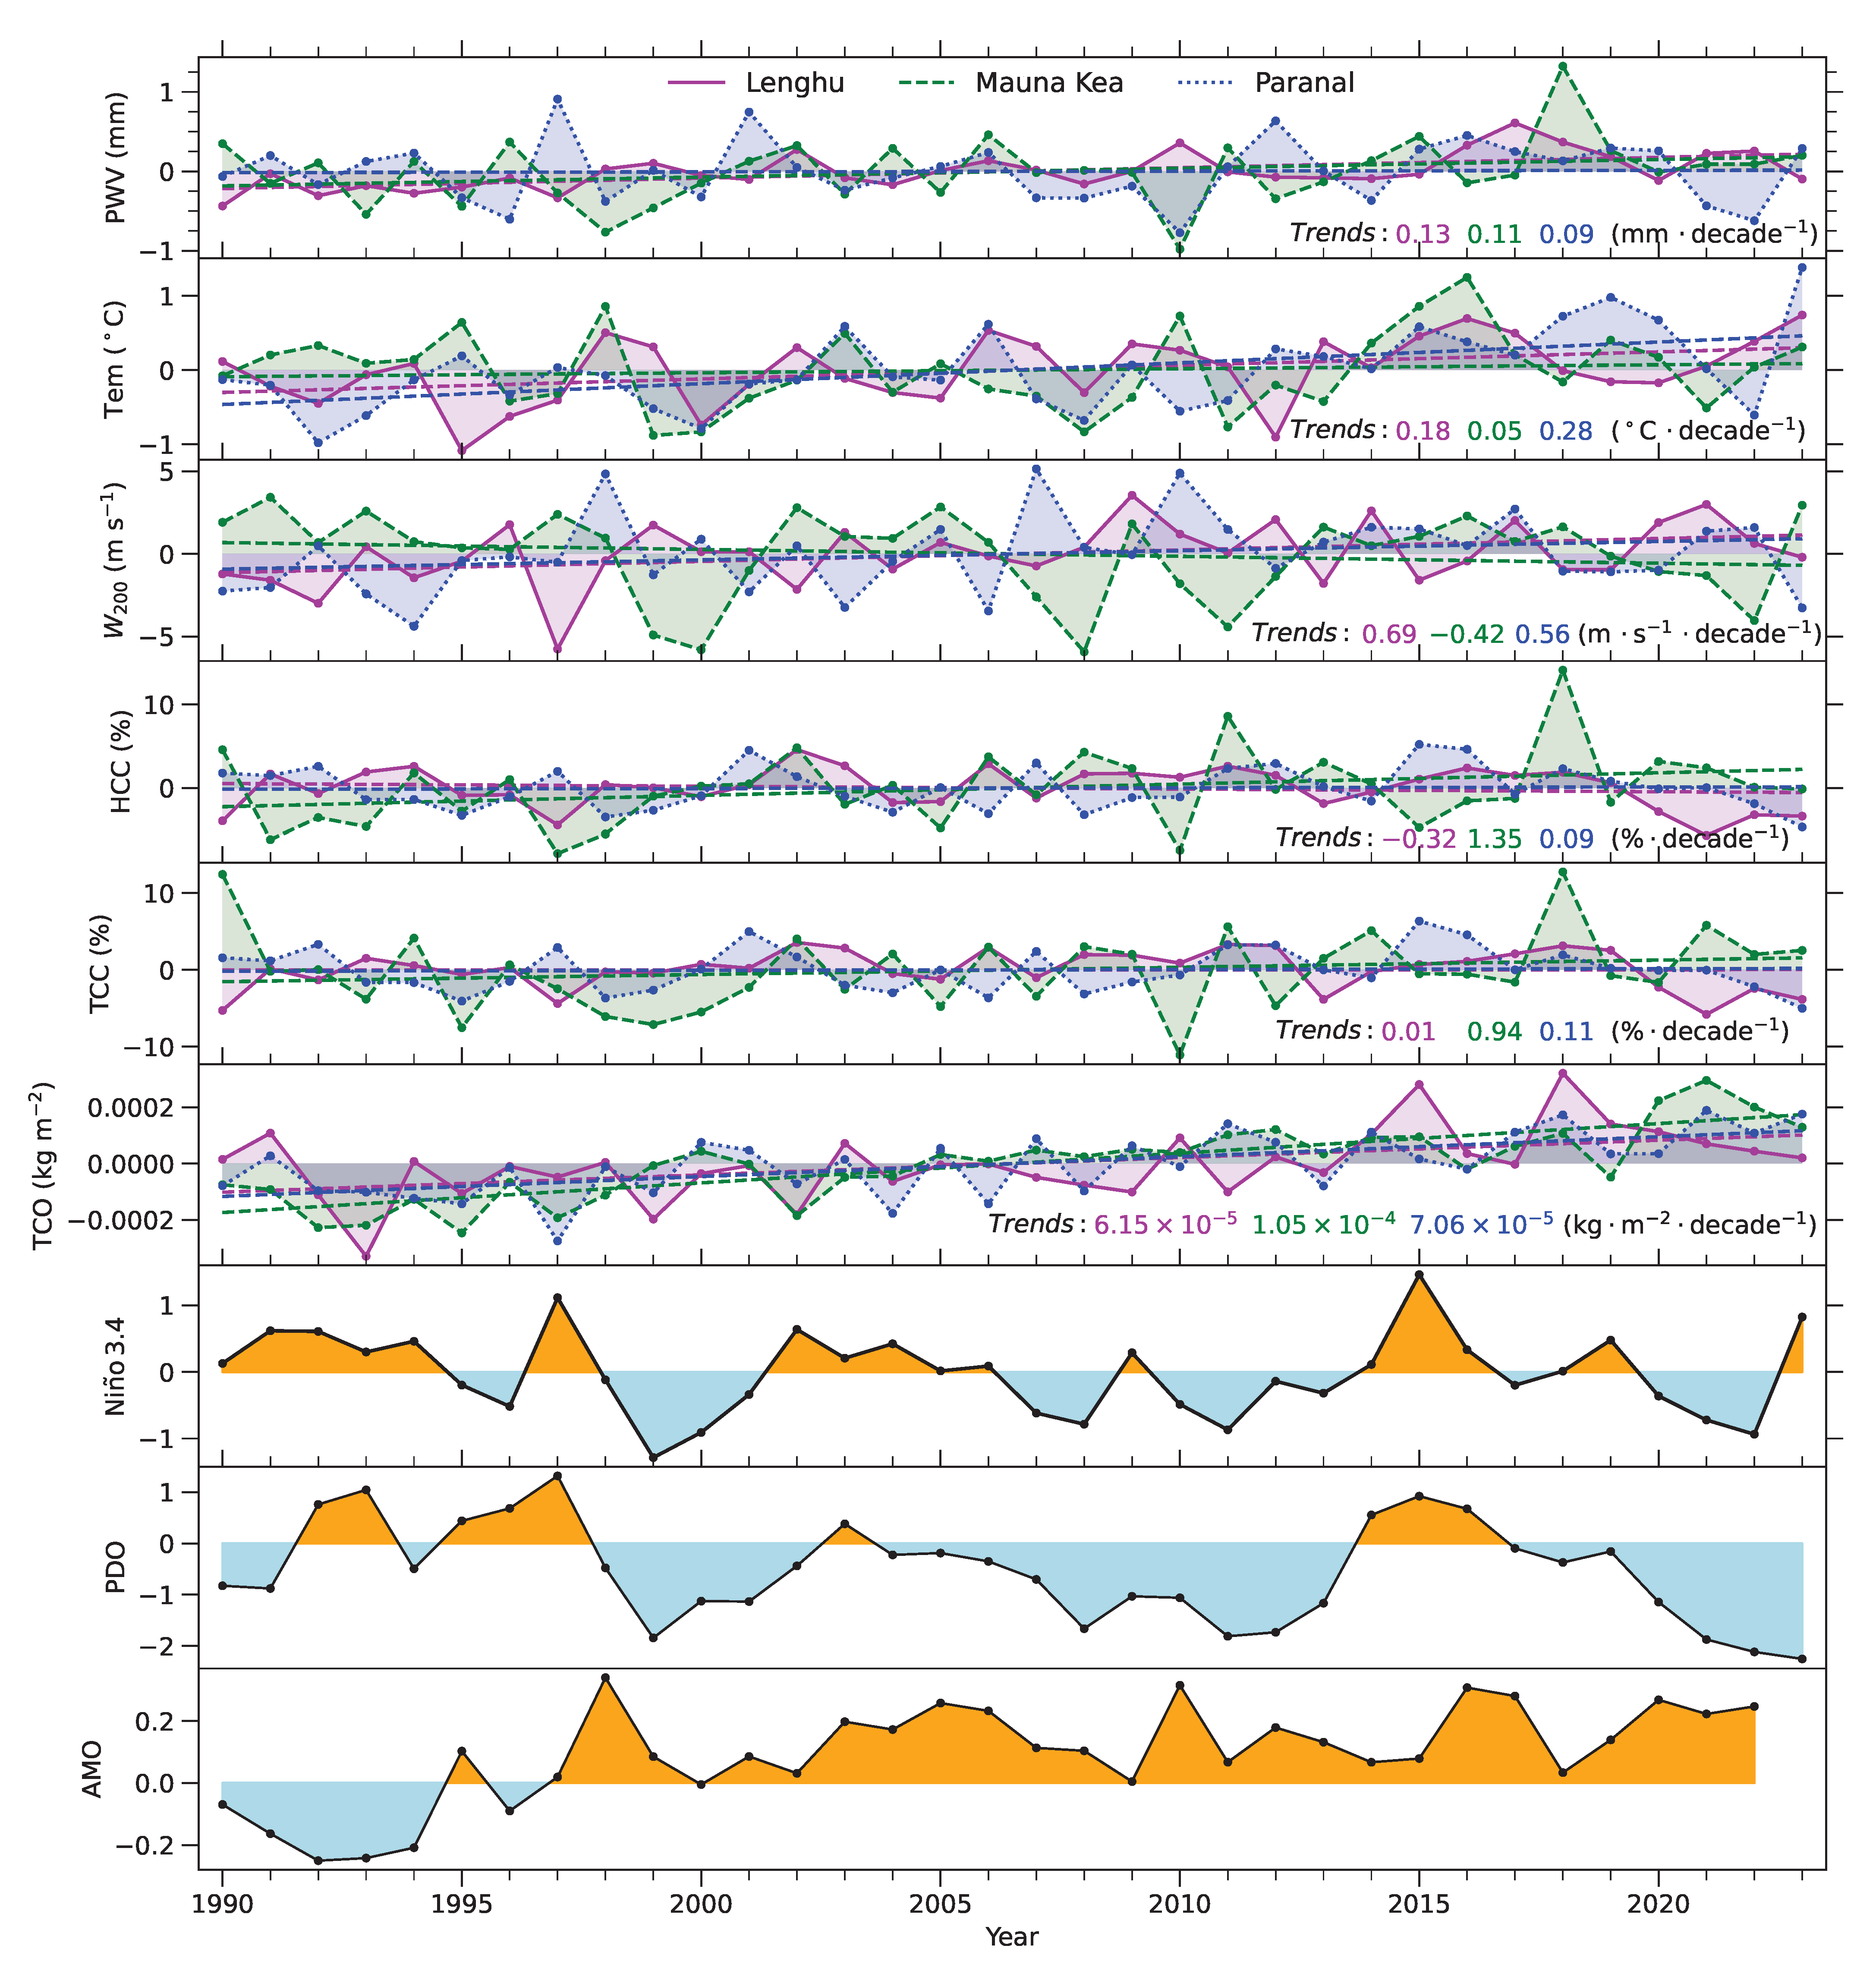
Following the calculation of the annual weighted means for each meteorological parameter (PWV, Tem, W 200 , TCC, HCC, and TCO) at all three sites (Lenghu, Mauna Kea, and Paranal), we derived anomalies by subtracting the 1990–2023 baseline averages. Figure 9 displays these parameter anomalies with fitted trends (including slope values) alongside concurrent ENSO (Niño 3.4), PDO, and AMO index anomalies for the study period. The analysis reveals distinct trends across the three sites during the 34-year period. For PWV, all sites show consistent positive trends with comparable decadal rates (Lenghu: 0.13 mm; Mauna Kea: 0.11 mm; Paranal: 0.09 mm). Tem exhibits universal warming, though with notable site-to-site variations, and Paranal demonstrates the most significant increase (0.28 °C decade−1), followed by Lenghu (0.18 °C decade−1) and Mauna Kea (0.05 °C decade−1). W 200 displays contrasting behavior, increasing at both Lenghu (0.69 m s−1 decade−1) and Paranal (0.56 m s−1 decade−1) but decreasing at Mauna Kea ( 0.42 m s−1 decade−1). The cloud cover trends diverge substantially: Lenghu shows decreasing HCC ( 0.32 % decade−1) with stable TCC (0.01 % decade−1), and Mauna Kea reveals increases in both HCC (1.35 % decade−1) and TCC (0.94% decade−1), while Paranal displays modest rises in HCC (0.09% decade−1) and TCC (0.11 % decade−1). Finally, the TCO concentrations exhibit positive trends at all sites, ranging from 6.15 × 10⁻⁵ kg m −2 decade−1 at Lenghu to 1.05 × 10⁻⁴ kg m −1 decade−1 at Mauna Kea.
We further calculated the correlation coefficients between the meteorological parameters and the ENSO, PDO, and AMO indices at the three sites (Lenghu, Mauna Kea, and Paranal), as summarized in Table 1. The main findings are that both the ENSO/PDO are negatively correlated with wind speed W 200 , and the AMO index is positively correlated with PWV and W 200 at the Lenghu site. At the Mauna Kea site, however, both the ENSO and PDO are positively correlated with wind speed W 200 and Tem, while the AMO index is just positively correlated with TCO. It is natural to understand that the warming of the tropic Pacific will lead to an increased near-surface air temperature. At the Paranal site, the correlations of all meteorological parameters with the climate indices are not so significant. It is apparent that wind speed variations are closely related to all climate indices, possibly because either the ENSO, PDO, or AMO might change the global circulation. Cloud (TCC and HCC) is not significantly correlated with any of these indices, indicating that the variation in cloud cover might be influenced by multiple parameters. Figure 9 also shows that although the impacts of climate factors on these site are common, their responses and durations vary, possibly due to interaction between the local microclimate and the global climate.
The above correlation analysis indicates that the long-term variation characteristics of the meteorological parameters are not controlled by a single climate factor in a single region. Taking the Lenghu site as an example, multiple factors may influence climate change at the Lenghu site, such as the East Asian summer monsoon, the East Asian winter monsoon, the Indian monsoon, and the westerly jet stream. The interconnection patterns, such as the Pacific–East Asia teleconnection [41] and the North Atlantic–East Asia teleconnection [42], may significantly contribute to the complex interannual and interdecadal variations in the meteorological parameters. Similar teleconnections might also occur at Mauna Kea and Paranal but with different sources.

4. Discussion and Conclusions

In this paper, we conducted a comprehensive analysis of the long-term variations in meteorological parameters at the Lenghu site, including the annual mean changes near the Lenghu site, seasonal variations, periodic analysis, abnormal variations, and correlations between the ENSO/PDO/AMO indices. A comparison between the Lenghu site and other two well-known sites at Mauna Kea and Paranal was also conducted.
Through the analysis of the relative changes in meteorological parameters (PWV, Tem, W 200 , and TCC) near the Lenghu site (82°–102° E and 31°–46° N) from 2000 to 2023, we found that these parameters have remained relatively stable over the past two decades. The median values of the relative changes were between −0.27 (5.2%) and + 0.42 (13.8%) mm for PWV, −0.77 °C (25.3%) and + 0.52 °C (17.1%) for Tem, −1.97 (6.5%) m s−1 and + 1.98 m s−1 (6.6%) for W 200 , and −0.03 (6.5%) and + 0.03 (6.5%) for TCC.
The seasonal analysis of the meteorological parameters (PWV, Tem, W 200 , TCC, HCC, and TCO) at the three sites (Lenghu, Mauna Kea, and Paranal) during 1990–2023 indicates that most parameters exhibit distinct seasonal variations with site-specific characteristics. PWV and Tem at Mauna Kea show no significant seasonal cycle; nor does Tem at Paranal. The seasonal variations in PWV at Lenghu and Paranal occur in opposite phases.
Wavelet analysis of the monthly averaged meteorological parameters at the three sites (Lenghu, Mauna Kea, and Paranal) during 1990–2023 revealed several significant periodicities. All parameters demonstrated a prominent 1-year cycle (confidence levels above 95%), with the exception of TCC and HCC at both Mauna Kea and Paranal. W 200 at the Lenghu site showed additional significant oscillations at the 0.3-year and 3-year timescales (both exceeding 95% confidence). In contrast, TCC and HCC at both Mauna Kea and Paranal sites reveal a distinct 0.5-year period. Furthermore, the predominant periodicity for winter Tem at Lenghu is approximately 4 years, possibly controlled by the East Asian winter monsoon.
Our 34-year analysis reveals distinct climatic patterns at the three sites (Lenghu, Mauna Kea, Paranal). All sites exhibited consistent increases in PWV (0.09–0.13 mm decade−1), indicating potential global-scale influences. The Tem trends showed regional variability, with Paranal experiencing the most rapid warming (0.28 °C decade−1), followed by Lenghu (0.18 °C decade−1), while Mauna Kea showed minimal change (0.05 °C decade−1). Atmospheric circulation patterns demonstrated strong site dependence, particularly in W 200 , which decreased at Mauna Kea ( 0.42 m s−1 decade−1) but increased at both Lenghu (0.69 m s−1 decade−1) and Paranal (0.56 m s−1 decade−1). Cloud cover variations exhibited the most localized responses: high cloud cover (HCC) decreased at Lenghu ( 0.32 % decade−1) but increased substantially at Mauna Kea (1.35% decade−1), with Paranal showing more moderate changes (0.09% decade−1).
We also calculated the weighted annual mean of the meteorological parameters at the Lenghu site and conducted a correlation analysis between the ENSO, PDO, and AMO indices. The results indicated a strong negative correlation between the ENSO/PDO and W 200 , a positive correlation between the AMO index and PWV, and positive correlations between the AMO index and W 200 , Tem, and TCO at the Lenghu site. Further systematic data analysis and simulation works are essential to understand and predict the meteorological parameters at the Lenghu site, which are essential for future planning and operation of large telescopes at Lenghu. Other astronomical sites might also face impacts from climate change similar to those at Lenghu.
From a long-term perspective, the PWV and temperature at these observatory sites are both increasing, which may potentially affect future infrared-band observations. At the short-term scale, global climate change patterns can influence the observing conditions at these sites. Therefore, long-term planning for astronomical observations should closely monitor global climate change.

Author Contributions

Conceptualization: F.H. and L.D.; methodology: Y.Z., F.H. and L.D.; software: Y.Z. and F.H.; validation: Y.Z., R.L. and F.Y.; formal analysis: Y.Z. and F.H.; investigation: Y.Z. and F.H.; resources: Y.Z.; data curation: Y.Z.; writing—original draft preparation: Y.Z.; writing—review and editing: F.H. and L.D.; visualization: F.H.; supervision: Y.Z.; project administration: F.H.; funding acquisition: F.H. All authors have read and agreed to the published version of the manuscript.

Funding

This work was supported by the National Natural Science Foundation of China (12233009, 42222408, 42304188).

Institutional Review Board Statement

Not applicable.

Informed Consent Statement

Not applicable.

Data Availability Statement

The ERA5 reanalysis data utilized in this study were obtained from the Copernicus Climate Data Store (https://cds.climate.copernicus.eu/cdsapp#!/dataset/reanalysis-era5-pressure-levels (accessed on 15 October 2025)). The topographic data presented in Figure 1f were derived from the AW3D dataset, which is freely accessible after registration through the JAXA Earth Observation Research Center (https://www.eorc.jaxa.jp/ALOS/en/aw3d30/data/index.htm (accessed on 15 October 2025)).

Acknowledgments

We are grateful for the reviewer’s time and feedback.

Conflicts of Interest

The authors declare no conflicts of interest.

References

  1. van Kooten, M.A.M.; Izett, J.G. Climate Change and Astronomy: A Look at Long-term Trends on Maunakea. Publ. Astron. Soc. Pac. 2022, 134, 095001. [Google Scholar] [CrossRef]
  2. Cantalloube, F.; Milli, J.; Böhm, C.; Crewell, S.; Navarrete, J.; Rehfeld, K.; Sarazin, M.; Sommani, A. The impact of climate change on astronomical observations. Nat. Astron. 2020, 4, 826–829. [Google Scholar] [CrossRef]
  3. Schöck, M.; Els, S.; Riddle, R.; Skidmore, W.; Travouillon, T.; Blum, R.; Bustos, E.; Chanan, G.; Djorgovski, S.G.; Gillett, P.; et al. Thirty Meter Telescope Site Testing I: Overview. Publ. Astron. Soc. Pac. 2009, 121, 384. [Google Scholar] [CrossRef]
  4. Seidel, J.V.; Otarola, A.; Théron, V. On the Impact of ENSO Cycles and Climate Change on Telescope Sites in Northern Chile. Atmosphere 2023, 14, 1511. [Google Scholar] [CrossRef]
  5. Haas, M.R.; Pfister, L. A High-Altitude Site Survey for SOFIA. Publ. Astron. Soc. Pac. 1998, 110, 339–364. [Google Scholar] [CrossRef]
  6. Zhao, Y.; Yang, F.; Chen, X.; Zhang, X.; Ma, J.; Kong, X.; Fu, X.; Li, R.; Wei, Y.; Yao, Z.; et al. Long-term variations in precipitable water vapor and temperature at Lenghu Site. Astron. Astrophys. 2022, 663, A34. [Google Scholar] [CrossRef]
  7. Bolbasova, L.A.; Kopylov, E.A. Long-Term Trends of Astroclimatic Parameters above the Terskol Observatory. Atmosphere 2023, 14, 1264. [Google Scholar] [CrossRef]
  8. Deng, L.; Yang, F.; Chen, X.; He, F.; Liu, Q.; Zhang, B.; Zhang, C.; Wang, K.; Liu, N.; Ren, A.; et al. Lenghu on the Tibetan Plateau as an astronomical observing site. Nature 2021, 596, 353–356. [Google Scholar] [CrossRef] [PubMed]
  9. Zhu, L.; Zhang, H.; Sun, G.; Li, X.; Yang, F.; He, F.; Weng, N.; Deng, L. Astronomical seeing and wind speed distributions with ERA5 data at Lenghu site on the Tibetan Plateau. Mon. Not. R. Astron. Soc. 2023, 522, 1419–1427. [Google Scholar] [CrossRef]
  10. Zhang, J.C.; Ge, L.; Lu, X.M.; Cao, Z.H.; Chen, X.; Mao, Y.N.; Jiang, X.J. Astronomical Observing Conditions at Xinglong Observatory from 2007 to 2014. Publ. Astron. Soc. Pac. 2015, 127, 1292. [Google Scholar] [CrossRef]
  11. Li, R.; He, F.; Deng, L.; Chen, X.; Yang, F.; Zhao, Y.; Zhang, B.; Zhang, C.; Yang, C.; Lan, T. The cloud cover and meteorological parameters at the Lenghu site on the Tibetan Plateau. Mon. Not. R. Astron. Soc. 2024, 535, 1278–1292. [Google Scholar] [CrossRef]
  12. Vernin, J.; Muñoz-Tuñón, C.; Sarazin, M.; Vazquez Ramió, H.; Varela, A.M.; Trinquet, H.; Delgado, J.M.; Jiménez Fuensalida, J.; Reyes, M.; Benhida, A.; et al. European Extremely Large Telescope Site Characterization I: Overview. Publ. Astron. Soc. Pac. 2011, 123, 1334. [Google Scholar] [CrossRef]
  13. Hellemeier, J.A.; Yang, R.; Sarazin, M.; Hickson, P. Weather at selected astronomical sites—An overview of five atmospheric parameters. Mon. Not. R. Astron. Soc. 2019, 482, 4941–4950. [Google Scholar] [CrossRef]
  14. Patat, F.; Moehler, S.; O’Brien, K.; Pompei, E.; Bensby, T.; Carraro, G.; de Ugarte Postigo, A.; Fox, A.; Gavignaud, I.; James, G.; et al. Optical atmospheric extinction over Cerro Paranal. Astron. Astrophys. 2011, 527, A91. [Google Scholar] [CrossRef]
  15. Zhang, J.; Zhao, Y.; Esamdin, A.; Niu, H.; Gao, J.; Zibibula, R.; Bai, C.; Zhang, X.; Feng, G.; Lin, L.; et al. Astronomical seeing with DIMM and wind-speed distributions with ERA5 data at the Muztagh-Ata site on the Pamir Plateau. Mon. Not. R. Astron. Soc. 2025, 539, 2077–2087. [Google Scholar] [CrossRef]
  16. Hersbach, H.; Bell, B.; Berrisford, P.; Hirahara, S.; Horányi, A.; Muñoz-Sabater, J.; Nicolas, J.; Peubey, C.; Radu, R.; Schepers, D.; et al. The ERA5 global reanalysis. Q. J. R. Meteorol. Soc. 2020, 146, 1999–2049. [Google Scholar] [CrossRef]
  17. Tippett, M.K.; L’Heureux, M.L.; Becker, E.J.; Kumar, A. Excessive Momentum and False Alarms in Late-Spring ENSO Forecasts. Geophys. Res. Lett. 2020, 47, e87008. [Google Scholar] [CrossRef]
  18. Mantua, N.J.; Hare, S.R.; Zhang, Y.; Wallace, J.M.; Francis, R.C. A Pacific Interdecadal Climate Oscillation with Impacts on Salmon Production. Bull. Am. Meteorol. Soc. 1997, 78, 1069–1079. [Google Scholar] [CrossRef]
  19. Lin, J.; Qian, T. The Atlantic Multi-Decadal Oscillation. Atmosphere-Ocean 2022, 60, 1–31. [Google Scholar] [CrossRef]
  20. Shikhovtsev, A.Y.; Kovadlo, P.G.; Baron, P. Candidate Sites for Millimeter and Submillimeter Ground-Based Telescopes: Atmospheric Rating for the Eurasian Submillimeter Telescopes Project. Sensors 2025, 25, 2144. [Google Scholar] [CrossRef]
  21. Qian, X.; Yao, Y.; Zou, L.; Wang, H.; Yin, J. An Empirical Model for Estimating Precipitable Water Vapor on the Tibetan Plateau. Publ. Astron. Soc. Pac. 2019, 131, 125001. [Google Scholar] [CrossRef]
  22. Yang, S.; Lau, K.M.; Kim, K.M. Variations of the East Asian Jet Stream and Asian-Pacific-American Winter Climate Anomalies. J. Clim. 2002, 15, 306–325. [Google Scholar] [CrossRef]
  23. Huang, R.h.; Gambo, K. The Response of a Hemispheric Multi-Level Model Atmosphere to Forcing by Topography and Stationary Heat Sources (I) Forcing by Topography. J. Meteorol. Soc. Jpn. 1982, 60, 78–92. [Google Scholar] [CrossRef]
  24. Wallace, J.M. The climatological mean stationary waves: Observational evidence. In Large-Scale Dynamical Processes in the Atmosphere; Hoskins, B., Pearce, R., Eds.; Academic Press: New York, NY, USA, 2001; p. 27. [Google Scholar]
  25. Bjerknes, J. A possible response of the atmospheric Hadley circulation to equatorial anomalies of ocean temperature. Tellus 1966, 18, 820. [Google Scholar] [CrossRef]
  26. Hoskins, B.J.; Karoly, D.J. The Steady Linear Response of a Spherical Atmosphere to Thermal and Orographic Forcing. J. Atmos. Sci. 1981, 38, 1179–1196. [Google Scholar] [CrossRef]
  27. Yeh, T.C.; Dao, S.J.; Li, M.T. The abrupt change of circulation over the Northern Hemisphere during June and October. In The Atmosphere and the Sea in Motion; The Rockefeller Institute Press: New York, NY, USA, 1959. [Google Scholar]
  28. Lau, K.M.; Weng, H. Recurrent Teleconnection Patterns Linking Summertime Precipitation Variability over East Asia and North America. J. Meteorol. Soc. Jpn. 2002, 80, 1309–1324. [Google Scholar] [CrossRef]
  29. Liang, X.Z.; Wang, W.C.; Samel, A.N. Biases in AMIP model simulations of the east China monsoon system. Clim. Dyn. 2001, 17, 291–304. [Google Scholar] [CrossRef]
  30. Zhu, Y.L.; Wang, H.; Zhou, W.; Ma, J. Recent changes in the summer precipitation pattern in East China and the background circulation. Clim. Dyn. 2011, 36, 1463–1473. [Google Scholar] [CrossRef]
  31. Wang, W.; Zhou, W.; Wang, X.; Fong, S.; Leong, K. Summer high temperature extremes in Southeast China associated with the East Asian jet stream and circumglobal teleconnection. J. Geophys. Res. 2013, 118, 8306–8319. [Google Scholar] [CrossRef]
  32. Ziemke, J.R.; Chandra, S.; Labow, G.J.; Bhartia, P.K.; Froidevaux, L.; Witte, J.C. A global climatology of tropospheric and stratospheric ozone derived from Aura OMI and MLS measurements. Atmos. Chem. Phys. 2011, 11, 9237–9251. [Google Scholar] [CrossRef]
  33. Krivova, N.A.; Solanki, S.K. The 1.3-year and 156-day periodicities in sunspot data: Wavelet analysis suggests a common origin. Astron. Astrophys. 2002, 394, 701–706. [Google Scholar] [CrossRef]
  34. Zhu, F.R.; Jia, H.Y. Lomb–Scargle periodogram analysis of the periods around 5.5 year and 11 year in the international sunspot numbers. Astrophys. Space Sci. 2018, 363, 138. [Google Scholar] [CrossRef]
  35. Roy, S.; Prasad, A.; Panja, S.C.; Ghosh, K.; Patra, S.N. A Search for Periodicities in F10.7 Solar Radio Flux Data. Sol. Syst. Res. 2019, 53, 224–232. [Google Scholar] [CrossRef]
  36. Yan, L.; He, F.; Yue, X.; Wei, Y.; Wang, Y.; Chen, S.; Fan, K.; Tian, H.; He, J.; Zong, Q.; et al. The 8-Year Solar Cycle During the Maunder Minimum. AGU Adv. 2023, 4, e2023AV000964. [Google Scholar] [CrossRef]
  37. Sun, B.; Bradley, R.S. Solar influences on cosmic rays and cloud formation: A reassessment. J. Geophys. Res. (Atmos.) 2002, 107, 4211. [Google Scholar] [CrossRef]
  38. Lockwood, M. Solar Influence on Global and Regional Climates. Surv. Geophys. 2012, 33, 503–534. [Google Scholar] [CrossRef]
  39. Jhun, J.G.; Lee, E.J. A New East Asian Winter Monsoon Index and Associated Characteristics of the Winter Monsoon. J. Clim. 2004, 17, 711–726. [Google Scholar] [CrossRef]
  40. Prabhu, S. Monsoons are changing in India — here’s how to climate-proof the economy. Nature 2024, 629, 973. [Google Scholar] [CrossRef]
  41. Wang, B.; Wu, R.; Fu, X. Pacific-East Asian Teleconnection: How Does ENSO Affect East Asian Climate?*. J. Clim. 2000, 13, 1517–1536. [Google Scholar] [CrossRef]
  42. Linderholm, H.; Ou, T.; Jeong, J.H.; Folland, C.; Gong, D.; Liu, H.; Liu, Y.; Chen, D. Interannual teleconnections between the summer North Atlantic Oscillation and the East Asian summer monsoon. J. Geophys. Res. 2011, 116, D13107. [Google Scholar] [CrossRef]
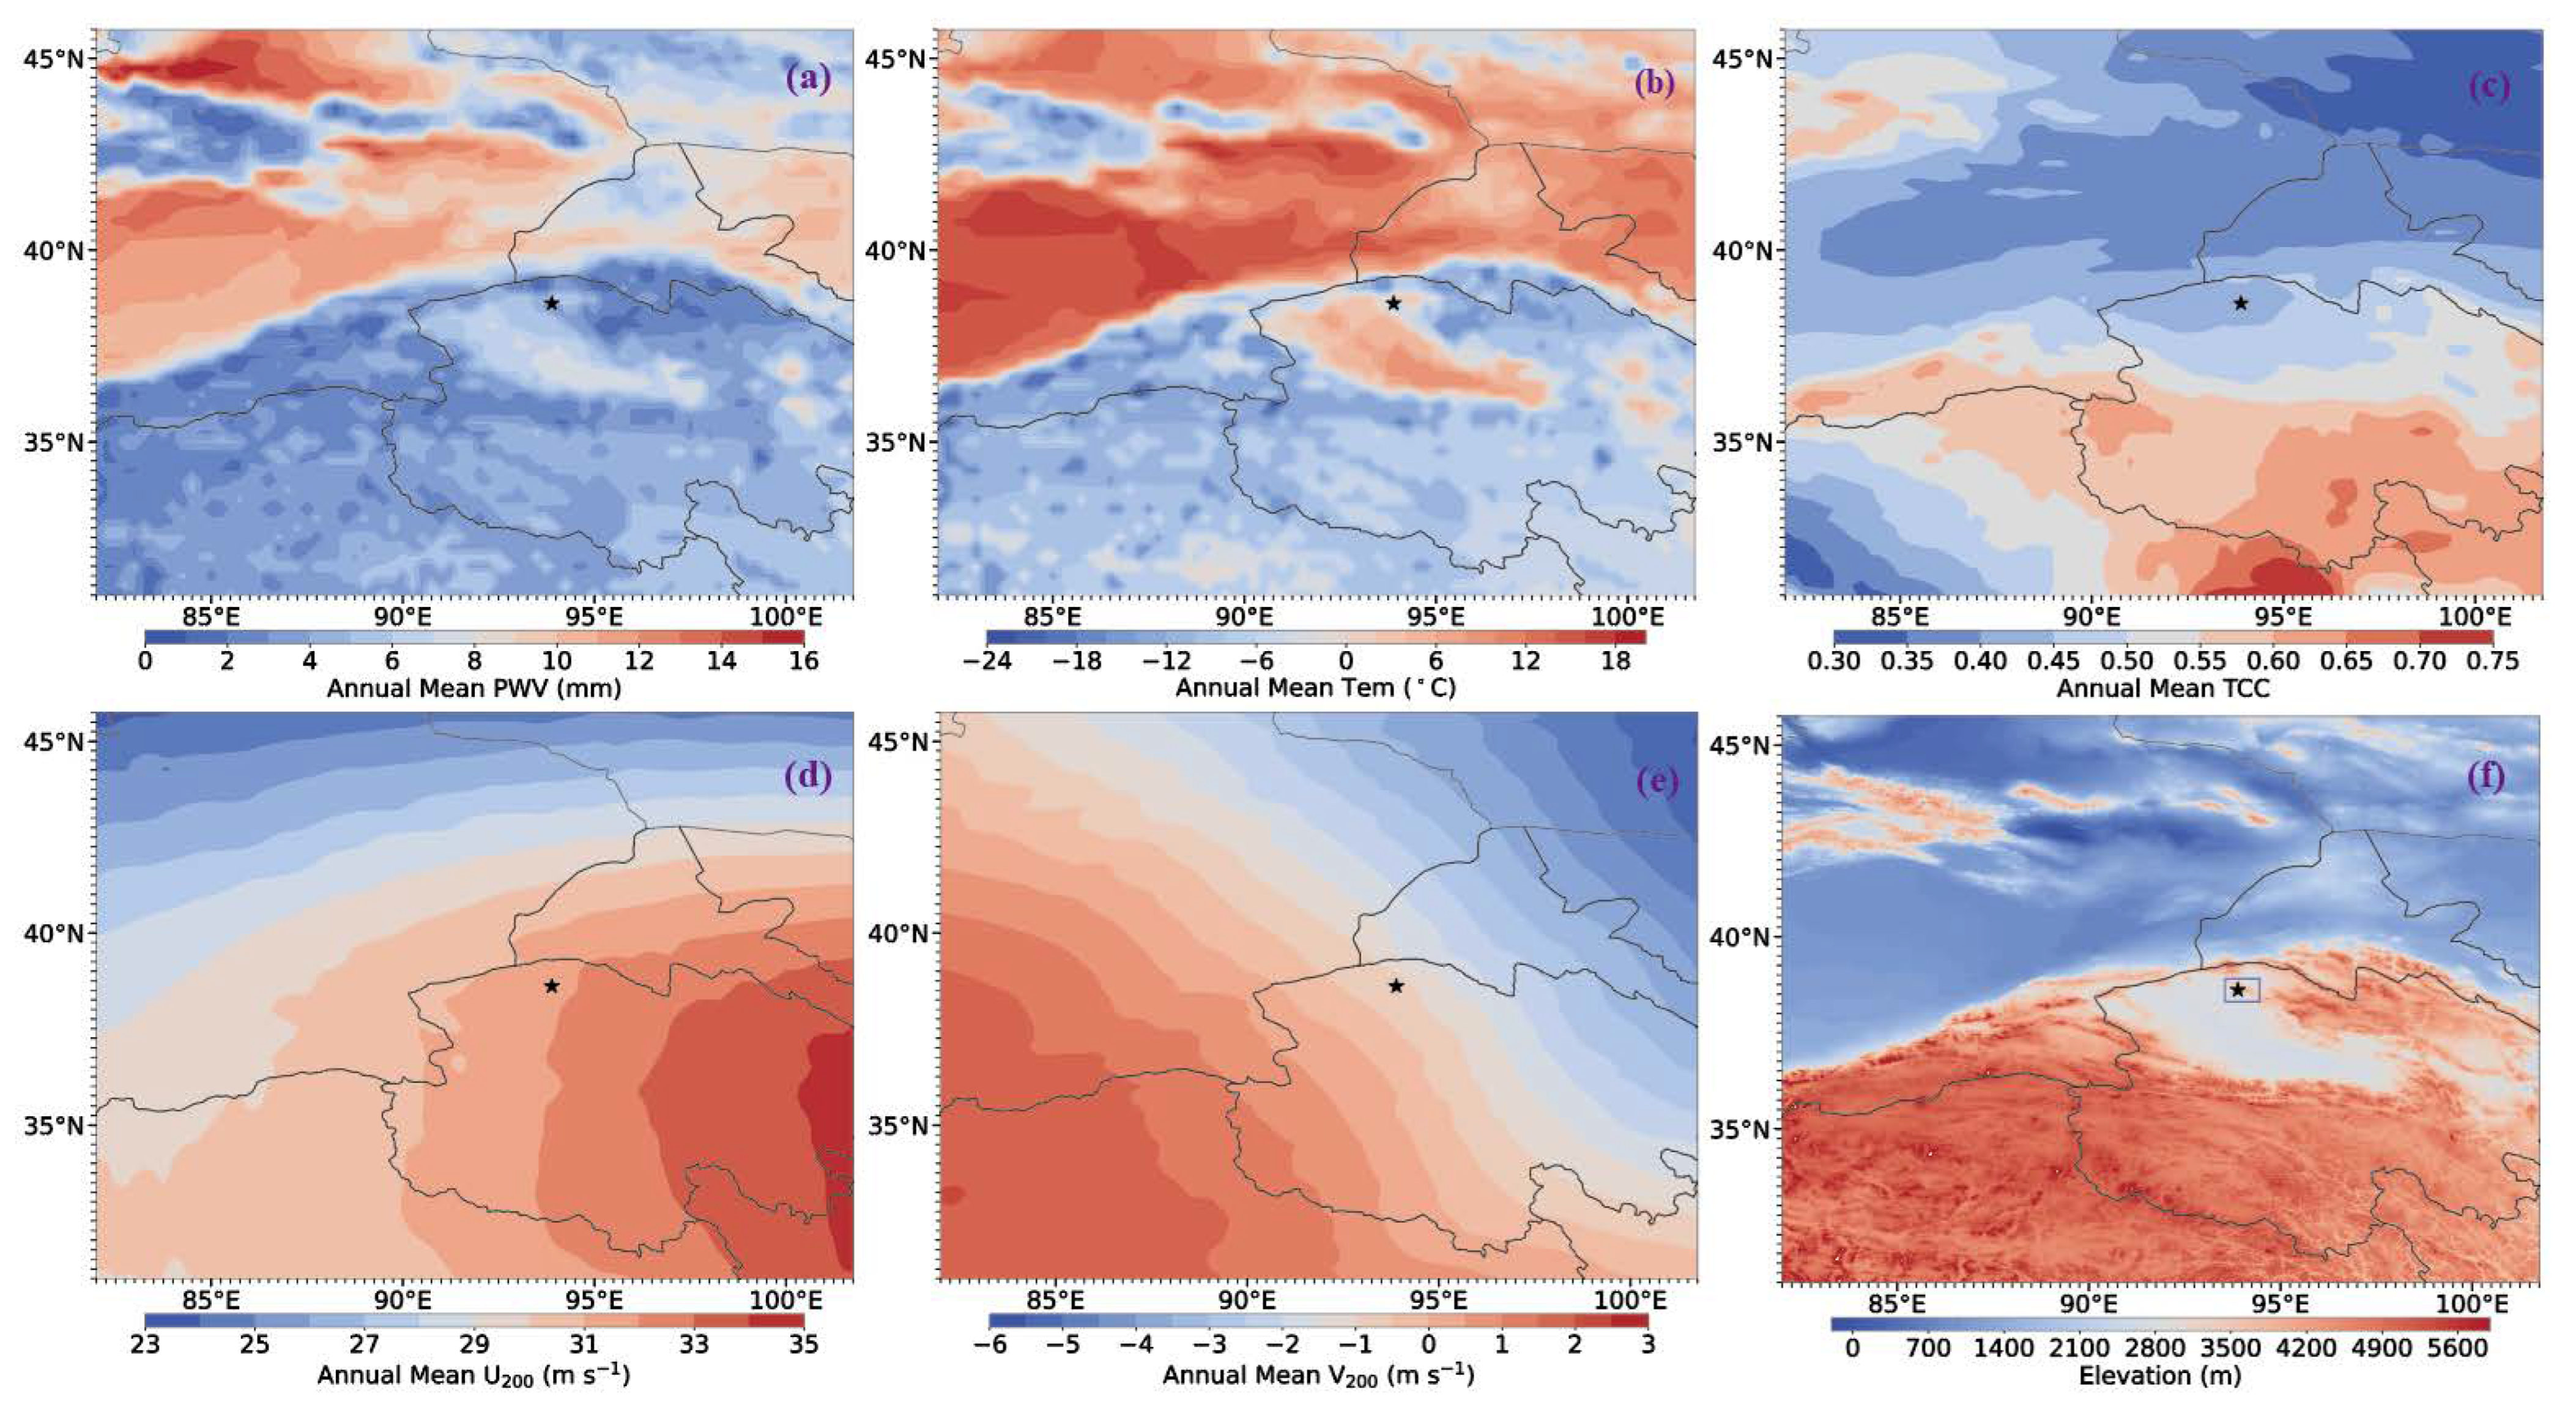
Figure 1. The average distributions of (a) PWV, (b) Tem, (c) TCC, (d) U 200 , (e) V 200 , and (f) elevation in the Lenghu site region (82°–102° E and 31°–46° N). The Lenghu site is marked by the star, and the summit of Saishiteng Mountain is marked by the blue rectangle. The elevation data were obtained from the AW3D of the Japan Aerospace Exploration Agency (JAXA) with a spatial resolution of 1 arcsec (30 m) and an elevation accuracy of 1 m.
Atmosphere 16 01210 g001
Figure 2. Interannual variations in precipitable water vapor (PWV) in the Lenghu site region (82°–102° E and 31°–46° N) during the period 2000-2023. The Lenghu site is marked by the star.
Atmosphere 16 01210 g002
Figure 3. The same as Figure 2 but for Tem. The Lenghu site is marked by the star.
Atmosphere 16 01210 g003
Figure 4. The same as Figure 2 but for W 200 . The green flow lines indicate the relative changes in the wind field. The Lenghu site is marked by the star.
Atmosphere 16 01210 g004
Figure 5. The same as Figure 2 but for TCC. The Lenghu site is marked by the star.
Atmosphere 16 01210 g005
Figure 6. Seasonal variations in meteorological parameters, including PWV, Tem, W 200 , cloud cover (TCC and HCC), and TCO, at the three sites (Lenghu, Mauna Kea, Paranal) are examined.
Atmosphere 16 01210 g006
Figure 7. The power spectral densities from the wavelet analysis of the monthly mean W 200 , PWV, Tem, cloud cover (TCC and HCC), and TCO at the three sites (Lenghu, Mauna Kea, Paranal) are shown, with the dashed line representing the 95 percent confidence level.
Atmosphere 16 01210 g007
Figure 8. The wavelet analysis results for the January mean Tem at the Lenghu site. Panel (a) presents the Tem time series based on ERA5 reanalysis data from 1990 to 2023. The green dots represent the January data. Panel (b) shows the local wavelet power spectrum of the time series obtained using the Morlet wavelet. Panel (c) illustrates the average power spectrum, with the dashed line indicating the 95% confidence level.
Atmosphere 16 01210 g008
Figure 9. This figure presents the anomalies in the weighted mean meteorological parameters (with trend lines and slope values) for Lenghu, Mauna Kea, and Paranal from 1990 to 2023, along with concurrent anomalies in the ENSO (Niño 3.4), PDO, and AMO indices during the same period.
Atmosphere 16 01210 g009
Table 1. Pearson’s correlation coefficients (PCCs) and p-values between meteorological parameters (PWV, T 600 , W 200 , HCC, TCC, TCO) and climate indices (ENSO, PDO, AMO) at three sites (Lenghu, Mauna Kea, Paranal). Significant correlations (p-value 0.05 ) are highlighted in bold.
SitesPWV T 600 W 200 HCCTCCTCO
PCC p-Value PCC p-Value PCC p-Value PCC p-Value PCC p-Value PCC p-Value
ENSOLenghu−0.240.1650.110.518−0.540.0010.130.4670.010.9540.210.226
Mauna Kea0.200.2610.520.0020.79 3.09 × 10 8 −0.300.0830.160.370−0.400.019
Paranal0.490.0030.450.007−0.310.0720.250.1460.240.164−0.280.113
PDOLenghu−0.170.322−0.180.306−0.370.0290.170.3240.140.4180.010.975
Mauna Kea0.010.9640.470.050.530.001−0.380.026−0.110.522−0.610.0001
Paranal0.150.3920.040.809−0.030.8750.230.1950.220.214−0.450.007
AMOLenghu0.560.00070.320.0720.340.050−0.100.5720.010.9730.300.087
Mauna Kea−0.230.1950.240.180−0.180.304−0.050.778−0.270.1220.520.002
Paranal−0.090.6230.390.0250.460.007−0.140.428−0.140.4280.260.135
Disclaimer/Publisher’s Note: The statements, opinions and data contained in all publications are solely those of the individual author(s) and contributor(s) and not of MDPI and/or the editor(s). MDPI and/or the editor(s) disclaim responsibility for any injury to people or property resulting from any ideas, methods, instructions or products referred to in the content.