Article

Air Pollution in Taiyuan City During 2022 to 2024: Status and Influence of Meteorological Factors

1
College of Modern Logistics, Shanxi Vocational University of Engineering Science and Technology, Jinzhong 030619, China
2
School of Chemistry and Chemical Engineering, Shanxi University, Taiyuan 030006, China
*
Author to whom correspondence should be addressed.
Atmosphere 2025, 16(10), 1209; https://doi.org/10.3390/atmos16101209
Submission received: 30 July 2025 / Revised: 15 October 2025 / Accepted: 17 October 2025 / Published: 19 October 2025
(This article belongs to the Section Air Quality)

Abstract

The deterioration of environmental air quality is an urgent global issue, and the level of air pollution is particularly severe in developing countries. This study aims to understand the air quality problems in Taiyuan City and explore the evolution of air pollution trends and their relationship with meteorological factors. The result shows that the air quality in Taiyuan has distinct temporal distribution characteristics, with summer being better than winter. Wind speed has an impact on air quality and is closely related to the season. The increase in wind speed in spring is conducive to a reduction in NO2 concentrations, but it leads to an increase in PM10 concentration. In summer, wind speed is negatively correlated with CO and positively correlated with O3. In autumn, except for O3, wind speed is negatively correlated with various air pollutants. During winter, wind speed has a favorable effect on most atmospheric pollutants, except for O3 and PM10. When temperatures soar, it is necessary to be vigilant about the possibility of O3 concentration exceeding standards in summer. But, in winter, an increase in temperature often leads to an increase in PM2.5 and PM10 concentrations. An increase in humidity is very beneficial in spring, helping to lower the concentration of PM10, but in winter it can lead to an increase in the concentrations of both PM2.5 and PM10. Precipitation can improve air quality, especially when it exceeds 3 mm. These findings suggest that pollutant control strategies may need to be adjusted according to the season, especially for particulate matter.

1. Introduction

Urbanization drives population concentration and economic growth but also worsens environmental pollution, with air pollution being the most prominent. On the one hand, air pollution reduces atmospheric visibility, threatens ground and air traffic safety, disrupts the normal operation of industrial enterprises and the tourism sector, and thereby impairs public health and safety. On the other hand, it poses a severe risk to human physical and mental health [1,2,3,4,5], particularly as a key contributor to chronic diseases in the elderly (e.g., respiratory and circulatory disorders), amid the global trend of rapid population aging. Research indicates that deaths linked to both population aging and PM2.5 in China increased by 340,000 between 2002 and 2017 [1]. Even in developed countries in Europe and America and other regions where air quality is close to meeting the standards recommended by the World Health Organization, air pollution-related health risks persist [2,3]. Notably, the atmosphere’s capacity to disperse and dilute pollutants varies significantly with meteorological conditions. Air pollution is thus intricately associated with factors including wind, temperature, atmospheric pressure, humidity, precipitation, solar radiation, cloud cover, atmospheric boundary layer, and atmospheric stability, forming a complex and inseparable interaction between them.
Numerous scholars have studied the correlation between atmospheric pollutants and meteorological conditions, with most focusing on meteorological impacts on fine particulate matter (PM2.5) concentrations. Park et al. [6] examined the PM2.5 concentrations and meteorological conditions in Seoul, South Korea, concluding that local meteorological factors, such as surface wind and turbulent motion, strongly influence PM2.5 concentrations. Chen et al. [7] analyzed 188 cities in China, noting that this influence exhibits distinct seasonality and regionality. Specifically, during winter, the most polluted season, wind is the primary meteorological driver of PM2.5 concentration in North China, while precipitation plays this role in coastal cities. Additionally, temperature, humidity, and wind are top factors. Jing et al. [8] found that meteorological conditions and anthropogenic precursors (ammonia) have pronounced spatial–temporal impacts on PM2.5. Over a full year, temperature is the primary factor. Regionally, precipitation dominates in southern China, while temperature is the key driver in northern China. Chen et al. [9] revealed that CO and NO2 are the main PM2.5 precursors across most of China; SO2 matters more in southern and southwestern regions. For northern regions, boundary layer height and wind speed drive PM2.5 dispersion, whereas relative humidity and total precipitation dominate in the southern and southwestern regions. However, Zhang et al. [10] investigated Beijing (2013–2018), concluding that relative humidity and wind speed are the primary meteorological factors, while precipitation has almost no discernible impact. Chen et al. [11] noted that PM2.5-related meteorological factors vary seasonally, making seasonal analysis more meaningful than annual. Lai et al. [12] (Harbin) identified a positive correlation between consecutive-day temperature difference and PM2.5 concentration. Additionally, PM2.5 pollution is linked to rising temperatures, increasing relative humidity, decreasing wind speeds, or any combination of these factors. Gao et al. [13] used the 2015–2019 Harbin data and found that PM2.5 concentration has pronounced seasonal variations, with the average relative humidity and aerosol optical depth (AOD) exerting major impacts. Naturally, conclusions vary by location and time period [14,15].
Another research strand, focused on by O3. Wu et al. [16], selected Shenyang (a major city in Northeast China), analyzing 2018–2021 O3 spatiotemporal variations. They found that O3 concentrations correlate with temperature and wind speed, but negatively with relative humidity. Cifuentes et al. [17] analyzed air pollutant–meteorology Spearman correlation coefficients in the Manizales area of Colombia. The results showed that O3 strongly associates with temperature, relative humidity, solar radiation, and wind speed. In contrast, PM2.5 and CO exhibited no significant correlation, while SO2 related to wind speed, temperature, and solar radiation.
There are also many joint studies on O3 and PM2.5. Wang et al. [18] analyzed monitoring data in Lanzhou, China, from 2019 to 2022, to explore co-pollution trends and causes. They found that daytime O3 formation is linked to black carbon (BC), total suspended particulate matter (TSP), nitrogen oxides (NOx), nitric oxide (NO), PM2.5, and total volatile organic compounds (TVOC). For PM2.5, its concentration is affected by BC, PM10, TSP, O3, NOx, and NO2. Additionally, boundary layer height, solar radiation, wind direction, and humidity also drive co-pollution. Lei et al. [19] further confirmed the complex interactive relationship between O3 and PM2.5. Wu et al. [20] investigated PM2.5, O3, and meteorological factors in the Beijing–Tianjin–Hebei region. They found that sunshine duration best explains PM2.5 variation, while precipitation best explains O3 variation. Zhou et al. [21] used 2019 spring observational data (Beijing radar wind profiler, microwave radiometer, etc.) and found that boundary layer height and temperature inversion were negatively (positively) correlated with PM (O3) concentrations, regulating the extent of air pollution. Furthermore, high temperature, high relative humidity, and low wind speed worsen pollution.
Comprehensive air pollution studies also exist. Li et al. [22] identified that local emissions coupled with unfavorable meteorology (weak wind, enhanced atmospheric stability, shallow planetary boundary layer) caused the recent aerosol pollution in Shenyang, China. Dalai et al. [23]’s 2019–2022 Chandigarh (India) analysis highlighted that elevated concentrations of pollutants (including PM2.5, PM10, NO2, SO2, and O3) were associated with lower relative humidity and temperature. Based on the data from Heilongjiang Province, Zheng et al. [24] discovered that PM10, NO2, CO, and SO2 primarily influence PM2.5, while meteorological factors played a secondary role. Tian et al. [25] concluded for Hangzhou that PM10 first decreases then increases with wind speed. Precipitation reduces most air quality parameters, while relative humidity only reduces SO2 and PM10.
This study selects Taiyuan City as the specific research area for four reasons. First, Taiyuan is one of the “2 + 26” cities in the Beijing–Tianjin–Hebei air pollution transmission corridor. Analyzing the spatiotemporal characteristics of its air quality and the causes of pollution exceedances serves as a key basis for targeted pollution control measures and strategies. It also provides a foundation for researching heavy pollution episodes and regional pollutant transmission. Second, as the capital of Shanxi Province, Taiyuan is situated in the northern part of the Jinzhong Basin. Surrounded by mountains on three sides, it has poor air dispersion conditions. Additionally, Taiyuan is a fossil fuel-dependent city, leading to severe pollution and poor air quality. Thirdly, Taiyuan functions as a military and cultural hub in northern China, as well as a world-renowned commercial center for Shanxi merchants. Improving its air quality is crucial for economic transformation and tourism. Fourth, air quality is tied to livelihoods. As Shanxi is a major coal-producing region, balancing economic development, well-being, and environmental protection requires well-designed, practical air pollution prevention and control measures, making Taiyuan a representative case.
Therefore, this study aims to comprehensively assess air quality in Taiyuan over a 3-year period (2022–2024), identify significant changes and variations, and thereby provide valuable insights into the effectiveness of existing pollution control measures. Additionally, it intends to explore the influential role of meteorological factors in driving Taiyuan’s air quality dynamics. This aspect is essential for understanding the complex interplay between weather conditions, atmospheric dispersion, and the concentration of pollutants, providing up-to-date information on air quality trends and guiding the development of sustainable strategies to address the region’s air pollution challenges. The structure of this paper is as follows: Section 2 introduces the materials and methods; Section 3 presents the main research results; and Section 4 outlines the main conclusions.

2. Materials and Methods

2.1. Materials

Taiyuan, located in Shanxi Province, in the north of China, is geographically characterized by its unique topographical and climatic features. Enclosed by mountains on the eastern, western, and northern flanks, it presents an alluvial plain in its central part. The total area is 6988 km2. It governs six districts (Xiaoqian District, Yingze District, Xinghualing District, Jiancaoping District, Wanbolin District, Jinyuan District), three counties (Qingxu County, Yangqiu County, Loufan County), and one county-level city. The urban area (i.e., the six districts) has a total area of approximately 1416 km2. The permanent population of the city is about 5.5 million. Figure 1 shows the location of Taiyuan City and the monitoring points.
In terms of climate, Taiyuan experiences a warm temperate continental monsoon climate. This climate regime is marked by four distinct seasons. During the summer, the region is characterized by hot weather accompanied by ample rainfall, while winter brings cold and dry conditions. Additionally, Taiyuan benefits from abundant sunshine throughout the year.
The main industrial air pollution sources in the urban area of Taiyuan City include thermal power plants, heating companies, steel mills, stainless-steel factories, and cement plants, etc. Among them, the emissions of particulate matter from thermal power plants (using coal) and heating companies (using gas) are approximately 300 t/a, SO2 is approximately 2300 t/a, and nitrogen oxides are approximately 3100 t/a. The emissions of particulate matter from steel mills and stainless-steel factories are approximately 5500 t/a, SO2 is approximately 5400 t/a, and nitrogen oxides are approximately 18,800 t/a. The emissions of particulate matter from cement plants are approximately 220 t/a, SO2 is approximately 370 t/a, and nitrogen oxides are approximately 1100 t/a.
The urban area of Taiyuan City has basically achieved centralized heating, with the heat sources being thermal power plants (using coal) and heating companies (using gas).
In this study, the meteorological data were obtained from the observations of surface meteorological stations (Wusu station, see Figure 1b) in Taiyuan City during the period from 2022 to 2024. These data were collected from the National Center for Environmental Information (https://www.ncei.noaa.gov, accessed from 1 January 2022 to 31 December 2024). The variables mainly encompass the daily mean wind speed (W, m/s), daily mean temperature (T, °C), daily relative humidity (RH, %), and total daily precipitation (PRE, mm).
Regarding the air quality monitoring data, they were derived from the monitoring of Taiyuan City from 2022 to 2024. These data were sourced from the Real-time Air Quality Release Platform of the Shanxi Provincial Department of Ecology and Environment (http://sthjt.shanxi.gov.cn, accessed from 1 January 2022 to 31 December 2024). It should be noted that there are a total of nine national monitoring points in the urban area of Taiyuan City, namely Jinyuan, Jinsheng, Taoyuan, Yuying Middle School, Shanglan, Jiancaoping, Xiaodian, Wucheng, and Nanzhai. The specific locations are shown in Figure 1b. The air quality data of this study are the average values of the nine monitoring points, mainly reflecting the overall air quality of the urban area of Taiyuan City. The main parameters include the average daily AQI (Air Quality Index, dimensionless), PM2.5 (particulate matter with an aerodynamic diameter of 2.5 μm or less, µg/m3), PM10 (particulate matter with an aerodynamic diameter of 10 μm or less, µg/m3), NO2 (nitrogen dioxide, µg/m3), CO (carbon monoxide, mg/m3), SO2 (sulfur dioxide, µg/m3), and O3 (ozone, µg/m3). It should be noted that the AQI is a composite indicator that quantitatively integrates the concentrations of major air pollutants, including the above six pollutants, into a single numerical value. This index provides a standardized and simplified representation of the overall air quality. Furthermore, it classifies air quality into distinct categories, ranging from “Excellent” to “Extreme Pollution”, facilitating public understanding and decision-making. The relationship between them and the calculation method can be found in Section 3.2. And the determination of whether the air quality indicators exceed the standard is based on the 24 h average limit values of the secondary standards stipulated in the “Ambient Air Quality Standard” (GB3095-2012) [26] and its amendment. For ozone (O3), the reference value is the daily maximum 8 h average limit value.

2.2. Methods

To assess the relationship between air quality and meteorology, the Pearson correlation and the Spearman correlation analysis were performed between pollutant concentrations and important meteorological factors. The Pearson correlation coefficient ( P ) is used to assess the linear relationship between two variables. Its formula is shown in (1).
P = i = 1 n ( X i X - ) ( Y i Y - ) i = 1 n ( X i X - ) 2 i = 1 n ( Y i Y - ) 2
In Equation (1), X i and Y i represent the sample values, X - and Y - represent the sample means, and n represents the sample size.
The Spearman correlation coefficient ( P S ) is used to assess the monotonic relationship between two variables. Its formula is shown in (2).
P S = i = 1 n ( R i R ¯ ) ( S i S ¯ ) i = 1 n ( R i R ¯ ) 2 i = 1 n ( S i S ¯ ) 2
In Equation (2), R i and S i represent the ranks of the sample values, R ¯ and S ¯ represent the average ranks of variables, and n represents the sample size.
The range of P and P S are from −1 to +1, where −1 indicates a completely negative correlation between the variables, +1 indicates a completely positive correlation, and the closer it is to 0, the weaker the correlation between the two variables. In this study, when the absolute value of the correlation coefficient is greater than or equal to 0.5, it is considered that there is a strong correlation between the two variables. When the absolute value is between 0.5 and 0.3, it is considered to be moderately correlated. When the absolute value is between 0.3 and 0.1, it is considered as a weak correlation. When the value is less than 0.1, it is considered as having no correlation.

3. Results and Discussions

3.1. Meteorological Interpretation

3.1.1. Wind

It should be noted that, in this study, spring refers to April and May; summer is from June to August; autumn is from September to October; and winter is from January to March and from November to December, corresponding to the actual heating season in Taiyuan City.
The time series of wind speed for Taiyuan City from 2022 to 2024 is plotted in Figure 2. It can be deduced that the magnitude of wind speed exhibits an obvious seasonality, reaching its maximum value during April, April, and March while hitting its minimum in January, August and August. The average daily wind speed for the three observation years was 2.15 m/s and varies between 0.53 and 6.30 m/s. Generally speaking, the wind speed in Taiyuan City is relatively low. Statistically, the probability that the daily average wind speed exceeds 3 m/s is merely 17.43%. This situation also creates unfavorable conditions for the dispersion of pollutants.

3.1.2. Temperature

The time series of temperature for Taiyuan City from 2022 to 2024 is shown in Figure 3. It is evident that temperature exhibits an obvious seasonality, characterized by high temperatures during summer (June and July) and low temperatures during winter (December and January). The average daily temperature for the three observation years was 11.56 °C and varies between −16 °C and 30 °C.

3.1.3. Relative Humidity

The time series of relative humidity for Taiyuan City from 2022 to 2024 is displayed in Figure 4. It is observable that the relative humidity levels in summer and autumn are comparatively higher than those in other seasons, which may be attributed to the more abundant rainfall in summer and autumn. The humidity in spring is relatively low, approximately 48.23%; followed by winter, about 49.29%; then summer, around 61.06%; and autumn has the highest humidity, approximately 64.63%. The average daily relative humidity for the three observation years was 54.64%.

3.1.4. Precipitation

The time series of precipitation for Taiyuan City from 2022 to 2024 is displayed in Figure 5. It is obvious that the precipitation in Taiyuan City is highly related to the seasons, with the most in summer, followed by spring and autumn, and the least in winter. The average annual cumulative precipitation during the statistical period was 525 mm, which belongs to a semi-humid area. According to the precipitation probability statistics of the three years, the probability of light rain (i.e., daily precipitation < 10 mm) is 28.49%, the probability of moderate rain (i.e., daily precipitation 10–25 mm) is 2.74%, the probability of heavy rain (i.e., daily precipitation 25–50 mm) is 0.64%, the probability of torrential rain (i.e., daily precipitation 50–100 mm) is 0%, the probability of extremely heavy rain (i.e., daily precipitation 100–250 mm) is 0.18%, and the probability of super heavy rain (i.e., daily precipitation > 250 mm) is 0%. This result indicates that, in Taiyuan City, light rain is the most common type of precipitation.

3.2. Variation in Air Quality

3.2.1. AQI

The AQI reflects the quality of air. It is divided into six levels based on the degree of pollution. They are, namely, Excellent (0–50), Good (51–100), Mild Pollution (101–150), Moderate Pollution (151–200), Severe Pollution (201–300), and Extreme Pollution (301–500). The corresponding colors are green, yellow, orange, red, purple, and brownish red. It should be noted that the AQI values in all the figures have been plotted according to this color specification.
The AQI and the number of days with different air quality grades in Taiyuan City from 2022 to 2024 are shown in Figure 6. After an analytical investigation of the data, the number of days with AQI not exceeding the standard from 2022 to 2024 was 297, 299, and 324 days, respectively, and the rate was 81.37%, 81.92%, and 88.52%, respectively. It was observed that the AQI for the entire year remains satisfactory, thanks to a combination of factors, including proactive air quality management, favorable local climate conditions, and a diversified economy. Based on the monthly variation in AQI, it can be seen that the AQI is relatively low in summer and autumn, with the highest proportion of excellent/good weather and occasional mild pollution. However, air pollution mainly occurs in spring and winter, especially in winter. Moderate pollution and above mainly occurs from January to March. This may be a result of relatively low temperature, stagnant weather conditions, and increased energy consumption for heating leading to trapping pollutants near the surface, and hence higher AQI values. Moreover, Taiyuan City, located in the northern part of the Jinzhong Basin and surrounded by mountains on three sides, restricts the dispersion conditions. The distinctive topography accentuates the decline in air quality, exacerbating the pollution challenges faced by the region. The AQI in winter was found to be considerably high due to the high concentration of PM. (This will be explained later.) Worse still, air pollution, particularly PM pollution, creates a dust dome in the atmosphere, which increases the frequency of the formation of adverse weather conditions such as temperature inversion. This, in turn, makes it more difficult for pollutants to disperse.

3.2.2. Various Pollutants

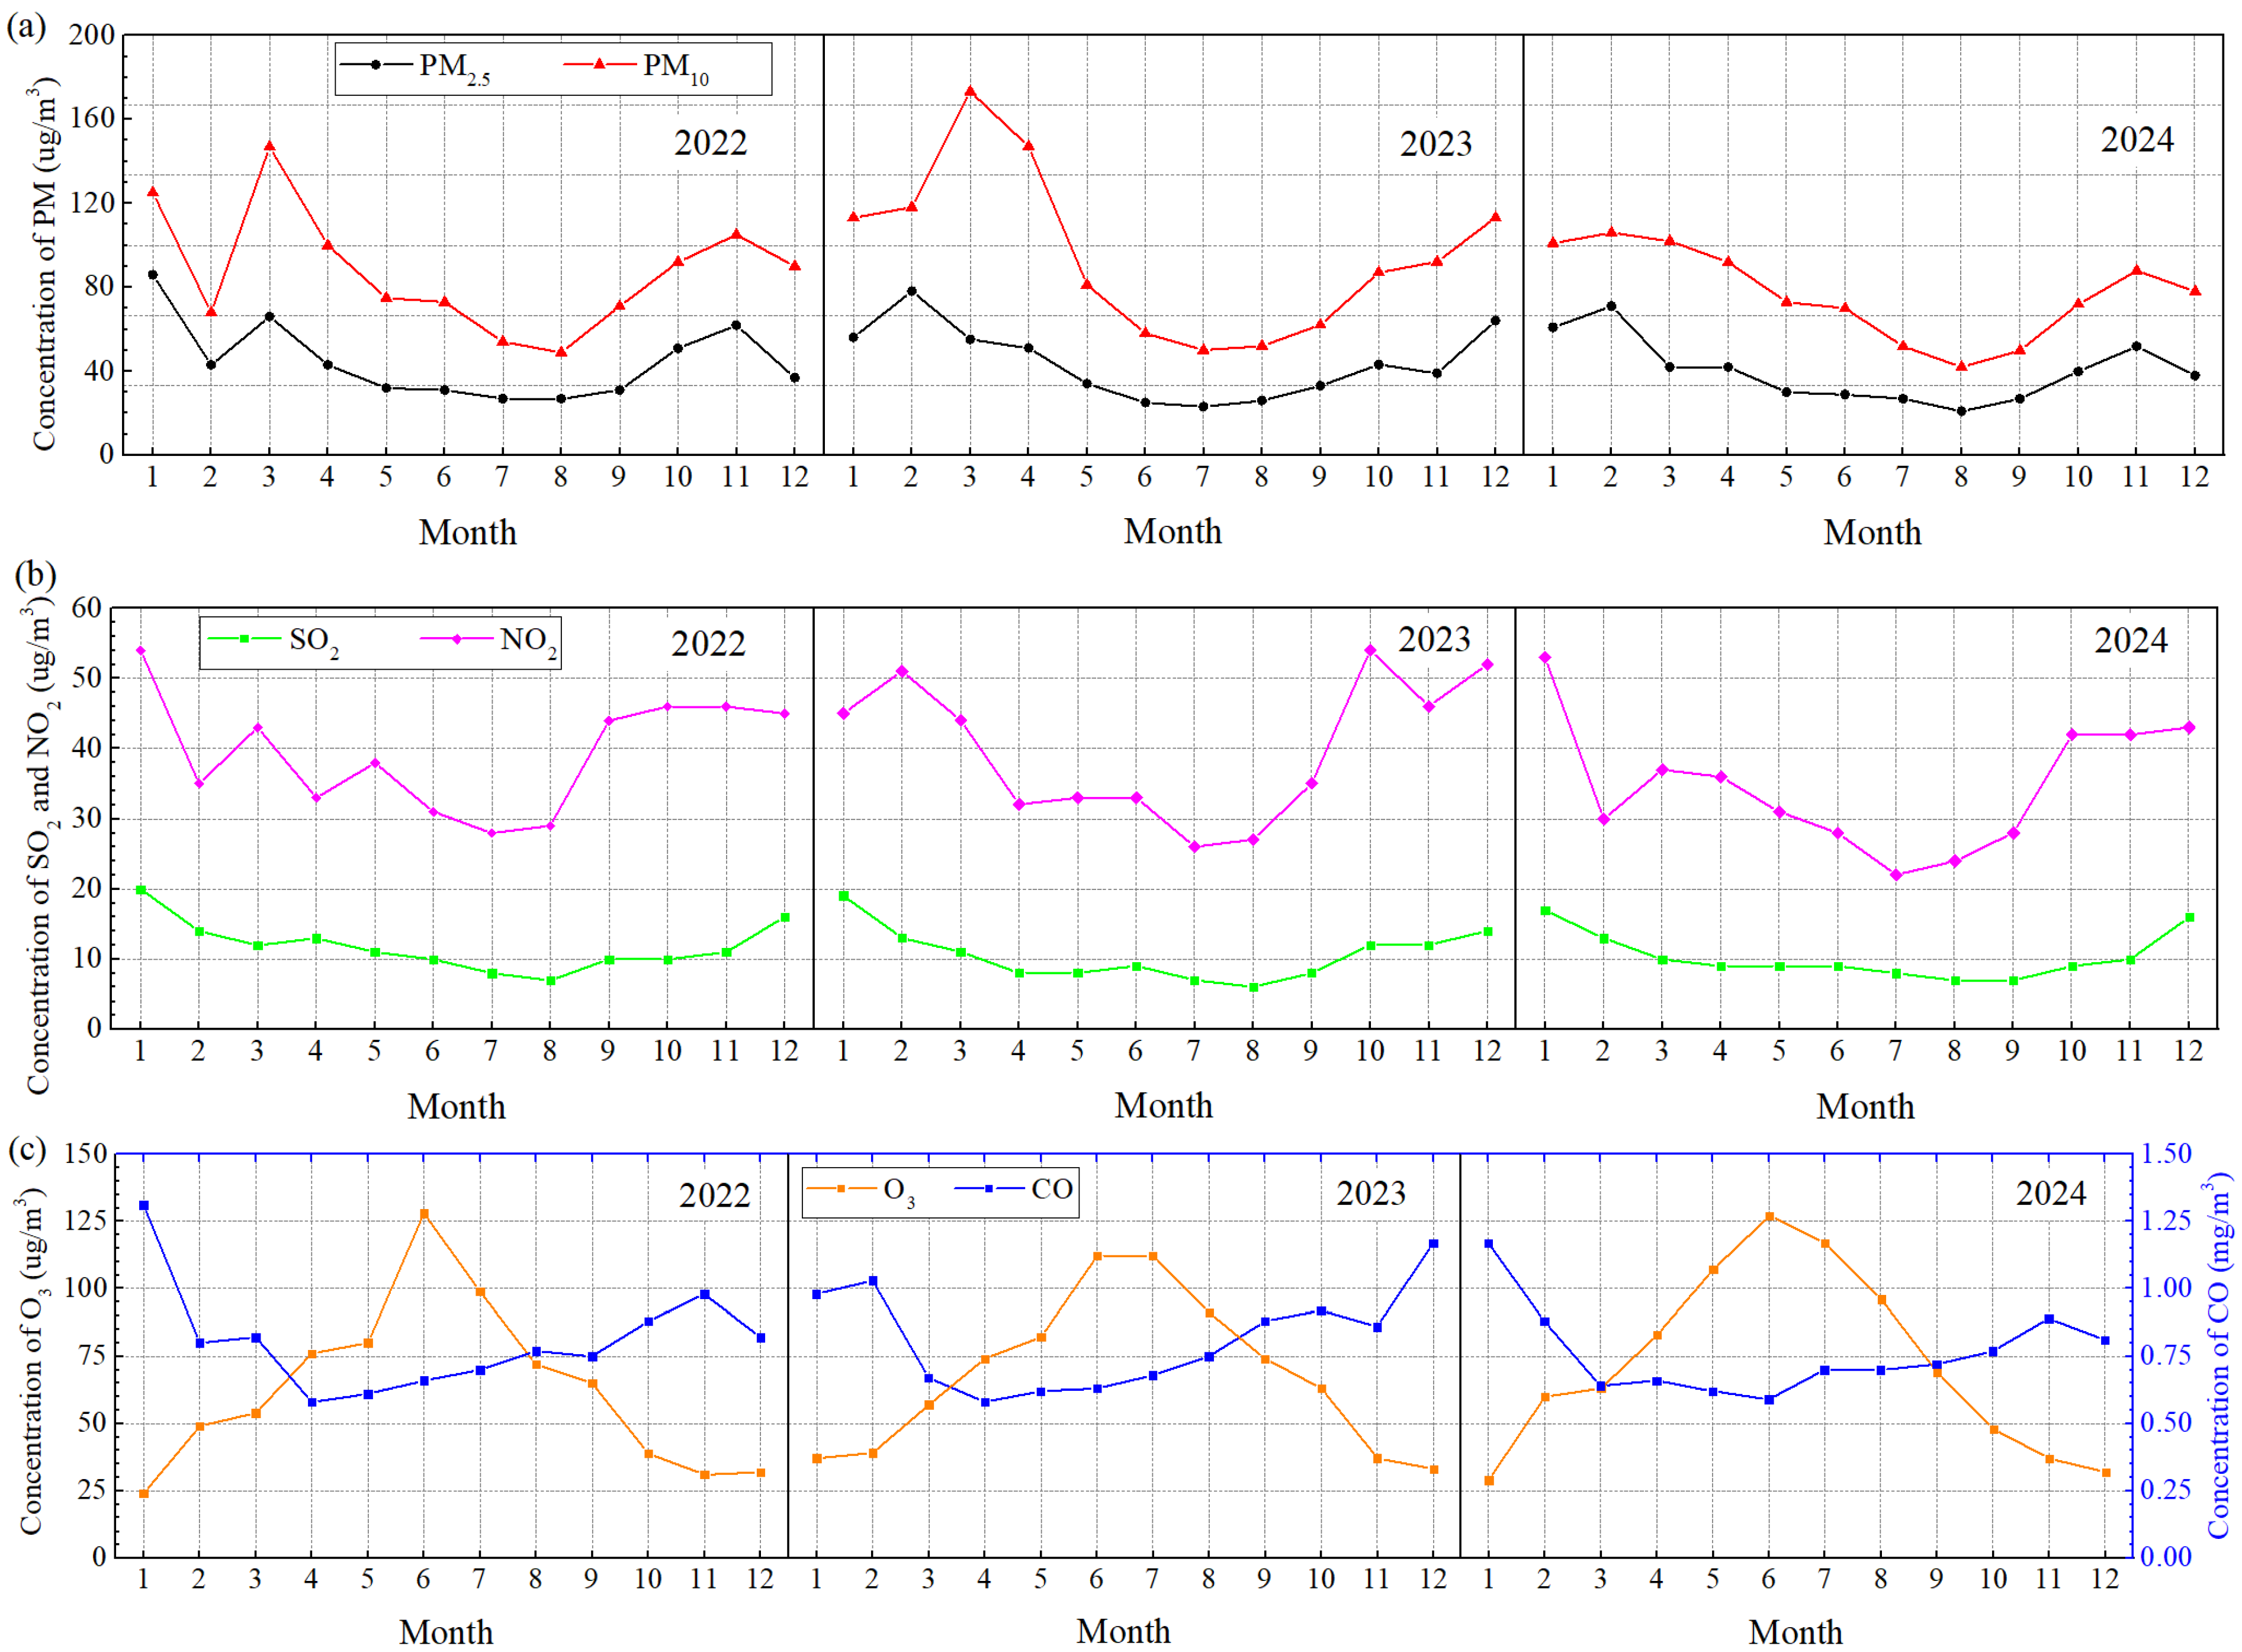
Figure 7 shows the monthly changes in various pollutants in Taiyuan City from 2022 to 2024. Obviously, all pollutants demonstrate pronounced seasonal variations.
(1)
PM
Overall, the concentrations of PM2.5 and PM10 exhibit the characteristic of being lower in summer and higher in winter, with winter concentrations being approximately twice those of summer (see Figure 7a). This can be mainly ascribed to the fact that the surface vegetation coverage is high in summer, while in winter the situation is reversed and is influenced by factors such as heating. And higher SO2 and NO2 emissions in winter from heating also corresponds to higher PM2.5 or PM10, which are composed of primary emitted particulate and secondary inorganic aerosols (including sulfate, nitrate ammonium from SO2, NO2, and NH3 precursors). The concentration of PM10 is roughly twice that of PM2.5. In 2022, the concentration ranges of PM2.5 and PM10 were 27 to 86 μg/m3 and 49 to 147 μg/m3, respectively, with the lowest concentrations occurring in August and the highest in January and March. In 2023, the concentration ranges were 23 to 78 μg/m3 and 50 to 173 μg/m3, respectively, with the lowest concentrations in July and the highest in February and March. In 2024, the concentration ranges were 21 to 71 μg/m3 and 42 to 106 μg/m3, respectively, with the lowest concentrations in August and the highest in February.
In addition, the ratio of PM2.5 concentration to PM10 concentration (see Figure 8), determining the contribution of fine particulate to the respirable particulate matter, is relatively high in winter, especially in January and February, which are also the coldest months of the year. This indicates that winter heating emissions are one of the significant sources of PM2.5. Conversely, from March to June, this ratio remains relatively low. There may be three reasons for this. The first one is the change in the structure of pollution sources, as this period is a high-incidence period for sand and dust weather, and sand and dust are typical sources of PM10. Additionally, as the temperature gradually warms up, outdoor activities such as construction, road repair, and farmland cultivation enter their peak season, and the dust from these activities is also an important source of PM10. Moreover, due to the significant reduction in PM2.5 emissions (including primary and secondary emissions) from centralized heating, the growth rate of PM2.5 concentration is lower than that of PM10. The second reason is the change in meteorological conditions. The average wind speed from March to June is significantly higher than that in winter (see Figure 2), and the overall dispersion conditions are conducive to the long-distance transmission of PM2.5 with the air flow. Moreover, although the precipitation during this period is more than in winter, it is mainly light rain (see Figure 5). PM2.5 is easily adsorbed by small raindrops and falls with precipitation, while PM10 is large in size and has a strong inertia, making it less likely to be captured by small raindrops. The third possible reason is the reduction in the generation of secondary PM2.5. The low-temperature and high-humidity environment in winter is relatively conducive to the formation of secondary PM2.5 through liquid-phase reactions of SO2 and NOx. However, as the temperature rises from March to June, the liquid-phase reaction rate slows down in the relatively high-temperature environment, resulting in a decrease in the generation of secondary PM2.5.
(2)
SO2
Compared with particulate matter, the concentration of SO2 exhibits a more pronounced seasonal pattern, typically conforming to a single-valley curve (see Figure 7b). It is characterized by lower values in summer and higher values in winter, showing a predominantly negative correlation with temperature. This phenomenon can be primarily attributed to the increased SO2 emissions resulting from winter heating activities. Specifically, the average winter SO2 concentration is approximately 1.6 to 1.9 times that of summer. During the period from 2022 to 2024, the monthly average SO2 concentrations ranged from 7 to 20 μg/m3, 6 to 19 μg/m3, and 7 to 17 μg/m3, respectively. The annual peak values consistently occurred in January, while the annual lowest values were all recorded in August.
Furthermore, the concentration of SO2 has been decreasing year by year, mainly due to three government measures. The first is the adjustment of the industrial structure. For example, starting from 2019, Taiyuan City completely eliminated the excess capacity and outdated coke ovens. By the end of 2023, this task had been basically completed. In 2019 and 2020 alone, about 12 million tons of backward capacity were eliminated, reducing particulate matter emissions by approximately 240 tons, SO2 emissions by about 400 tons, and NOx emissions by approximately 1700 tons. The second measure is the deepening of pollution control. Taking Taigang Steel as an example, since 2019, it has comprehensively carried out an ultra-low emission transformation throughout the process. The measures include the dry cooling of coke flue gas desulfurization, integrated desulfurization and denitrification of active coke, etc. The third measure is the promotion of measures such as the management of coal. The “coal-to-gas” and “coal-to-electricity” projects in Taiyuan City were fully launched in 2017 and have basically covered all rural areas by 2018. The effective reduction of SO2 emissions has achieved remarkable results. Its concentration did not exceed the standard during the period of 2022–2024, and all met the “excellent” standard.
(3)
NO2
Similarly to SO2, the concentration of NO2 generally exhibits a seasonal pattern of being lower in summer and higher in winter, demonstrating a predominantly negative correlation with temperature. Specifically, the average NO2 concentration in winter is approximately 1.5 to 1.7 times that of summer. An in-depth analysis reveals two contributing factors. Firstly, winter heating activities lead to an increase in NO2 emissions. Secondly, the augmented vehicle emissions during this period also play a role. From 2022 to 2024, the monthly average NO2 concentration ranges were 28–54 μg/m3, 26–54 μg/m3, and 22–53 μg/m3, respectively. The annual maximum values predominantly occurred in January, while the annual minimum values consistently appeared in July. Basically, the NO2 concentration has generally demonstrated a slightly decreasing trend year by year. This can be attributed to multiple factors. On the one hand, measures such as industrial structure adjustment, the intensification of industrial pollution control efforts, and the promotion of scattered coal management have effectively curbed NO2 emissions. On the other hand, the implementation of motor vehicle pollution control strategies, including the phase-out of aged diesel vehicles and the gradual substitution of fuel-powered vehicles with electric ones, has further mitigated NO2 emissions. It is worth noting that the annual concentration of nitrogen dioxide occasionally exceeded the standard, with an over-standard rate of only 0.64%, and all such cases were classified as mild pollution.
(4)
CO
CO is regarded as a tracer of biomass burning and long-range transport of gaseous pollutants. It shows a distinct seasonal variation with its highest levels in winter and lowest in summer, with the average concentration in winter being about 1.3 to 1.4 times that of summer. The average monthly concentrations for the years 2022 to 2024 were within the ranges of 0.58 to 1.33 mg/m3, 0.58 to 1.17 mg/m3, and 0.59 to 1.17 mg/m3, respectively. The lowest concentrations occurred in April for all three years, while the highest concentrations were recorded in January for 2022 and 2023, and in December for 2024.
However, a rather curious phenomenon is that the occurrence time of the lowest concentration of CO is one or two months earlier than that of other pollutants. For instance, PM, SO2, and NO2 generally reach their lowest levels in July or August, while the lowest level of CO occurs between April and June. In other words, the concentration of CO in summer is slightly higher than that in spring. One possible reason is that, during the summer, industrial production enters the full-load operation period, and the consumption of coal/gas increases compared to the spring. The second possible reason is that CO is mainly removed from the atmosphere through reactions with hydroxyl. In summer, with high temperatures and strong sunlight, the generation of hydroxyl is promoted, and the theoretical removal efficiency is higher. However, the concentration of O3 also increases simultaneously during the summer, and O3 is a competitor for the consumption of hydroxyl. Thus, it indirectly reduces the removal efficiency for CO. Of course, the fundamental reasons for this phenomenon require further in-depth exploration and investigation. It is worth noting that the CO concentration throughout the year did not exceed the standard, and 97.53% even met the “excellent” standard.
(5)
O3
Significantly distinct from other pollutants, the concentration of O3 is predominantly influenced by solar radiation. It exhibits the characteristic of being higher in summer and lower in winter, demonstrating a substantial positive correlation with temperature. The average summer concentration is approximately 2.6 times that of winter. This is basically consistent with the research results of northern Chinese cities [27].
The concentration ranges in 2022, 2023, and 2024 were 24–128 μg/m3, 33–112 μg/m3, and 29–127 μg/m3, respectively. The lowest concentrations were recorded in January, December, and December of 2022, 2023, and 2024, respectively, while the peak values all occurred in June. The relatively high ozone concentration in summer can be attributed to the fact that the increased temperature and enhanced solar radiation promote the photochemical processes involving nitrogen oxides and volatile organic compounds (VOCs), leading to the formation of ground-level ozone. Conversely, the situation is reversed in winter. During the statistical period, the probability of the ozone concentration exceeding the standard was relatively low, reaching 1.09%. All of these exceedance events took place in summer. It should also be noted that O3 is found to be negatively correlated with all pollutants. This may be explained by the fact that the other pollutants are the precursors (e.g., CO, NO2, SO2) of O3 in the presence of radiation. Therefore, the formation of O3 decreases the concentration of these precursors. This stated, the high concentration of CO and NO2 causes an increase in the concentration of secondary pollutants, i.e., O3. This intricate relationship has been amply evidenced in air quality research, with a large number of scientific references illustrating this negative correlation between ozone and various other pollutants [11,28,29].

3.3. Analysis of Factors Affecting Air Quality

In this research, the Pearson correlation and the Spearman correlation analysis were employed to assess the influence of meteorological elements (comprising wind speed, temperature, humidity, and precipitation) on air quality. The calculation method is presented in Section 2.2. Note: The Pearson correlation analysis is presented in Appendix A.

3.3.1. Wind Speed

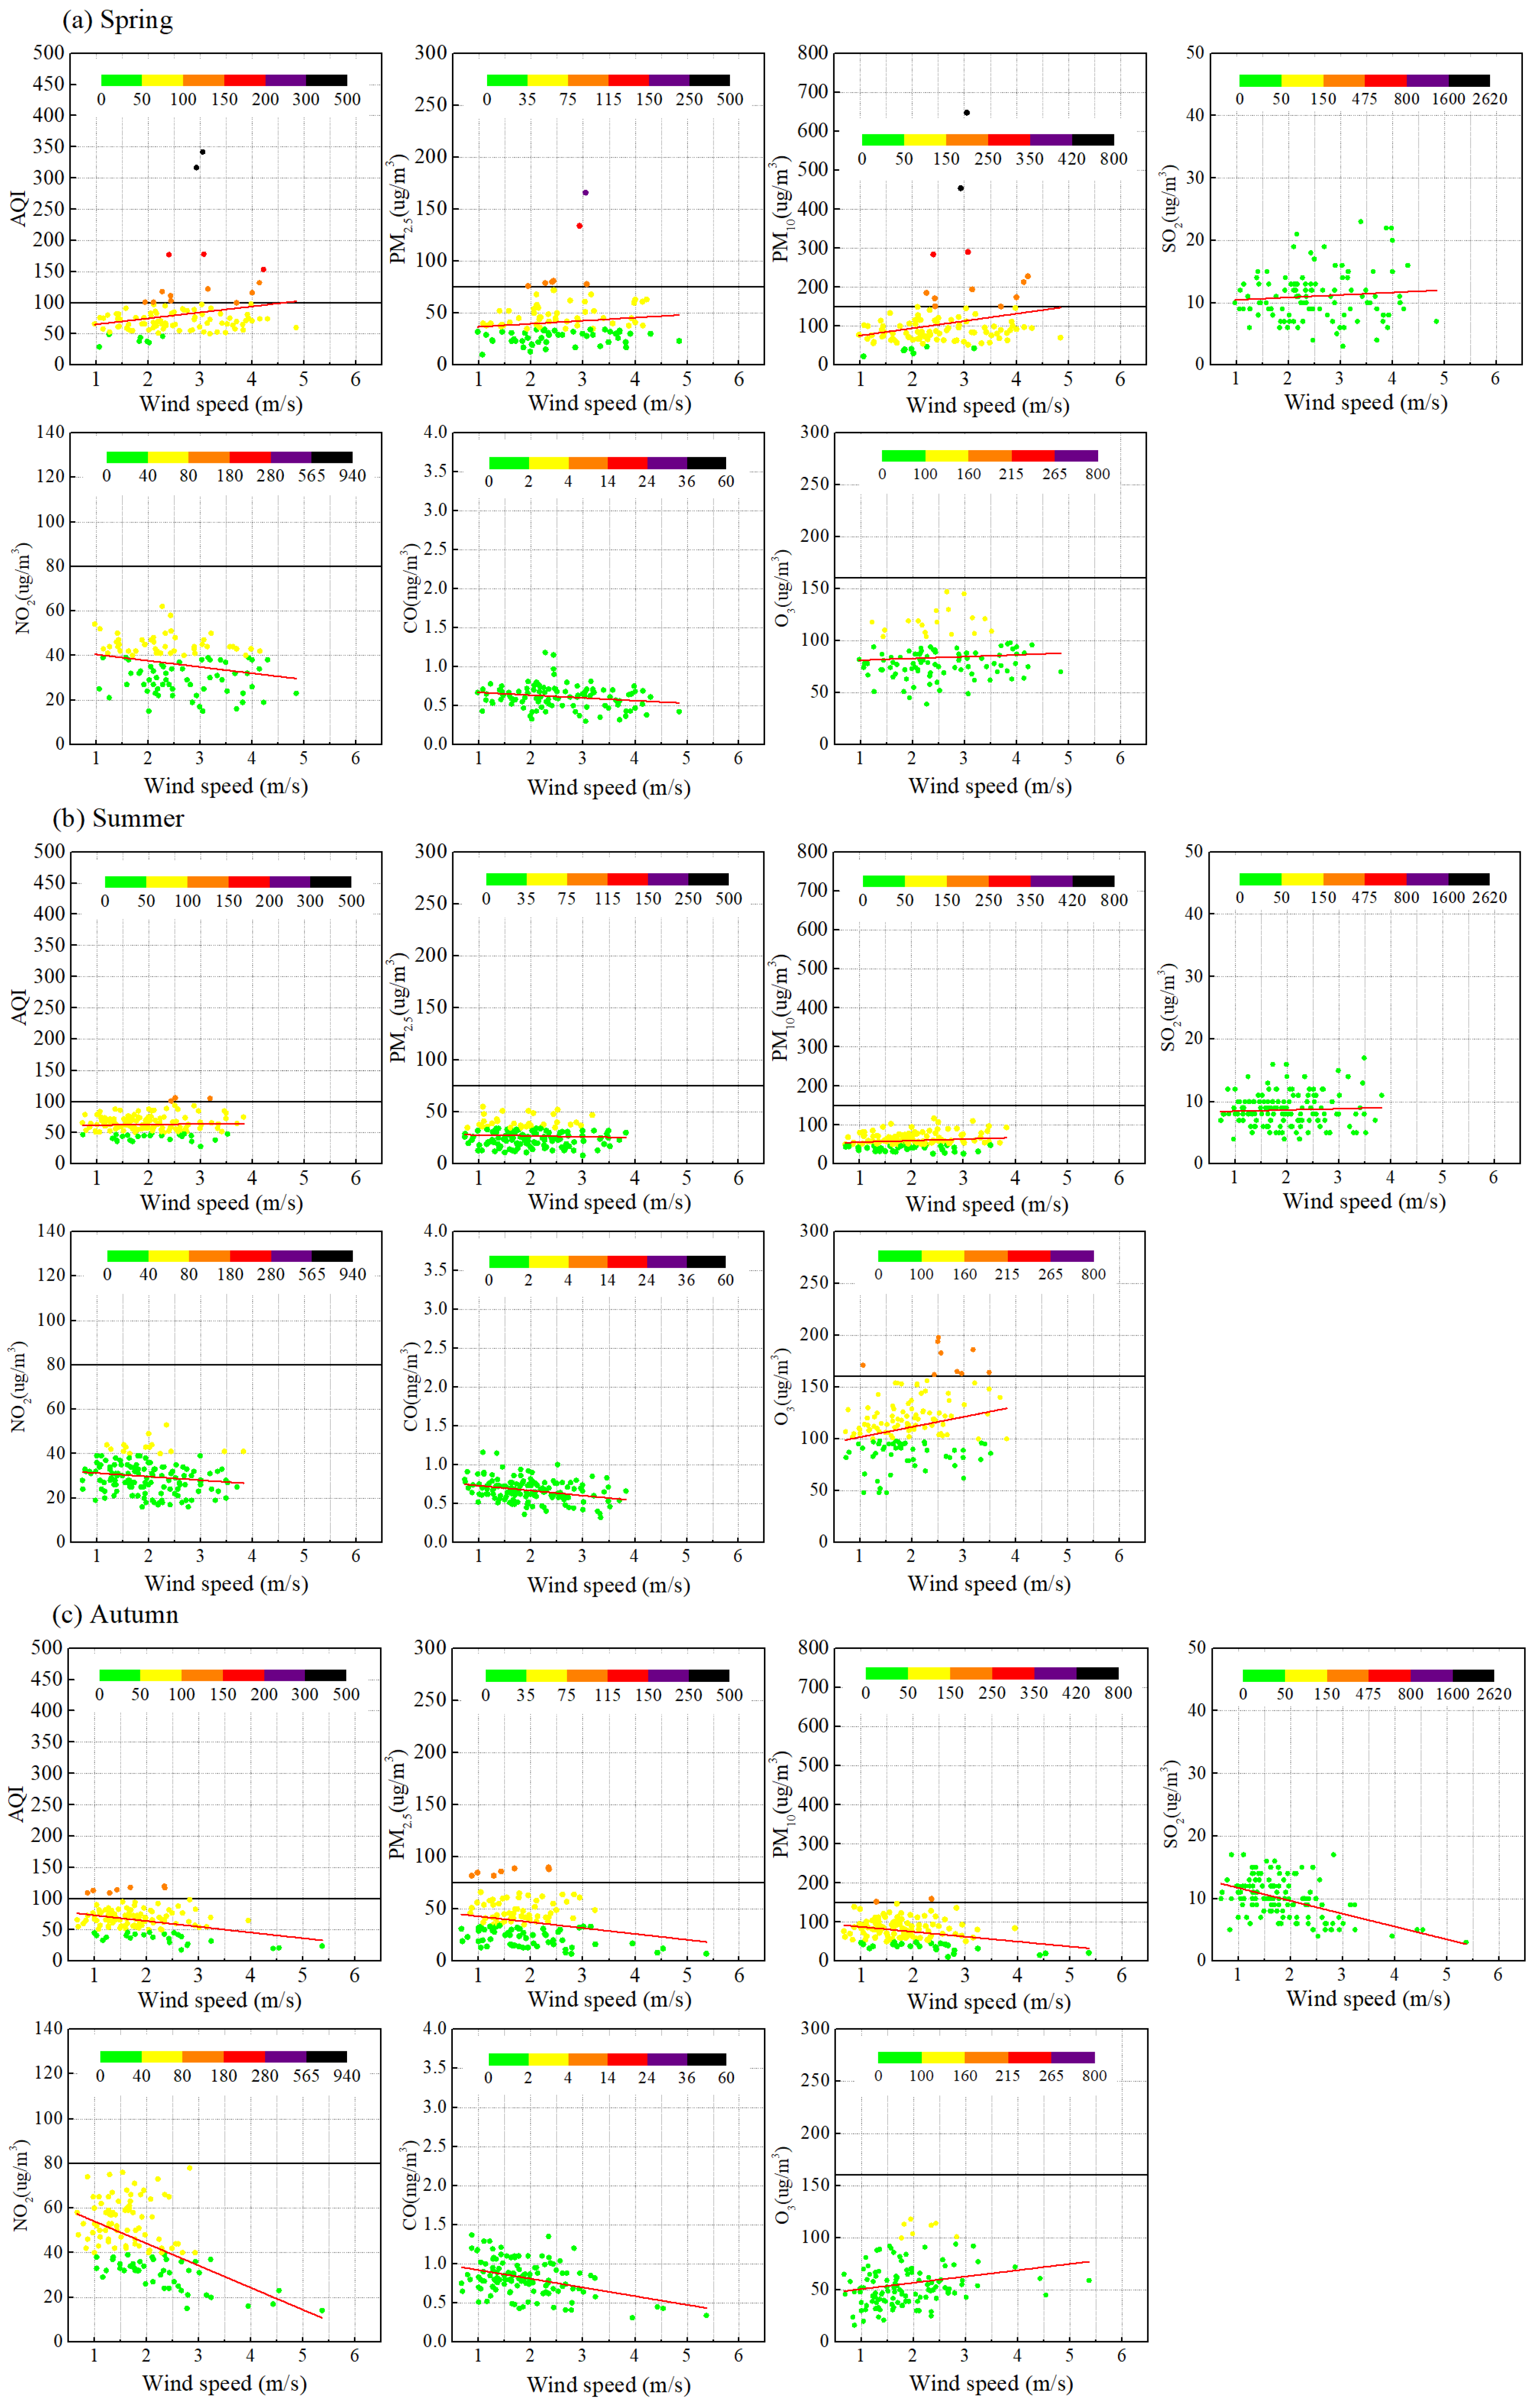
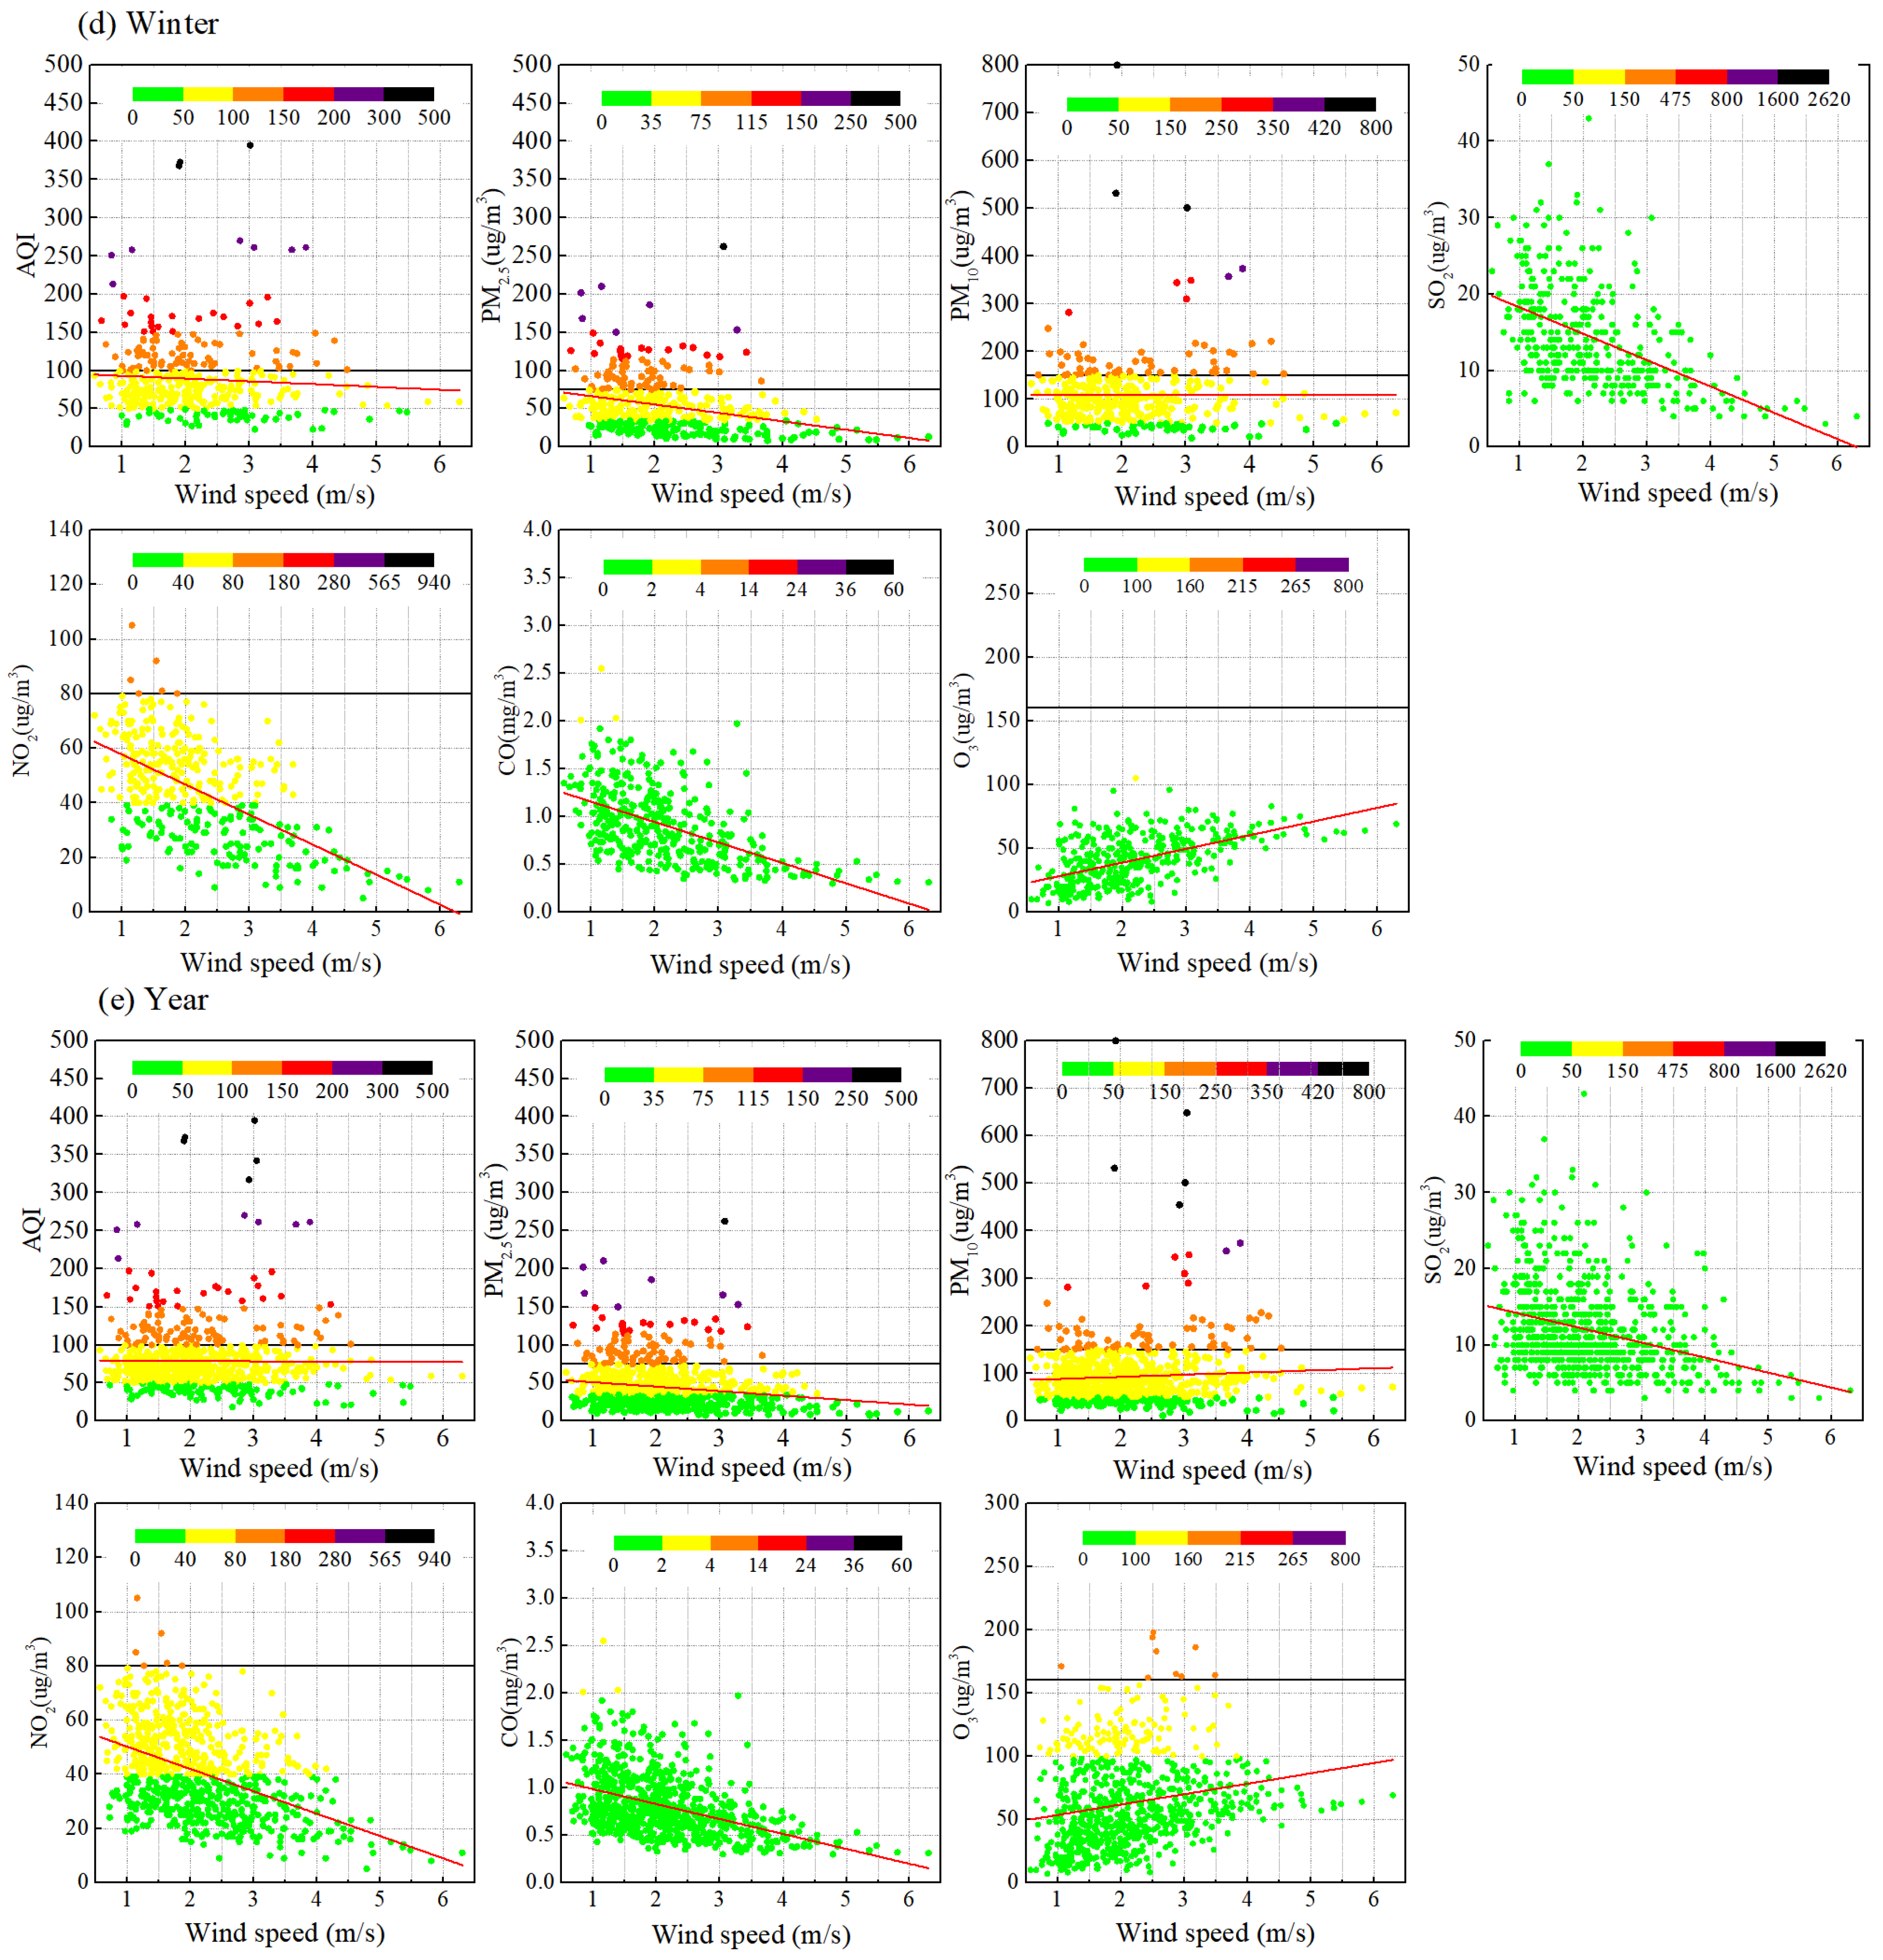
Generally speaking, wind speed can affect the dispersion of pollutants in the air. Low wind speeds can lead to the accumulation of pollutants in the air, leading to increased pollution levels. Conversely, high wind speeds can help in dispersing pollutants and improving air quality. Based on the daily average air quality data and daily average wind speed data of Taiyuan City from 2022 to 2024, the correlation between various air quality indicators and wind speed was analyzed. The results are shown in Figure A1 of Appendix A and Table 1. It should be noted that, in order to avoid the impact of precipitation, data with non-zero precipitation were removed during the statistical analysis.
As can be inferred from Figure A1 of Appendix A and Table 1, the correlations between different air quality indicators and wind speed differ across various seasons.
The correlation between the AQI and wind speed is season-dependent. In spring, the overall wind speed is relatively higher (the frequencies of wind speeds exceeding 3.0 m/s in spring, summer, autumn, and winter are 31.43%, 9.09%, 6.50%, and 18.23%, respectively). It was also the high-incidence period for sand and dust weather, and sand and dust are typical sources of PM10. Additionally, outdoor activities enter their peak season, and the dust from these activities is also an important source of PM10. As a result, the higher the wind speed, the greater the concentration of PM10. There is a weak positive correlation between the PM10 concentration and wind speed in spring, with a P S of 0.28. Consequently, there is a weak positive correlation between AQI and wind speed in spring, with a P S of 0.24, which is exactly contrary to our common perception. In summer, the overall wind speed is relatively lower compared with spring, with the frequency of wind speed less than 3 m/s being as high as 90.91%. The correlation between the AQI and wind speed is no correlation. In autumn, the overall wind speed is even lower. The frequency of wind speed less than 3 m/s is as high as 93.50%. There is a weak negative correlation between the AQI and wind speed, with a P S of −0.24. In winter, a season prone to frequent pollution events, the correlation between wind speed and AQI is a weak negative correlation. Specifically, the frequency of wind speeds below 3 m/s in winter is 81.77%. Notably, the probability of air pollution occurring when wind speeds are below 3 m/s reaches 67.33%. Additionally, it can be observed that, in spring, autumn and winter, the AQI exceeding the standard (i.e., AQI > 100) is primarily affected by the excessive concentrations of PM2.5 and PM10 (see Figure A1a,c,d in Appendix A), while in summer it is mainly caused by the excessive concentration of O3 (see Figure A1b in Appendix A). This may well represent a common characteristic shared by numerous cities in northern China [30].
The correlation between PM2.5 concentration and wind speed exhibits seasonal variations. In spring, summer, and autumn, the correlation between PM2.5 concentration and wind speed is not statistically significant. During the winter, when PM2.5 pollution is severe, a moderately negative correlation exists between the two, with a P S of −0.33. Statistically, the probability that the PM2.5 concentration exceeds the standard when the wind speed is less than 3 m/s is 92.21%. Furthermore, as can be deduced from Figure A1 of Appendix A, the situation of the PM2.5 concentration exceeding the standard occurs sporadically in spring and autumn, does not happen in summer, but happens frequently in winter. Thus, particular attention ought to be paid to the control strategies during winter. As can be seen from Figure 7 mentioned above, the PM2.5 concentration is correlated positively with pollutants other than O3. This phenomenon can be ascribed to the fact that many of these pollutants, such as SO2, NOx, volatile organic compounds (VOCs), and ammonia (NH3), serve as precursors to the formation of PM2.5 through complex atmospheric chemical reactions. In contrast, PM2.5 tends to exhibit a negative correlation with O3, as they have different formations and behaviors in the atmosphere. High levels of O3 indicate more significant photochemical activity, which can disperse and reduce the concentration of PM2.5.
The correlation between PM10 concentration and wind speed varies with the seasons. In spring, when the PM10 concentration sometimes exceeds the standard, its concentration has a weak positive correlation with wind speed, with a P S of 0.28. The reason is as mentioned before. In summer, the correlation between PM10 concentration and wind speed is not statistically significant. In the autumn, when PM10 concentrations occasionally exceeded the standard, there is a weak negative correlation with wind speed, with a P S of −0.25. This is likely due to the fact that the surface vegetation coverage rate was still relatively high in autumn, resulting in fewer sources of dust when the wind blew. In winter, when the exceedance of PM10 concentration is most severe, the correlation is not obvious (see Figure A1d in Appendix A). This is likely the combined consequence of persistent emissions from pollution sources and limited dispersion conditions.
In comparison to particulate matter (PM2.5 and PM10), the concentrations of gaseous pollutants (SO2, NO2, and CO) exhibit a stronger correlation with wind speed. During spring and summer, the overall concentration of SO2 is relatively low, and its correlation with wind speed is not statistically significant (see Figure A1a,b in Appendix A). In autumn and winter, there is a moderate and strong negative correlation between the concentration of SO2 and wind speed (see Figure A1c,d in Appendix A). Moreover, affected by the heating activities, the concentration of SO2 is relatively high in winter. However, from 2022 to 2024, the concentration of SO2 did not exceed the standard (see Figure A1e in Appendix A).
The correlation between the concentration of NO2 and wind speed is stronger than that of SO2. In all seasons, the concentration of NO2 is negatively correlated with wind speed. Notably, during winter, the P S exceeds −0.50. Occasionally, the concentration of NO2 exceeds the standard in winter (see Figure A1d in Appendix A). This is primarily due to the significant increase in emissions caused by winter heating and unfavorable dispersion conditions. All NO2 concentration exceedances occur when the wind speed is less than 2 m/s in winter (see Figure A1e in Appendix A).
The concentration of CO also exhibits a negative correlation with wind speed. Specifically, in winter, the negative correlations are highly significant, with a P S of −0.56. From 2022 to 2024, the concentration of CO did not exceed the standard (see Figure A1e in Appendix A).
As mentioned earlier, significantly distinct from other pollutants, the concentration of O3 is predominantly influenced by solar radiation. The concentration of O3 is positively correlated with wind speed. All the cases of exceeding the standard occurred in summer (see Figure A1b in Appendix A), and the concentration of O3 was weakly positively correlated with wind speed, with a P S of 0.22, indicating that the concentration of O3 was mainly affected by other factors. In winter, when the concentration of O3 was relatively low, the concentration of O3 was strongly positively correlated with wind speed, with a P S as high as 0.55. The analysis suggests that this was due to the severe exceedance of particulate matter concentration in winter, which affected visibility and then the concentration of O3. When the wind speed was high, visibility was better and solar radiation was relatively strong, leading to an increase in the concentration of O3. This is largely consistent with the findings in Shenyang of Wu et al. [20].
As can be seen from the above, wind speed emerges as being an important influencing factor for air quality and is highly related to the seasons. In spring, the wind speed is greater, the concentrations of NO2 are lower, and the concentration of PM10 is higher. The correlation between other items and wind speed is not obvious. In summer, wind speed is negatively correlated with NO2 and CO, positively correlated with O3, and has a relatively poor correlation with the others. In autumn, wind speed has a negative impact on various air pollutants, except for O3. In winter, wind speed exerts a negative influence on various atmospheric pollutants, with the exception of O3 and PM10. This also indicates that pollutant control strategies may need to be segmented by season, especially for PM.

3.3.2. Temperatures

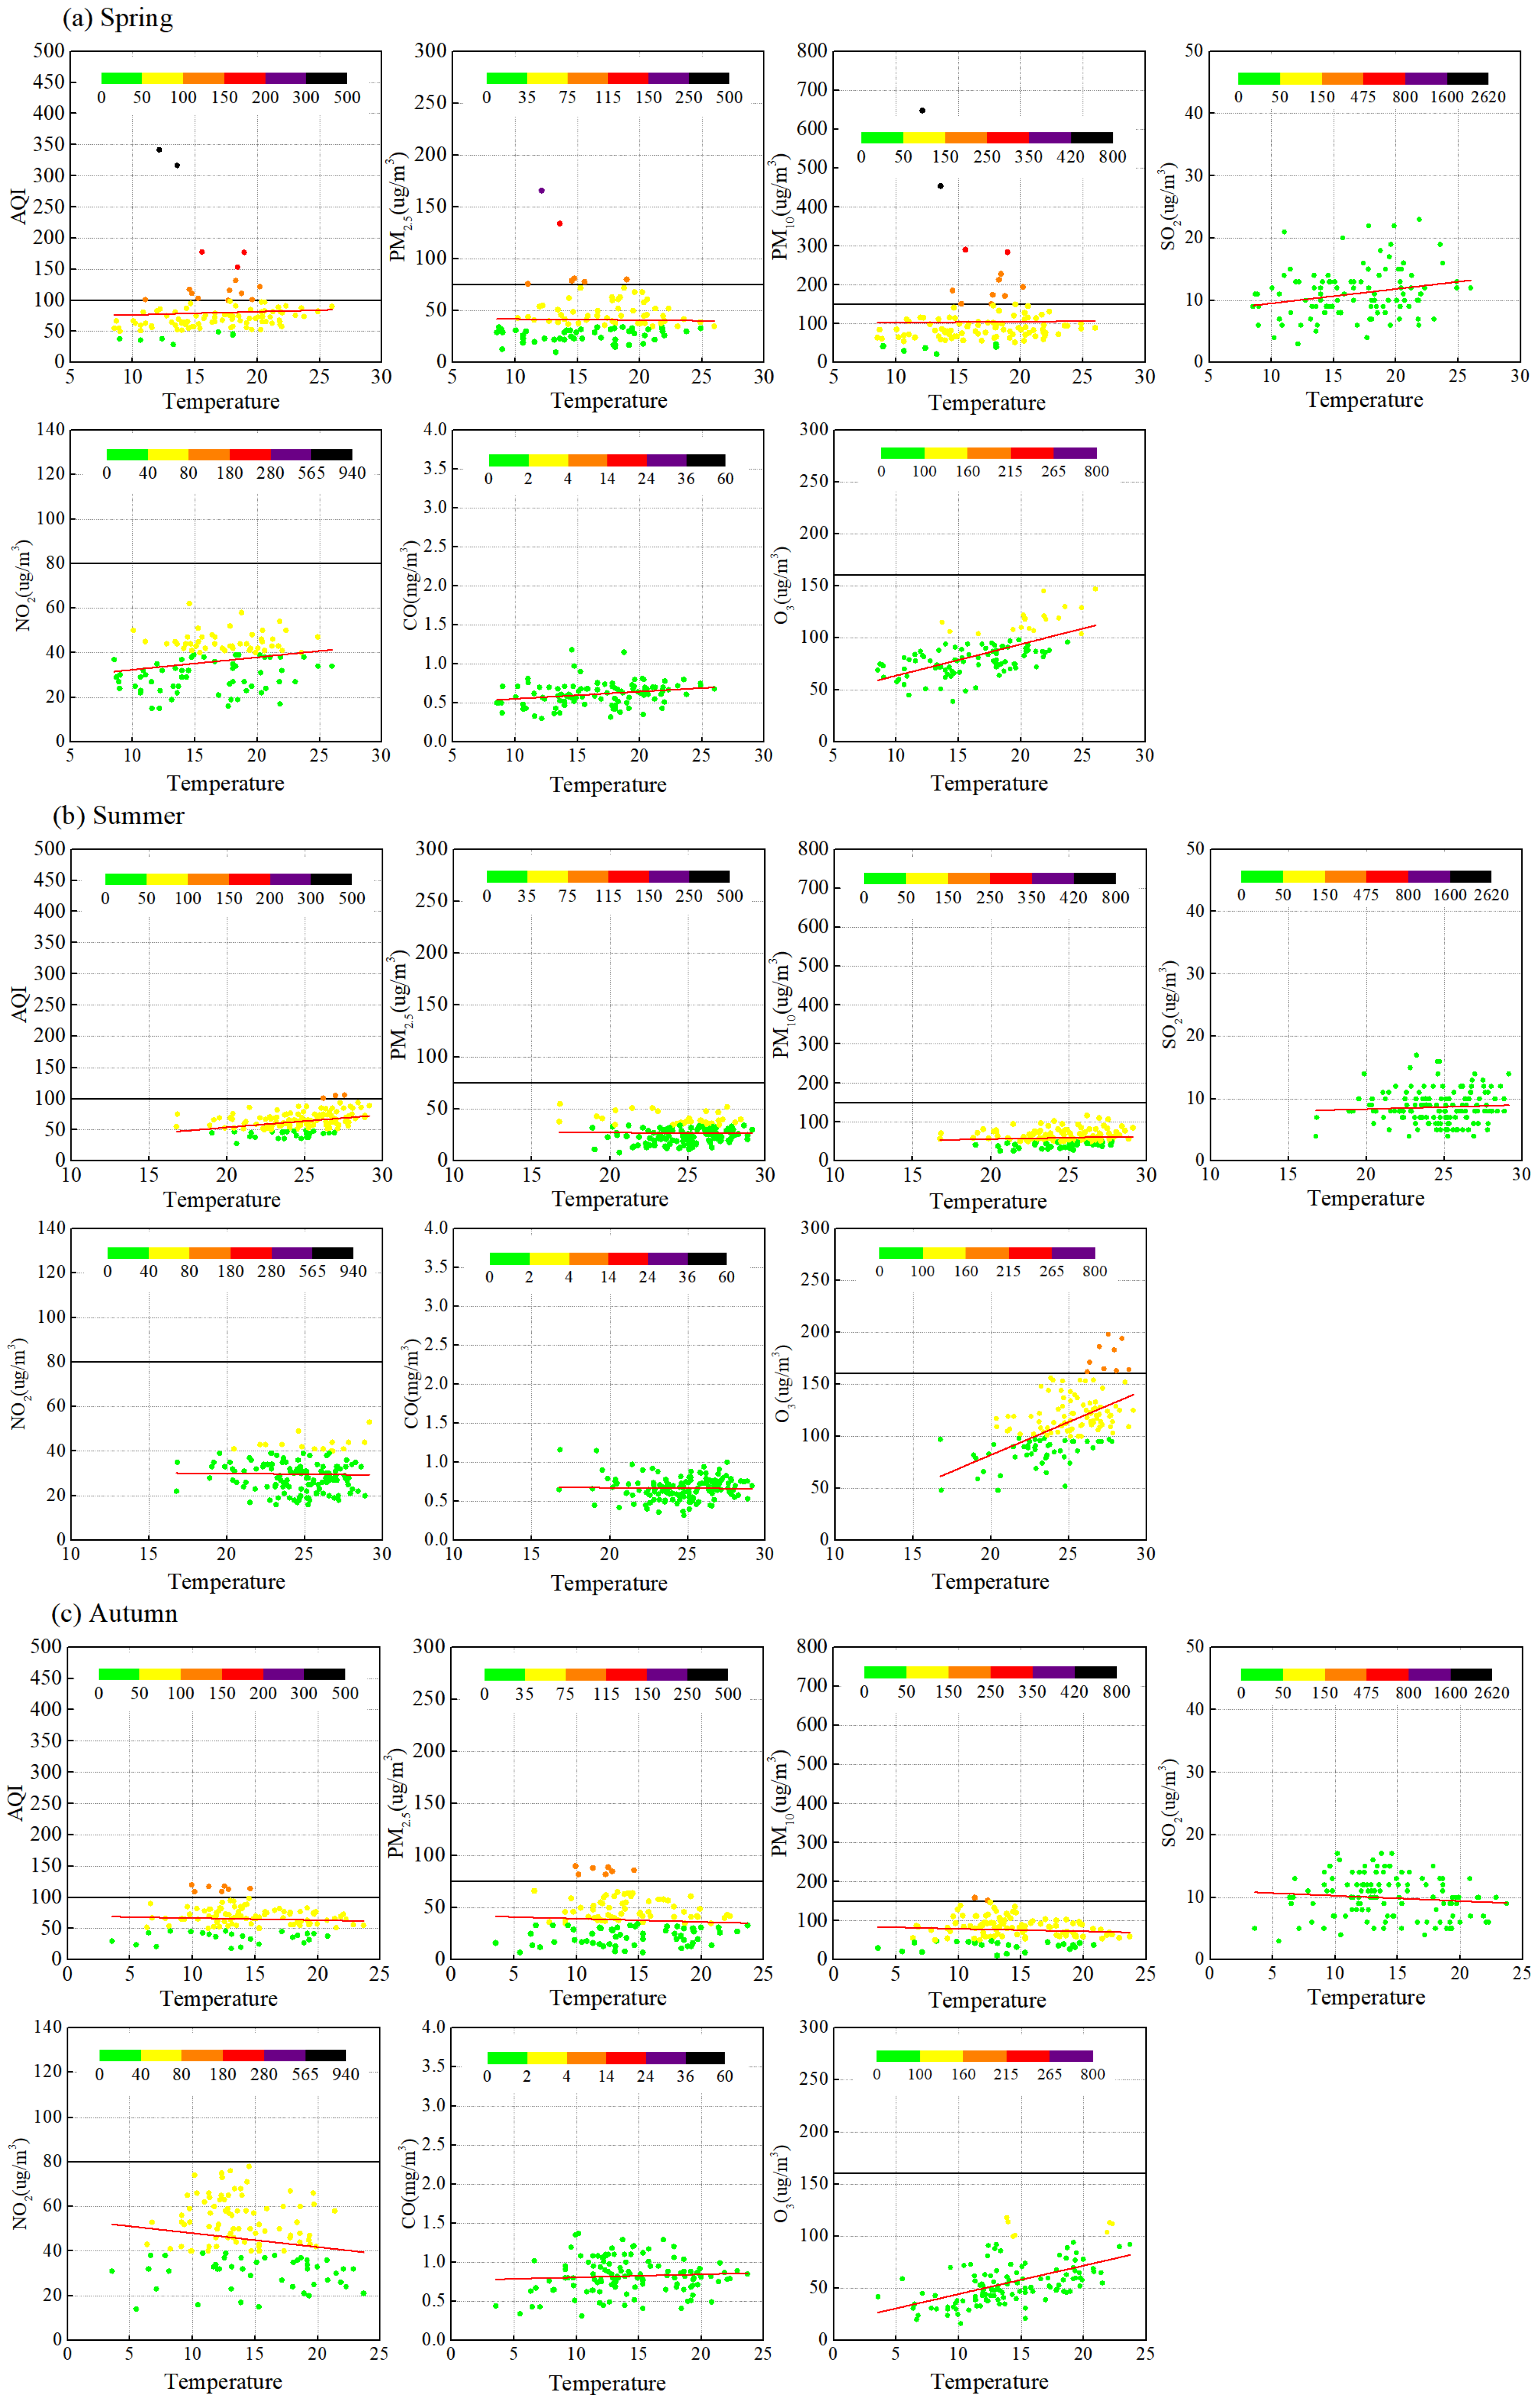
Based on the daily average air quality data and daily mean temperatures in Taiyuan City from 2022 to 2024, the correlations between various air quality indicators and temperature were analyzed, as presented in Figure A2 of Appendix A and Table 2. It should be noted that, to eliminate the impact of precipitation, data with non-zero precipitation were excluded during the statistical analysis.
It can be simply inferred from the aforementioned Figure 7c that there is a positive correlation between temperature and O3 concentration, which consistent with the findings of Wu et al. [20], and a negative correlation with the concentrations of other pollutants. The annual correlation coefficients in Table 2 also demonstrate the correctness of this inference. However, how this relationship will be when broken down by season is the key point that this part of the content needs to focus on.
As evident from Figure A2 of Appendix A and Table 2, during autumn, the correlation between AQI and temperature is not statistically significant. In the spring, AQI exhibits a moderate positive correlation with temperature, with a P S of 0.32, mainly due to the contribution of all pollutants. In the summer when temperatures are relatively high, AQI exhibits a moderate positive correlation with temperature, with a P S of 0.37, mainly due to the contribution of O3 (see Figure A2b in Appendix A). During winter, a season characterized by frequent pollution events, AQI also shows a moderate positive correlation with temperature, with a P S of 0.32, mainly due to the contribution of PM, NO2 and, O3 (see Figure A2d in Appendix A). This finding further suggests that relatively high temperatures during winter often portend poorer air quality conditions.
The correlation between PM2.5 concentration and temperature is not statistically significant in spring, summer, or autumn. In the winter, when PM2.5 pollution is severe, the concentration of PM2.5 is weakly positively correlated with temperature, with a P S of 0.22, indicating that the increase in temperature in winter is not conducive to the dispersion of PM2.5. This phenomenon is not caused solely by the increase in temperature; rather, it is the result of the combined effects of the changes in meteorological conditions and the adjustment of emission source characteristics. On the one hand, the increase in temperature in winter is often accompanied by an increase in the thickness and intensity of the inversion layer, which blocks the dispersion of PM2.5 from the near-ground level to the upper atmosphere, causing pollutants to accumulate continuously at the surface. On the other hand, the increase in temperature accelerates the oxidation reaction rate of gaseous pollutants (such as SO2, NOx, and VOCs), resulting in a significant increase in the secondary formation of PM2.5. What is worse is that the warming in winter is often accompanied by an increase in near-ground humidity. The high-humidity environment provides a liquid carrier for secondary reactions, further accelerating the conversion of gaseous pollutants into PM2.5, while also causing the PM2.5 to expand due to water absorption and increase in concentration.
The correlation pattern between PM10 concentration and temperature is basically the same as PM2.5. In the spring, the concentration of PM10 is weakly positively correlated with temperature, with a P S of 0.23. The reasons have been explained previously (see Section 3.2.2). In the severely polluted winter, the concentration of PM10 is moderately positively correlated with temperature (see Figure A2d in Appendix A), with a P S of 0.38, indicating that the increase in temperature in winter is unfavorable to PM10 also. This may mainly be attributed to the contribution of PM2.5.
The concentration of SO2 was weakly positively correlated with temperature in spring, with a P S of 0.23; the correlation with temperature was poor in summer and autumn; in winter, it was weakly negatively correlated with temperature, with a correlation coefficient of −0.15. There was no case of SO2 concentration exceeding the standard in 2022 to 2024.
In spring, the concentration of NO2 exhibits a weak positive correlation with temperature. During summer and autumn, the correlation between the NO2 concentration and temperature is weak. In winter, a weak positive correlation is observed, with a P S of 0.15. Throughout spring, summer, and autumn, the NO2 concentration does not exceed the standard. However, in winter, occasional exceedances occur (see Figure A2d in Appendix A). An analysis indicates that this is attributed to the increased emissions resulting from winter heating activities.
The concentration of CO and the temperature also show a moderate positive correlation in spring (see Figure A2a in Appendix A). The correlation in the others season is not significant. There was no case of CO concentration exceeding the standard in 2022 to 2024.
The O3 concentration in all seasons is positively correlated with temperature, especially in spring, summer, and autumn, with P S reaching as high as 0.60, 0.56, and 0.57, respectively. Statistical analysis reveals that all the instances of O3 concentration exceeding the standard throughout the year occur when the temperature is above 25 °C, which is mainly determined by the formation mode of O3.
As can be inferred from the above analysis, on an annual basis, all the indicators exhibit a negative correlation with temperature, except O3 (see Figure A2e in Appendix A). Nevertheless, when considering individual seasons, an increase in temperature does not invariably signify favorable air quality. For example, during summer, when temperatures soar, it is essential to exercise caution regarding the potential exceedance of O3 concentration. However, in winter, a rise in temperature is often accompanied by an increase in PM concentration.

3.3.3. Relative Humidity

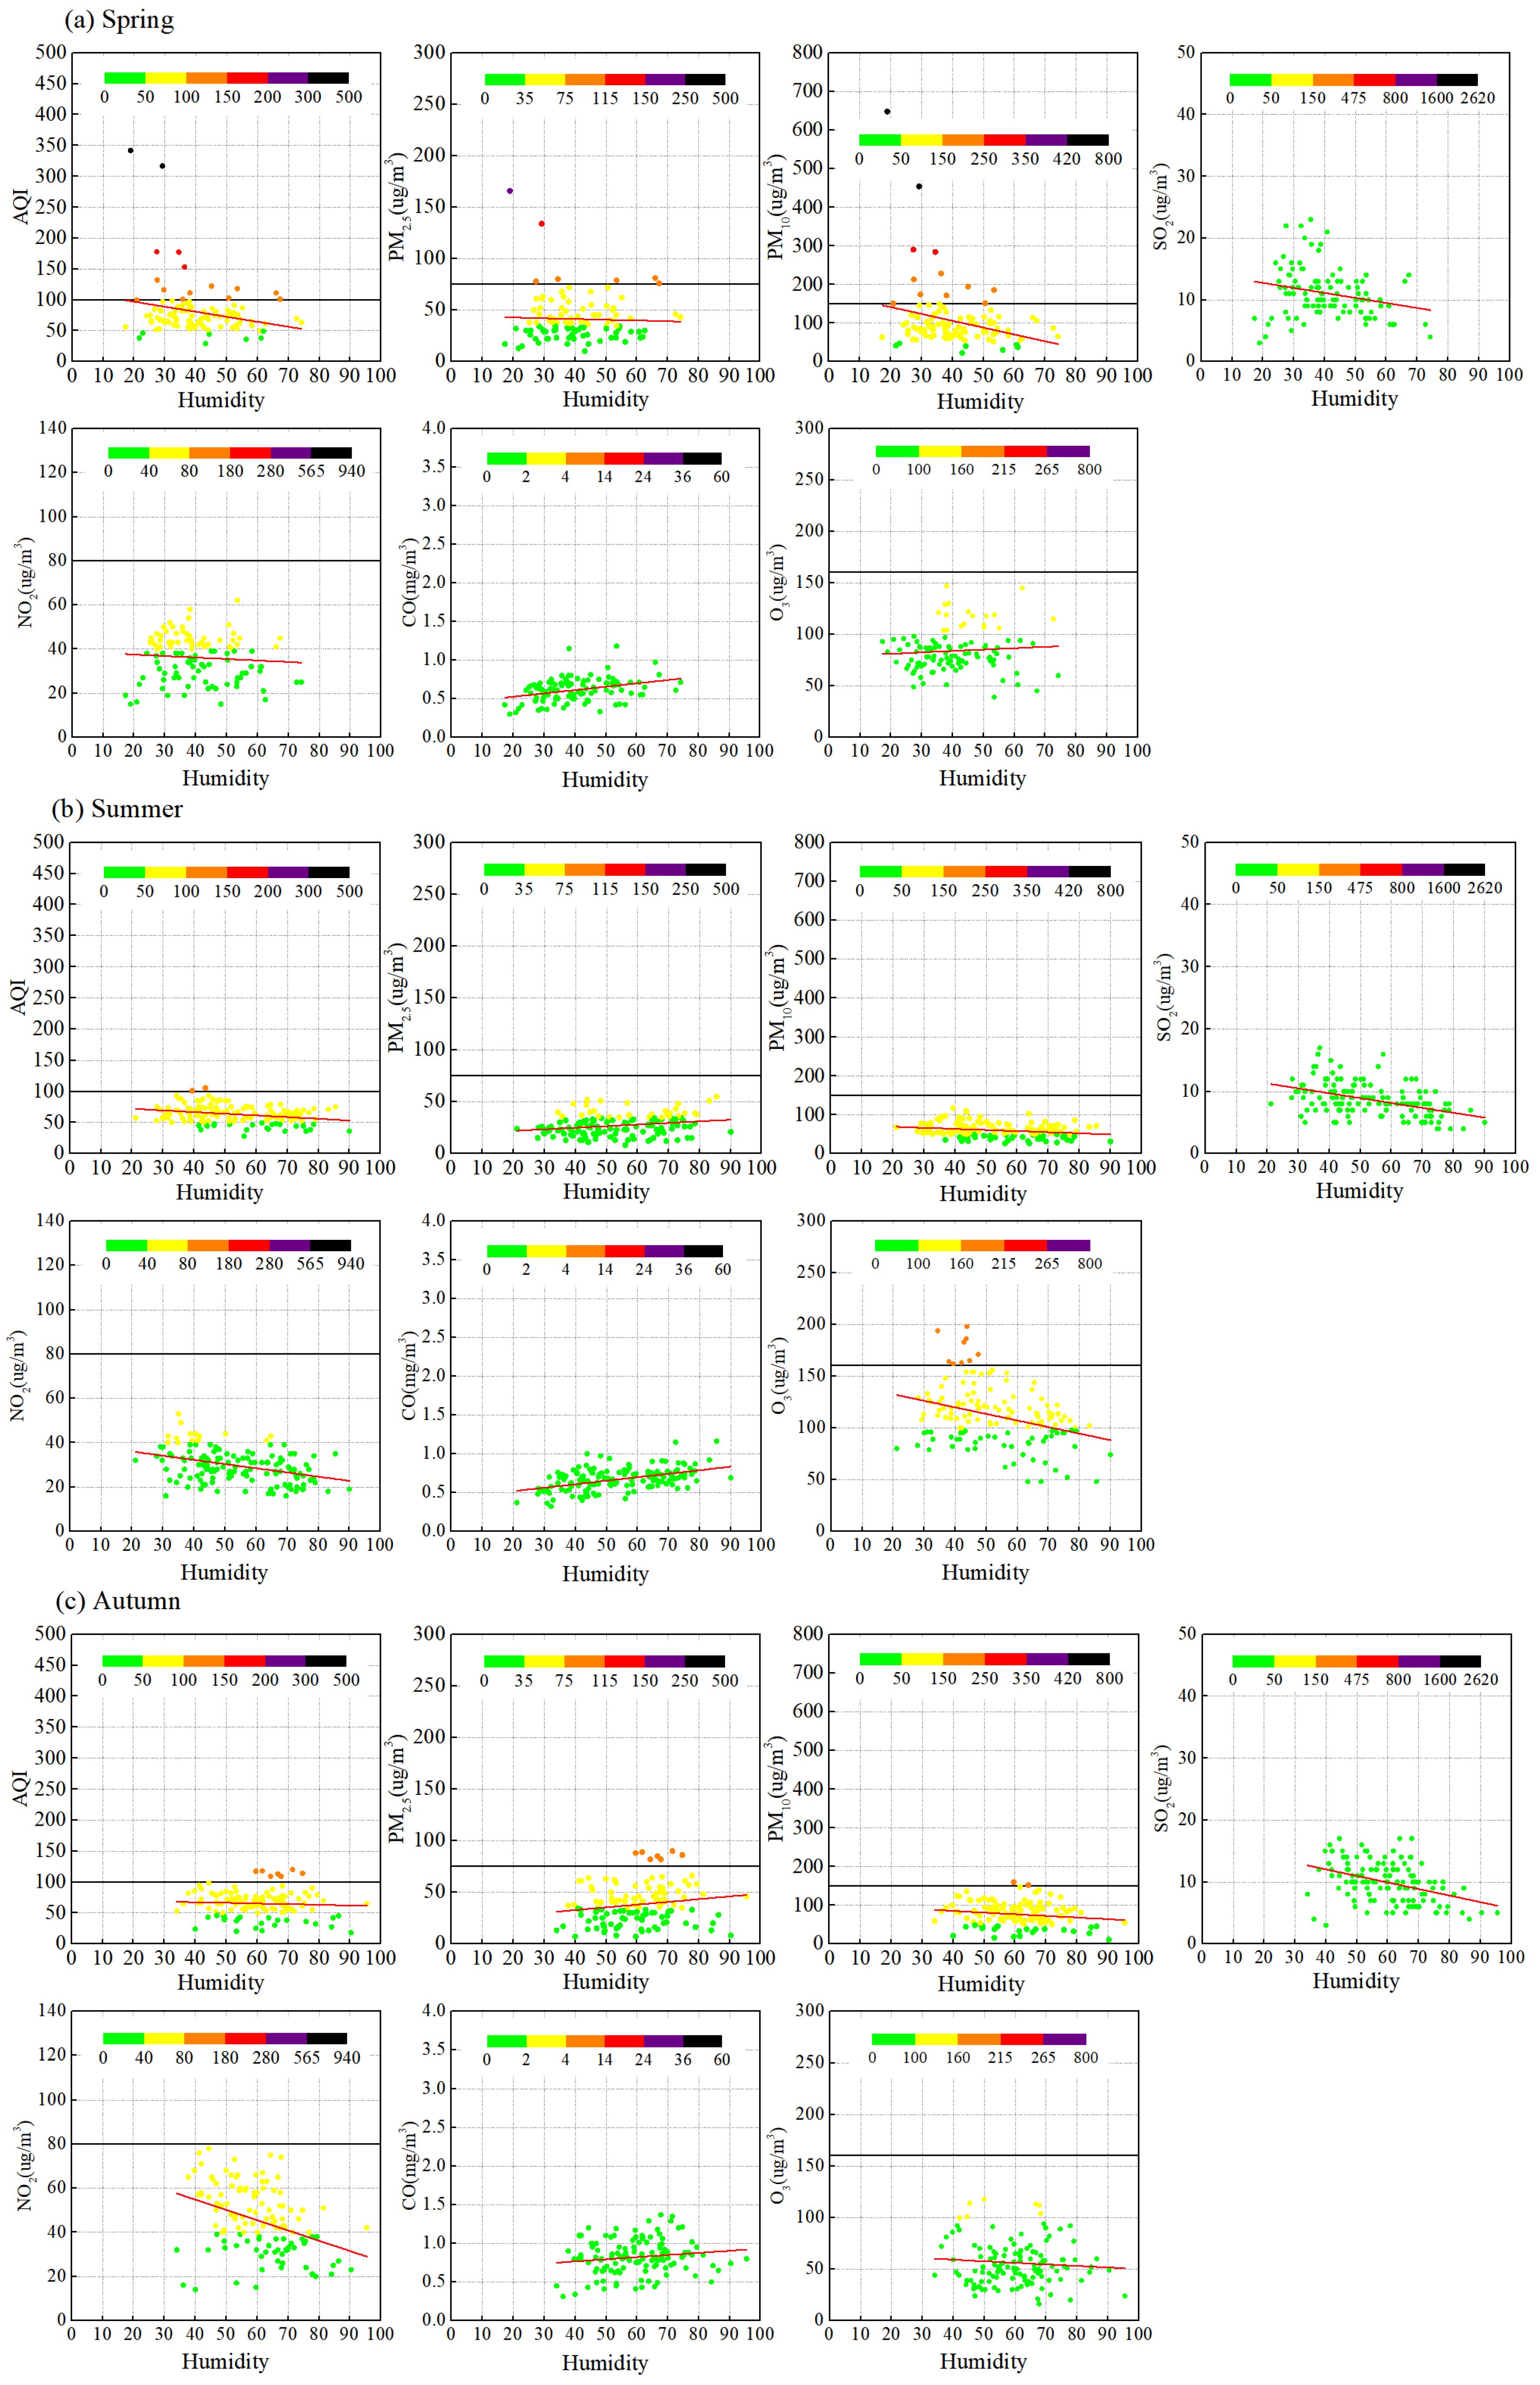
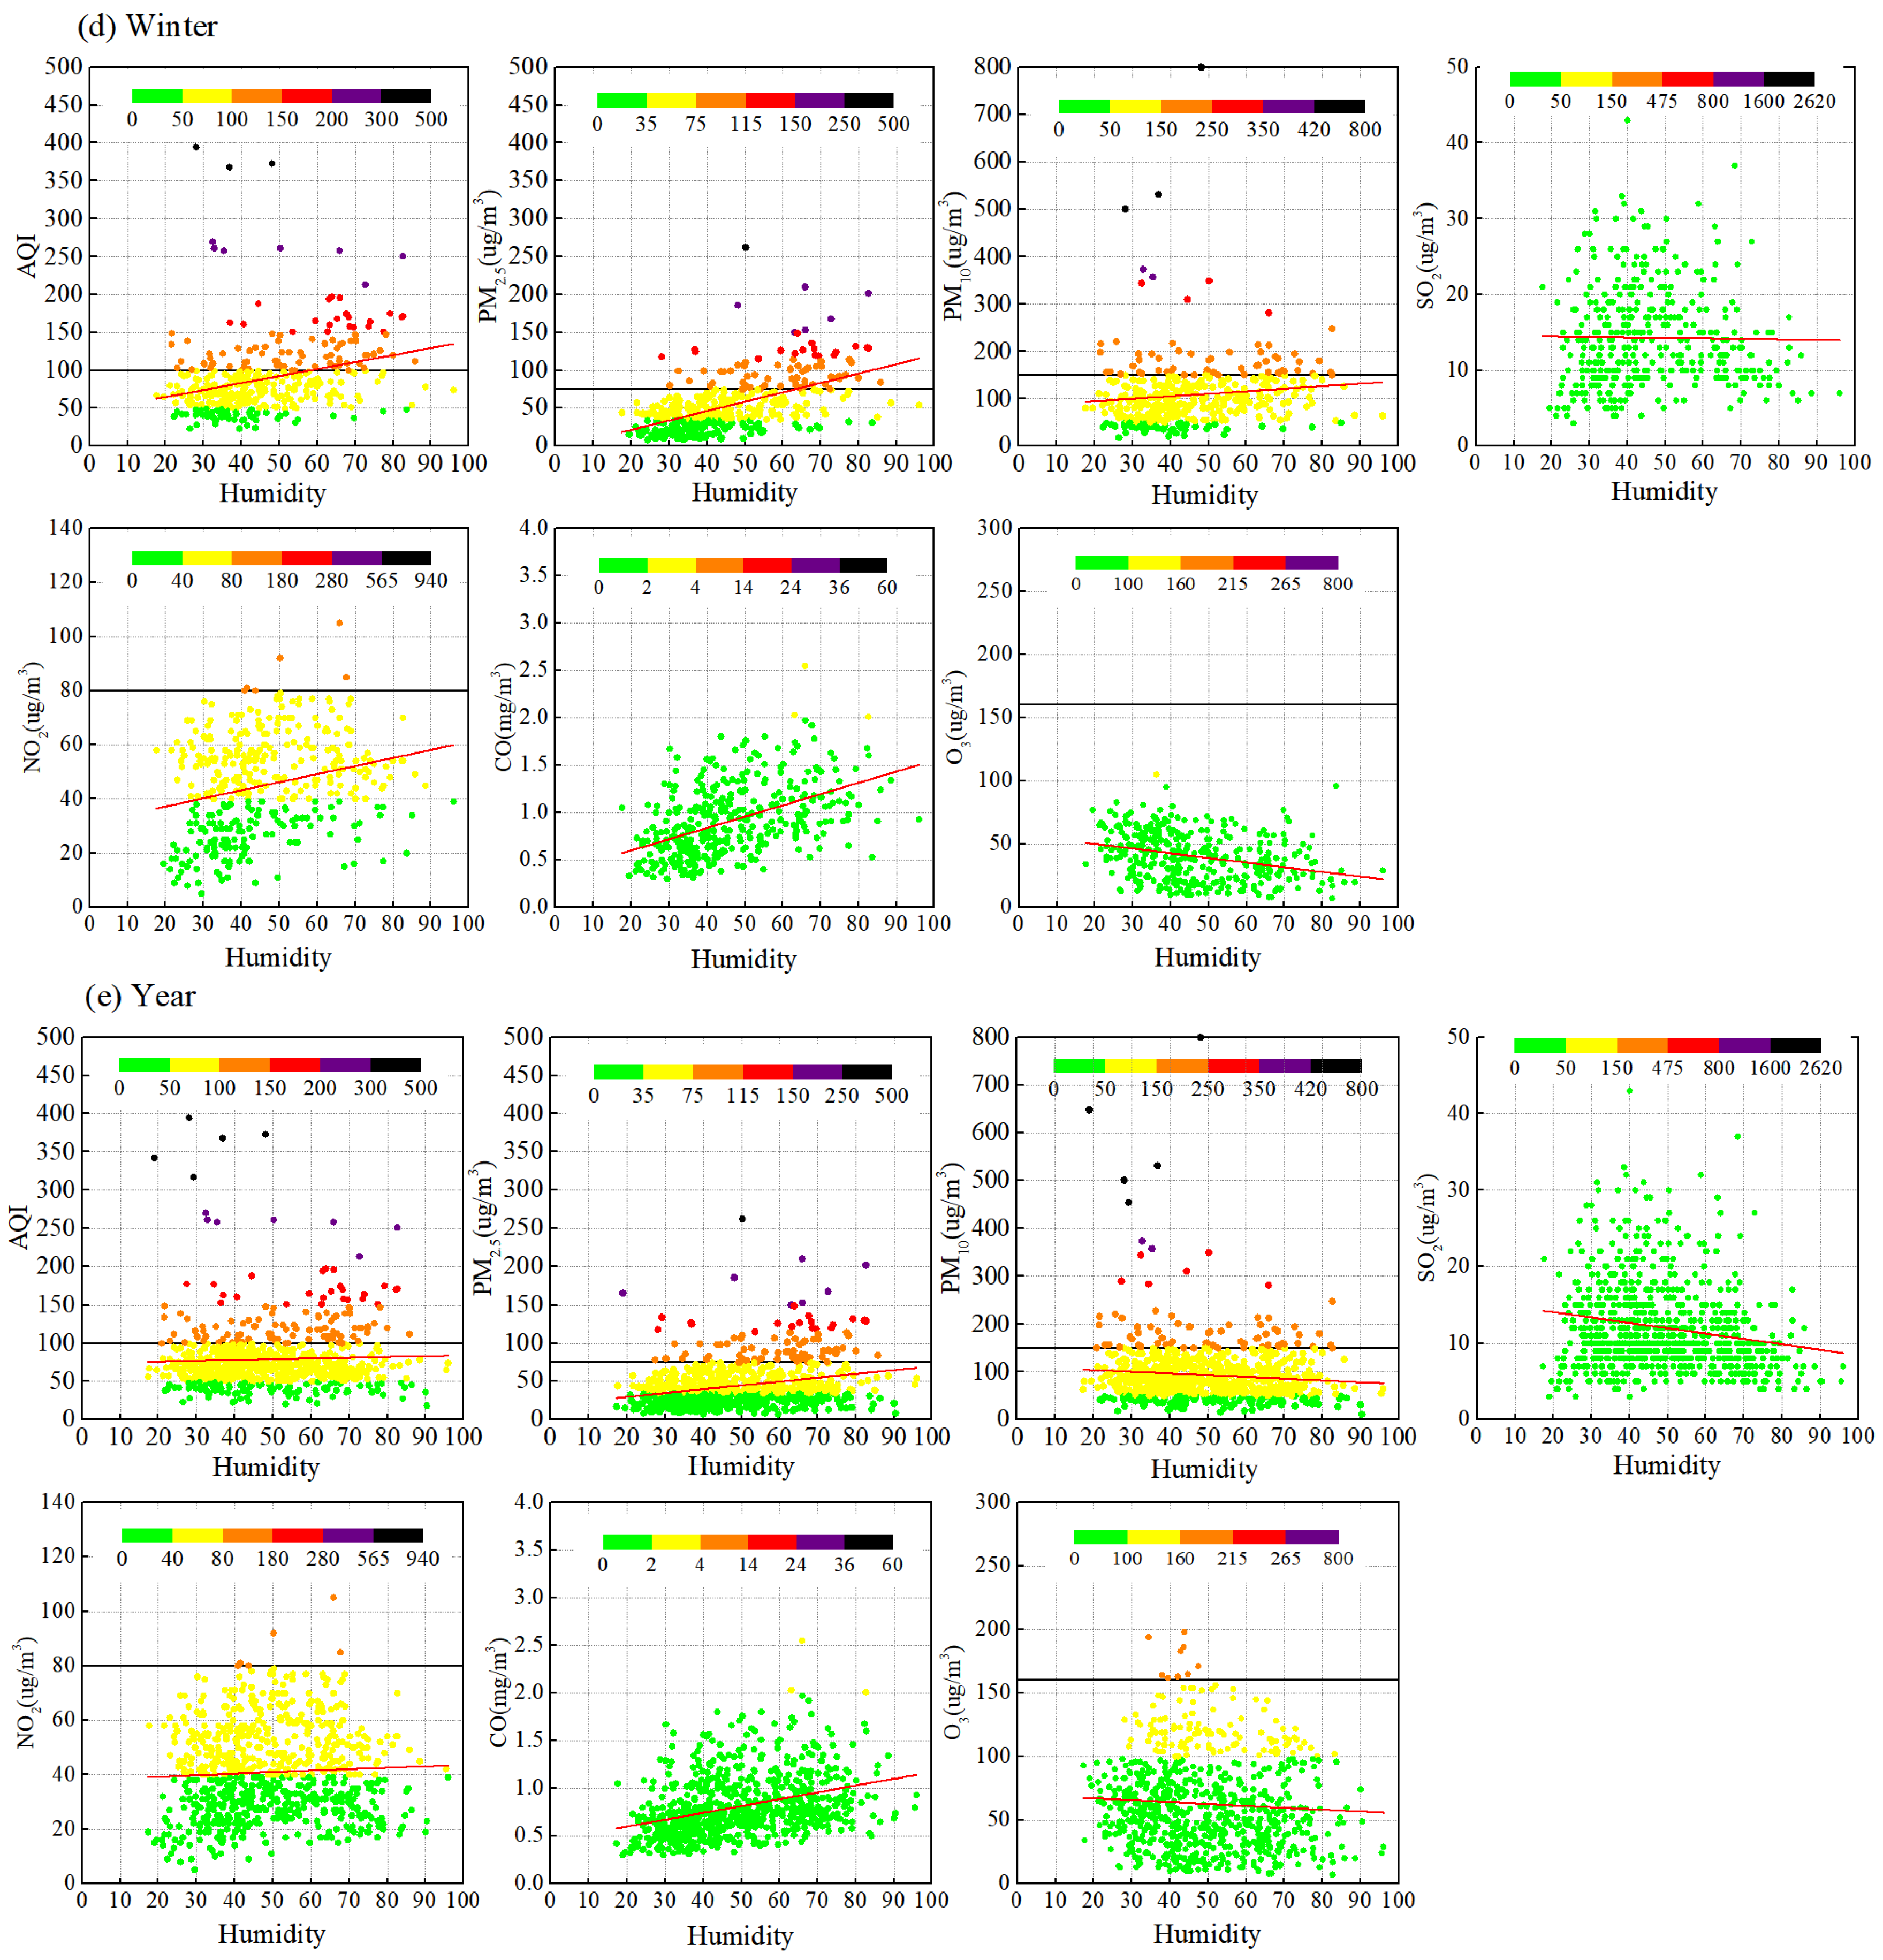
Based on the daily average air quality data and daily average relative humidity (RH) of Taiyuan City from 2022 to 2024, the correlation between each index and humidity was analyzed, as shown in Figure A3 of Appendix A and Table 3. It is necessary to clarify that, to exclude the confounding effects of precipitation, data collected during precipitation events were removed from the statistical analysis.
Evident from Figure A3 of Appendix A and Table 3 is the fact that substantial disparities exist in the correlations between diverse air quality indicators and humidity across different seasons. It is obvious that, in summer and winter, the correlation between pollutant indicators and humidity is stronger than in the other two seasons.
In summer, the correlation between AQI and humidity exhibits a negative trend, with a P S of −0.24. This suggests that, during these time periods, a higher humidity level is associated with better air quality. In summer, aside from reducing the concentration of PM10, the rise in humidity also corresponds to lower solar radiation and O3 levels. The correlation in spring and autumn is not obvious. In winter, a season prone to frequent pollution incidents, AQI is found to have a moderate positive correlation with humidity, with the P S reaching 0.37. This finding indicates that, in winter, an increase in air humidity is associated with a deterioration in air quality, which can be primarily attributed to PM2.5. Statistical analysis reveals that, during winter, when the humidity exceeds 50%, the probability of AQI exceeding the standard (i.e., AQI > 100) is 80.52%. This clearly demonstrates that pollution events are more likely to take place when the winter humidity is greater than 50%.
In spring, the correlation between the PM2.5 concentration and humidity is not statistically significant. In contrast, during the other seasons, a positive correlation is observed. In winter, a season characterized by severe PM2.5 pollution, a strong positive correlation exists between PM2.5 and humidity, with a P S as high as 0.55. Statistical data indicate that the probability of PM2.5 concentration exceeding the standard in winter, when the humidity is greater than 50%, is as high as 79.22% (see Figure A3d in Appendix A). This clearly demonstrates that high humidity exacerbates PM2.5 pollution. There are two main contributing factors. Firstly, an increase in relative humidity facilitates the hygroscopic growth of fine particulate matter, thereby increasing its mass concentration. Secondly, under high-humidity conditions in winter, a relatively high degree of conversion occurs, with SO2 being transformed into sulfates and NO2 into nitrates. This promotes the conversion of gaseous precursors into PM2.5, leading to the formation of secondary particulate matter and ultimately an increase in the concentration of fine particulate matter. This can also explain foggy weather, particularly dense fog and fog with a long duration, containing a high moisture concentration. It can serve as a carrier for suspended particulate matter and other pollutants in the atmosphere, thereby giving rise to “fog droplets” capable of absorbing and accumulating particulate pollutants. Furthermore, when fog interacts with preexisting air pollutants, it may trigger the formation of secondary pollutants such as sulfuric acid and nitric acid aerosols. This process further exacerbates the air quality problem. Shao et al. [14] discovered that, when the relative humidity surpassed 80%, there was a notable increase in secondary inorganic aerosols indicating that, under extremely humid conditions, the aqueous-phase reactions are enhanced remarkably.
Despite both being PM, the correlation between PM10 concentration and humidity diverges notably from that of PM2.5. During spring, a weak negative correlation is observed. Statistical analysis reveals that the probability of PM10 concentration exceeding the standard when the humidity is less than 40% in spring is 72.73%. This indicates that PM10 concentration is more prone to exceed the standard under low-humidity conditions in spring. The underlying cause can be attributed to the relatively high wind speed and low soil moisture content during this season. Under such circumstances, PM10 primarily originates from windblown dust. In both summer and autumn, the concentration of PM10 exhibits a negative correlation with humidity. Winter differs significantly from the other seasons. Specifically, a weak positive correlation exists between the PM10 concentration and humidity (see Figure A3e in Appendix A). Nevertheless, statistical findings indicate that there is no particularly distinct correlation between the exceedance of the PM10 concentration standard and humidity.
In comparison to PM, the concentrations of gaseous pollutants (SO2, NO2, and CO) exhibit a stronger correlation with humidity. With the exception of winter, during which the correlation between the concentration of SO2 and humidity was not significant, it exhibited a negative correlation in the other seasons. Throughout the years from 2022 to 2024, no instances of SO2 concentrations exceeding the standard were recorded.
In winter, when the concentration of NO2 occasionally exceeds the standard, a weak positive correlation exists between the concentration and humidity, with a P S of 0.27. Statistical analysis shows that the probability of the NO2 concentration exceeding the standard in winter when the humidity is greater than 50% is 60.71%. The CO concentration in each season is positively correlated with humidity. There was no case of CO concentration exceeding the standard in 2022 to 2024.
In spring and autumn, the correlation between the concentration of O3 and humidity is poor. Nonetheless, during summer, when the O3 concentration exceeds the standard, a moderate negative correlation with humidity is observed (see Figure A3b in Appendix A). Statistical data show that all instances of O3 concentration surpassing the standard occur when the humidity is less than 50%. This indicates that the phenomenon of O3 concentration exceeding the standard predominantly takes place under low-humidity conditions. The main reason is that an increase in humidity can accelerate the liquid-phase chemical reaction of O3. Furthermore, an increase in humidity is often accompanied by precipitation or an increase in cloud cover, and it has a significant effect in reducing O3 levels.
To sum up, the influence of humidity on air quality varies entirely with the change in seasons. An increase in humidity is advantageous in spring, which can be attributed to its ability to reduce the concentration of PM10. On the contrary, in winter, an increase in humidity actually leads to an elevation in the concentrations of both PM2.5 and PM10, thus deteriorating air quality.

3.3.4. Precipitation

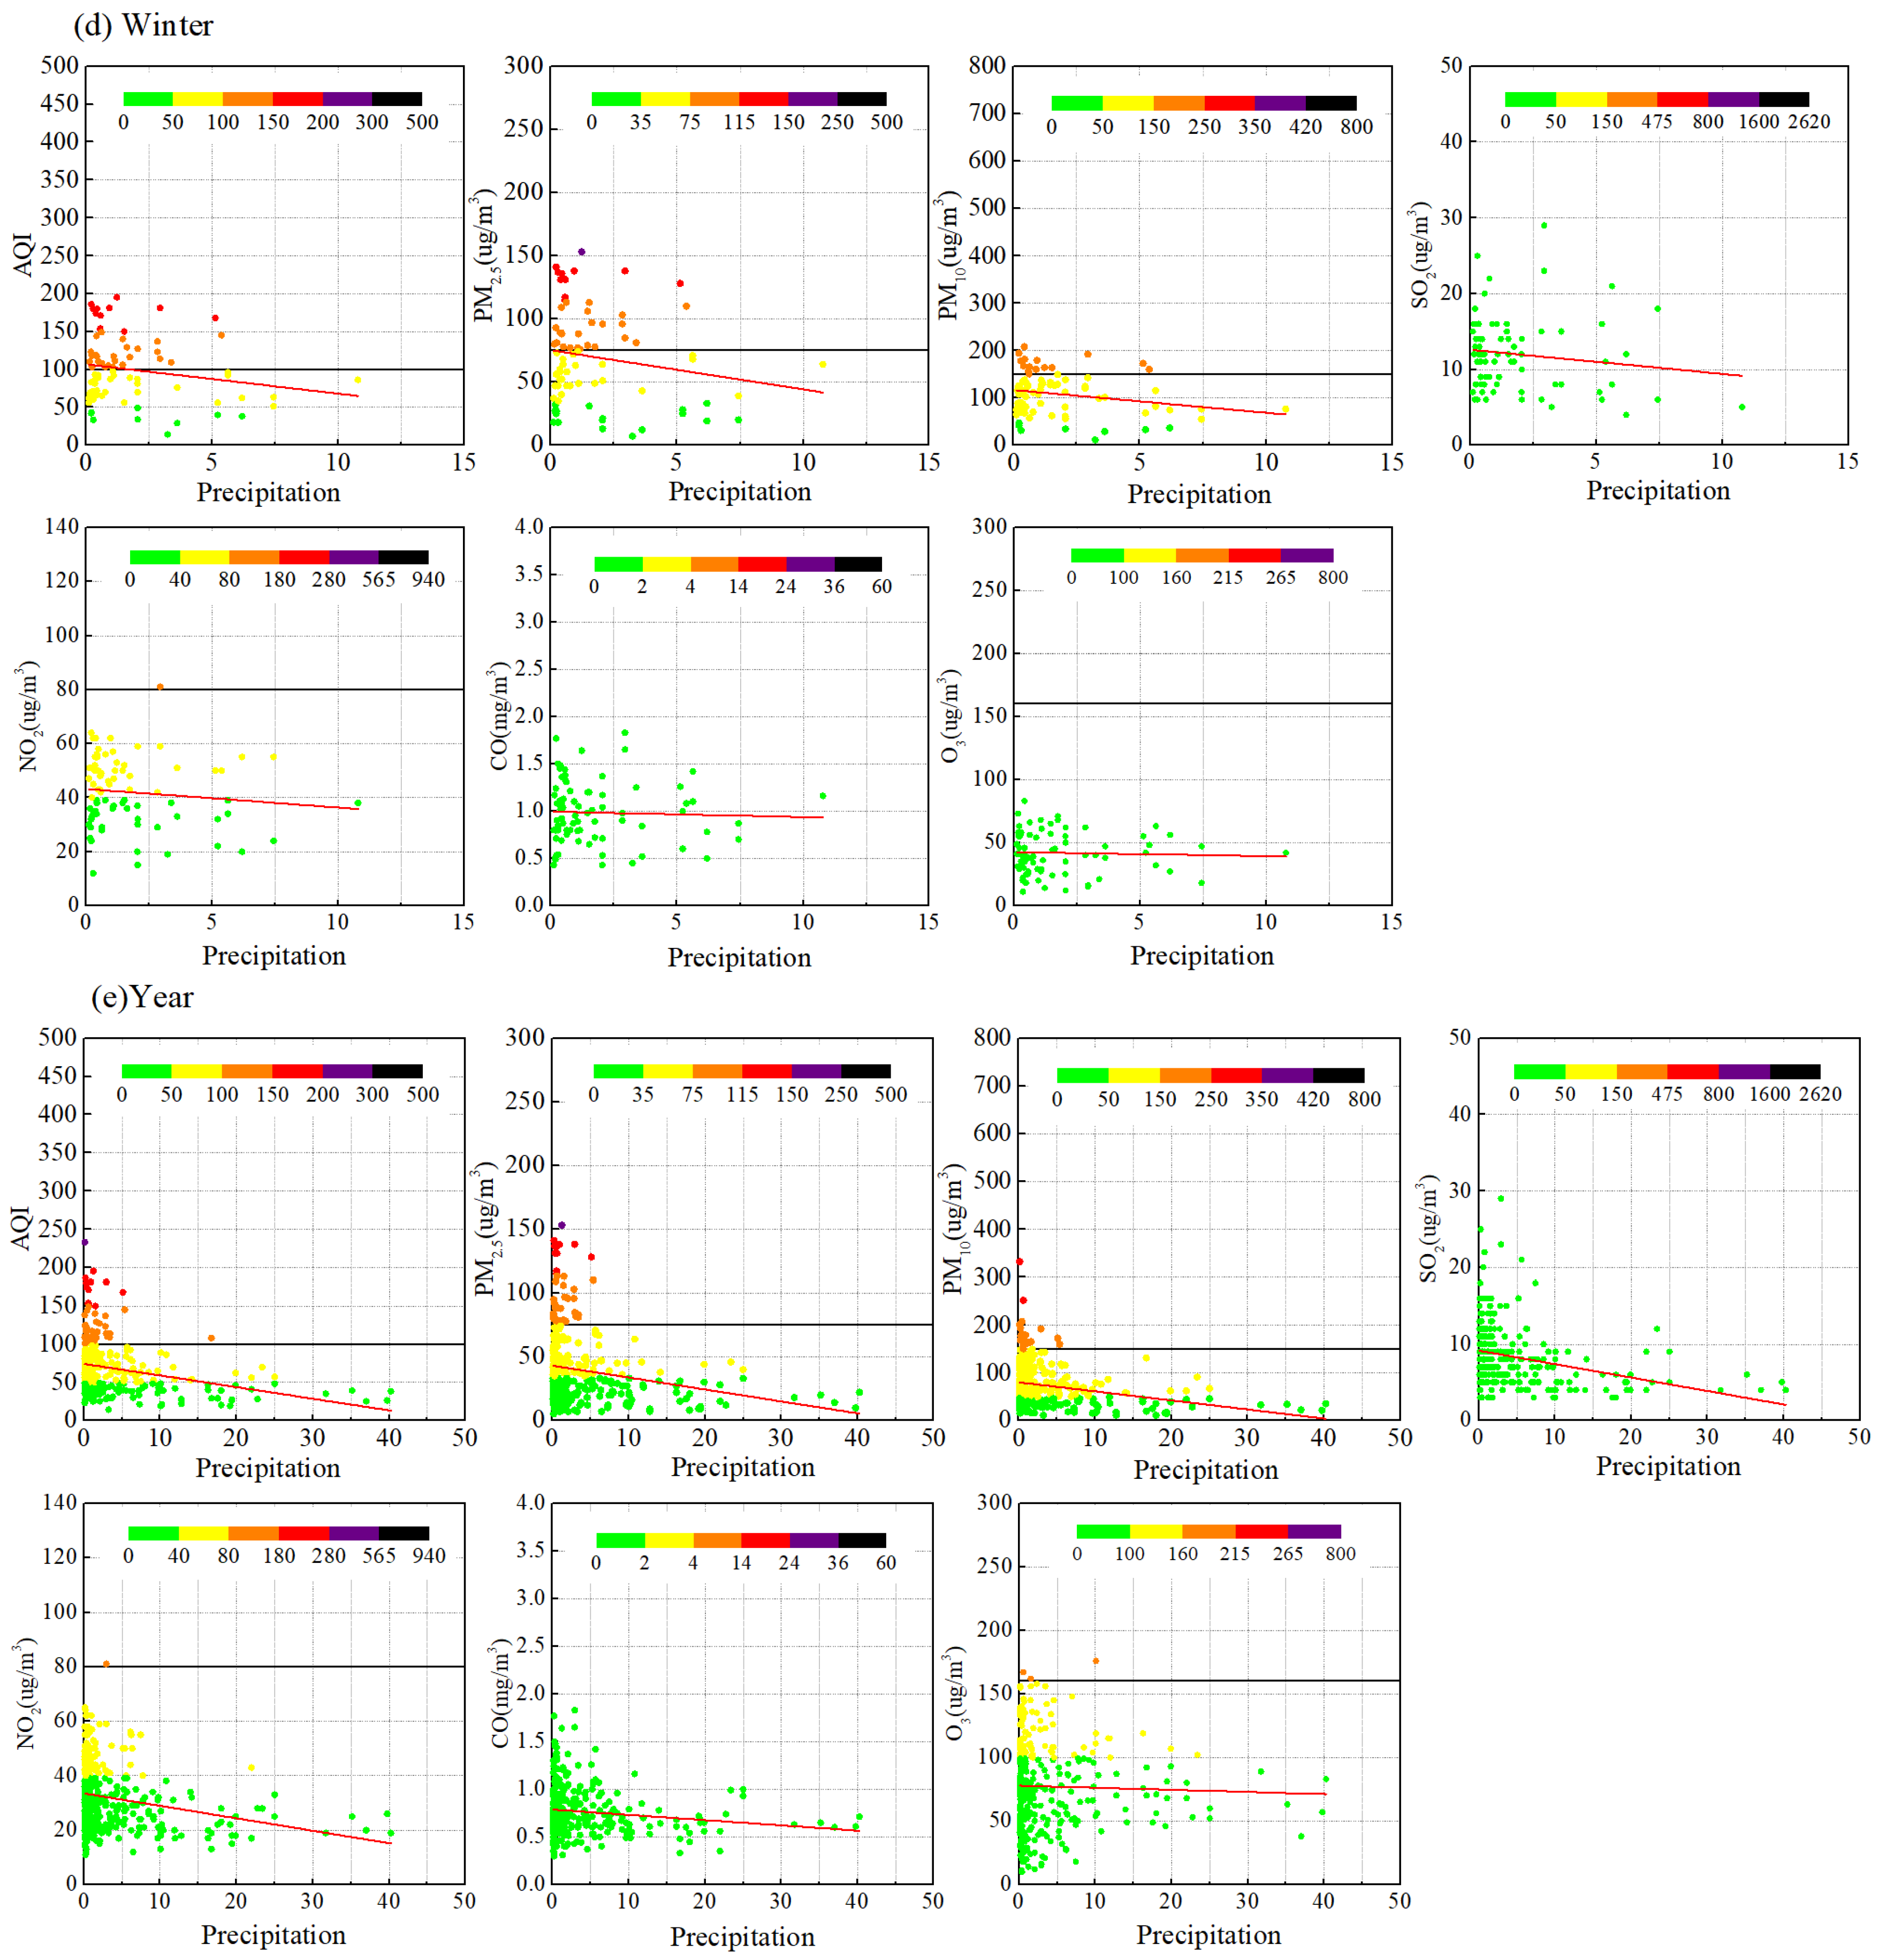
Typically, during rainfall, the processes of scouring and wet deposition lead to a decrease in the concentration of pollutants. By statistically analyzing the daily average air quality data and precipitation data of Taiyuan City from 2022 to 2024, it was found that the probability of the AQI exceeding the standard when the precipitation was zero was 1.16 times that when precipitation occurred. Similarly, for PM2.5, PM10, and O3, the corresponding multiples were 1.29, 1.76, and 1.42, respectively. Thus, it can be deduced that precipitation can generally help in removing pollutants from the air. The subsequent analysis focuses on the correlation between each air quality indicator and the precipitation amount during periods of precipitation. The results are presented in Table 4 and Figure A4 of Appendix A.
As can be gleaned from Table 4 and Figure A4 of Appendix A, the AQI and the concentrations of six pollutants exhibit a negative correlation with precipitation amounts. This indicates that precipitation plays a positive role in improving air quality. In spring, the climate is arid with scarce rainfall, and the precipitation amount is mostly less than 5 mm (see Figure A4a in Appendix A). While the correlation between O3 and precipitation is not significant, the other indicators all show a negative correlation with precipitation. This suggests that precipitation in spring is generally beneficial for the improvement of air quality. Moreover, it has been found that, when the precipitation amount exceeds 5 mm, there are scarcely any situations where the air quality standards are exceeded. During the summer, there is a relatively higher volume of rainfall. The AQI and the concentrations of the six pollutants all exhibit negative correlations with precipitation amounts to varying extents (see Figure A4b in Appendix A). In autumn, the AQI and the concentrations of the six pollutants also display a negative correlation with precipitation (see Figure A4c in Appendix A). However, this correlation is less pronounced compared to that in spring and summer, due to the precipitation amount in autumn being relatively low, and most of the precipitation events are light rains with amounts less than 3 mm. In the winter season, characterized by aridity and scarce precipitation, the correlations of all indicators with precipitation were not notable (see Figure A4d in Appendix A). Nevertheless, it has been observed that when the precipitation amount exceeds 3 mm, the instances of exceeding the standard are remarkably fewer. The correlation analysis over the entire year indicates that, apart from the O3 and CO concentrations, which show an insignificant correlation with precipitation, all other indicators exhibit a negative correlation with precipitation. Moreover, the role of precipitation in improving air quality is more pronounced during spring and summer. Zhang et al. [10] investigated the spatiotemporal variations and their influencing factors on PM2.5 concentrations in Beijing during the 2013–2018 period, and came to the conclusion that precipitation reduced PM2.5 concentrations, although the effect was minimal when precipitation was <1 mm.
A comprehensive analysis reveals that air quality and meteorological factors, including wind speed, temperature, humidity, and precipitation, exhibit correlations of varying magnitudes. Moreover, these correlations are subject to seasonal variations. In spring, Taiyuan City predominantly experiences slight air pollution. The AQI is primarily correlated with wind speed, temperature, and precipitation, especially precipitation. The main pollutants are PM. Occasional mild pollution occurs in summer, with O3 being the main pollutant. The concentration of O3 in summer is mainly related to humidity and temperature, and high-temperature and low-humidity conditions are conducive to the formation of O3. Overall, the air quality during autumn is relatively favorable. The degree of air pollution is most severe in winter. The AQI is predominantly correlated with temperature and humidity. The primary pollutants are PM. Among them, PM2.5 mainly consists of secondary particulate matter, which is associated with humidity, wind speed, and temperature. In particular, humidity plays a significant role. The scenario characterized by relatively high temperature, high humidity, and low wind speed is the most adverse condition. There are primarily three reasons for the severe PM2.5 pollution in winter. Firstly, the high-humidity conditions in winter are conducive to the hygroscopic growth of fine particulate matter. High humidity provides an environment where fine particles can absorb moisture and increase in size, which in turn affects their dispersion and removal processes in the atmosphere. Secondly, under high-humidity circumstances, the conversion rate of secondary particulate matter is relatively high. Chemical reactions in the atmosphere are more likely to occur, leading to the formation of a large amount of secondary PM2.5 from precursor pollutants such as sulfur dioxide, nitrogen oxides, and volatile organic compounds. Thirdly, Taiyuan City is surrounded by mountains on three sides. Coupled with the relatively low wind speed, thin boundary-layer thickness, and stable atmospheric stratification in winter, these factors greatly impede the diffusion of pollutants. The mountains act as a physical barrier, reducing the effective ventilation of the urban area, while the low wind speed and stable atmospheric conditions limit the dilution and transport of pollutants away from the source areas. In addition, the increase in PM2.5 concentration in winter has a significant impact on atmospheric visibility. This reduction in visibility can lead to the aggravation of temperature inversion. As the temperature inversion becomes more pronounced, the atmospheric stratification becomes more stable. This forms a vicious cycle, making it easier to cause continuous air pollution, further deteriorating the air quality over an extended period. Aside from the contribution of fine particulate matter, PM10 primarily results from the direct emissions of industrial sources. This is associated with temperature, humidity, and precipitation. High-humidity conditions facilitate the hygroscopic growth of particulate matter. Moreover, the relatively low wind speed during winter contributes to the exceedance of the PM10 concentration standard.

4. Conclusions

Air quality is influenced by multiple factors such as the emission intensity of pollution sources, geographical and climatic background, and cross-regional transmission. This study only analyzes the correlation between daily average air quality data and meteorological conditions from a statistical perspective. It has not covered dimensions such as extreme events and diurnal variations, but it still provides reference values for exploring the regular impact of major meteorological factors on air quality.
This research is grounded in the observational data of surface meteorological stations in Taiyuan City from 2022 to 2024 and the air quality data collected at the monitoring sites in Taiyuan. An analysis was conducted to explore the influence of key meteorological elements on air quality. The principal findings are presented as follows:
Over the past three years, the annual average wind speed in Taiyuan City has been 2.15 m/s, which is relatively low. The magnitude of the wind speed exhibits distinct seasonality, being the highest in spring and the lowest in winter. Statistical analysis reveals that the probability of the daily average wind speed being less than 3 m/s is as high as 82.57%. Temperature, humidity, and precipitation all exhibit pronounced seasonal variations. Temperature is highest in summer and lowest in winter. Humidity is relatively low in spring and winter, while it is relatively high in summer and autumn. Precipitation is most abundant in summer, followed by spring and autumn, and is minimal in winter. Additionally, the probability of light rain (i.e., daily precipitation < 10 mm) is 28.49%, making it the most prevalent type of precipitation.
The air quality exhibits distinct temporal distribution characteristics. Thanks to a series of energy conservation, emission reduction, and pollution control measures, the number of days with good air quality generally showed an increasing trend from 2022 to 2024. During summer and autumn, the AQI is relatively low, with the highest proportion of days featuring good air quality. Mild air pollution incidents occur only occasionally. Conversely, air pollution is predominantly concentrated in spring and winter, particularly in the winter months. Moderate pollution and more severe levels of contamination mainly occur between January and March.
Wind speed influences air quality and is intricately associated with the seasons. In spring, a higher wind speed corresponds to lower concentrations of NO2. Conversely, the concentration of PM10 increases with wind speed. In summer, wind speed shows a negative correlation with CO and a positive correlation with O3. In autumn, with the exception of O3, wind speed exhibits a negative correlation with various air pollutants. During winter, wind speed has a favorable effect on most atmospheric pollutants, with the exceptions of O3 and PM10.
From an annual perspective, all indicators exhibit a negative correlation with temperature, except O3. Nevertheless, when taking individual seasons into account, an increase in temperature does not invariably signify good air quality. For instance, in summer, when temperatures soar, it is necessary to be vigilant about the possibility of O3 concentration exceeding standards. But, in winter, a temperature increase is often accompanied by an increase in PM concentration.
The impact of humidity on air quality varies completely with the seasons. In spring, an increase in humidity is highly beneficial as it helps to reduce the concentration of PM10. Conversely, in winter, an increase in humidity actually leads to a rise in the concentrations of PM2.5 and PM10, thereby deteriorating air quality. Precipitation can significantly improve air quality, especially when the precipitation exceeds 3 mm.
These findings suggest that pollutant control strategies may need to be tailored seasonally, particularly with regard to PM.

Author Contributions

Acquisition, analysis, and interpretation of data, investigation, writing—original draft: X.H.; writing—review and editing: X.H. and L.G. All authors have read and agreed to the published version of the manuscript.

Funding

The current work was supported by the University-level Research Fund (No. KJ202419), the University-level Research Innovation Platform (No. PT202408), and the University-level Innovation Team (No. TD202405) of Shanxi Vocational University of Engineering Science and Technology.

Institutional Review Board Statement

This study did not involve humans or animals.

Data Availability Statement

All relevant data are within the manuscript.

Conflicts of Interest

The authors have declared that no competing interests exist.

Appendix A

Figure A1. Correlation between wind speed and air quality. (a) Spring. (b) Summer. (c) Autumn. (d) Winter. (e) Entire year. (Note: ① The daily air quality data and wind speed are, respectively, derived from the observation data of the national monitoring points and the ground meteorological station (Wusu Station) in Taiyuan City during the period from 2022 to 2024. ② The determination of whether the air quality indicators exceed the standard is based on the 24 h average limit values of the secondary standards stipulated in the “Ambient Air Quality Standard” (GB3095-2012) and its amendment. For ozone (O3), the reference value is the daily maximum 8 h average limit value).
Atmosphere 16 01209 g0a1aAtmosphere 16 01209 g0a1b
Figure A2. Correlation between temperature and air quality. (a) Spring. (b) Summer. (c) Autumn. (d) Winter. (e) Entire year. (Note: ① The daily air quality data and temperature are, respectively, derived from the observation data of the national monitoring points and the ground meteorological station (Wusu Station) in Taiyuan City during the period from 2022 to 2024. ② The determination of whether the air quality indicators exceed the standard is based on the 24 h average limit values of the secondary standards stipulated in the “Ambient Air Quality Standard” (GB3095-2012) and its amendment. For ozone (O3), the reference value is the daily maximum 8 h average limit value).
Atmosphere 16 01209 g0a2aAtmosphere 16 01209 g0a2b
Figure A3. Correlation between relative humidity and air quality. (a) Spring. (b) Summer. (c) Autumn. (d) Winter. (e) Entire year. (Note: ① The daily air quality data and relative humidity are, respectively, derived from the observation data of the national monitoring points and the ground meteorological station (Wusu Station) in Taiyuan City during the period from 2022 to 2024. ② The determination of whether the air quality indicators exceed the standard is based on the 24 h average limit values of the secondary standards stipulated in the “Ambient Air Quality Standard” (GB3095-2012) and its amendment. For ozone (O3), the reference value is the daily maximum 8 h average limit value).
Atmosphere 16 01209 g0a3aAtmosphere 16 01209 g0a3b
Figure A4. Correlation between precipitation and air quality. (a) Spring. (b) Summer. (c) Autumn. (d) Winter. (e) Entire year. (Note: ① The daily air quality data and precipitation are, respectively, derived from the observation data of the national monitoring points and the ground meteorological station (Wusu Station) in Taiyuan City during the period from 2022 to 2024. ② The determination of whether the air quality indicators exceed the standard is based on the 24 h average limit values of the secondary standards stipulated in the “Ambient Air Quality Standard” (GB3095-2012) and its amendment. For ozone (O3), the reference value is the daily maximum 8 h average limit value).
Atmosphere 16 01209 g0a4aAtmosphere 16 01209 g0a4b

References

  1. Geng, G.; Zheng, Y.; Zhang, Q.; Xue, T.; Zhao, H.; Tong, D.; Zheng, B.; Li, M.; Liu, F.; Hong, C.; et al. Drivers of PM2.5 air pollution deaths in China 2002–2017. Nat. Geosci. 2021, 14, 645–650. [Google Scholar] [CrossRef]
  2. Strak, M.; Weinmayr, G.; Rodopoulou, S.; Chen, J.; Hoogh, K.; Andersen, Z.J.; Atkinson, R.; Bauwelinck, M.; Bekkevold, T.; Bellander, T.; et al. Long term exposure to low level air pollution and mortality in eight European cohorts within the ELAPSE project: Pooled analysis. BMJ 2021, 374, n1904. [Google Scholar] [CrossRef] [PubMed]
  3. Wu, X.; Braun, D.; Schwartz, J.; Kioumourtzoglou, M.A.; Dominici, F. Evaluating the impact of long-term exposure to fine particulate matter on mortality among the elderly. Sci. Adv. 2020, 6, eaba5692. [Google Scholar] [CrossRef]
  4. Wang, X.; Zhu, J.; Li, K.; Chen, L.; Yang, Y.; Zhao, Y.; Yue, X.; Liao, H.; Gu, Y. Meteorology-driven trends in PM2.5 concentrations and related health burden over India. Atmos. Res. 2024, 308, 107548. [Google Scholar] [CrossRef]
  5. Lotrecchiano, N.; Montano, L.; Bonapace, I.M.; Giancarlo, T.; Trucillo, P.; Sofia, D. Comparison process of blood heavy metals absorption linked to measured air quality data in areas with high and low environmental impact. Processes 2022, 10, 1409. [Google Scholar] [CrossRef]
  6. Park, I.S.; Park, M.S.; Kim, S.H.; Jang, Y.W.; Lee, J.; Owen, J.S.; Cho, C.R.; Jee, J.B.; Chae, J.H.; Kang, M.S. Meteorological characteristics during periods of greatly reduced PM2.5 concentrations in March 2020 in Seoul. Aerosol Air Qual. Res. 2021, 21, 200512. [Google Scholar] [CrossRef]
  7. Chen, Z.; Xie, X.; Cai, J.; Chen, D.; Gao, B.; He, B.; Cheng, N.; Xu, B. Understanding meteorological influences on PM2.5 concentrations across China: A temporal and spatial perspective. Atmos. Chem. Phys. 2018, 18, 5343–5358. [Google Scholar] [CrossRef]
  8. Jing, Z.; Liu, P.; Wang, T.; Song, H.; Lee, J.; Xu, T.; Xing, Y. Effects of meteorological factors and anthropogenic precursors on PM2.5 concentrations in cities in China. Sustainability 2020, 12, 3550. [Google Scholar] [CrossRef]
  9. Chen, Y.; Wang, X.; Zhong, S.; Dai, Z.; Yu, L. Comprehensive analyses linking PM2.5 to its precursors and meteorological conditions across regions and time scale in China. Atmos. Pollu. Res. 2025, 16, 102469. [Google Scholar] [CrossRef]
  10. Zhang, L.; An, J.; Liu, M.; Li, Z.; Liu, Y.; Tao, L.; Liu, X.; Zhang, F.; Zheng, D.; Gao, Q.; et al. Spatiotemporal variations and influencing factors of PM2.5 concentrations in Beijing, China. Environ. Pollut. 2020, 262, 114276. [Google Scholar] [CrossRef]
  11. Chen, Z.; Cai, J.; Gao, B.; Xu, B.; Dai, S.; He, B.; Xie, X. Detecting the causality influence of individual meteorological factors on local PM2.5 concentration in the Jing-Jin-Ji region. Sci. Rep. 2017, 7, 40735. [Google Scholar] [CrossRef]
  12. Lai, N.; Song, W.; Wang, M.; Zhao, L.; Zhou, J.; Cai, X.; Fu, H.; Zhang, M.; Sui, Y.; Sun, H.; et al. Qualitative and quantitative analyses of meteorological impacts on fine particle pollution in winters of cold region in China. Processes 2024, 12, 2713. [Google Scholar] [CrossRef]
  13. Gao, X.; Ruan, Z.; Liu, J.; Chen, Q.; Yuan, Y. Analysis of atmospheric pollutants and meteorological factors on PM2.5 concentration and temporal variations in Harbin. Atmosphere 2022, 13, 1426. [Google Scholar] [CrossRef]
  14. Duan, W.; Wang, X.; Cheng, S.; Wang, R.; Zhu, J. Influencing factors of PM2.5 and O3 from 2016 to 2020 based on DLNM and WRF-CMAQ. Environ. Pollut. 2021, 285, 117512. [Google Scholar] [CrossRef] [PubMed]
  15. Shao, M.; Dai, Q.; Yu, Z.; Zhang, Y.; Xie, M.; Feng, Y. Responses in PM2.5 and its chemical components to typical unfavorable meteorological events in the suburban area of Tianjin, China. Sci. Total Environ. 2021, 788, 147814. [Google Scholar] [CrossRef]
  16. Wu, S.; Hou, L.; Sun, X.; Liu, M.; Wang, N.; Li, R. Characterizing temporal trends and meteorological influences on ozone pollution in Shenyang region (2018–2021). Air Qual. Atmos. Health 2025, 18, 1169–1182. [Google Scholar] [CrossRef]
  17. Cifuentes, F.; Gálvez, A.; González, C.M.; Orozco-Alzate, M.; Aristizábal, B.H. Hourly ozone and PM2.5 prediction using meteorological data—Alternatives for cities with limited pollutant information. Aerosol Air Qual. Res. 2021, 21, 200471. [Google Scholar] [CrossRef]
  18. Wang, L.; Zhao, Y.; Liu, X.; Shi, J. Enhancement of atmospheric oxidation capacity induced co-pollution of the O3 and PM2.5 in Lanzhou, northwest China. Environ. Pollut. 2024, 341, 122951. [Google Scholar] [CrossRef]
  19. Lei, X.; Zheng, Q.; Qian, Y.; Hu, J.; Li, D.; Zhang, P.; Yuan, Q.; Li, Y. Feature analysis on air quality in the main urban area of Nanchong city in 2015–2018. Environ. Eng. Res. 2022, 27, 210006. [Google Scholar] [CrossRef]
  20. Wu, S.; Yan, X.; Yao, J.; Zhao, W. Quantifying the scale-dependent relationships of PM2.5 and O3 on meteorological factors and their influencing factors in the Beijing-Tianjin-Hebei region and surrounding areas. Environ. Pollut. 2023, 337, 122517. [Google Scholar] [CrossRef]
  21. Zhou, Q.; Cheng, L.; Zhang, Y.; Wang, Z.; Yang, S. Relationships between springtime PM2.5, PM10 and O3 pollution and the boundary layer structure in Beijing, China. Sustainability 2022, 14, 9041. [Google Scholar] [CrossRef]
  22. Li, X.; Miao, Y.; Ma, Y.; Wang, Y.; Zhang, Y. Impacts of synoptic forcing and topography on aerosol pollution during winter in Shenyang, Northeast China. Atmos. Res. 2021, 262, 105764. [Google Scholar] [CrossRef]
  23. Dalai, D.; Jandrotia, R.; Varinder, K.; Sharma, S.; Kaushal, J. Air pollution trend in Chandigarh during 2019–2022: Status and influence of meteorological factors. Environ. Monit. Assess. 2024, 196, 164. [Google Scholar] [CrossRef]
  24. Zheng, Y.; Li, S.; Zou, C.; Ma, X.; Zhang, G. Analysis of PM2.5 concentrations in Heilongjiang Province associated with forest cover and other factors. J. For. Res. 2019, 30, 273–280. [Google Scholar] [CrossRef]
  25. Tian, X.; Zhang, C.; Liu, H.; Zhang, B.; Lu, C.; Jiao, P.; Ren, S. Research on air quality in response to meteorological factors based on the Informer model. Sustainability 2024, 16, 6794. [Google Scholar] [CrossRef]
  26. GB3095-2012; Ambient Air Quality Standard. China Environmental Science Press: Beijing, China, 2012.
  27. Wang, R.; Bei, N.; Hu, B.; Wu, J.; Liu, S.; Li, X.; Jiang, Q.; Tie, X.; Li, G. The relationship between the intensified heat waves and deteriorated summertime ozone pollution in the Beijing–Tianjin–Hebei region, China, during 2013–2017. Environ. Pollut. 2022, 314, 120256. [Google Scholar] [CrossRef]
  28. Burney, J.; Ramanathan, V. Recent climate and air pollution impacts on Indian agriculture. Proc. Natl. Acad. Sci. USA 2014, 111, 16319–16324. [Google Scholar] [CrossRef]
  29. Madronich, S.; Shao, M.; Wilson, S.R.; Solomon, K.R.; Long-streth, J.D.; Tang, X.Y. Changes in air quality and tropospheric composition due to depletion of strato-spheric ozone and interactions with changing climate: Implications for human and environmental health. Photochem. Photobiol. Sci. 2015, 14, 149–169. [Google Scholar] [CrossRef] [PubMed]
  30. Guo, Q.; He, Z.; Wang, Z. The characteristics of qir quality changes in Hohhot city in China and their relationship with meteorological and socio-economic factors. Aerosol Air Qual. Res. 2023, 24, 230274. [Google Scholar] [CrossRef]
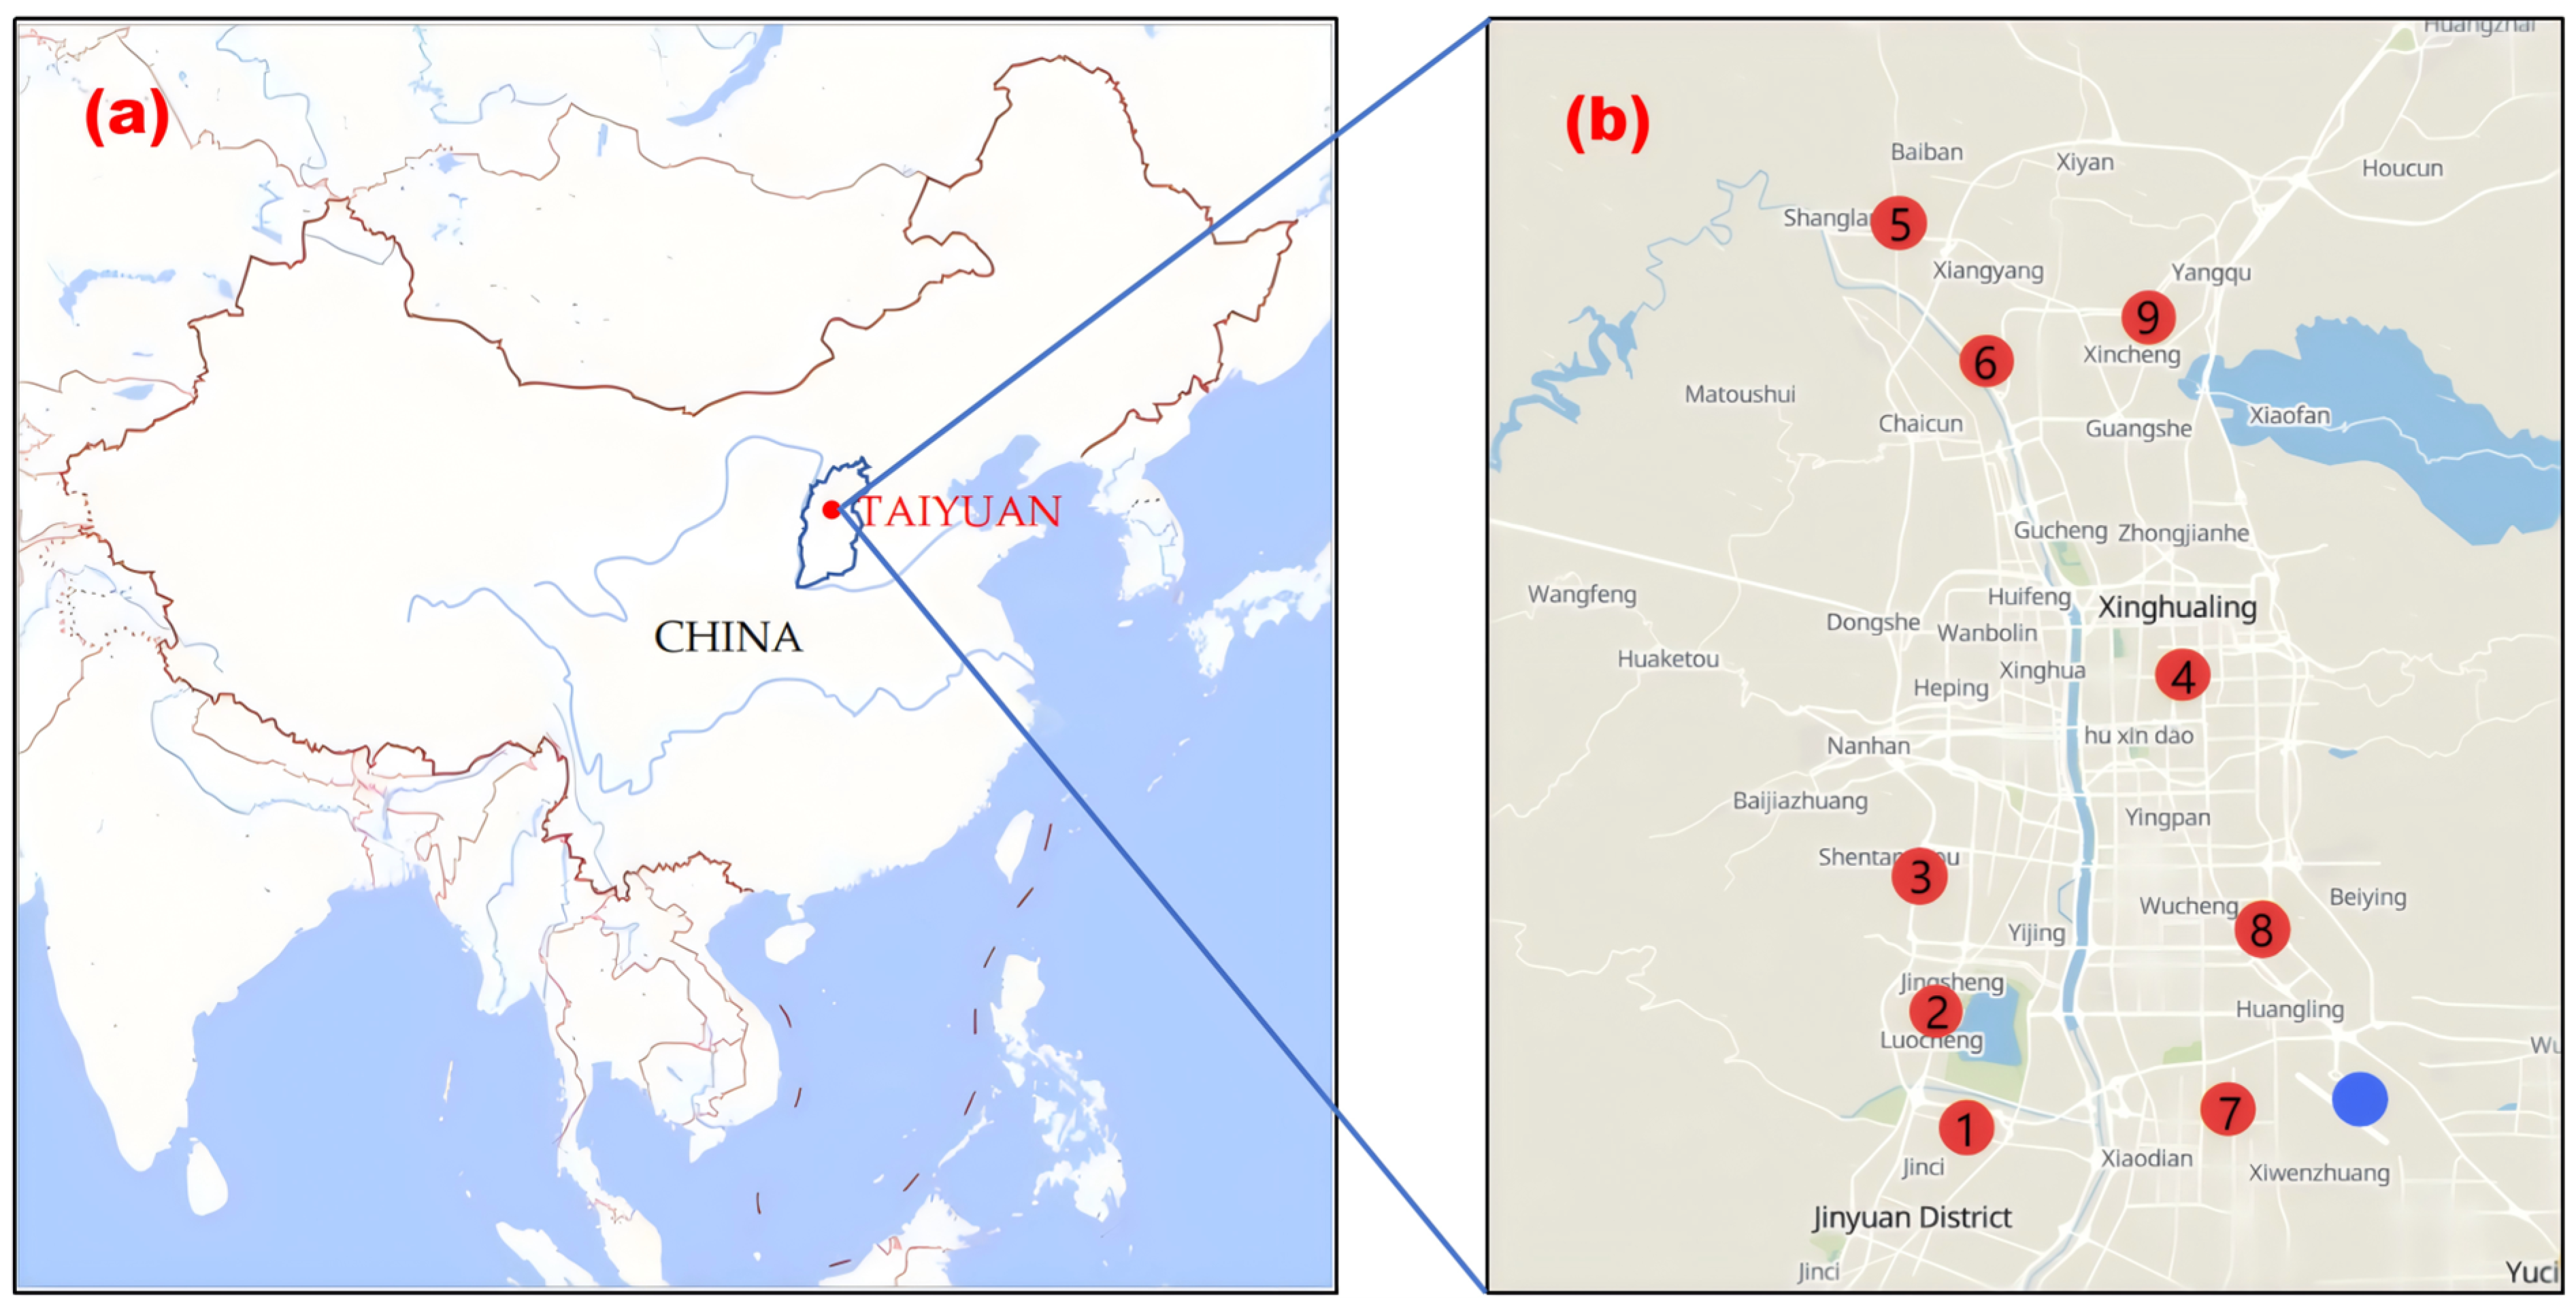
Figure 1. The location of Taiyuan City and the monitoring points. (a) The location of Taiyuan City. (b) The monitoring points of air quality and meteorology. (Note: In (b), the red dots represent the air quality monitoring points. The numbers 1 to 9 correspond to Jinyuan, Jinsheng, Taoyuan, Yuying Middle School, Shanglan, Jiancaoping, Xiaodian, Wucheng, and Nanzhai, respectively. The blue dots represent the locations of the meteorological monitoring stations, namely the Wusu station).
Atmosphere 16 01209 g001
Figure 2. Time series of wind speed. (Note: ① The daily wind speed data were obtained from the observations of surface meteorological stations (Wusu station) in Taiyuan City during the period from 2022 to 2024. These data were collected from the National Center for Environmental Information. ② The monthly wind speed is calculated by averaging the daily wind speeds statistics).
Atmosphere 16 01209 g002
Figure 3. Time series of temperature. (Note: ① The daily temperature data were obtained from the observations of surface meteorological stations (Wusu station) in Taiyuan City during the period from 2022 to 2024. ② The monthly temperature is calculated by averaging the daily temperature statistics).
Atmosphere 16 01209 g003
Figure 4. Time series of relative humidity. (Note: ① The daily relative humidity data were obtained from the observations of surface meteorological stations (Wusu station) in Taiyuan City during the period from 2022 to 2024. ② The monthly relative humidity is calculated by averaging the daily relative humidity statistics).
Atmosphere 16 01209 g004
Figure 5. Time series of relative precipitation. (Note: ① The daily precipitation data were obtained from the observations of surface meteorological stations (Wusu station) in Taiyuan City during the period from 2022 to 2024. ② The monthly precipitation is calculated by averaging the daily precipitation statistics).
Atmosphere 16 01209 g005
Figure 6. Air Quality Index and pollution days. (a) Air quality index. (b) Number of pollution days. (Note: ① The daily AQI in (a) were obtained from the observations of national monitoring points in Taiyuan City during the period from 2022 to 2024. ② The monthly AQI were calculated by averaging the daily AQI statistics).
Atmosphere 16 01209 g006aAtmosphere 16 01209 g006b
Figure 7. Air quality changes with month. (a) Concentration of PM. (b) Concentration of SO2 and NO2. (c) Concentration of O3 and CO. (Note: The monthly concentrations were calculated by averaging the daily concentration statistics).
Atmosphere 16 01209 g007
Figure 8. Ratio of PM2.5 concentration to PM10 concentration.
Atmosphere 16 01209 g008
Table 1. Spearman correlation coefficient ( P S ) between wind speed and air quality indicators.
IndicatorSpringSummerAutumnWinterAnnum
AQI0.24 *−0.02−0.24 **−0.13 *−0.05
PM2.50.13−0.05−0.15−0.33 **−0.19 **
PM100.28 **0.12−0.25 **−0.07−0.00
SO20.030.00−0.47 **−0.53 **−0.32 **
NO2−0.24 *−0.20 *−0.48 **−0.54 **−0.44 **
CO−0.16−0.28 **−0.27 **−0.56 **−0.46 **
O30.120.22 **0.27 **0.55 **0.29 **
Note: ① The symbol “**” denotes passing the correlation test at the significance level of 0.01 (highly significant correlation), while the symbol “*” represents passing the correlation test at the significance level of 0.05 (significant correlation). ② In the statistical calculation, the data during periods with precipitation were excluded.
Table 2. Spearman correlation coefficient ( P S ) between temperature and air quality indicators.
IndicatorSpringSummerAutumnWinterAnnual
AQI0.32 **0.37 **−0.090.32 **−0.11 **
PM2.50.110.09−0.060.22 **−0.24 **
PM100.23 *0.09−0.100.38 **−0.21 **
SO20.23 *0.05−0.13−0.15 **−0.38 **
NO20.22 *−0.05−0.20 *0.15 **−0.25 **
CO0.30 **0.110.07−0.04−0.26 **
O30.60 **0.56 **0.57 **0.19 **0.76 **
Note: ① The symbol “**” denotes passing the correlation test at the significance level of 0.01 (highly significant correlation), while the symbol “*” represents passing the correlation test at the significance level of 0.05 (significant correlation). ② In the statistical calculation, the data during periods with precipitation were excluded.
Table 3. Spearman correlation coefficient ( P S ) between relative humidity and air quality indicators.
IndicatorSpringSummerAutumnWinterAnnual
AQI−0.15−0.24 **−0.050.37 **0.05
PM2.50.050.25 **0.19 *0.55 **0.25 **
PM10−0.22 *−0.22 **−0.150.24 **−0.05
SO2−0.25 *−0.47 **−0.42 **0.06−0.19 **
NO2−0.11−0.38 **−0.41 **0.27 **0.06
CO0.33 **0.45 **0.140.52 **0.41 **
O30.10−0.30 **−0.00−0.33 **−0.08 *
Note: ① The symbol “**” denotes passing the correlation test at the significance level of 0.01 (highly significant correlation), while the symbol “*” represents passing the correlation test at the significance level of 0.05 (significant correlation). ② In the statistical calculation, the data during periods with precipitation were excluded.
Table 4. Spearman correlation coefficient ( P S ) between precipitation and air quality indicators.
IndicatorSpringSummerAutumnWinterAnnual
AQI−0.42 **−0.31 **−0.18−0.06−0.26 **
PM2.5−0.29 **−0.10−0.13−0.05−0.17 **
PM10−0.44 **−0.23 **−0.18−0.08−0.26 **
SO2−0.45 **−0.29 **−0.29 *−0.16−0.31 **
NO2−0.36 **−0.12−0.07−0.05−0.20 **
CO−0.23 **0.050.050.01−0.07
O3−0.00−0.26 **−0.20−0.07−0.03
Note: ① The symbol “**” denotes passing the correlation test at the significance level of 0.01 (highly significant correlation), while the symbol “*” represents passing the correlation test at the significance level of 0.05 (significant correlation). ② Based on the statistical results of precipitation probability in Taiyuan City from 2022 to 2024 (refer to Section 3.1.4), torrential rain is considered an extreme weather event. In this study, only data from light rain to heavy rain are included in the statistics.
Disclaimer/Publisher’s Note: The statements, opinions and data contained in all publications are solely those of the individual author(s) and contributor(s) and not of MDPI and/or the editor(s). MDPI and/or the editor(s) disclaim responsibility for any injury to people or property resulting from any ideas, methods, instructions or products referred to in the content.