Abstract
Agricultural land management is a major determinant of terrestrial carbon (C) fluxes and has substantial implications for greenhouse gas (GHG) mitigation strategies. This study evaluated the net ecosystem carbon balance (NECB) of an agricultural field in an organic integrated crop–livestock system (ICLS) with a ley-arable rotation in northern Germany over two years (2021–2023). Carbon dioxide (CO2) fluxes were measured using the eddy covariance (EC) method to derive net ecosystem exchange (NEE), gross primary production (GPP), and ecosystem respiration (RECO). This approach facilitated an assessment of the temporal dynamics of CO2 exchange, alongside detailed monitoring of field-based C imports, exports, and management activities, of a crop sequence including grass-clover (GC) ley, spring wheat (SW), and a cover crop (CC). The GC ley acted as a consistent C sink (NECB: −1386 kg C ha−1), driven by prolonged photosynthetic activity and moderate biomass removal. In contrast, the SW, despite high GPP, became a net source of C (NECB: 120 kg C ha−1) due to substantial export via harvest. The CC contributed to C uptake during the winter period. However, cumulatively, it acted as a net CO2 source, likely due to drought conditions following soil cultivation and CC sowing. Soil cultivation events contributed to short-term CO2 pulses, with their magnitude modulated by soil water content (SWC) and soil temperature (TS). Overall, the site functioned as a net C sink, with an average NECB of −702 kg C ha−1 yr−1. This underscores the climate mitigation potential of management practices such as GC ley systems under moderate grazing, spring soil cultivation, and the application of organic fertilizers. To optimize CC benefits, their use should be combined with reduced soil disturbance during sowing or establishment as an understory. Additionally, C exports via harvests could be offset by retaining greater amounts of harvest residues onsite.
1. Introduction
Atmospheric carbon dioxide (CO2) concentrations have risen with increasing greenhouse gas (GHG)-emitting practices. Agricultural intensification has amplified the sector’s environmental impact [1], making it a significant contributor to total emissions [2]. Globally, agriculture accounts for ~12% of anthropogenic GHG emissions or ~23% including land use, land-use change, and forestry (LULUCF) emissions [3]. In light of the Paris Agreement’s net-zero ambition, international efforts are needed to reduce emissions and enhance carbon (C) sinks [4]. Removing 7% of the EU’s annual GHG emissions in 2022 [5], the LULUCF sector has been of great interest for present and future GHG mitigation practices [6,7]. Soils play a key role in such efforts due to their capacity to store large amounts of C [8]. However, soil organic carbon (SOC) stocks are dynamic and responsive to, e.g., agricultural management practices. Depending on the balance between C imports and exports, soils can function either as a C source or sink [9,10]. Carbon sequestration describes the absorption of CO2 from the atmosphere and storage as SOC [11]. It has received a lot of attention as a viable mitigation strategy to address the rising atmospheric CO2 levels and to achieve net-zero emissions [11,12,13]. With the increased intensification of agriculture, highly productive and specialized farming systems have developed [14,15,16,17]. These systems, particularly where decoupling of crop and livestock production has taken place, have been linked to significant SOC depletion and increased GHG emissions [14,15,18], alongside a series of other adverse environmental effects such as a critical decline in biodiversity and ecosystem functions and services [19]. To accommodate productivity and climate mitigation as well as other environmental services, a series of agricultural practices and systems has been proposed and evaluated for their C sequestration potential. Low-input farming [20], agroecology [21], ecological intensification [22], sustainable intensification [23], and integrated crop–livestock system (ICLS) [24,25] are among the farming systems that have been shown to have a positive impact on the build-up of SOC.
Integrated crop–livestock systems, which integrate crop and livestock production, have emerged as a sustainable alternative, leveraging synergies between plant and animal systems to restore SOC stocks and improve long-term C sequestration potential [26]. The integration of forage crops within a cropping system, known as ley-arable systems, used as temporal pasture and forage production, is an integral part and contributes to various services like GHG mitigation, soil conservation, C sequestration, nutrient cycling, reduced nitrate (NO3) leaching, as well as water purification, prevention of runoff and soil erosion, weed suppression, climate regulation, and habitat provision for biodiversity conservation [20,21,22,23,24,25,26,27,28,29,30]. Organic ICLSs often feature a high proportion of forage legumes in crop rotations [31,32,33,34], which further enhances nutrient cycling efficiency, resulting in reduced surpluses and lower environmental nutrient loads. The accumulation of nitrogen (N) through biological nitrogen fixation (BNF) can furthermore reduce nitrous oxide (N2O) emissions if used as an alternative for mineral N fertilizer [16,33,34]. Several studies emphasize the importance of ley phases, as perennial crops promote SOC and soil aggregate stability through high below-ground biomass allocation, high rooting density, the release of root exudates, and reduced soil cultivation [15,33,35,36,37,38,39]. The effectiveness of sequestering C in arable systems thereby significantly depends on the length of the ley phase, making it more crucial than, for example, crop diversity [37]. The C sequestration potential of ley-arable systems is between that of permanent grasslands and arable cropping systems without leys [39].
Reduced soil cultivation is a key component in preserving the soil structure and SOC, preventing erosion, leaching, and mineralization boosts [40]. Soil cultivation triggers a three-phase response in CO2 emissions, typically consisting of an immediate 48 h pulse, a sustained elevated flux (2–5 days), and a gradual decline over approximately six weeks [41]. This pattern arises from interconnected physicochemical shifts, including aggregate disruption, which exposes protected SOC to microbial mineralization, enhanced aeration promoting aerobic decomposition, incorporation of residues that supply labile C substrates, and accelerated soil warming, reduced moisture, and amplified microbial activity. Collectively, these drive the priming effect [42,43]. As soil water content (SWC) and soil temperature (TS) play a significant role in the amounts of C losses during soil cultivation, there has been consideration of altering the timing (spring vs. autumn) to reduce nutrient losses [44,45,46,47].
Carbon sequestration is also governed by the amount and type of above-ground harvest residuals left on the field and promoted by the utilization of C-containing organic fertilizers like farmyard manure, slurry, and pasture excrements from grazing animals. Organic fertilizers significantly enhance C sequestration by directly introducing stable C compounds and stimulating soil biological activity [48,49]. Recent studies confirm that SOC maintenance is feasible through manure applications [50], and long-term experiments demonstrate that SOC losses induced by climatic changes can be mitigated by farmyard manure incorporation [51]. A meta-analysis by Gross and Glaser [52] quantifies this benefit, reporting an average 35.4% increase in SOC stocks in systems with manure application. Beyond SOC enhancement, organic fertilizers offer practical advantages without compromising productivity. Kitamura et al. [53] documented in a three-year grassland study that substituting chemical fertilizers with slurry or manure maintained equivalent yields. Crucially, this substitution also resulted in an improved net ecosystem carbon balance (NECB) under organic fertilization compared to synthetic fertilizer treatments, indicating reduced ecosystem C losses.
Cover crops (CCs), often used as green manure or for forage production, promote SOC by replacing bare fallow periods, prolong the photosynthetically active period, and contribute to the fixation of atmospheric CO2 into the plant–soil system through above- and belowground biomass accumulation [35,48,54]. They prevent soil erosion through a continuous plant cover of the soil and reduce nutrient leaching. In the case of non-legume CCs, NO3 leaching can be reduced by 39–54%, and thereby directly and indirectly preserve soil C [55,56]. Microbial and fungal activities under diverse CCs promote particulate organic carbon (POC) and mineral-associated organic carbon (MAOC), stable SOC formation, and restrict decomposition [56,57]. Although the positive impact of CCs on SOC is generally established, studies reveal mixed outcomes. Long-term trials (>29 years) show SOC increases up to 11% [58,59,60], and shorter studies confirm SOC accumulation [61], whereas Canadian research detected no significant CC-driven sequestration [62], potentially confounded by concurrent rotation changes. Modeling projections suggest scaling CCs to 30% of German cropland could elevate C imports by 12% [63]. A German meta-analysis further demonstrated the efficiency of CC-driven C sequestration, estimating that the implementation could offset 8% of agriculture’s direct annual GHG emissions through increased soil C storage [64].
Next to management practices, SOC and changes in SOC are governed by soil type and initial C content. Clay-rich soils demonstrate higher C sequestration potential due to mineral-organic interactions that protect C from decomposition. Research indicates these soils can stabilize up to four times more C than their sandy counterparts [65]. Sandy soils, while having lower absolute C storage capacity, often show more pronounced yield benefits from increased SOC values through improved water retention and nutrient availability. These contrasting properties create a soil-specific compromise. Sandy soils respond more visibly to SOC improvements, while clay soils excel at stable, long-term C retention [66]. A critical factor influencing sequestration efficiency is a soil’s proximity to its mineralogical C saturation capacity. Soils furthest from saturation, typically those with low initial SOC or coarse textures, demonstrate higher C sequestration efficiency [67]. However, this capacity diminishes as soils approach saturation, a phenomenon frequently overlooked in short-term studies that can lead to substantial overestimations of sequestration potential by 53–81% [66]. This saturation effect underscores the importance of considering baseline conditions when assessing C storage potential. Soil C follows an asymmetric pattern, being very susceptible to rapid C losses when disturbed, with high-SOC systems like grasslands and peatlands being particularly sensitive. The conversion of such systems to cropland often triggers substantial SOC mineralization, leading to fast C losses exemplifying the “slow-in, fast-out” effect [15]. This highlights the critical importance of protecting existing C stocks in addition to enhancing sequestration through management aligned with soil type, climate, and initial SOC.
Warming effects on SOC stocks and soil respiration have been extensively studied [10,68]. Climate change strongly affects TS and SWC of agricultural soils, which are the two primary controlling factors of microbial decomposition rates of C [10,68,69]. A study by Heikkinen et al. [69] displayed that an increase in summertime air temperature (TA) had resulted in an increase in SOC loss with a certainty of 79–91%. However, it also stated the influence of historical utilization and current management practices. Model-based projections indicate that elevated TA will drive SOC losses of 3–24% in agricultural soils, depending on C import levels. To offset these losses, C imports would have to increase by 29% to maintain the present SOC stocks in agricultural soils [70]. Given the sensitivity of SOC stocks to climate change and management practices, a better understanding and representation of these complex interactions is needed [70,71] to adjust current agricultural practices towards sustainability.
The traditional soil core sampling approach provides absolute SOC values and enables the separation of SOC into POC and MAOC. However, a low temporal resolution leads to missing short-term fluctuations and challenges in spatial variability, as small sample volumes may not represent field-scale heterogeneity. The soil core method remains the gold standard for quantifying SOC stocks due to its precision, but it is poor at capturing dynamic processes. The eddy covariance (EC) method measures turbulent CO2 fluxes between the land surface and atmosphere using high-frequency (10 Hz) sensors. Derived net ecosystem exchange (NEE) can be partitioned into gross primary production (GPP) and ecosystem respiration (RECO). While this method does not measure SOC stocks directly but displays the net change of CO2, its strength is the continuous and real-time measurement of diurnal or seasonal C dynamics, and the capture of the influences of agricultural practices. The method is non-invasive and integrates fluxes over large areas, reducing small-scale variability biases [72].
This study examined the NECB of a ley-arable crop rotation including grass-clover (GC) ley, wheat, and Westerwolds ryegrass as CC in an organic ICLS over two years in northern Germany. Carbon imports and exports, along with all agricultural practices, were recorded at the field-scale. The impact of seasonality (spring, summer, autumn) of soil cultivation events and the impact of different crops during the dormant season on CO2 exchange was assessed. The EC method was employed to quantify GPP, RECO, and NEE and explore how management influenced CO2 dynamics. We hypothesize that the study site acts as a net C sink during the study period due to the combined effect of the implementation of a CC and a GC ley in the crop rotation, the use of slurry as fertilizer, and the adapted soil cultivation times.
2. Materials and Methods
2.1. Experimental Site Description
The on-farm research study was conducted from 2021 to 2023 on an arable site at the Lindhof experimental farm (54°27′ N, 9°57′ E, 10 m.a.s.l.), operated by the Grass and Forage Science Group at Kiel University. The research site is located on the shoreline of the Baltic Sea in the federal state of Schleswig-Holstein in northern Germany. The farm operates as an ICLS under a low-input management regime and adheres to the standards of the organic farming association Bioland, which prohibits the use of chemical fertilizers and pesticides. The crop rotation follows a four- to five-year cycle, beginning with a two-year GC ley, followed by two to three years of arable cropping, across a total of 110 ha of arable land. The ley phase is utilized for producing winter feed and serves as a rotationally grazed pasture for a herd of 100 Jersey dairy cows. Within this ley-arable rotation, CCs are established after cereal harvests and subsequently grazed. Cattle slurry is applied as organic fertilizer using trailing hoses. The soil at the experimental site is classified as loamy sand to sandy loam, composed of 61% sand, 26% silt, and 13% clay. The topsoil (0–30 cm) contains 1.2% organic C, has a carbon-to-nitrogen (C/N) ratio of 9.9, a bulk density of 1.56 g cm−3, and a particle density of 2.65 g cm−3.
Climatic data, including long-term precipitation and TA, were obtained from the DWD (Deutscher Wetterdienst) station in Kiel-Holtenau, located 14.4 km from the experimental site. The region has a humid temperate climate, with a long-term (1991–2020) mean annual TA of 9.4 °C and an average annual precipitation of 757 mm. Yearly values for mean TA and precipitation during the study period, along with long-term averages, are summarized in Table 1.

Table 1.
Yearly average air temperature and cumulative precipitation at the experimental site during the experimental years 2021–2023 and the long-term (1991–2020) averages of yearly temperature and precipitation.
2.2. Experimental Design
The measurement period spanned two years, from the beginning of April 2021 to the end of March 2023. The crop sequences examined included a GC ley, wheat, and Westerwolds ryegrass as a CC. During the wheat phase, the 13.7 ha experimental site was divided equally, with one half sown with spring wheat (SW) and the other with winter wheat (WW). The resulting two crop sequences are GC-SW-CC and GC-WW-CC (see Figure 1). The GC sward was in its second year of production and was mainly used under a cutting regime the previous year. It contained a mixture of perennial ryegrass (24 kg ha−1), white clover (2 kg ha−1), and red clover (6 kg ha−1), which was established as an understory in the terminal arable crop. In 2021, the GC sward was grazed and received an additional silage cut, which was harvested during the grazing season. Winter wheat was sown in October 2021. The other half of the experimental site remained intact and was cultivated in March 2022 for SW sowing. In August 2022, after the harvest of WW and SW, the CC was sown on the entire site. Due to delayed sward growth, cows grazed the CC only during the spring of 2023. The GC period began on April 1 and ended one day before soil cultivation for the subsequent crop. The SW and WW periods each began on the day of soil cultivation and ended one day before cultivation for the subsequent crop. The CC period likewise began on the day of soil cultivation and ended with the termination of the measurement period on 31 March 2023. Information on the crop sequences, measurement periods, grazing dates, and management activities was recorded in Appendix A Table A1. During the winter season of 2021/2022 and 2022/2023, the period from 13 December to 14 March, was selected to compare the CO2 dynamics of the intact GC sward and the WW plot and the CC in the subsequent year. The start date (13 December) was chosen based on prior soil cultivation for WW sowing, after which CO2 emissions increased. By this date, CO2 levels had stabilized, ensuring they were no longer elevated by cultivation effects. The end of the observation period (14 March) was determined by the subsequent soil cultivation and sowing of SW on 15 March 2022. To ensure comparability, the same dates were applied for the 2022/2023 season. To compare the CO2 dynamics of soil cultivation, a period of three weeks following the soil cultivation was defined for autumn (28.10.2021–17.11.2021), spring (15.03.2022–04.04.2022), and summer (23.08.2022–12.09.2022). The time window was limited to three weeks, as afterward, the onset of plant growth occurred.
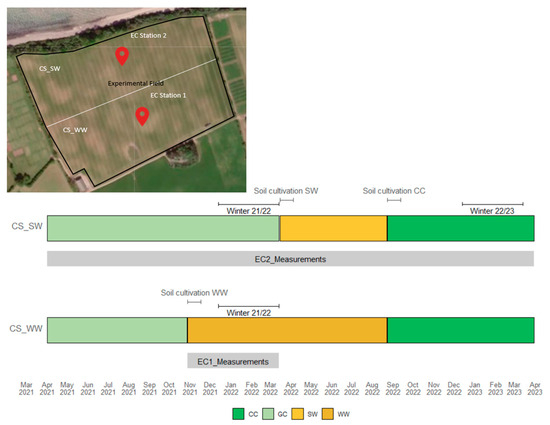
Figure 1.
Experimental site setup and crop sequence. The top part shows a Landsat image of the experimental field (indicated by the black line), with the eddy covariance (EC) stations 1 and 2 marked by the respective markers (Source: Google Earth). The white line indicates the boundary between the parts cultivated with the spring wheat crop sequence (CS_SW) and the winter wheat crop sequence (CS_WW). The timeline below illustrates the two crop sequences, including grass-clover (GC), spring wheat (SW), and the cover crop (CC) or winter wheat (WW), respectively. Grey bars indicate the length of the respective EC measurements, and the dark grey and black brackets indicate the soil cultivation and winter periods.
2.3. Herbage Measurements and Pasture Intake
Herbage on offer and residual biomass after grazing were collected and analyzed to determine the forage quality and quantity during the grazing season. Pasture intake by grazing cows was estimated by measuring the compressed sward height, using an electronic rising plate meter (Grasshopper, True North Technologies, Shannon, Ireland). For further information on the use of the rising plate meter, see Loza et al. [73] or Taube et al. [30]. The pasture intake was calculated using Equation (1).
where DMIpasture refers to the dry matter intake per cow and per day on pasture (kg DM cow−1 day−1), AGBavailable to the standing above-ground biomass prior to grazing (kg DM ha−1), and AGBresidual to the standing above-ground biomass post-grazing (kg DM ha−1). Pasture intake was corrected for overestimation due to the presence of excreta patches, following the approach of Klootwijk et al. [74].
DMIpasture = AGBavailable − AGBresidual/number of cows
For quality analysis, herbage samples were collected using hand-clipping shears. For further processing steps of herbage samples, see Loza et al. [73] or Eismann et al. [75]. Samples were dried to determine the dry matter (DM) content, milled (Ultra Centrifugal Mill, ZM200, Retsch GmbH, Haan, Germany) to a particle size of 1 mm and analyzed to estimate the C content using a near-infrared spectroscopy (NIRS) system 5000 monochromator (Foss NIRS Systems, Silver Spring, MD, USA) with WinISI III software (v3, Infrasoft Internationals, State College, PA, USA). Before the silage cut, fresh herbage samples were taken and analyzed to determine DM and C content as mentioned above. The silage cut was processed into silage bales, and the total number was recorded prior to storage. A subsample of the silage bales was weighed to determine the total harvested fresh matter yield. Harvested WW and SW grain were weighed, and samples were taken. Dried samples were milled to a particle size of 1 mm (Ultra centrifugal mill, ZM200, Retsch GmbH, Haan, Germany). The C content was determined by dry combustion of grain samples using a C/N analyzer (Vario Max CN, Elementar Analysensysteme, Hanau, Germany), using helium as a purge and carrier gas. The WW and SW straw were separately baled, counted, and weighed to determine the total straw yield. Straw samples were also analyzed for C content using the C/N analyzer.
2.4. Eddy Covariance Method
2.4.1. Eddy Covariance Station
The CO2 exchange between the arable ecosystem and the atmosphere was estimated using the micrometeorological EC method. Two EC stations (LI-COR Environmental, Lincoln, NE, USA) were used during the two-year trial. The first station (EC1) measured the CO2 exchange of the WW crop sequence between October 2021 and March 2022. The second station (EC2) was deployed throughout the entire trial period, covering the GC-SW-CC sequence. The stations were centrally located within each respective half of the experimental site (see Figure 1). Each EC Station (LI-COR Environmental, Lincoln, NE, USA) was equipped with solar panels (Solarmodul AS 80, SUNSET Energietechnik, Adelsdorf, Germany) and a wind generator (Istabreeze, Aytos, Bulgaria) to provide energy, connected to three 12 V batteries (AGM Marine Batteries, 240 Ah, Vetus, Ry, Denmark) for energy storage. Wind speed and direction were measured using a 3-axis ultrasonic anemometer (Windmaster, Gill, Lymington, Hampshire, UK). Carbon dioxide was measured using an open-path CO2/H2O analyzer (LI-7500, LI-COR Environmental, Lincoln, NE, USA). Humidity and TA were measured by an HMP155 probe (Vaisala, Helsinki, Finland). A LI-190R sensor (LI-COR Environmental, Lincoln, NE, USA) was used to measure photosynthetically active radiation. Net radiation was measured by a CNR4 radiometer (Ott HydroMet, Kempten, Germany). Soil heat flux was measured using three HFP01 sensors at a depth of 8 cm (Hukseflux Thermal Sensors, Delft, The Netherlands). Soil temperature and SWC were measured using HydraProbe sensors at a depth of 5, 15, and 30 cm (Stevens Water, Portland, OR, USA). Moreover, the stations were equipped with a data acquisition model (DaqM, LI-COR Environmental, Lincoln, NE, USA) and a data retention model (DRM, LI-COR Environmental, Lincoln, NE, USA). Data were logged at a frequency of 10 Hz and stored at 30 min intervals (SmartFlux 3, LI-COR Environmental, Lincoln, NE, USA) for later processing. Raw data were transferred to a computer every other week using a USB stick.
2.4.2. Data Processing
Raw data from the EC stations were processed using the open-source software EddyPro (v9.2, LI-COR Biosciences, Lincoln, NE, USA). The processing steps followed the methodology detailed by Eismann et al. [75], with the exception that despiking was applied to all variables in this study. In brief, the processing included the application of WPL (Webb, Pearman, and Leuning) correction, the flagging policy of Mauder and Foken [76], flux footprint (FP) estimation and parameterization based on Kljun et al. [77], as well as the statistical screening of raw data following the approach of Vickers and Mahrt [78]. The processed dataset was uploaded to Tovi (v2.9.1, LI-COR Environmental, Lincoln, NE, USA).
Quality Screening was conducted following the approach of Isaac et al. [79]. Data points assigned a Foken quality flag of 2 were excluded from the analysis. Additionally, values falling outside the defined plausibility range or recorded during periods of instrumental malfunction were removed. A friction velocity (u*) threshold filter was not applied, as it would be largely redundant with the other quality control measures implemented [80,81]. Soil variables, including SWC, TS, and soil heat flux, were averaged following the methodology described by Isaac et al. [79]. Air temperature and vapor pressure deficit (VPD) were merged with data from the ISD Kiel-Holtenau Weather Station using the biomet merge and gap fill tool, as described by Isaac et al. [79]. Storage correction for soil heat flux and CO2 was applied, and NEE was subsequently derived. Energy balance residual correction was applied according to Mauder et al. [82]. Using the FP analysis tool [83], each half of the study site (WW for EC1 and SW for EC2) was defined as the area of interest for the respective dataset, while all other areas were designated as flagged regions. In an additional quality screening step, data points were excluded if the corresponding FP contained more than 15% flagged area. To obtain a continuous NEE dataset, gap-filling was performed using the marginal distribution sampling technique described by Reichstein et al. [84]. Incoming shortwave radiation, merged VPD, and merged TA were used as driver variables. Finally, the night-time partitioning method described by Reichstein et al. [84] was applied to the gap-filled NEE dataset to separate it into RECO and GPP components. Afterward, the RECO dataset was gap-filled using the marginal distribution sampling technique [84]. As the Tovi software (v2.9.1, LI-COR Environmental, Lincoln, NE, USA) does not support gap-filling of GPP data, missing GPP values were derived manually from the corresponding NEE and RECO data.
2.5. Field Carbon Balance
The total C budget was calculated by accounting for all major C fluxes at the field-scale. Minor C losses through volatile or dissolved organic C and methane (CH4) exchange were considered negligible and therefore not included in the calculation [81,85]. In this study, the term net biome productivity (NBP) was not used, as it refers to entire ecosystems, including flora, fauna, and a physical environment, typically at a regional scale [86], and therefore does not apply to cropland at a field-scale [81]. Instead, we adopted the term NECB, as proposed by Chapin et al. [87], which is more appropriate for field-scale assessments of C fluxes in managed agricultural systems.
where NEEcum is the cumulated gap-filled net ecosystem exchange (kg CO2-C ha−1), Cim is the C import by fertilization with slurry, excreta from grazing cattle, and sowing seeds (kg C ha−1), and Cex is the C export by pasture uptake of grazing cows, silage cut as well as grain and straw harvest (kg C ha−1).
NECB = NEEcum + Cim − Cex
This study follows the atmospheric sign convention, whereby a positive NEE or NECB indicates a net flux of CO2 to the atmosphere, while a negative value represents net CO2 uptake by the plant–soil ecosystem [88]. The total C import via slurry was calculated based on the total volume of slurry applied (m3 ha−1) and the corresponding mean C concentration, determined using a C/N analyzer. To derive C return via excreta, digestible organic matter (DOM) in pasture biomass was determined using the in vitro cellulase technique described by Pries et al. [89]. Based on the digestibility values, C return via excreta during grazing was estimated at 32% of the grazed C uptake [85,90]. Carbon import from the sowing of SW and CC was calculated using the total seed sown and the corresponding seed C concentration. Carbon export via grazing was estimated based on the C and DM concentrations of biomass samples and measured pasture uptake. Carbon export through silage harvest was calculated using the C and DM concentrations of biomass samples collected prior to cutting, along with the total biomass removed. For the wheat harvest, C export was determined from the total harvested amounts of straw and grain, combined with their respective C concentrations.
2.6. Statistical Analysis
The statistical evaluation of the autumn, spring, and summer plowing was conducted using the R software (v4.5.1) [91]. The effect of TS, SWC, soil cultivation, and time progression after the termination of soil cultivation and sowing on RECO over three weeks was analyzed. Multiple linear regression models were employed with RECO as the dependent variable. The models included average TS and average SWC as covariates and disc harrowing, plowing, and time progression as categorical factors. The dependent variable was modeled as a function of both covariates and factors, including two-way interactions between them. Model assumptions were evaluated using residuals vs. fitted and normal Q-Q plots to check for linearity, homoscedasticity, and normality of residuals.
3. Results
3.1. Site Characteristics
3.1.1. Abiotic Factors
Temperature trends during the experimental period generally aligned with long-term patterns (see Figure 2). Precipitation patterns exhibited some deviation from the long-term mean. In 2021, May was considerably wetter, and July and August were drier. February 2022 recorded considerably higher precipitation, followed by a markedly dry March (<10 mm). July and August of 2022 exhibited precipitation values below the long-term mean.
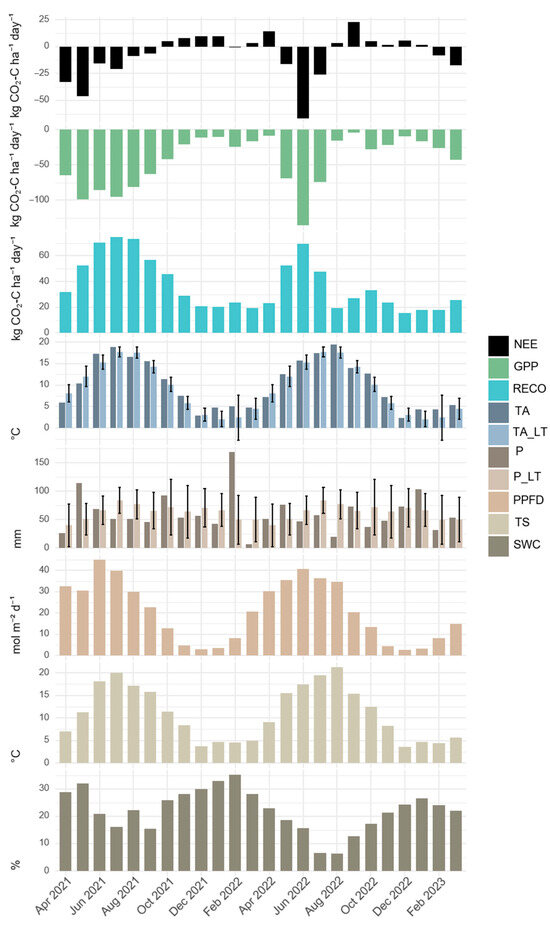
Figure 2.
The monthly average of daily sums of carbon dynamics and abiotic factors. Net ecosystem exchange (NEE), gross primary production (GPP) and ecosystem respiration (RECO) as well as the monthly averages of the abiotic variables photosynthetic photon flux density (PPFD) (given as the average daily sum) soil temperature (TS), soil water content (SWC) (both at the 5 cm depth), air temperature (TA) and the corresponding long-term (LT) mean (1991–2020) (TA_LT) are given in monthly averages. The monthly precipitation (P) with the corresponding long-term (LT) mean (1991–2020) (P_LT) is given as a cumulative value. The error bars indicate the standard deviation of the long-term precipitation and air temperature values.
Photosynthetic photon flux density (PPFD) followed a typical seasonal bell-shaped curve (see Figure 2), peaking in June (45.1 mol m−2 day−1 in 2021) and reaching the minimum in December (2.52 mol m−2 day−1 in 2022). Soil temperature at the 5 cm depth showed consistent seasonal patterns across years, ranging from 3.7 to 20.0 °C in 2021 and 3.6 to 21.0 °C in 2022. Soil water content at the 5 cm depth exhibited substantial interannual variation. The monthly average SWC was consistently higher in 2021 than in 2022, with early 2023 values lower than those in early 2022.
3.1.2. Fresh Matter, Dry Matter, and Carbon Yield
The GC sward yielded over 21,095 kg ha−1 of fresh matter, of which the single silage cut provided slightly more than 5064 kg ha−1 of winter feed. Total DM yield of the GC sward in the first experimental year reached 5374 kg DM ha−1 (see Table 2 for individual values). In 2022, SW cultivation yielded 3481 kg DM ha−1, equivalent to 4095 kg ha−1 of fresh matter. The DM yield of straw was 2728 kg DM ha−1, which corresponds to 3172 kg ha−1 of fresh matter, resulting in a grain-straw ratio of 1.29. The CC, grazed in March 2023, produced a DM yield of 1653 kg DM ha−1, corresponding to a C yield of 736 kg C ha−1.
Table 2.
Fresh matter, dry matter, and carbon yield, and corresponding dry matter and carbon concentrations of the silage cut, grazing events during the grass-clover and cover crop, as well as straw and grain harvest of the spring wheat sequence.
3.2. Carbon Dynamics
3.2.1. Seasonality of Carbon Dioxide Fluxes
Net ecosystem exchange, GPP, and RECO followed a clear seasonal pattern, illustrated in Figure 2 and Figure 3. The NEE was predominantly negative during the growing season, indicating net CO2 uptake, and positive during the dormant season, reflecting CO2 release to the atmosphere. These dynamics were strongly shaped by site management practices.
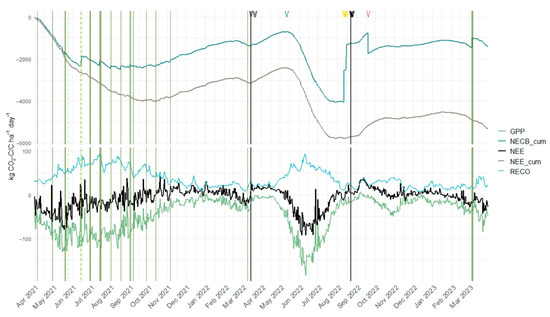
Figure 3.
Temporal dynamics of carbon fluxes and management events. Cumulative net ecosystem exchange (NEE_cum) and cumulative net ecosystem carbon balance (NECB_cum) in the upper panel, daily sums of gross primary production (GPP), ecosystem respiration (RECO), and net ecosystem exchange (NEE) in the bottom panel. Black vertical lines indicate sequence change between the grass-clover ley (GC) and spring wheat (SW) and SW and cover crop (CC), respectively. Solid green vertical lines indicate grazing events. The light dashed green vertical line shows the mulching event, thick dashed green vertical line shows the silage cut. Black arrows at the top indicate soil cultivation events, green arrow harrowing, and golden arrows harvest of spring wheat. The brown arrow shows slurry application in the CC sequence.
During 2021, the monthly average of daily GPP sums peaked in May at −98.6 kg CO2-C ha−1 day−1, while for RECO, the average daily sums reached 74.6 kg CO2-C ha−1 day−1 in July, coinciding with the highest monthly average TA. In 2022, the negative NEE period shortened significantly due to SW sowing in March and SW harvest, followed by CC sowing in August, restricting net CO2 uptake to the interval between these events. Following soil cultivation and SW sowing in March, GPP in April averaged −8.72 kg CO2-C ha−1 day−1. The lowest GPP of the experimental period was noted in September 2022 (−4.25 kg CO2-C ha−1 day−1), one month post-harvest and CC establishment. The SW GPP peaked at −136 kg CO2-C ha−1 day−1 in June 2022, surpassing the GC sward’s maximum GPP and aligning with 2022’s peak PPFD. Maximum net CO2 uptake was observed in June 2022 under SW cultivation (NEE: −66.5 kg CO2-C ha−1 day−1), while the highest CO2 net loss occurred in September 2022 (NEE: 22.7 kg CO2-C ha−1 day−1) following August management activities. Notably, during winter periods, the GC sward (2021/22) exhibited higher RECO and positive NEE values than the CC (2022/23) under comparable TA and PPFD conditions.
3.2.2. Soil Cultivation Events
The autumn soil cultivation resulted in the highest C losses across all seasons, totalling 612 kg CO2-C ha−1. This corresponds to the lowest GPP of −69.6 kg CO2-C ha−1 and the highest RECO of 681 kg CO2-C ha−1 between the three events. Mean TA was 9.1 °C, and TS was 8.9 °C during this period. With average SWC at 19.1%, and PPFD of 6.41 mol m−2 day−1 (see Table 3). In contrast, the spring period emitted 326 kg CO2-C ha−1 with a corresponding GPP of −139 kg CO2-C ha−1 and a RECO of 465 kg CO2-C ha−1. During the period, TA and TS were lower while SWC and PPFD were higher than in autumn. The summer sequence resulted in values similar to those of the spring period and emitted a total of 334 kg CO2-C ha−1. Total GPP was −124 kg CO2-C ha−1 and RECO 458 kg CO2-C ha−1. Air temperature and TS were substantially higher than in the other periods, while SWC was considerably lower. The average PPFD was highest of the three sequences.
Table 3.
Carbon dynamics and abiotic factors during the three-week post-cultivation events.
Statistical Evaluation of Ecosystem Respiration
To investigate the effect of the environmental drivers TS and SWC, as well as the effect of soil cultivation and time progression since sowing, including two-way interactions, on RECO, a multiple regression analysis was performed. For the autumn measurement period, the multiple regression analysis yielded an adjusted R2 value of 0.83. Time since sowing had a significant negative main effect (β = −0.036, p < 0.001), indicating that baseline RECO rates decreased over the measurement period. Conversely, plowing had a significant positive main effect (β = 2.221, p = 0.028), with RECO rates being markedly higher. Both TS and SWC were strong, positive drivers of RECO at the start of the measurement period (TS: β = 0.435, p < 0.001; SWC: β = 0.174, p < 0.001). Critically, the influence of these environmental factors was not significantly influenced by plowing management (TS: p = 0.385; SWC: p = 0.103), suggesting a consistent environmental response across management practices. However, the effect of both TS and SWC changed significantly over time (TS: β = −0.016, p < 0.001; SWC: β = −0.022, p < 0.001). These interactions indicate that the positive sensitivity of RECO to both warming and increased soil moisture became progressively weaker as the time since sowing increased.
For the spring measurement period, the multiple regression analysis yielded an adjusted R2 value of 0.69. The model revealed a significant, consistent negative effect of time (β = −0.017, p < 0.001), indicating a general decline in RECO over the measurement period. The sensitivity of RECO to environmental drivers was highly dependent on management practices. The positive effect of TS was significant during soil cultivation and times without, but varied greatly in magnitude. It was strongest for the disc harrowing effect (β = 0.246, p < 0.001), moderate during times without soil cultivation (β = 0.083, p < 0.001), and weakest for the plowing effect (β = 0.038, p < 0.001). The positive effect of SWC was significant at times with no soil cultivation (β = 0.022, p < 0.001) and during plowing (β = 0.038, p < 0.001). Notably, there was no evidence that SWC influenced respiration during disc harrowing (β = 0.006, p = 0.940). The interactions between time and the environmental variables were not statistically significant at the 0.05 level (TS: p = 0.091; SWC: p = 0.637), suggesting that the environmental sensitivities described above remained relatively constant over time.
The multiple regression analysis yielded an adjusted R2 value of 0.88 for the summer measurement period. The analysis revealed a significant positive main effect of time (β = 0.149, p < 0.001), indicating that RECO rates increased over the duration of the measurement period. Plowing had a significant negative main effect on RECO (β = −0.314, p = 0.002), suggesting that the practice suppressed baseline respiration rates. While both environmental drivers showed positive associations with respiration, their influence differed. Soil water content was a highly significant driver (β = 0.232, p < 0.001), whereas TS played a comparatively smaller and only marginally significant role (β = 0.020, p = 0.066). These relationships were strongly moderated by both plowing and time. Most notably, the effect of SWC on RECO was fundamentally altered by plowing practices (β = −0.844, p < 0.001). While increased SWC had a positive effect on RECO in non-plowed soil, this relationship was reversed in plowed soil, where higher SWC was associated with a strong decrease in respiration. Furthermore, plowing significantly enhanced the sensitivity of RECO to TS (β = 0.084, p < 0.001), meaning respiration in plowed soils increased more rapidly with warming compared to non-plowed soils. The model also revealed that the influence of environmental drivers changed over time. The positive effect of TS on RECO became slightly stronger as time progressed (β = 0.004, p = 0.002), while the positive effect of SWC became slightly weaker (β = −0.013, p < 0.001).
3.2.3. Carbon Dynamics During the Winter Periods
During the 2021/2022 winter period, the GC and WW plots exhibited pronounced differences in C fluxes (see Table 4). The WW plot acted as a net C source with a NEE of 933 kg CO2-C ha−1. Total GPP was −688 kg CO2-C ha−1 and RECO 1621 kg CO2-C ha−1. In contrast, the GC plot showed significantly lower net C losses (NEE: 275 kg CO2-C ha−1) supported by higher GPP of −1609 kg CO2-C ha−1 and similar RECO (1885 kg CO2-C ha−1). Both plots acted as C sources during this period, though the WW plot led to considerably higher losses than the GC plot. During the winter period of 2022/2023, the CC sward was a C sink with a net uptake of −223 kg CO2-C ha−1 and showed a higher GPP value and a RECO value between those of WW and GC.
Table 4.
Carbon dynamics of the winter wheat and grass-clover sequence during the winter period 2021/21 and cover crop sequence during the winter period 2022/23.
3.2.4. Carbon Imports and Exports
Carbon imports and exports at the field-scale during the study period are summarized in Table 5. Imports and exports varied significantly between months and years. The month with the highest export of C was August 2022 due to the harvest of SW. In September 2022, the highest import due to slurry application was recorded (see Figure 4). During the GC period, total C imported amounted to −606 kg C ha−1, originating exclusively from excreta deposited by grazing dairy cows. Exports totaled 2382 kg C ha−1, consisting of pasture intake during grazing events and the silage cut. The SW period recorded the lowest imports (−55.4 kg C ha−1, from seed sown), while exports were highest with 1532 kg C ha−1 removed as wheat grain and 1197 kg C ha−1 as straw. The CC period was the only phase where imports (−1258 kg C ha−1) exceeded exports (736 kg C ha−1).
Table 5.
Carbon dynamics, imports, exports, and net ecosystem carbon balance of the individual crops and the total crop sequence.
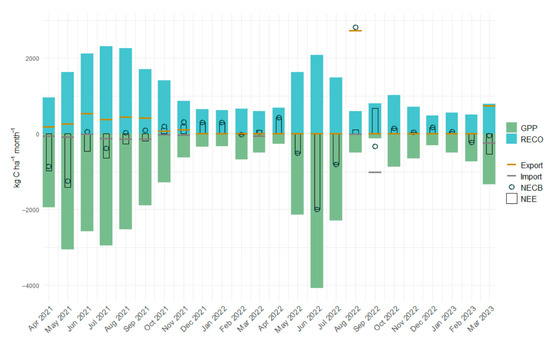
Figure 4.
Carbon dynamics, imports, exports, and net ecosystem carbon balance during the experimental period. Where gross primary production (GPP), ecosystem respiration (RECO), net ecosystem exchange (NEE), net ecosystem carbon balance (NECB), as well as carbon import and export at the field level are given as monthly sums over the two-year study period.
3.2.5. Net Ecosystem Carbon Balance
Over the two-year period, management activities resulted in a net C removal of 5846 kg C ha−1, with the harvest of wheat grain and straw during the SW period shaping the NECB curve most prominently (see Figure 3 and Figure 4). Beyond direct C imports and exports, agricultural management activities like soil cultivation influenced NECB indirectly by affecting the NEE. Notably, soil cultivation typically led to an increase in CO2 emissions, as reflected by the upward trend in the curve following these interventions (see Figure 3 and Figure 4). Within the crop sequence, the GC period exhibited the highest net C uptake of −1386 kg C ha−1, while the CC period showed a considerably lower NECB of −139 kg C ha−1. In contrast, the SW sequence resulted in a positive NECB of 120 kg C ha−1, indicating that this phase acted as a net C source.
Monthly NECB values largely paralleled NEE trends (see Figure 4), reflecting the small impact import and export had on the C dynamics during most months. The greatest difference between NEE and NECB was recorded in the months of August and September 2022. Harvest of SW in August led to an NECB that was considerably higher than in other months. In September, the application of slurry led to a negative NECB despite a relatively high NEE due to a low GPP. Management-related exports did not fully offset cumulative NEE and C imports, resulting in the study site functioning as a net CO2-C sink over the two-year period. By the end of the study period, the NECB indicated a net C import of −1404 kg C ha−1. This corresponds to an average annual net C uptake of −702 kg C ha−1 yr−1.
4. Discussion
4.1. Soil Cultivation Events
The termination of the GC ley resulted in significantly higher CO2 losses following autumn plowing compared to spring plowing. Assuming similar C concentration, C/N ratio, and mineralization potential of the GC sward residue in both seasons [14,92], the observed differences in emissions are primarily attributable to contrasting TS, with SWC exerting a secondary influence, a conclusion supported by statistical analysis. Consequently, cooler TS during spring reduced mineralization rates and suppressed C losses, as regression models confirmed a strong dependence of RECO on TS.
Optimal conditions for C mineralization in sandy-loamy soils are reported as 30–35 °C for TS and 60% for water-filled pore space (WFPS) [93,94]. Given WFPS’s superior precision as a mineralization indicator compared to SWC, it was calculated following Nyameasem et al. [34] using assumed post-plowing bulk density (1.28 g cm−3), assumed particle density (2.65 g cm−3), and average SWC measurements from the three cultivation periods. Resulting WFPS values were 37% (autumn), 48% (spring), and 16% (summer). As TS ranged between 6.3 and 19.5 °C and WFPS between 16 and 48%, conditions remained suboptimal for C mineralization across all seasons, likely constraining potential CO2 losses.
Despite near-optimal TS (19.5 °C) in summer, CO2 losses remained similar to spring values and were not maximal. This suppression is attributed to severe drought conditions, with an SWC of 8.1% (WFPS of 16%), far below the optimum for mineralization. The critical role of SWC is confirmed by the statistical model and further illustrated by the progression of emissions during the summer observation period. Ecosystem respiration increased towards the end of the three weeks in response to rainfall, raising SWC. This deviation from the typical post-cultivation decline pattern observed after sowing of SW and WW, resulting in a positive correlation between time and RECO in summer, was confirmed by the regression model. The mitigating effect of hot, dry summer conditions on RECO observed here aligns with findings by Mühlbachová et al. [45]. An additional factor contributing to lower summer RECO could be the lower quantity and broader C/N ratio of above- and belowground harvest residuals from wheat compared to the GC ley. Confirming this assumption, Rees et al. [12] noted that residual C from cereal roots is typically less than half that from perennial ryegrass.
While no directly comparable studies on plowing time with similar timeframes were found to contextualize these results, the dominant influence of TS and SWC on CO2 emissions suggests that, within the limited three-week post-cultivation observation window, these environmental conditions are the primary determinants. Ecosystem respiration was predominantly affected by TS in autumn and spring plowing events, whereas SWC exerted a stronger influence during summer.
Although the soil cultivation-induced increase was minor relative to total RECO in most sequences (except for the CC), it still represents considerable C losses (see Table 3). Furthermore, the three-week period may not fully capture the total soil cultivation-related C loss. Literature consistently highlights plowing as a significant driver of SOC loss in both grassland and arable systems [46,95,96,97,98]. Consequently, reducing tillage intensity represents a viable strategy for mitigating SOC losses. For crop sequences with lower yield sensitivity, adopting no-till practices or undersowing for GC leys and CCs could provide effective, yield-neutral mitigation options [99,100]. Supporting this, Mühlbachová et al. [45] reported that reduced tillage and no-tillage, particularly with surface mulch, decreased CO2 emissions by 45% and 51% on average over six years, respectively. Lastly, even though spring cultivation is clearly recommended based on the results of this study, it might be difficult to establish in practice, as winter crops often outperform spring crops in terms of yield [47] and are therefore predominantly used.
4.2. Carbon Dynamics During the Winter Period
Carbon dynamics exhibited pronounced differences between winter periods for the GC sward and the WW crop. The newly sown WW plot functioned as a net source of CO2, with emissions significantly elevated compared to the GC sward. This divergence was primarily driven by substantially lower GPP of the WW. In contrast, the established GC sward retained over 500 kg C ha−1 more during the winter months. These results underscore that implementing spring plowing to terminate GC swards is a vital strategy for mitigating emissions and preserving soil C during winter. The CC, sown significantly earlier than WW, developed greater vegetative cover and root biomass by winter, enabling it to act as a net C sink during the dormant season, demonstrating its significant potential for C sequestration.
Direct comparisons between perennial grass swards and annual WW plots, particularly concerning C sequestration potential during the dormant season, remain scarce in the literature. Consequently, generalizing these findings requires caution. However, existing studies provide supporting evidence for the observed dynamics. Research in southern Germany [101] measured lower winter CO2 emissions from an undisturbed, vegetation-rich fallow on loamy sand soils compared to cultivated cropland, highlighting the impact of soil disturbance on C losses and aligning with our observation of higher emissions from the tilled WW plot. Similarly, Peichl et al. [102] reported lower daytime CO2 uptake following the sowing of a forage crop compared to an established grass area, consistent with the reduced GPP we observed in the newly sown WW. Further corroboration comes from a US study utilizing the EC method [103], which measured dormant season NEE losses of 1540 ± 60 kg C ha−1 for WW. Ranathunga et al. [62] found that winter CCs significantly enhanced C sequestration, acting as a net C sink during winter, supporting the findings of this study. Collectively, these findings highlight the critical influence of winter vegetation cover and management practices on C balance, with undisturbed GC swards and early established CCs offering effective strategies to enhance C retention and sequestration during the winter period.
4.3. Net Ecosystem Carbon Balance
4.3.1. Grass-Clover Ley
Numerous studies underscore the critical influence of management practices on the C balance of agricultural systems [11,104,105,106,107]. The integration of GC leys has been widely advocated to enhance C sequestration [14,37,108], a strategy corroborated by our findings. For permanent grasslands in the temperate climate zone, high annual net CO2 uptake has been frequently reported, e.g., for grassland sites in Ireland with −2450 to −2840 kg CO2-C ha−1 yr−1 [102] or northern Germany with −2820 kg CO2-C ha−1 yr−1 [85]. The even slightly higher NEE (see Table 5) observed for the GC sward in this study, despite high grazing frequency, likely stems from moderate biomass removal, consistent with Richter et al. [109], who demonstrated that intensive grazing reduces C sequestration while moderate practices enhance it. This management effect is further evidenced by Central European studies where grazing-cutting systems sequestered significantly more C (−1410 kg C ha−1 yr−1) than cutting-only regimes (−227 kg C ha−1 yr−1) [110].
During the GC ley period, cumulative NEE fully compensated for C losses via biomass exports. When combined with C imports, the system functioned as a strong net sink, yielding a NECB of −1386 kg C ha−1. While direct comparisons for GC leys remain limited, broader grassland studies reveal substantial C balance variations. A cut and grazed grassland site in Ireland showed a C balance of −240 and −890 kg C ha−1 yr−1 for two consecutive years with a corresponding harvest of 10 and 7 t DM ha−1 yr−1, respectively [111]. A different study reported a NBP of −1840 ± 570 kg C ha−1 yr−1 on a managed grassland site in Ireland [102]. Janssens et al. [112] estimated a NBP of −660 ± 900 kg C ha−1 yr−1 for European grasslands, while Ciais et al. [113] reported a clear sink activity (NBP: −740 ± 100 kg C ha−1 yr−1). Notably, high-yielding grasslands (14,800 kg DM ha−1 yr−1) under high cutting frequencies can become C sources (NBP: 290 kg C ha−1 yr−1) [85], emphasizing how management intensity, sward condition, and abiotic factors govern C outcomes in temperate regions. Critically, despite high grazing frequency, the GC ley maintained net sink functionality. This finding not only validates pasture-based dairy production with moderate intensity as a sustainable alternative to conventional systems but also positions GC ley integration into arable rotations as a viable strategy for improving C build-up at crop production sites.
Beyond its positive influence on C dynamics, GC leys also demonstrate significant efficiency in mitigating other GHG emissions inherent to agricultural systems. The high feed quality of the GC ley pasture has been linked to low CH4 emissions and intensities. The high nutritional quality, characterized by elevated energy concentration and digestibility, lowers the CH4 production in the rumen. Furthermore, it promotes high voluntary feed intake, which improves milk yield and thereby reduces specific emission intensities [73,75]. Furthermore, the integration of GC leys into arable rotations contributes to a reduction in N-related environmental impacts. Several studies have recorded a reduction of NO3 leaching and N2O emission in arable crop rotations during the ley phase, even under grazed conditions [29,30,34].
4.3.2. Spring Wheat
During the SW, a positive NECB indicated a net C source. This was primarily due to the relatively low C imports and higher C exports, which exceeded the combined input from NEE and imports. Various management strategies have been shown to improve the C balance of cash crops [104,106,114]. Although the application of slurry is constrained in low-input systems, the broader use of farmyard manure has been consistently associated with increased SOC content [11,68,115,116]. Practices such as retaining more harvest residues by increasing stubble height or incorporating straw into the soil [107] have proven effective in enhancing C sequestration.
In the context of this study, one approach to improving the NECB of the SW sequence would be to increase the amount of organic residues left on the field after harvest. The current 10 cm stubble accounts for 171 kg C ha−1. Increasing the stubble height by another 10 cm could shift the NECB toward a slight C sink, assuming an even biomass distribution along the stems. Leaving straw on the field would further enhance the C import. Ranathunga et al. [62] demonstrated that straw retention was a critical factor in transforming NECB from a C source to a sink. However, since the straw on this research farm is used as bedding for dairy cattle, full retention is not feasible. Increasing stubble height is therefore a more realistic option under these farm conditions.
Most studies assessing C balances in crop rotations include WW and not SW. However, Gan et al. [117] investigated SW within a C-enhancing crop rotation and reported C sequestration potential. Their approach included soil-test-based fertilization, reduced fallow periods, and rotating cereals with legumes. Previous work by Gan et al. [118] reported that SW acted as a C source under conventional management, underscoring the variability of outcomes depending on management. Another effective strategy for enhancing SOC on arable land is reducing tillage, which is known to increase SOC mineralization rates [106]. In North Dakota, a conventional crop rotation including SW, corn, and soybean showed that under no-till management, SW achieved an NECB of −1790 ± 390 kg C ha−1 yr−1, indicating C sink activity. In contrast, under standard soil cultivation, SW functioned as a C source [119]. These findings suggest that adopting improved management practices can reduce or even reverse the soil C balance of SW, making it a viable component in sustainable crop sequences.
4.3.3. Cover Crop and Slurry Application
The use of CCs during fallow periods is another practice frequently associated with reduced C losses and enhanced SOC accumulation due to prolonged vegetative cover and increased photosynthetic activity [104,120]. However, the success of the CC depends on soil management and environmental conditions. Contrary to most literature reporting CCs as C sinks and to our hypothesis, our study observed the CC to be a net CO2 source, with a cumulative NEE of 383 kg CO2-C ha−1. This divergence likely stems from site-specific conditions. Soil dryness following CC sowing significantly suppressed plant growth until late October, while a mineralization spike post-cultivation drove elevated RECO. Lastly, deep loosening was undertaken in August, causing a strongly enhanced aeration of the soil and, therefore, might have contributed to the enhanced mineralization of organic C compounds. Notably, September alone contributed ~60% of the total positive NEE (September–January), underscoring how the overlapping of suboptimal sowing timing and drought critically reduced C efficiency. One way to reduce C losses associated with CC cultivation is to sow it as an understory crop during the preceding season, thereby eliminating the need for soil cultivation immediately after harvest. Several studies have shown that implementing CCs in combination with reduced or no-till systems has a positive impact on the NECB [121,122]. Prade et al. [61] found that undersowing a grass ley into wheat positively affected SOC.
Slurry application in this crop sequence adds further complexity. Although no noticeable CO2 flux spike followed slurry application, applying a C retention coefficient of 20% [14] implies that 20% of slurry C was sequestered while 80% contributed to RECO, assuming no C runoff. Of the total RECO (5025 kg CO2 C ha−1), 808 kg CO2 C ha−1 likely originated from slurry mineralization. Adjusting for this exogenous C source, the CC sequence may represent a moderate gross C sink. Our context-dependent results align with broader literature on the effectiveness of CCs, showing varying results [58,59,60,61,62]. Using the EC method, Schreiner-McGraw et al. [123] measured a net C gain during the CC period in a US system, with a mean net ecosystem production of −1600 ± 260 kg C ha−1, confirming CCs can function as C sinks under suitable conditions. Similarly, a multi-site analysis of 15 European croplands (41 site-years) by Ceschia et al. [124] quantified the NECB using the EC method and C import and export data. While conventional systems showed an average NECB of 1380 ± 2390 kg C ha−1 yr−1, the integrating CCs with reduced tillage shifted the NECB toward neutrality.
The apparent C source behavior observed during the CC period primarily reflects acute establishment-phase drought and unideal fertilization timing rather than systemic inefficiency. When optimizing the sowing timing of CC for SWC, the C sequestration across diverse agro-ecosystems can be enhanced [64]. Furthermore, the CC period exhibited greater winter C uptake potential than WW or GC leys. While the variability in reported CC efficiency accurately reflects the system’s complexity, the significant winter sequestration observed here underscores its value in mitigating emissions despite potential initial losses. Crucially, the observed losses linked to tillage and delayed early growth strongly support sowing CCs as understory crops to minimize these setbacks.
4.3.4. Carbon Imports
The C import of −1919 kg C ha−1 was essential in achieving a negative NECB in this system. Over 96% of this import was derived from pasture-derived animal excrements and slurry, underscoring its crucial role as a source for C. The results of this study show that in the absence of these organic imports, the NECB would shift to a net positive balance, as C exports exceeded the NEE of the crop sequence. The critical function of organic fertilizers in enhancing C imports and a negative NECB within arable systems, as observed in this study, aligns with established literature emphasizing its importance for SOC [48,49,54,125]. Not covered by the methodology is the C retention efficiency of slurry, which is an important factor in defining its C sequestration potential. A study at the same research farm evaluated slurry applied within a comparable crop rotation, determining a C retention coefficient of 20% [14]. Applying this coefficient uniformly to both slurry and pasture excrements indicates that approximately 371 kg C ha−1 was retained from these sources. Solid manure application is a well-documented strategy for enhancing soil C retention, a practice already implemented at the research farm but not evaluated within the two-year study period. Studies report retention rates of up to 30%, leading to greater SOC accumulation [126,127]. Collectively, these findings align with the literature findings that organic fertilizer application is a viable management strategy for increasing SOC and improving the C balances of arable systems.
4.3.5. Cumulative Net Ecosystem Carbon Balance
The crop sequence in this study exhibited an NECB of −702 kg C ha−1 yr−1, confirming its function as a net C sink. This sink capacity was driven by three synergistic mechanisms: (1) a robust NEE during the GC ley phase coupled with moderate biomass export through grazing and silage cuts, (2) significant C imports via slurry and pasture excrements, and (3) a negative NEE from the CC during winter. The primary field-scale C losses originated from biomass removal during GC utilization, SW harvest, as well as the subsequent C losses caused by the soil cultivation before CC sowing, as evidenced by the pronounced positive NEE peak in September 2022 (see Figure 4). These losses highlight the critical importance of strategic C imports to offset exports and the sensitivity of soil cultivation timing to C losses.
While no directly comparable studies quantify the field-scale NECB in ICLSs with similar crop rotations and management intensity, our findings align with established principles documented. The C-enhancing effects of ley integration [37,108,109], coupled with the C uptake capacity of CCs during winter [64], reduced mineralization losses through optimized soil cultivation timing [44,45], and C import through organic fertilizer utilization [48,49], collectively validate the observed result in this study. This convergence of evidence underscores how coordinated implementation of these practices, increased C imports, extended soil coverage, and adjusted management schedules collectively enhance C retention. Consequently, well-managed ICLSs emerge as a pivotal strategy for transforming arable systems into net C sinks while mitigating agricultural GHG emissions.
4.4. Limitations of the Study and Potential Future Research
While this study offers valuable insights into the C dynamics of an organic ley-arable crop sequence using the EC method, several limitations must be acknowledged to contextualize the findings and guide future research.
One primary limitation of this study is the exclusive reliance on the EC method to assess CO2 exchange. Although the EC method is well-suited to capturing high-resolution, continuous C fluxes at the field-scale, it does not directly quantify changes in SOC stocks. Therefore, the NECB of the study site is derived from net gaseous CO2 exchange and C import rather than differences in soil C. Furthermore, the short duration of the study may not capture interannual variability or the longer-term course of SOC change, which can respond slowly to management activities.
To better understand how the NECB relates to SOC storage changes, future research should integrate multiple complementary approaches in a long-term study. Incorporating the traditional soil core methods alongside the EC method could provide a comprehensive understanding of both short-term fluxes and long-term SOC stock changes, and display how these processes relate to management activities. The comparative novelty of using the EC method for field-scale C dynamics assessment and implementing ICLSs in practice limits the availability of comparative literature. This shortage prevents making generalized statements about the impact of ICLSs and their management tools on C dynamics. Thus, analyzing the C dynamics of various crop rotations and management practices within ICLSs should be the focus of future research.
5. Conclusions
This study demonstrates the critical role of crop rotation, management practices, and timing on the NECB of a ley-arable organic farming system. The GC ley was most effective in accumulating C, emphasizing the value of perennial forage in sustainable farming, especially so in arable systems. Although SW exhibited high gross C uptake, its overall NECB was compromised by harvest-related exports. The CC, while initially a C source due to drought conditions during and after soil cultivation and sowing, showed a comparatively high CO2 uptake during the winter period, and thus remains a valuable tool for SOC preservation, especially if undersown to avoid soil disruption. Soil cultivation consistently triggered short-term CO2 emissions, with their magnitude strongly influenced by the interacting effects of SWC and TS. These results underscore the complexity and site-specific nature of C dynamics in agricultural production systems. Despite episodic losses, the study site functioned as a net C sink over the two years, demonstrating that climate-friendly agricultural management is achievable within productive ley-arable organic farming systems. By integrating C retaining and enhancing practices, such as GC leys, adjusted soil cultivation timing, organic fertilization, and diversified rotations, organic ICLSs can contribute meaningfully to climate mitigation. Future research should focus on long-term assessments of C stock changes with complementary methodologies and explore synergies between environmental services within ICLSs to promote science-based climate-smart agricultural policies.
Author Contributions
Conceptualization, M.-S.R.E. and H.P.J.S.; methodology, M.-S.R.E. and A.P.; software, M.-S.R.E.; validation, M.-S.R.E., A.P. and F.T.; formal analysis, M.-S.R.E.; investigation, M.-S.R.E.; data curation, M.-S.R.E.; writing—original draft preparation, M.-S.R.E.; writing—review and editing, M.-S.R.E., H.P.J.S., A.P. and F.T.; visualization, M.-S.R.E.; supervision, A.P. and F.T.; project administration, A.P. and F.T.; funding acquisition, A.P. and F.T. All authors have read and agreed to the published version of the manuscript.
Funding
This study was supported by a PhD scholarship of “Gesellschaft für Energie und Klimaschutz Schleswig-Holstein GmbH (EKSH)”. The two eddy covariance stations were financed by the “Wirtschaftsförderung und Technologietransfer Schleswig-Holstein GmbH (WTSH)”.
Institutional Review Board Statement
Not applicable.
Informed Consent Statement
Not applicable.
Data Availability Statement
The data presented in this study are available upon request from the corresponding author. The data are not publicly available due to privacy concerns.
Acknowledgments
Petra Voß and Thomas Ehmsen are acknowledged for their priceless and everlasting support in the fieldwork and laboratory tasks. Furthermore, the lead author wishes to thank the EKSH for the PhD scholarship and their ongoing support.
Conflicts of Interest
The authors declare no conflicts of interest.
Abbreviations
The following abbreviations are used in this manuscript:
| AGB | Above-ground biomass |
| Av | Average |
| BNF | Biological nitrogen fixation |
| C | Carbon |
| CC | Cover crop |
| CH4 | Methane |
| C/N | Carbon-to-nitrogen |
| CO2 | Carbon dioxide |
| cum | Cumulated |
| DM | Dry matter |
| DMI | Dry matter intake |
| DOM | Digestible organic matter |
| EC | Eddy covariance |
| ex | Export |
| FP | Footprint |
| GC | Grass-clover |
| GHG | Greenhouse gas |
| GPP | Gross primary production |
| ICLS | Integrated crop–livestock system |
| im | Import |
| LT | Long term |
| LULUCF | Land use, land-use change, and forestry |
| MAOC | Mineral-associated organic carbon |
| N | Nitrogen |
| N2O | Nitrous oxide |
| NBP | Net biome productivity |
| NECB | Net ecosystem carbon balance |
| NEE | Net ecosystem exchange |
| NIRS | Near-infrared spectroscopy |
| NO3 | Nitrate |
| P | Precipitation |
| POC | Particulate organic carbon |
| PPFD | Photosynthetic photon flux density |
| RECO | Ecosystem respiration |
| SOC | Soil organic carbon |
| SW | Spring wheat |
| SWC | Soil water content |
| TA | Air Temperature |
| TS | Soil Temperature |
| u* | Friction velocity |
| VPD | Vapor pressure deficit |
| WFPS | Water-filled pore space |
| WPL | Webb, Pearman, and Leuning |
| WW | Winter wheat |
Appendix A
Table A1.
Time series of crop sequences, eddy covariance measurements, time periods, and measures performed on the experimental site.
Table A1.
Time series of crop sequences, eddy covariance measurements, time periods, and measures performed on the experimental site.
| SW Crop Sequence | Dates | WW Crop Sequence | Dates |
|---|---|---|---|
| GC | 01.04.2021–14.03.2022 | GC | 01.04.2021–27.10.2021 |
| SW | 15.03.2022–22.08.2022 | WW | 28.10.2021–22.08.2022 |
| CC | 23.08.2022–31.03.2023 | CC | 23.08.2022–31.03.2023 |
| EC measurement | EC measurement | ||
| 01.04.2021–31.03.2023 | 28.10.2021–14.03.2022 | ||
| Periods | Periods | ||
| Soil cultivation SW | 15.03.2022–04.04.2022 | Soil cultivation WW | 28.10.2021–17.11.2021 |
| Soil cultivation CC | 23.08.2022–12.09.2022 | ||
| Winter period 21/22 | 13.12.2021–14.03.2022 | Winter period 21/22 | 13.12.2021–14.03.2022 |
| Winter period 22/23 | 13.12.2022–14.03.2023 | ||
| Measures | Measures | ||
| Grazing event | 06.04.2021 | Disc harrowing | 28.10.2021 |
| Grazing event | 30.04.2021 | Plowing | 28.10.2021–29.10.2021 |
| Grazing event | 20.05.2021–21.05.2021 | Sowing WW | 29.10.2021 |
| Mulching | 26.05.2021 | Harrowing | 12.05.2022 |
| Silage cut | 14.06.2021 | Fertilization | 14.05.2022 |
| Swathing | 15.06.2021 | Harvest WW | 12.08.2022 |
| Baling & removal | 16.06.2021 | Straw bailing | 13.08.2022–14.08.2022 |
| Grazing event | 29.06.2021–30.06.2021 | Straw removal | 16.08.2022 |
| Grazing event | 15.07.2021–17.07.2021 | ||
| Grazing event | 02.08.2021 | ||
| Grazing event | 18.08.2021 | ||
| Grazing event | 02.09.2021–03.09.2021 | ||
| Grazing event | 07.09.2021 | ||
| Grazing event | 28.09.2021 | ||
| Grazing event | 13.10.2021 | ||
| Grazing event | 06.11.2021 | ||
| Grazing event | 10.03.2022 | ||
| Disc harrowing | 15.03.2022 | ||
| Plowing | 21.03.2022–22.03.2022 | ||
| Sowing SW | 22.03.2023 | ||
| Harrowing | 12.05.2022 | ||
| Harvest SW | 12.08.2022 | ||
| Straw bailing | 13.08.2022–14.08.2022 | ||
| Straw removal | 16.08.2022 | ||
| Deep loosening | 23.08.2022–24.08.2022 | ||
| Cultivating | 25.08.2022–26.08.2022 | ||
| Sowing CC | 26.08.2022 | ||
| Fertilization | 20.09.2022 | ||
| Grazing event | 05.03.2023–07.03.2023 | ||
Abbreviations are as follows (sorted alphabetically): CC: cover crops; EC: eddy covariance; GC: grass-clover; SW: spring wheat; WW: winter wheat.
References
- Guarnaccia, P.; Timpanaro, G.; Incardona, S.; Foti, V.T.; Cammarata, M. Innovation in crop rotations for sustainable integrated crop-livestock systems: The case of a typical semi-arid Mediterranean area. Clean. Environ. Syst. 2024, 13, 100182. [Google Scholar] [CrossRef]
- Food and Agriculture Organisation of the United Nations (FAO). Emissions Due to Agriculture: Global, Regional and Country Trends, 2000–2018; FAOSTAT Analytical Brief No. 18; Food and Agriculture Organisation of the United Nations: Rome, Italy, 2020.
- Jia, W.; Qin, W.; Zhang, Q.; Wang, X.; Ma, Y.; Chen, Q. Evaluation of crop residues and manure production and their geographical distribution in China. J. Clean. Prod. 2018, 188, 954–965. [Google Scholar] [CrossRef]
- Malhi, G.S.; Kaur, M.; Kaushik, P. Impact of Climate Change on Agriculture and Its Mitigation Strategies: A Review. Sustainability 2021, 13, 1318. [Google Scholar] [CrossRef]
- European Environment Agency (EEA). Total Net Greenhouse Gas Emission Trends and Projections in Europe: 8th Environment Action Programme (8th Eap Headline Indicator). 2024. Available online: https://www.eea.europa.eu/en/analysis/indicators/total-greenhouse-gas-emission-trends?activeAccordion=309c5ef9-de09-4759-bc02-802370dfa366 (accessed on 15 August 2025).
- Rumpel, C.; Amiraslani, F.; Chenu, C.; Garcia Cardenas, M.; Kaonga, M.; Koutika, L.-S.; Ladha, J.; Madari, B.; Shirato, Y.; Smith, P.; et al. The 4p1000 initiative: Opportunities, limitations and challenges for implementing soil organic carbon sequestration as a sustainable development strategy. Ambio 2020, 49, 350–360. [Google Scholar] [CrossRef]
- Smith, P.; Martino, D.; Cai, Z.; Gwary, D.; Janzen, H.; Kumar, P.; McCarl, B.; Ogle, S.; O’Mara, F.; Rice, C.; et al. Greenhouse gas mitigation in agriculture. Philos. Trans. R. Soc. B Biol. Sci. 2008, 363, 789–813. [Google Scholar] [CrossRef]
- Crowther, T.W.; Van den Hoogen, J.; Wan, J.; Mayes, M.A.; Keiser, A.D.; Mo, L.; Averill, C.; Maynard, D.S. The global soil community and its influence on biogeochemistry. Science 2019, 365, eaav0550. [Google Scholar] [CrossRef]
- Davidson, E.A. Carbon dioxide loss from tropical soils increases on warming. Nature 2020, 584, 198–199. [Google Scholar] [CrossRef]
- Kirschbaum, M.U.F. The temperature dependence of organic-matter decomposition—Still a topic of debate. Soil Biol. Biochem. 2006, 38, 2510–2518. [Google Scholar] [CrossRef]
- Lal, R. Soil Carbon Sequestration Impacts on Global Climate Change and Food Security. Soils Final. Front. 2004, 304, 1623–1627. [Google Scholar] [CrossRef]
- Rees, R.M.; Bingham, I.J.; Baddeley, J.A.; Watson, C.A. The role of plants and land management in sequestering soil carbon in temperate arable and grassland ecosystems. Geoderma 2005, 128, 130–154. [Google Scholar] [CrossRef]
- Soussana, J.-F.; Lutfalla, S.; Ehrhardt, F.; Rosenstock, T.; Lamanna, C.; Havlík, P.; Richards, M.; Wollenberg, E.; Chotte, J.-L.; Torquebiau, E.; et al. Matching policy and science: Rationale for the ‘4 per 1000—Soils for food security and climate’ initiative. Soil Tillage Res. 2019, 188, 3–15. [Google Scholar] [CrossRef]
- Los Rios, J.; de Poyda, A.; Reinsch, T.; Kluß, C.; Taube, F.; Loges, R. Integrating Crop-Livestock System Practices in Forage and Grain-Based Rotations in Northern Germany: Potentials for Soil Carbon Sequestration. Agronomy 2022, 12, 338. [Google Scholar] [CrossRef]
- Nyameasem, J.K.; Los Rios, J.; de Kluß, C.; Reinsch, T.; Poyda, A.; Taube, F.; Loges, R. Incorporating leys in arable systems as a mitigation strategy to reduce soil organic carbon losses during land-use change. Front. Environ. Sci. 2024, 12, 1399197. [Google Scholar] [CrossRef]
- Reinsch, T.; Loza, C.; Malisch, C.S.; Vogeler, I.; Kluß, C.; Loges, R.; Taube, F. Toward Specialized or Integrated Systems in Northwest Europe: On-Farm Eco-Efficiency of Dairy Farming in Germany. Front. Sustain. Food Syst. 2021, 5, 614348. [Google Scholar] [CrossRef]
- Swanepoel, P.A.; Smit, H.P.J. Integration of livestock into conservation agriculture systems in the Mediterranean climate region of South Africa. Afr. J. Range Forage Sci. 2025, 42, 57–65. [Google Scholar] [CrossRef]
- Cruz Colazo, J.; de Dios Herrero, J.; Sager, R.; Guzmán, M.L.; Zaman, M. Contribution of Integrated Crop Livestock Systems to Climate Smart Agriculture in Argentina. Land 2022, 11, 2060. [Google Scholar] [CrossRef]
- Palm, C.; Blanco-Canqui, H.; DeClerck, F.; Gatere, L.; Grace, P. Conservation agriculture and ecosystem services: An overview. Agric. Ecosyst. Environ. 2014, 187, 87–105. [Google Scholar] [CrossRef]
- Sarkar, D.; Kar, S.K.; Chattopadhyay, A.; Shikha Rakshit, A.; Tripathi, V.K.; Dubey, P.K.; Abhilash, P.C. Low input sustainable agriculture: A viable climate-smart option for boosting food production in a warming world. Ecol. Indic. 2020, 115, 106412. [Google Scholar] [CrossRef]
- High Level Panel of Experts on Food Security and Nutrition (HLPE). Agroecological and Other Innovative Approaches for Sustainable Agriculture and Food Systems that Enhance Food Security and Nutrition: A Report by the High Level Panel of Experts on Food Security and Nutrition of the Committee on World Food Security; High Level Panel of Experts: Roma, Italy, 2019. [Google Scholar]
- Kremen, C. Ecological intensification and diversification approaches to maintain biodiversity, ecosystem services and food production in a changing world. Emerg. Top. Life Sci. 2020, 4, 229–240. [Google Scholar] [CrossRef]
- Oldfield, E.E.; Bradford, M.A.; Wood, S.A. Global meta-analysis of the relationship between soil organic matter and crop yields. Soil 2019, 5, 15–32. [Google Scholar] [CrossRef]
- Chakraborty, P.; Thotakuri, G.; Singh, N.; Dhaliwal, J.K.; Kumar, S. Crop-livestock integration influenced soil profile organic carbon and hydro-physical properties in converted grasslands to row crops. Soil Tillage Res. 2024, 240, 106093. [Google Scholar] [CrossRef]
- Petersen, S.O.; Sommer, S.G.; Béline, F.; Burton, C.; Dach, J.; Dourmad, J.Y.; Leip, A.; Misselbrook, T.; Nicholson, F.; Poulsen, H.D.; et al. Recycling of livestock manure in a whole-farm perspective. Livest. Sci. 2007, 112, 180–191. [Google Scholar] [CrossRef]
- Oliveira, J.M.; Gollany, H.T.; Polumsky, R.W.; Madari, B.E.; Leite, L.F.C.; Machado, P.L.O.A.; Carvalho, M.T.M. Predicting Soil Organic Carbon Dynamics of Integrated Crop-Livestock System in Brazil Using the CQESTR Model. Front. Environ. Sci. 2022, 10, 826786. [Google Scholar] [CrossRef]
- Christensen, B.T.; Rasmussen, J.; Eriksen, J.; Hansen, E.M. Soil carbon storage and yields of spring barley following grass leys of different age. Eur. J. Agron. 2009, 31, 29–35. [Google Scholar] [CrossRef]
- Schipanski, M.E.; Barbercheck, M.; Douglas, M.R.; Finney, D.M.; Haider, K.; Kaye, J.P.; Kemanian, A.R.; Mortensen, D.A.; Ryan, M.R.; Tooker, J.; et al. A framework for evaluating ecosystem services provided by cover crops in agroecosystems. Agric. Syst. 2014, 125, 12–22. [Google Scholar] [CrossRef]
- Smit, H.P.J.; Reinsch, T.; Kluß, C.; Loges, R.; Taube, F. Very Low Nitrogen Leaching in Grazed Ley-Arable-Systems in Northwest Europe. Agronomy 2021, 11, 2155. [Google Scholar] [CrossRef]
- Taube, F.; Nyameasem, J.K.; Fenger, F.; Alderkamp, L.; Kluß, C.; Loges, R. Eco--efficiency of leys—The trigger for sustainable integrated crop--dairy farming systems. Grass Forage Sci. 2023, 79, 108–119. [Google Scholar] [CrossRef]
- Loges, R.; Kelm, M.R.; Taube, F. Nitrogen balances, nitrate leaching and energy efficiency of conventional and organic farming systems on fertile soils in northern Germany. Adv. Geoecol. 2006, 38, 407–414. [Google Scholar]
- Nadeem, S.; Hansen, S.; Azzaroli Bleken, M.; Dörsch, P. N2O emission from organic barley cultivation as affected by green manure management. Biogeosciences 2012, 9, 2747–2759. [Google Scholar] [CrossRef]
- Schmeer, M.; Loges, R.; Dittert, K.; Senbayram, M.; Horn, R.; Taube, F. Legume-based forage production systems reduce nitrous oxide emissions. Soil Tillage Res. 2014, 143, 17–25. [Google Scholar] [CrossRef]
- Nyameasem, J.K.; Malisch, C.S.; Loges, R.; Taube, F.; Kluß, C.; Vogeler, I.; Reinsch, T. Nitrous Oxide Emission from Grazing Is Low across a Gradient of Plant Functional Diversity and Soil Conditions. Atmosphere 2021, 12, 223. [Google Scholar] [CrossRef]
- King, A.E.; Blesh, J. Crop rotations for increased soil carbon: Perenniality as a guiding principle. Ecol. Appl. 2018, 28, 249–261. [Google Scholar] [CrossRef] [PubMed]
- King, A.E.; Congreves, K.A.; Deen, B.; Dunfield, K.E.; Simpson, M.J.; Voroney, R.P.; Wagner-Riddle, C. Crop rotations differ in soil carbon stabilization efficiency, but the response to quality of structural plant inputs is ambiguous. Plant Soil 2020, 457, 207–224. [Google Scholar] [CrossRef]
- Lemaire, G.; Gastal, F.; Franzluebbers, A.; Chabbi, A. Grassland-Cropping Rotations: An Avenue for Agricultural Diversification to Reconcile High Production with Environmental Quality. Environ. Manag. 2015, 56, 1065–1077. [Google Scholar] [CrossRef] [PubMed]
- Levin, K.S.; Auerswald, K.; Reents, H.J.; Hülsbergen, K.-J. Effects of Organic Energy Crop Rotations and Fertilisation with the Liquid Digestate Phase on Organic Carbon in the Topsoil. Agronomy 2021, 11, 1393. [Google Scholar] [CrossRef]
- Soussana, J.-F.; Loiseau, P.; Vuichard, N.; Ceschia, E.; Balesdent, J.; Chevallier, T.; Arrouays, D. Carbon cycling and sequestration opportunities in temperate grasslands. Soil Use Manag. 2004, 20, 219–230. [Google Scholar] [CrossRef]
- Haddaway, N.R.; Hedlund, K.; Jackson, L.E.; Kätterer, T.; Lugato, E.; Thomsen, I.K.; Jørgensen, H.B.; Isberg, P.-E. How does tillage intensity affect soil organic carbon? A systematic review. Environ. Evid. 2017, 6, 30. [Google Scholar] [CrossRef]
- Smit, H.P.J.; Anders, H.; Kluß, C.; Taube, F.; Loges, R.; Poyda, A. Sward Diversity Modulates Soil Carbon Dynamics After Ploughing Temporary Grassland. Agriculture 2025, 15, 888. [Google Scholar] [CrossRef]
- Liyanage, L.R.M.C.; Sulaiman, M.F.; Ismail, R.; Gunaratne, G.P.; Dharmakeerthi, R.S.; Rupasinghe, M.G.N.; Mayakaduwa, A.P.; Hanafi, M.M. Carbon Mineralization Dynamics of Organic Materials and Their Usage in the Restoration of Degraded Tropical Tea-Growing Soil. Agronomy 2021, 11, 1191. [Google Scholar] [CrossRef]
- Qiu, Q.; Wu, L.; Hu, Y.; Lai, D.Y.F.; Wang, W.; Xu, Y.; Mgelwa, A.S.; Li, B. Variability and controls of soil CO2 fluxes under different tillage and crop residue managements in a wheat-maize double-cropping system. Environ. Sci. Pollut. Res. 2020, 27, 45722–45736. [Google Scholar] [CrossRef]
- Emran, M.; Naeim, H.; Rashad, M.; Gispert, M. Seasonal changes in soil carbon storage capacity and glomalin-related soil protein under different agricultural activities, abandonment, and wildfire occurrence in Mediterranean region. J. Saudi Soc. Agric. Sci. 2022, 21, 359–371. [Google Scholar] [CrossRef]
- Mühlbachová, G.; Růžek, P.; Kusá, H.; Vavera, R. CO2 Emissions from Soils under Different Tillage Practices and Weather Conditions. Agronomy 2023, 13, 3084. [Google Scholar] [CrossRef]
- Reinsch, T.; Loges, R.; Kluß, C.; Taube, F. Effect of grassland ploughing and reseeding on CO2 emissions and soil carbon stocks. Agric. Ecosyst. Environ. 2018, 265, 374–383. [Google Scholar] [CrossRef]
- Vogeler, I.; Thomsen, I.K.; Taube, F.; Poulsen, H.V.; Loges, R.; Hansen, E.M. Effect of winter cereal sowing time on yield and nitrogen leaching based on experiments and modelling. Soil Use Manag. 2022, 38, 663–675. [Google Scholar] [CrossRef]
- Minasny, B.; Malone, B.P.; McBratney, A.B.; Angers, D.A.; Arrouays, D.; Chambers, A.; Chaplot, V.; Chen, Z.-S.; Cheng, K.; Das, B.S.; et al. Soil carbon 4 per mille. Geoderma 2017, 292, 59–86. [Google Scholar] [CrossRef]
- Poulton, P.; Johnston, J.; Macdonald, A.; White, R.; Powlson, D. Major limitations to achieving “4 per 1000” increases in soil organic carbon stock in temperate regions: Evidence from long-term experiments at Rothamsted Research, United Kingdom. Glob. Change Biol. 2018, 24, 2563–2584. [Google Scholar] [CrossRef]
- Madaras, M.; Krejčí, R.; Mayerová, M. Assessing soil aggregate stability by measuring light transmission decrease during aggregate disintegration. Soil Water Res. 2024, 19, 25–31. [Google Scholar] [CrossRef]
- Šimon, T.; Madaras, M.; Mayerová, M.; Kunzová, E. Soil Organic Carbon Dynamics in the Long-Term Field Experiments with Contrasting Crop Rotations. Agriculture 2024, 14, 818. [Google Scholar] [CrossRef]
- Gross, A.; Glaser, B. Meta-analysis on how manure application changes soil organic carbon storage. Sci. Rep. 2021, 11, 5516. [Google Scholar] [CrossRef]
- Kitamura, R.; Sugiyama, C.; Yasuda, K.; Nagatake, A.; Yuan, Y.; Du, J.; Yamaki, N.; Taira, K.; Kawai, M.; Hatano, R. Effects of Three Types of Organic Fertilizers on Greenhouse Gas Emissions in a Grassland on Andosol in Southern Hokkaido, Japan. Front. Sustain. Food Syst. 2021, 5, 649613. [Google Scholar] [CrossRef]
- Hatano, R.; Mukumbuta, I.; Shimizu, M. Soil Health Intensification through Strengthening Soil Structure Improves Soil Carbon Sequestration. Agriculture 2024, 14, 1290. [Google Scholar] [CrossRef]
- Porwollik, V.; Rolinski, S.; Heinke, J.; Bloh, W.; von Schaphoff, S.; Müller, C. The role of cover crops for cropland soil carbon, nitrogen leaching, and agricultural yields—A global simulation study with LPJmL (V. 5.0-tillage-cc). Biogeosciences 2022, 19, 957–977. [Google Scholar] [CrossRef]
- Quintarelli, V.; Radicetti, E.; Allevato, E.; Stazi, S.R.; Haider, G.; Abideen, Z.; Bibi, S.; Jamal, A.; Mancinelli, R. Cover Crops for Sustainable Cropping Systems: A Review. Agriculture 2022, 12, 2076. [Google Scholar] [CrossRef]
- Acharya, P.; Ghimire, R.; Acosta-Martínez, V. Cover crop-mediated soil carbon storage and soil health in semi-arid irrigated cropping systems. Agric. Ecosyst. Environ. 2024, 361, 108813. [Google Scholar] [CrossRef]
- Chahal, I.; Hooker, D.C.; Deen, B.; Janovicek, K.; Van Eerd, L.L. Long-term effects of crop rotation, tillage, and fertilizer nitrogen on soil health indicators and crop productivity in a temperate climate. Soil Tillage Res. 2021, 213, 105121. [Google Scholar] [CrossRef]
- Jarecki, M.; Grant, B.; Smith, W.; Deen, B.; Drury, C.; Van der Zaag, A.; Qian, B.; Yang, J.; Wagner-Riddle, C. Long-term Trends in Corn Yields and Soil Carbon under Diversified Crop Rotations. J. Environ. Qual. 2018, 47, 635–643. [Google Scholar] [CrossRef]
- Wepruk, E.; Diochon, A.; Van Eerd, L.L.; Gregorich, E.; Deen, B.; Hooker, D. Identifying rotation and tillage practices that maintain or enhance soil carbon and its relation to soil health. Can. J. Soil Sci. 2023, 103, 191–199. [Google Scholar] [CrossRef]
- Prade, T.; Kätterer, T.; Björnsson, L. Including a one-year grass ley increases soil organic carbon and decreases greenhouse gas emissions from cereal-dominated rotations—A Swedish farm case study. Biosyst. Eng. 2017, 164, 200–212. [Google Scholar] [CrossRef]
- Ranathunga, K.N.; Evans, J.; Toth, N.; Brown, S.; Van Eerd, L.L.; Wagner-Riddle, C. Net ecosystem carbon budget and net greenhouse gas emissions under diverse crop rotation using cover crops compared to a conventional crop rotation. Agric. Ecosyst. Environ. 2025, 381, 109418. [Google Scholar] [CrossRef]
- Seitz, D.; Fischer, L.M.; Dechow, R.; Wiesmeier, M.; Don, A. The potential of cover crops to increase soil organic carbon storage in German croplands. Plant Soil 2023, 488, 157–173. [Google Scholar] [CrossRef]
- Poeplau, C.; Don, A. Carbon sequestration in agricultural soils via cultivation of cover crops—A meta-analysis. Agric. Ecosyst. Environ. 2015, 200, 33–41. [Google Scholar] [CrossRef]
- Zomer, R.J.; Bossio, D.A.; Sommer, R.; Verchot, L.V. Global Sequestration Potential of Increased Organic Carbon in Cropland Soils. Sci. Rep. 2017, 7, 15554. [Google Scholar] [CrossRef] [PubMed]
- Powlson, D.S.; Galdos, M.V. Challenging claimed benefits of soil carbon sequestration for mitigating climate change and increasing crop yields: Heresy or sober realism? Glob. Change Biol. 2023, 29, 2381–2383. [Google Scholar] [CrossRef] [PubMed]
- Georgiou, K.; Jackson, R.B.; Vindušková, O.; Abramoff, R.Z.; Ahlström, A.; Feng, W.; Harden, J.W.; Pellegrini, A.F.A.; Polley, H.W.; Soong, J.L.; et al. Global stocks and capacity of mineral-associated soil organic carbon. Nat. Commun. 2022, 13, 3797. [Google Scholar] [CrossRef]
- Tang, J.; Riley, W.J. Competitor and substrate sizes and diffusion together define enzymatic depolymerization and microbial substrate uptake rates. Soil Biol. Biochem. 2019, 139, 107624. [Google Scholar] [CrossRef]
- Heikkinen, J.; Keskinen, R.; Kostensalo, J.; Nuutinen, V. Climate change induces carbon loss of arable mineral soils in boreal conditions. Glob. Change Biol. 2022, 28, 3960–3973. [Google Scholar] [CrossRef]
- Wiesmeier, M.; Poeplau, C.; Sierra, C.A.; Maier, H.; Frühauf, C.; Hübner, R.; Kühnel, A.; Spörlein, P.; Geuß, U.; Hangen, E.; et al. Projected loss of soil organic carbon in temperate agricultural soils in the 21(st) century: Effects of climate change and carbon input trends. Sci. Rep. 2016, 6, 32525. [Google Scholar] [CrossRef]
- Todd-Brown, K.E.O.; Randerson, J.T.; Hopkins, F.; Arora, V.; Hajima, T.; Jones, C.; Shevliakova, E.; Tjiputra, J.; Volodin, E.; Wu, T.; et al. Changes in soil organic carbon storage predicted by Earth system models during the 21st century. Biogeosciences 2014, 11, 2341–2356. [Google Scholar] [CrossRef]
- Skinner, R.; Dell, C.J. Comparing pasture C sequestration estimates from eddy covariance and soil cores. Agric. Ecosyst. Environ. 2015, 199, 52–57. [Google Scholar] [CrossRef]
- Loza, C.; Reinsch, T.; Loges, R.; Taube, F.; Gere, J.I.; Kluß, C.; Hasler, M.; Malisch, C.S. Methane Emission and Milk Production from Jersey Cows Grazing Perennial Ryegrass–White Clover and Multispecies Forage Mixtures. Agriculture 2021, 11, 175. [Google Scholar] [CrossRef]
- Klootwijk, C.W.; Holshof, G.; de Boer, I.J.M.; Van den Pol-Van Dasselaar, A.; Engel, B.; Van Middelaar, C.E. Correcting fresh grass allowance for rejected patches due to excreta in intensive grazing systems for dairy cows. J. Dairy Sci. 2019, 102, 10451–10459. [Google Scholar] [CrossRef]
- Eismann, M.-S.R.; Smit, H.P.J.; Poyda, A.; Loges, R.; Kluß, C.; Taube, F. Combining the Eddy Covariance Method and Dry Matter Intake Measurements for Enteric Methane Emission Estimation from Grazing Dairy Cows. Atmosphere 2024, 15, 1269. [Google Scholar] [CrossRef]
- Mauder, M.; Foken, T. Documentation and Instruction Manual of the Eddy Covariance Software Package TK2; Arbeitsergebnisse No. 26; Universität Bayreuth: Bayreuth, Germany, 2004. [Google Scholar]
- Kljun, N.; Calanca, P.; Rotach, M.W.; Schmid, H.P. A Simple Parameterisation for Flux Footprint Predictions. Bound. Layer Meteorol. 2004, 112, 503–523. [Google Scholar] [CrossRef]
- Vickers, D.; Mahrt, L. Quality Control and Flux Sampling Problems for Tower and Aircraft Data. J. Atmos. Ocean. Technol. 1997, 14, 512–526. [Google Scholar] [CrossRef]
- Isaac, P.; Cleverly, J.; McHugh, I.; Van Gorsel, E.; Ewenz, C.; Beringer, J. OzFlux data: Network integration from collection to curation. Biogeosciences 2017, 14, 2903–2928. [Google Scholar] [CrossRef]
- Felber, R.; Münger, A.; Neftel, A.; Ammann, C. Eddy covariance methane flux measurements over a grazed pasture: Effect of cows as moving point sources. Biogeosciences 2015, 12, 3925–3940. [Google Scholar] [CrossRef]
- Ingwersen, J.; Poyda, A.; Kremer, P.; Streck, T. Harvest residues: A relevant term in the carbon balance of croplands? Agric. For. Meteorol. 2024, 349, 109935. [Google Scholar] [CrossRef]
- Mauder, M.; Cuntz, M.; Drüe, C.; Graf, A.; Rebmann, C.; Schmid, H.P.; Schmidt, M.; Steinbrecher, R. A strategy for quality and uncertainty assessment of long-term eddy-covariance measurements. Agric. For. Meteorol. 2013, 169, 122–135. [Google Scholar] [CrossRef]
- Kljun, N.; Calanca, P.; Rotach, M.W.; Schmid, H.P. A simple two-dimensional parameterisation for Flux Footprint Prediction (FFP). Geosci. Model Dev. 2015, 8, 3695–3713. [Google Scholar] [CrossRef]
- Reichstein, M.; Falge, E.; Baldocchi, D.; Papale, D.; Aubinet, M.; Berbigier, P.; Bernhofer, C.; Buchmann, N.; Gilmanov, T.; Granier, A.; et al. On the separation of net ecosystem exchange into assimilation and ecosystem respiration: Review and improved algorithm. Glob. Change Biol. 2005, 11, 1424–1439. [Google Scholar] [CrossRef]
- Poyda, A.; Reinsch, T.; Struck, I.J.; Skinner, R.H.; Kluß, C.; Taube, F. Low assimilate partitioning to root biomass is associated with carbon losses at an intensively managed temperate grassland. Plant Soil 2021, 460, 31–50. [Google Scholar] [CrossRef]
- Helms, J.A. The Dictionary of Forestry; CABI Publishing: Oxfordshire, UK, 1998. [Google Scholar]
- Chapin, F.S.; Woodwell, G.M.; Randerson, J.T.; Rastetter, E.B.; Lovett, G.M.; Baldocchi, D.D.; Clark, D.A.; Harmon, M.E.; Schimel, D.S.; Valentini, R.; et al. Reconciling Carbon-cycle Concepts, Terminology, and Methods. Ecosystems 2006, 9, 1041–1050. [Google Scholar] [CrossRef]
- Elsgaard, L.; Görres, C.-M.; Hoffmann, C.C.; Blicher-Mathiesen, G.; Schelde, K.; Petersen, S.O. Net ecosystem exchange of CO2 and carbon balance for eight temperate organic soils under agricultural management. Agric. Ecosyst. Environ. 2012, 162, 52–67. [Google Scholar] [CrossRef]
- Pries, M.; Losand, B.; Menke, A.; Tholen, E.; Gruber, L.; Hertwig, F.; Jilg, T.; Kluth, H.; Spiekers, H.; Steingaß, H.; et al. Schätzung des Energiegehaltes in Grasprodukten. In Proceedings of the VDLUFA-Kongress, Göttingen, Germany, 18–21 September 2007; Volume 119. [Google Scholar]
- Skinner, R.H. Nitrogen fertilization effects on pasture photosynthesis, respiration, and ecosystem carbon content. Agric. Ecosyst. Environ. 2013, 172, 35–41. [Google Scholar] [CrossRef]
- R Core Team. R: A Language and Environment for Statistical Computing. 2025. Available online: https://www.R-project.org/ (accessed on 3 July 2025).
- Chen, H.; Zhao, X.; Chen, X.; Lin, Q.; Li, G. Seasonal changes of soil microbial C, N, P and associated nutrient dynamics in a semiarid grassland of north China. Appl. Soil Ecol. 2018, 128, 89–97. [Google Scholar] [CrossRef]
- Alhammadi, M.S.; Al-Shrouf, A.M. Irrigation of Sandy Soils, Basics and Scheduling: 3. In Crop Production; Goyal, A., Asif, M., Eds.; IntechOpen: London, UK, 2013. [Google Scholar] [CrossRef]
- Zhou, P.; Li, Y.; Ren, X.; Xiao, H.; Tong, C.; Ge, T.; Brookes, P.C.; Shen, J.; Wu, J. Organic carbon mineralization responses to temperature increases in subtropical paddy soils. J. Soils Sediments 2014, 14, 1–9. [Google Scholar] [CrossRef]
- Chowaniak, M.; Głąb, T.; Klima, K.; Niemiec, M.; Zaleski, T.; Zuzek, D. Effect of tillage and crop management on runoff, soil erosion and organic carbon loss. Soil Use Manag. 2020, 36, 581–593. [Google Scholar] [CrossRef]
- Koch, H.J.; Stockfisch, N. Loss of soil organic matter upon ploughing under a loess soil after several years of conservation tillage. Soil Tillage Res. 2006, 86, 73–83. [Google Scholar] [CrossRef]
- Stockfisch, N.; Forstreuter, T.; Ehlers, W. Ploughing effects on soil organic matter after twenty years of conservation tillage in Lower Saxony, Germany. Soil Tillage Res. 1999, 52, 91–101. [Google Scholar] [CrossRef]
- Willems, A.B.; Augustenborg, C.A.; Hepp, S.; Lanigan, G.; Hochstrasser, T.; Kammann, C.; Müller, C. Carbon dioxide emissions from spring ploughing of grassland in Ireland. Agric. Ecosyst. Environ. 2011, 144, 347–351. [Google Scholar] [CrossRef]
- Soane, B.D.; Ball, B.C.; Arvidsson, J.; Basch, G.; Moreno, F.; Roger-Estrade, J. No-till in northern, western and south-western Europe: A review of problems and opportunities for crop production and the environment. Soil Tillage Res. 2012, 118, 66–87. [Google Scholar] [CrossRef]
- Triplett, G.B.; Dick, W.A. No-Tillage Crop Production: A Revolution in Agriculture! Agron. J. 2008, 100 (Suppl. S3), S-153–S-165. [Google Scholar] [CrossRef]
- Dörsch, P.; Palojärvi, A.; Mommertz, S. Overwinter greenhouse gas fluxes in two contrasting agricultural habitats. Nutr. Cycl. Agroecosyst. 2004, 70, 117–133. [Google Scholar] [CrossRef]
- Peichl, M.; Leahy, P.; Kiely, G. Six-year Stable Annual Uptake of Carbon Dioxide in Intensively Managed Humid Temperate Grassland. Ecosystems 2011, 14, 112–126. [Google Scholar] [CrossRef]
- Waldo, S.; Chi, J.; Pressley, S.N.; O’Keeffe, P.; Pan, W.L.; Brooks, E.S.; Huggins, D.R.; Stöckle, C.O.; Lamb, B.K. Assessing carbon dynamics at high and low rainfall agricultural sites in the inland Pacific Northwest US using the eddy covariance method. Agric. For. Meteorol. 2016, 218–219, 25–36. [Google Scholar] [CrossRef]
- Burney, J.A.; Davis, S.J.; Lobell, D.B. Greenhouse gas mitigation by agricultural intensification. Proc. Natl. Acad. Sci. USA 2010, 107, 12052–12057. [Google Scholar] [CrossRef]
- Kern, J.S.; Johnson, M.G. Conservation Tillage Impacts on National Soil and Atmospheric Carbon Levels. Soil Sci. Soc. Am. J. 1993, 57, 200–210. [Google Scholar] [CrossRef]
- Ogle, S.M.F.; Breidt, Y.; Easter, M.; Williams, S.; Killian, K.; Paustian, K. Scale and uncertainty in modeled soil organic carbon stock changes for US croplands using a process--based model. Glob. Change Biol. 2010, 16, 810–822. [Google Scholar] [CrossRef]
- Wilhelm, W.W.; Johnson, J.M.F.; Hatfield, J.L.; Voorhees, W.B.; Linden, D.R. Crop and Soil Productivity Response to Corn Residue Removal. Agron. J. 2004, 96, 1–17. [Google Scholar] [CrossRef]
- Poyda, A.; Levin, K.S.; Hülsbergen, K.-J.; Auerswald, K. Perennial Crops Can Compensate for Low Soil Carbon Inputs from Maize in Ley-Arable Systems. Plants 2022, 12, 29. [Google Scholar] [CrossRef]
- Richter, F.J.; Suter, M.; Lüscher, A.; Buchmann, N.; El Benni, N.; Feola Conz, R.; Hartmann, M.; Jan, P.; Klaus, V.H. Effects of management practices on the ecosystem-service multifunctionality of temperate grasslands. Nat. Commun. 2024, 15, 3829. [Google Scholar] [CrossRef] [PubMed]
- Senapati, N.; Chabbi, A.; Gastal, F.; Smith, P.; Mascher, N.; Loubet, B.; Cellier, P.; Naisse, C. Net carbon storage measured in a mowed and grazed temperate sown grassland shows potential for carbon sequestration under grazed system. Carbon Manag. 2014, 5, 131–144. [Google Scholar] [CrossRef]
- Jaksic, V.; Kiely, G.; Albertson, J.; Oren, R.; Katul, G.; Leahy, P.; Byrne, K.A. Net ecosystem exchange of grassland in contrasting wet and dry years. Agric. For. Meteorol. 2006, 139, 323–334. [Google Scholar] [CrossRef]
- Janssens, I.A.; Freibauer, A.; Ciais, P.; Smith, P.; Nabuurs, G.-J.; Folberth, G.; Schlamadinger, B.; Hutjes, R.W.A.; Ceulemans, R.; Schulze, E.-D.; et al. Europe’s terrestrial biosphere absorbs 7 to 12% of European anthropogenic CO2 emissions. Science 2003, 300, 1538–1542. [Google Scholar] [CrossRef]
- Ciais, P.; Soussana, J.F.; Vuichad, N.; Luyssaert, S.; Don, A.; Janssens, I.A.; Piao, S.L.; Dechow, R.; Lathière, J.; Maignan, F.; et al. The greenhouse gas balance of European grasslands. Biogeosci. Discuss. 2010, 7, 5997–6050. [Google Scholar] [CrossRef]
- Yang, X.; Xiong, J.; Du, T.; Ju, X.; Gan, Y.; Li, S.; Xia, L.; Shen, Y.; Pacenka, S.; Steenhuis, T.S.; et al. Diversifying crop rotation increases food production, reduces net greenhouse gas emissions and improves soil health. Nat. Commun. 2024, 15, 198. [Google Scholar] [CrossRef]
- Abdalla, K.; Sun, Y.; Zarebanadkouki, M.; Gaiser, T.; Seidel, S.; Pausch, J. Long-term continuous farmyard manure application increases soil carbon when combined with mineral fertilizers due to lower priming effects. Geoderma 2022, 428, 116216. [Google Scholar] [CrossRef]
- Joona, J.; Liski, E.; Kahiluoto, H. Manure increases soil organic carbon most when allocated to annual cropping. Catena 2024, 238, 107844. [Google Scholar] [CrossRef]
- Gan, Y.; Liang, C.; Chai, Q.; Lemke, R.L.; Campbell, C.A.; Zentner, R.P. Improving farming practices reduces the carbon footprint of spring wheat production. Nat. Commun. 2014, 5, 5012. [Google Scholar] [CrossRef]
- Gan, Y.; Liang, C.; Campbell, C.A.; Zentner, R.P.; Lemke, R.L.; Wang, H.; Yang, C. Carbon footprint of spring wheat in response to fallow frequency and soil carbon changes over 25 years on the semiarid Canadian prairie. Eur. J. Agron. 2012, 43, 175–184. [Google Scholar] [CrossRef]
- Liebig, M.A.; Saliendra, N.Z.; Archer, D.W. Carbon fluxes from a spring wheat–corn–soybean crop rotation under no-tillage management. Agrosyst. Geosci. Environ. 2022, 5, e20291. [Google Scholar] [CrossRef]
- Belfry, K.D.; Van Eerd, L.L. Establishment and Impact of Cover Crops Intersown into Corn. Crop Sci. 2016, 56, 1245–1256. [Google Scholar] [CrossRef]
- Baker, J.M.; Griffis, T.J. Examining strategies to improve the carbon balance of corn/soybean agriculture using eddy covariance and mass balance techniques. Agric. For. Meteorol. 2005, 128, 163–177. [Google Scholar] [CrossRef]
- Verma, S.B.; Dobermann, A.; Cassman, K.G.; Walters, D.T.; Knops, J.M.; Arkebauer, T.J.; Suyker, A.E.; Burba, G.G.; Amos, B.; Yang, H.; et al. Annual carbon dioxide exchange in irrigated and rainfed maize-based agroecosystems. Agric. For. Meteorol. 2005, 131, 77–96. [Google Scholar] [CrossRef]
- Schreiner-McGraw, A.P.; Ransom, C.J.; Veum, K.S.; Wood, J.D.; Sudduth, K.A.; Abendroth, L.J. Quantifying the impact of climate smart agricultural practices on soil carbon storage relative to conventional management. Agric. For. Meteorol. 2024, 344, 109812. [Google Scholar] [CrossRef]
- Ceschia, E.; Béziat, P.; Dejoux, J.F.; Aubinet, M.; Bernhofer, C.; Bodson, B.; Buchmann, N.; Carrara, A.; Cellier, P.; Di Tommasi, P.; et al. Management effects on net ecosystem carbon and GHG budgets at European crop sites. Agric. Ecosyst. Environ. 2010, 139, 363–383. [Google Scholar] [CrossRef]
- Bolinder, M.A.; Crotty, F.; Elsen, A.; Frac, M.; Kismányoky, T.; Lipiec, J.; Tits, M.; Tóth, Z.; Kätterer, T. The effect of crop residues, cover crops, manures and nitrogen fertilization on soil organic carbon changes in agroecosystems: A synthesis of reviews. Mitig. Adapt. Strateg. Glob. Change 2020, 25, 929–952. [Google Scholar] [CrossRef]
- Koishi, A.; Bragazza, L.; Maltas, A.; Guillaume, T.; Sinaj, S. Long-Term Effects of Organic Amendments on Soil Organic Matter Quantity and Quality in Conventional Cropping Systems in Switzerland. Agronomy 2020, 10, 1977. [Google Scholar] [CrossRef]
- Liang, C.; Hao, X.; Schoenau, J.; Ma, B.-L.; Zhang, T.; MacDonald, J.D.; Chantigny, M.; Dyck, M.; Smith, W.N.; Malhi, S.S.; et al. Manure-induced carbon retention measured from long-term field studies in Canada. Agric. Ecosyst. Environ. 2021, 321, 107619. [Google Scholar] [CrossRef]
Disclaimer/Publisher’s Note: The statements, opinions and data contained in all publications are solely those of the individual author(s) and contributor(s) and not of MDPI and/or the editor(s). MDPI and/or the editor(s) disclaim responsibility for any injury to people or property resulting from any ideas, methods, instructions or products referred to in the content. |
© 2025 by the authors. Licensee MDPI, Basel, Switzerland. This article is an open access article distributed under the terms and conditions of the Creative Commons Attribution (CC BY) license (https://creativecommons.org/licenses/by/4.0/).