Article

Spatiotemporal Dynamics of Forest Fire Risk in Southeastern China Under Climate Change: Hydrothermal Drivers and Future Projections

1
Forest and Grassland Fire Prevention and Control Research Center, China Fire and Rescue Institute, Beijing 102202, China
2
Key Laboratory of Forest and Grassland Fire Risk Prevention, Ministry of Emergency Management, Beijing 102202, China
3
Department of Fire Engineering, China Fire and Rescue Institute, Beijing 102202, China
*
Authors to whom correspondence should be addressed.
Atmosphere 2025, 16(10), 1189; https://doi.org/10.3390/atmos16101189
Submission received: 26 August 2025 / Revised: 4 October 2025 / Accepted: 14 October 2025 / Published: 15 October 2025
(This article belongs to the Section Climatology)

Abstract

Forest fire regimes are undergoing systematic reorganization under climate change, particularly in monsoon–human coupled ecosystems such as Southeastern China, where risk dynamics remain poorly quantified. This study proposes a meteorology-driven machine learning model designed to assess long-term forest fire risk. Using kernel density estimation and standard deviational ellipse analysis, we assessed the spatiotemporal patterns of fire risk during the observational period and their future shifts across the SSP1-2.6 and SSP5-8.5 scenarios. The results indicate a significant overall decline in fire frequency from 2008 to 2024 (−467.3 fires/year, representing an annual average reduction of 10.8%, p < 0.001), which is attributed primarily to enhanced regional fire prevention and control measures, yet with a notable reversal after 2016 in Guangdong and Fujian. Fires are highly seasonal, with 74% occurring in the dry season (December–March). The meteorologically driven random forest model exhibited excellent performance (R2 = 0.889), validating meteorological conditions as key drivers of regional fire dynamics. It is projected that intensified warming (+5.5 °C under SSP5-8.5) and increased precipitation variability (+23%) are likely to drive pronounced northward and inland migration in high-risk zones. Our projections indicate that by the end of the century, high-risk area coverage could expand to 19.2%, with a shift from diffuse to clustered patterns, particularly in Jiangsu and Zhejiang. These findings underscore the critical role of hydrothermal reconfiguration in reshaping fire risk geography and highlight the need for dynamic, region-specific fire management strategies in response to compound climate risks.

1. Introduction

In recent years, anthropogenic climate change has been increasing the frequency of extreme forest fires globally [1]. As one of the most intense ecological disturbances, wildfires are reshaping the terrestrial carbon cycle [2], biodiversity [3], and human security landscapes [4], posing major challenges to the stability of ecosystems and the safety of human life and property. Thus, wildfires have attracted extensive attention from academics and the public. Empirical studies of regional wildfire frequency [5] and global-scale analyses of fire risk trends [6] have revealed that warmer temperatures significantly increase the risk of extreme fires by altering drought conditions and fuel moisture [7]. Southeastern China represents a quintessential coupled monsoon–human system featuring globally significant population density, economic activity, and complex forest–agriculture mosaics within its latitudinal band [8]. Consequently, its fire risk profile is undergoing profound reconfiguration under the combined pressures of global warming and intensified human activities. However, research and management focused on forest fires in China has focused predominantly on high-incidence regions in Northeast China and Southwest China [9]. Yet recent studies suggest that Southeastern China is experiencing an increasing trend in fire weather conditions and ignition probabilities under climate scenarios [10], indicating that the perceived “low” risk may be misleading. This perception masks and ignores the potential amplification effects of climate change on hydrothermal conditions, vegetation flammability, and spatial and temporal risk migration. Therefore, investigating the dynamic patterns of forest fire risk in this region under climate change holds significant academic and practical importance.
Wildfire occurrence is driven by a combination of factors, including fire weather conditions, fuel availability and characteristics, and the presence of ignition sources [11,12,13,14]. In addition, climate change-driven declines in fuel moisture and human-induced land use/cover changes have led to increasing frequencies and intensities of wildfires globally [15,16]. Therefore, understanding and predicting future wildfire risk patterns, especially under changing climatic conditions, is critical for minimizing potential fire risk. Although wildfire risk attribution and prediction are active fields in global change research, systematic fire risk studies focusing on the unique geographical context of Southeastern China remain notably lacking. The internationally established Canadian fire weather index (FWI) effectively captures meteorological influences on fire risk [17] and performs well in northeastern and southwestern China [18,19]. However, it has limited applicability in Southeastern China [20]. The FWI system was originally developed and calibrated for boreal forests (e.g., Jack Pine and Lodge Pole Pine) in Canada [21,22], which differ substantially from the subtropical monsoon climate and evergreen broadleaved forests of Southeastern China. These differences in climate and fuel types can lead to misestimation of fuel moisture dynamics and fire potential in the region [23]. On the other hand, several studies in China have examined nationwide trends in fire frequency and burned area [24,25], and the spatial migration of high-risk areas and their driving mechanisms in Southeastern China have not been sufficiently explored. In particular, no clear conclusions have been drawn on key issues, such as how nonlinear changes in hydrothermal conditions reshape the spatial and temporal patterns of fire risk under climate change scenarios and the potential impacts of monsoon fluctuations on the dry season fire risk period. These gaps in research make it difficult to formulate regional fire prevention and control strategies without precise scientific support and to cope with extreme fire threats that may intensify in the future.
This study employs a “data–model–scenario” framework, integrating multisource satellite, meteorological, and climate projection data with machine learning and spatial analysis to systematically address three key research questions: (1) What are the spatiotemporal distribution characteristics of forest fires in Southeastern China? (2) How are hydrothermal conditions projected to evolve under climate change? (3) What are the future migration trends of high-risk areas?” These findings advance our understanding of the dynamics of forest fires and hydrothermal conditions in Southeastern China and provide a scientific foundation for developing differentiated forest fire prevention and control strategies.

2. Materials and Methods

2.1. Study Area

This study focuses on Southeastern China (Figure 1), which encompasses South Central China (primarily Henan, Hubei, Hunan, Guangxi, Guangdong, Hainan Provinces) and East China (primarily Shandong, Jiangsu, Anhui, Zhejiang, Jiangxi, Fujian Provinces). Data were unavailable for Shanghai, Hong Kong, Macau, and Taiwan. This region lies within a typical tropical and subtropical monsoon climate zone, with average annual temperatures ranging from 16.3 to 25.7 °C and abundant but unevenly distributed annual precipitation. The topography of the area is dominated by low hills, and the typical vegetation is subtropical evergreen broad-leaved forest and mixed coniferous and broad-leaved forest. Moreover, as one of the most densely populated, economically active, and highly urbanized areas in China, human activities are highly intertwined with natural ecosystems, and significant monsoon climate fluctuations are superimposed, which makes the area a typical environmental carrier for nurturing and increasing the risk of forest fires against the background of climate change.

2.2. Data Source

The satellite monitoring data of forest fires (2008–2024) were obtained from the National Forest and Grassland Fire Prevention and Suppression Information Sharing Platform (https://slcygxpt.slcyfh.mem.gov.cn/ (accessed on 11 June 2025)). Satellite fire detection information includes the date and time of fire occurrence, longitude and latitude, number of pixels, continuity, land type, and feedback information. These data represent ground-verified fire monitoring records, and their reliability has been established in previous studies [8,24].
Meteorological data (mean temperature, relative humidity, mean wind speed, and precipitation) for constructing the fire prediction model were sourced from national ground observation stations (http://data.cma.cn/ (accessed on 11 June 2025)). Only stations with ≤5% missing data were selected for any variable during the study period. The selected stations were subjected to outlier detection and missing value imputation. In this study, a bilinear interpolation algorithm [26] was used to uniformly resample the predictor variables to a 1 km resolution to ensure spatial and temporal consistency.
This study assesses the impact of climate change on future forest fire potential in Southeastern China via CMIP6 climate model data (https://esgf-node.ipsl.upmc.fr/search/cmip6-ipsl (accessed on 15 June 2024)). We employ two contrasting shared socioeconomic pathway (SSP) scenarios that exhibit the greatest divergence: the sustainable development pathway SSP1-2.6, characterized by declining CO2 emissions beginning in approximately 2020 and achieving net-zero emissions by 2100, and the fossil-fueled development pathway SSP5-8.5, which represents continued high greenhouse gas emissions throughout the 21st century and closely aligns with current trajectories [27]. The historical period 1985–2014 serves as the baseline. Projected changes are evaluated for the mid-21st century (2021–2050) and the end-21st century (2071–2100). To increase reliability and mitigate the parametric and structural uncertainties inherent in individual models [28], a multi-model ensemble mean (MME) approach is applied [25]. The ensemble incorporates four models—CanESM5, CMCC-CM2-SR5, EC-Earth3, and EC-Earth3-Veg-LR—selected on the basis of their established performance over China, as reported in prior validation studies [29,30].

2.3. Risk Assessment

Considering the spatiotemporal unpredictability and stochastic distribution of fire occurrence [31,32] and building upon the fire risk concept of [33], we define forest fire risk as the probability weight of fire occurrence for a given grid cell under specific driving factor combinations. This probability weight was quantified via kernel density estimation (KDE) to represent the risk index [34,35]. It is defined as:
λ b ( s ) = 1 c b ( s ) i = 1 n k i b ( s s i )
where s i , …, s n represent the locations of n observed fire events (or attribute points); λ b ( s ) represents the estimated spatial density (fire risk index) at location s ; k i b represents the kernel function value; and c b represents the edge correction factor at s .
To ensure spatial consistency, a regular grid (0.1° × 0.1° resolution; 8372 cells) was overlaid on the study area, and all variables were resampled or aggregated to this grid. We implemented a random forest (RF) regression model to predict forest fire probability on the basis of meteorological drivers. By constructing a multitude of decision trees and outputting their mean prediction, the model robustly captures complex, nonlinear predictor-response relationships. Its inherent use of bagging and feature randomness provides strong protection against overfitting. We partitioned the data into a 70% training set and a 30% testing set, and conducted hyperparameter optimization via Bayesian search with fivefold cross-validation. Model performance was evaluated using four metrics: (1) the coefficient of determination (R2), which measures the proportion of variance explained; (2) the mean absolute error (MAE), which indicates overall prediction accuracy; (3) the root mean square error (RMSE), which reflects the magnitude of the prediction error; and (4) the concordance correlation coefficient (CCC), which reflects the agreement between the predicted and observed values [36,37,38].We conducted all the statistical analyses via R software version 4.2.2. The computational environment was consistently maintained throughout this study.

2.4. Statistical Analysis

To characterize the evolution of high forest fire risk zones, fire risk was classified on the basis of multiples of the standard deviation from the mean risk value [39,40]. The classification threshold (α) is calculated as:
α = x i x ¯ δ
where x i is the risk value at location i, x ¯ is the mean value, and δ is the standard deviation of the risk values. The risk levels were assigned as follows: high risk ( α > 1), moderate risk (0 < α ≤ 1), low risk (−1 < α ≤ 0), and no risk ( α ≤ −1).
Additionally, the standard deviational ellipse (SDE) method was employed to characterize the directional trends and spatial evolution of high-risk forest fire zones [41]. SDE quantifies the central tendency, dispersion (major and minor axes), and orientation of spatial distributions. The centroid coordinates are calculated as:
X ¯ = i = 1 n w i x i i = 1 n w i , Y ¯ = i = 1 n w i y j i = 1 n w j
where i is the grid cell, n is the total number of grid cells; w i is the weight of the ith grid cell, which represents different levels of forest fire risk values; X ¯ and Y ¯ are the coordinates of the center of gravity of the standard deviation ellipse.

3. Results

3.1. Characteristics of Forest Fires

Forest fire frequency across Southeastern China exhibited a highly significant declining trend (p < 0.001) from 2008 to 2024, decreasing at an average rate of 467.3 fires/year (an annual reduction of 10.8%) (Figure 2a). In terms of temporal distribution, the high incidence of fires in Southeastern China was mainly concentrated from 2008 to 2014 (>6500 fires per year) and then decreased significantly to 1574 in 2024. Regional analysis revealed South Central China as the primary fire occurrence area (Figure 2b), accounting for 63.2% (40,250 fires) of the regional total. Guangdong (13,170 fires), Guangxi (13,654 fires), and Hunan (9896 fires) were the fire hotspot provinces within this subregion. Fires in South Central China also declined significantly (p < 0.001) at a faster rate (−309.5 fires/year, annual reduction of 11.7%) than those in East China (−157.9 fires/year, annual reduction of 9.6%). This trend was further differentiated at the provincial scale: the core provinces in South Central China, such as Guangdong (−128.7 fires/a) and Hunan (−95.1 fires/a), presented the most significant decreases (p < 0.001).
Within East China, fires were predominantly concentrated in Fujian (9997 fires) and Jiangxi (9993 fires) Provinces (Figure 2c), contributing 85.2% of the subregional total. In contrast, Shandong and Jiangsu recorded fewer than 500 fires each. The significant downward trend in East China (p < 0.001) was driven primarily by Jiangxi (−71.3 fires/year, p < 0.001) and Fujian (−61.3 fires/year, p < 0.001). Notably, however, Guangdong and Fujian—the provinces with the highest fire frequencies in South Central China and East China, respectively—both showed significant declines from 2008 to 2016 (p < 0.01), followed by significant increases from 2016 onward (p < 0.01). Consequently, their combined contribution to the total number of fires in Southeastern China rose from 31.9% (2008–2016) to 52.8% (2016–2024). This countertrend increase in key provinces warrants attention despite the overall regional decline.
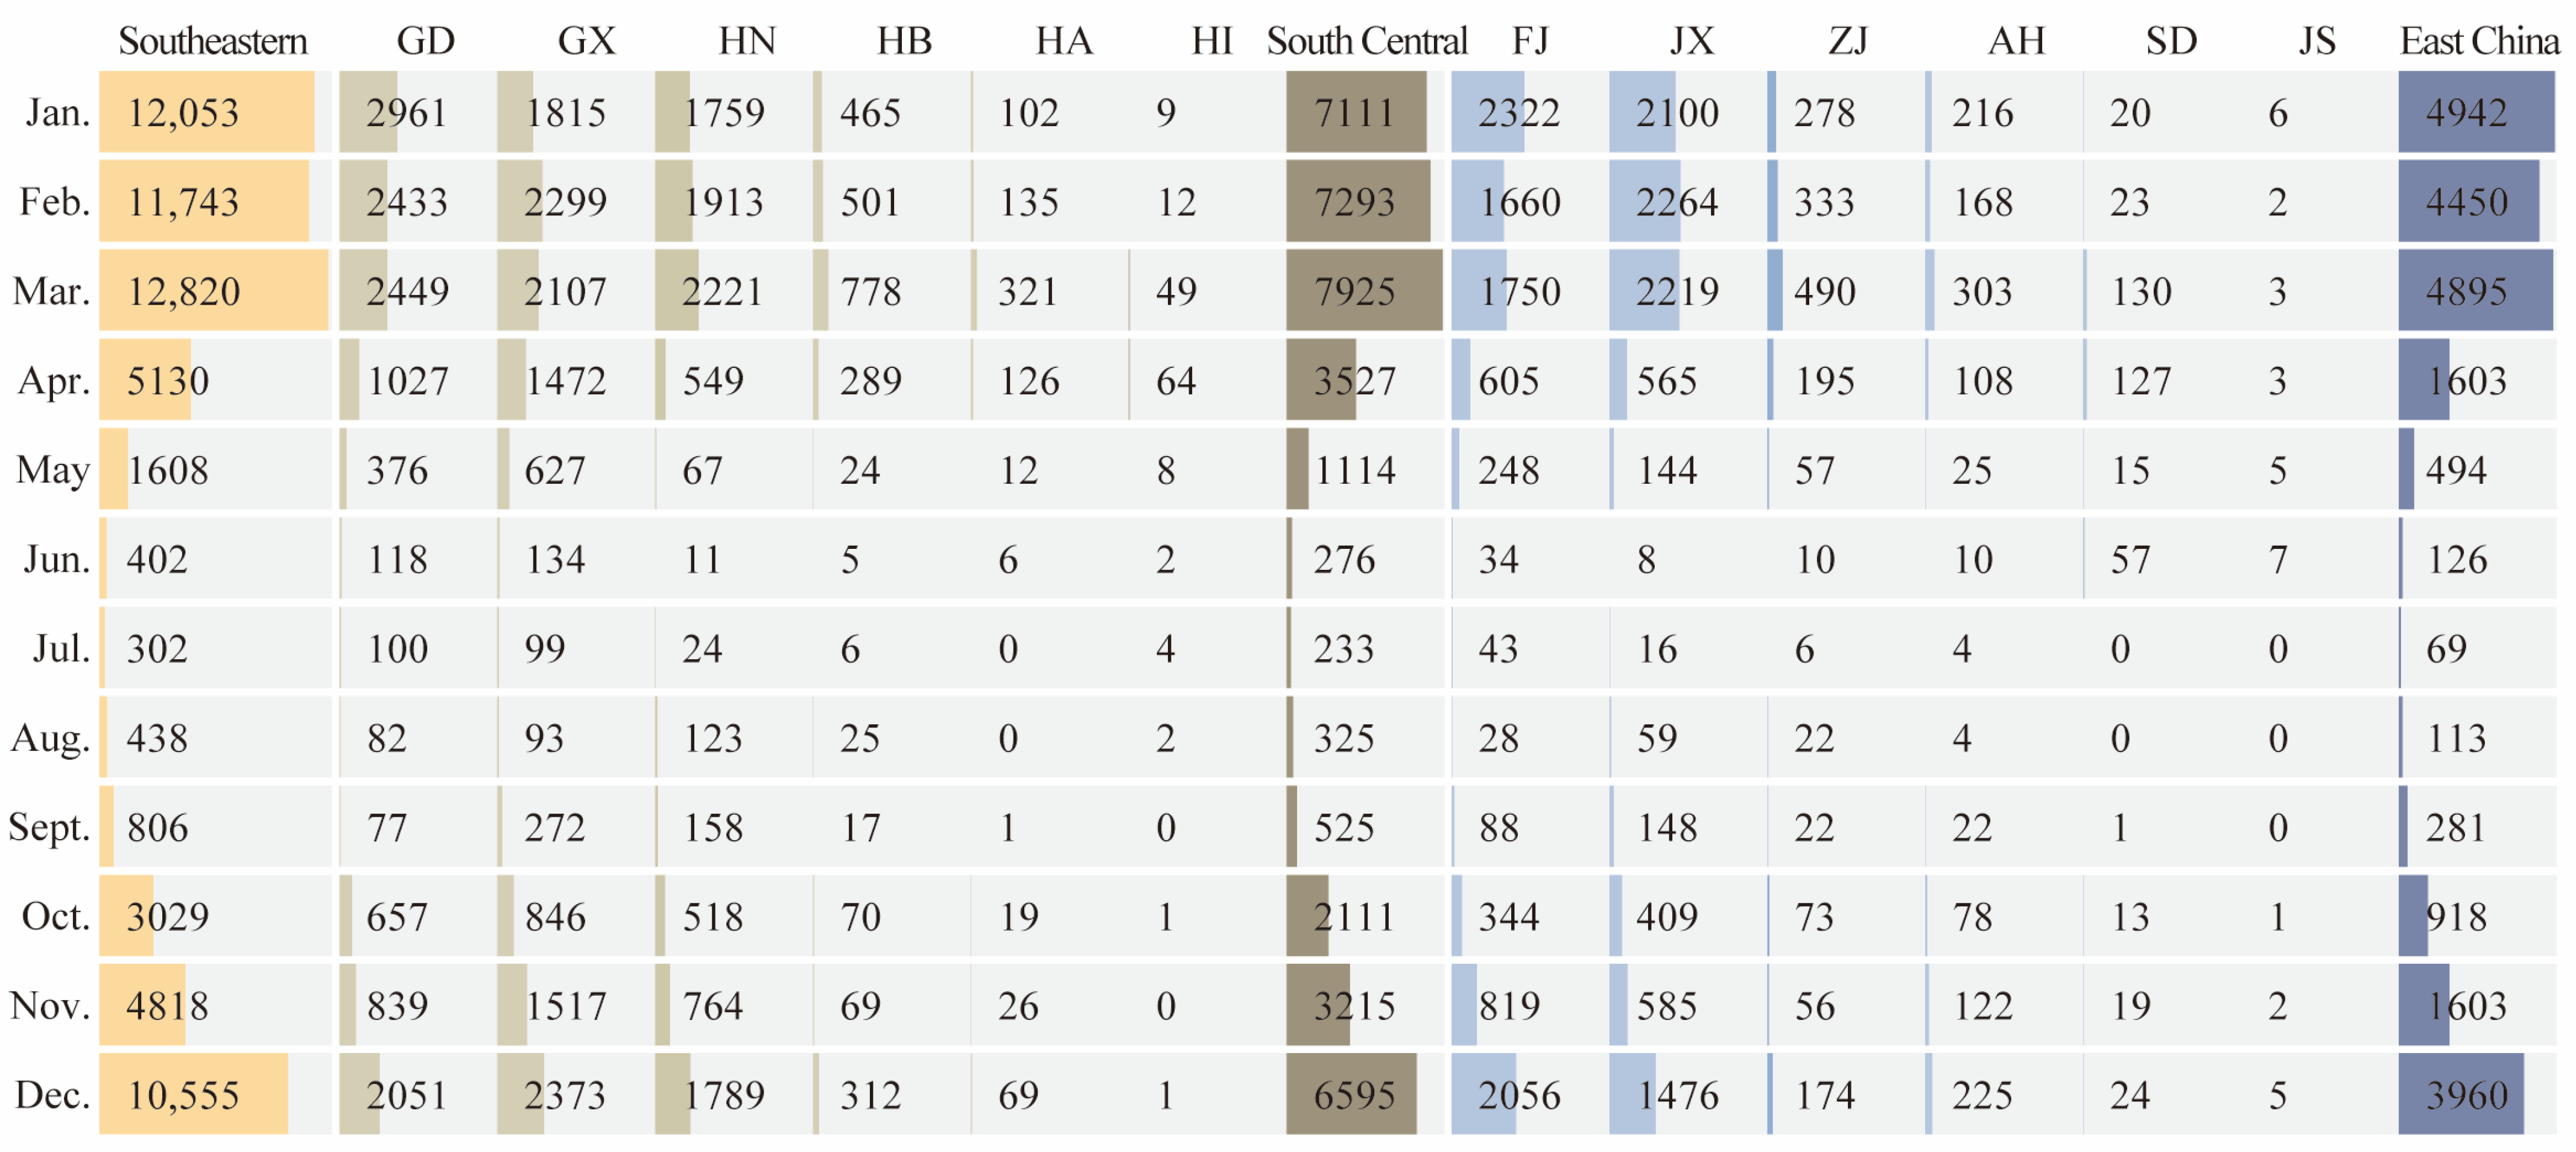
Forest fires in Southeastern China exhibited a pronounced unimodal seasonal distribution concentrated in the dry season (Figure 3), closely aligning with the monsoon-driven precipitation pattern. December to March accounted for 74.0% of the annual fires (47,171 fires), peaking sharply in January (12,053 fires). Fire occurrence was significantly suppressed during the rainy season (May–September) by abundant precipitation. Particularly low activity was observed from June to August, with a monthly average of only 172 fires (<1.4% of the January peak). Provincial-level seasonal patterns in both South Central and East China mirrored this regional unimodal distribution, which is characterized by high fires in the winter-spring dry season and low forest fires in the summer rainy season.

3.2. Evaluation of Machine Learning Methods

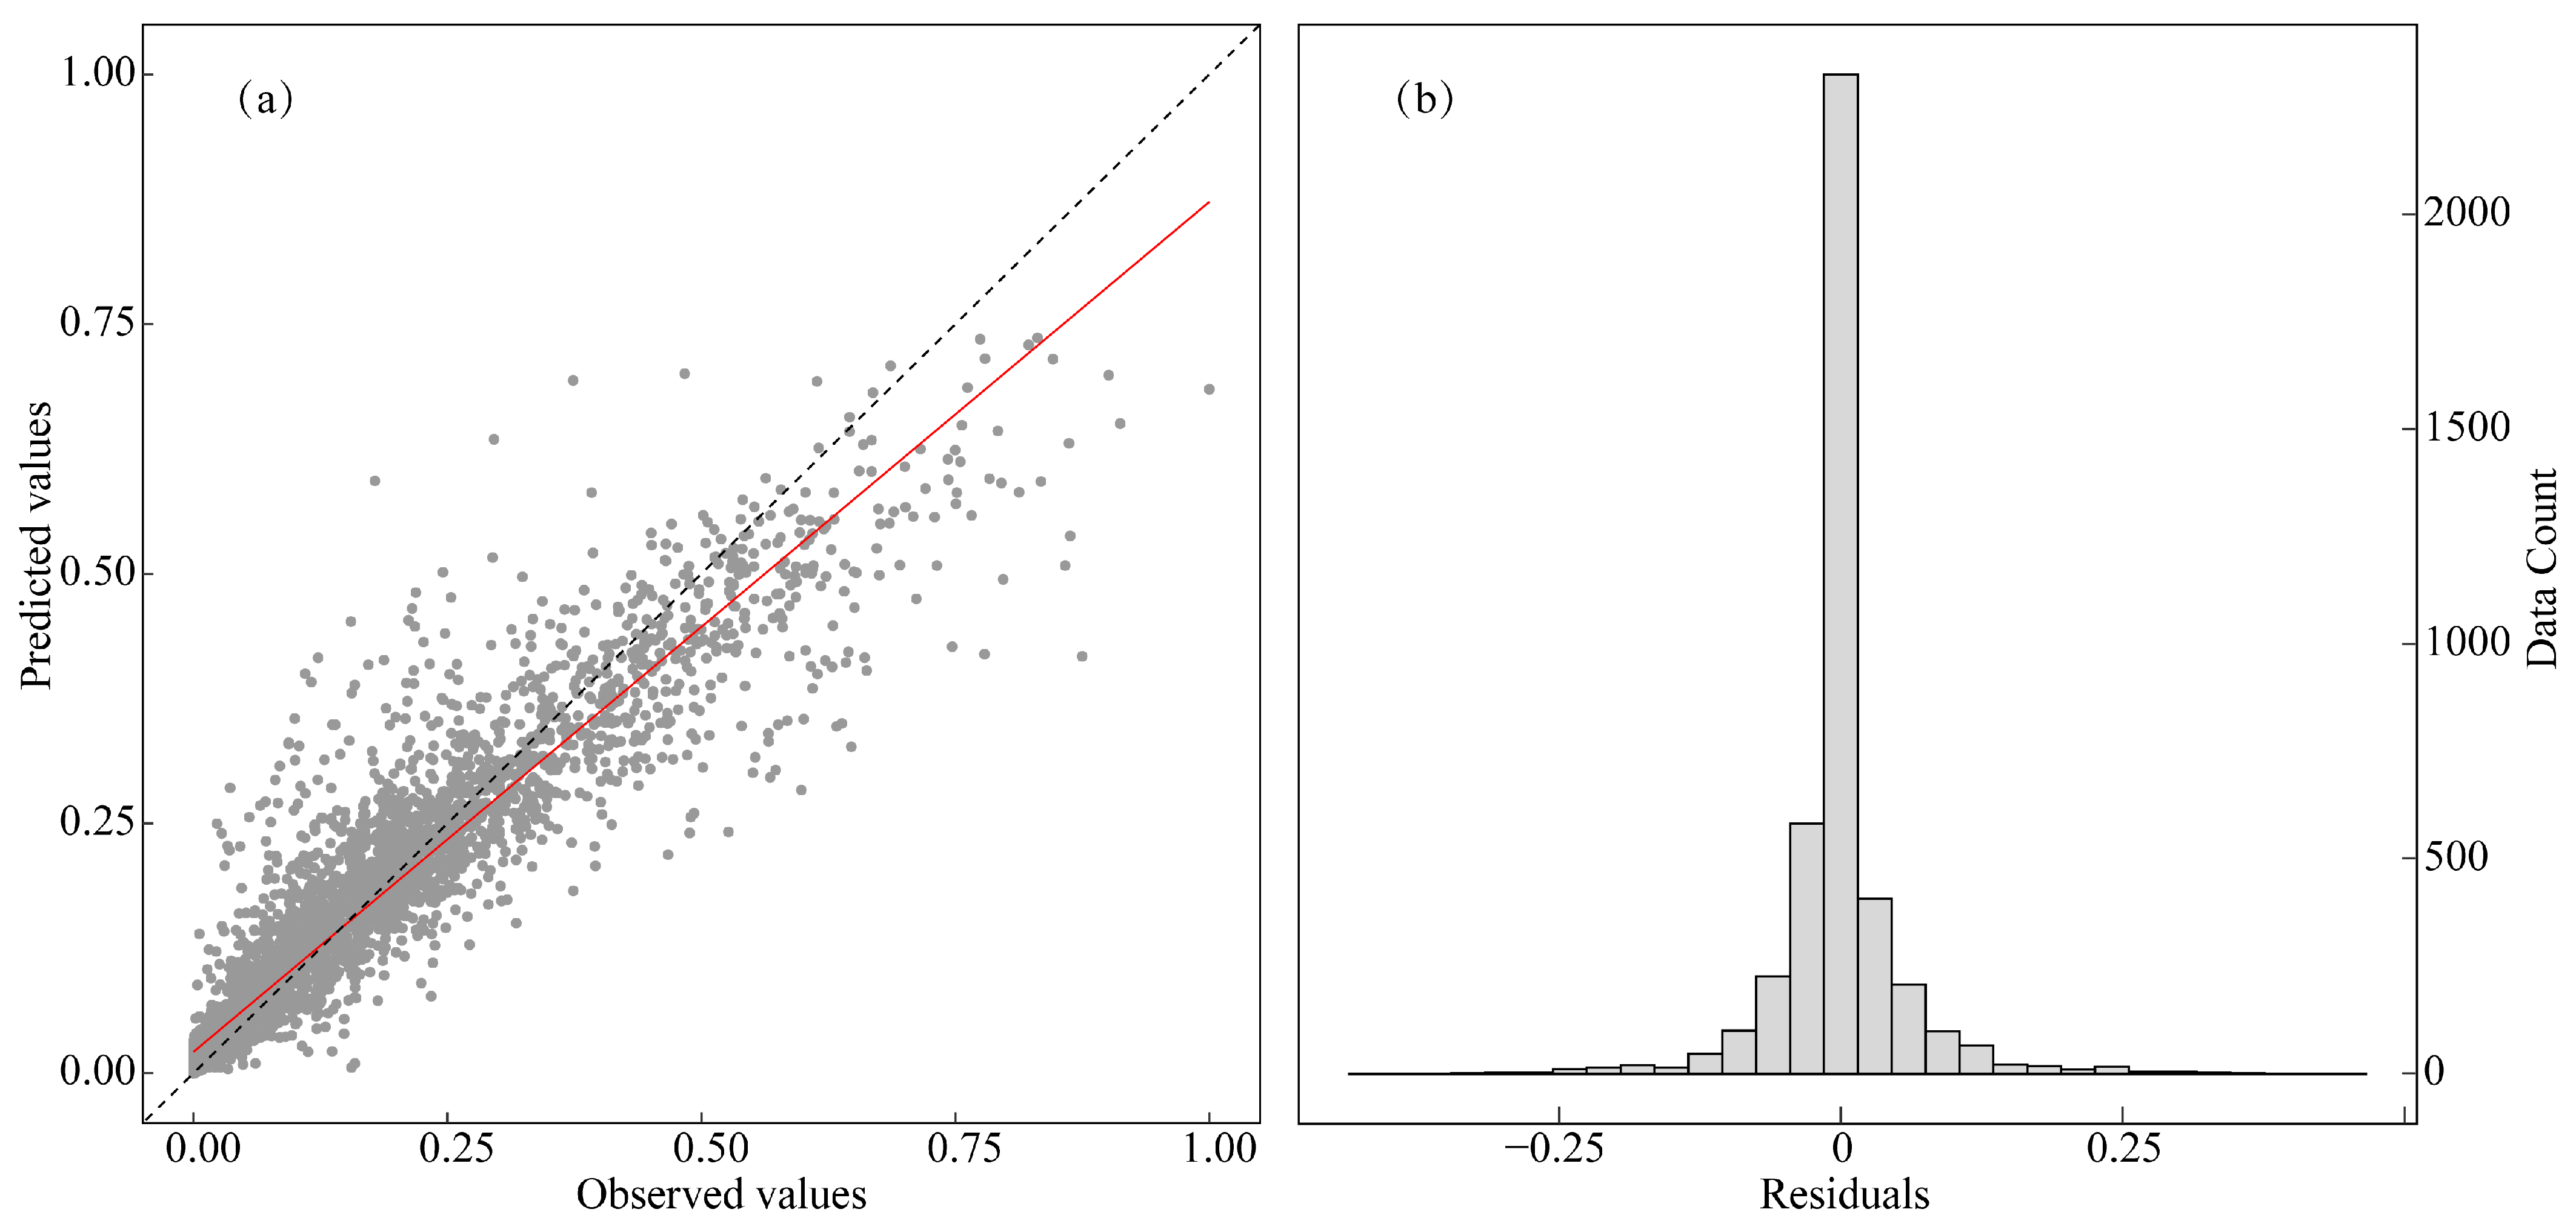
The meteorologically driven forest fire prediction model for Southeastern China demonstrated excellent performance. The model was evaluated using fivefold cross-validation, with consistent assessment metrics across folds (Table 1). The overall means were RMSE = 0.0564, MAE = 0.0316, R2 = 0.885, and CCC = 0.936. The low RMSE and MAE values (<0.06 and <0.032, respectively) indicate minimal prediction bias and high overall model accuracy. Concurrently high R2 and CCC values (both >0.885) suggest the model’s strong explanatory power for fire variability and high agreement between the predictions and observations. The narrow ranges of R2 (0.878–0.889) and CCC (0.932–0.938) across folds further support robust performance and generalizability. Figure 4a shows a scatter plot of the predicted versus observed fire risk values, illustrating a strong agreement between the two. The residuals were normally distributed with a mean approaching zero (Figure 4b), further indicating model reliability. These results collectively demonstrate the model’s suitability for assessing future forest fire potential in Southeastern China and highlight the key role of meteorological conditions in driving regional forest fire dynamics.

3.3. Changes in Hydrothermal Conditions

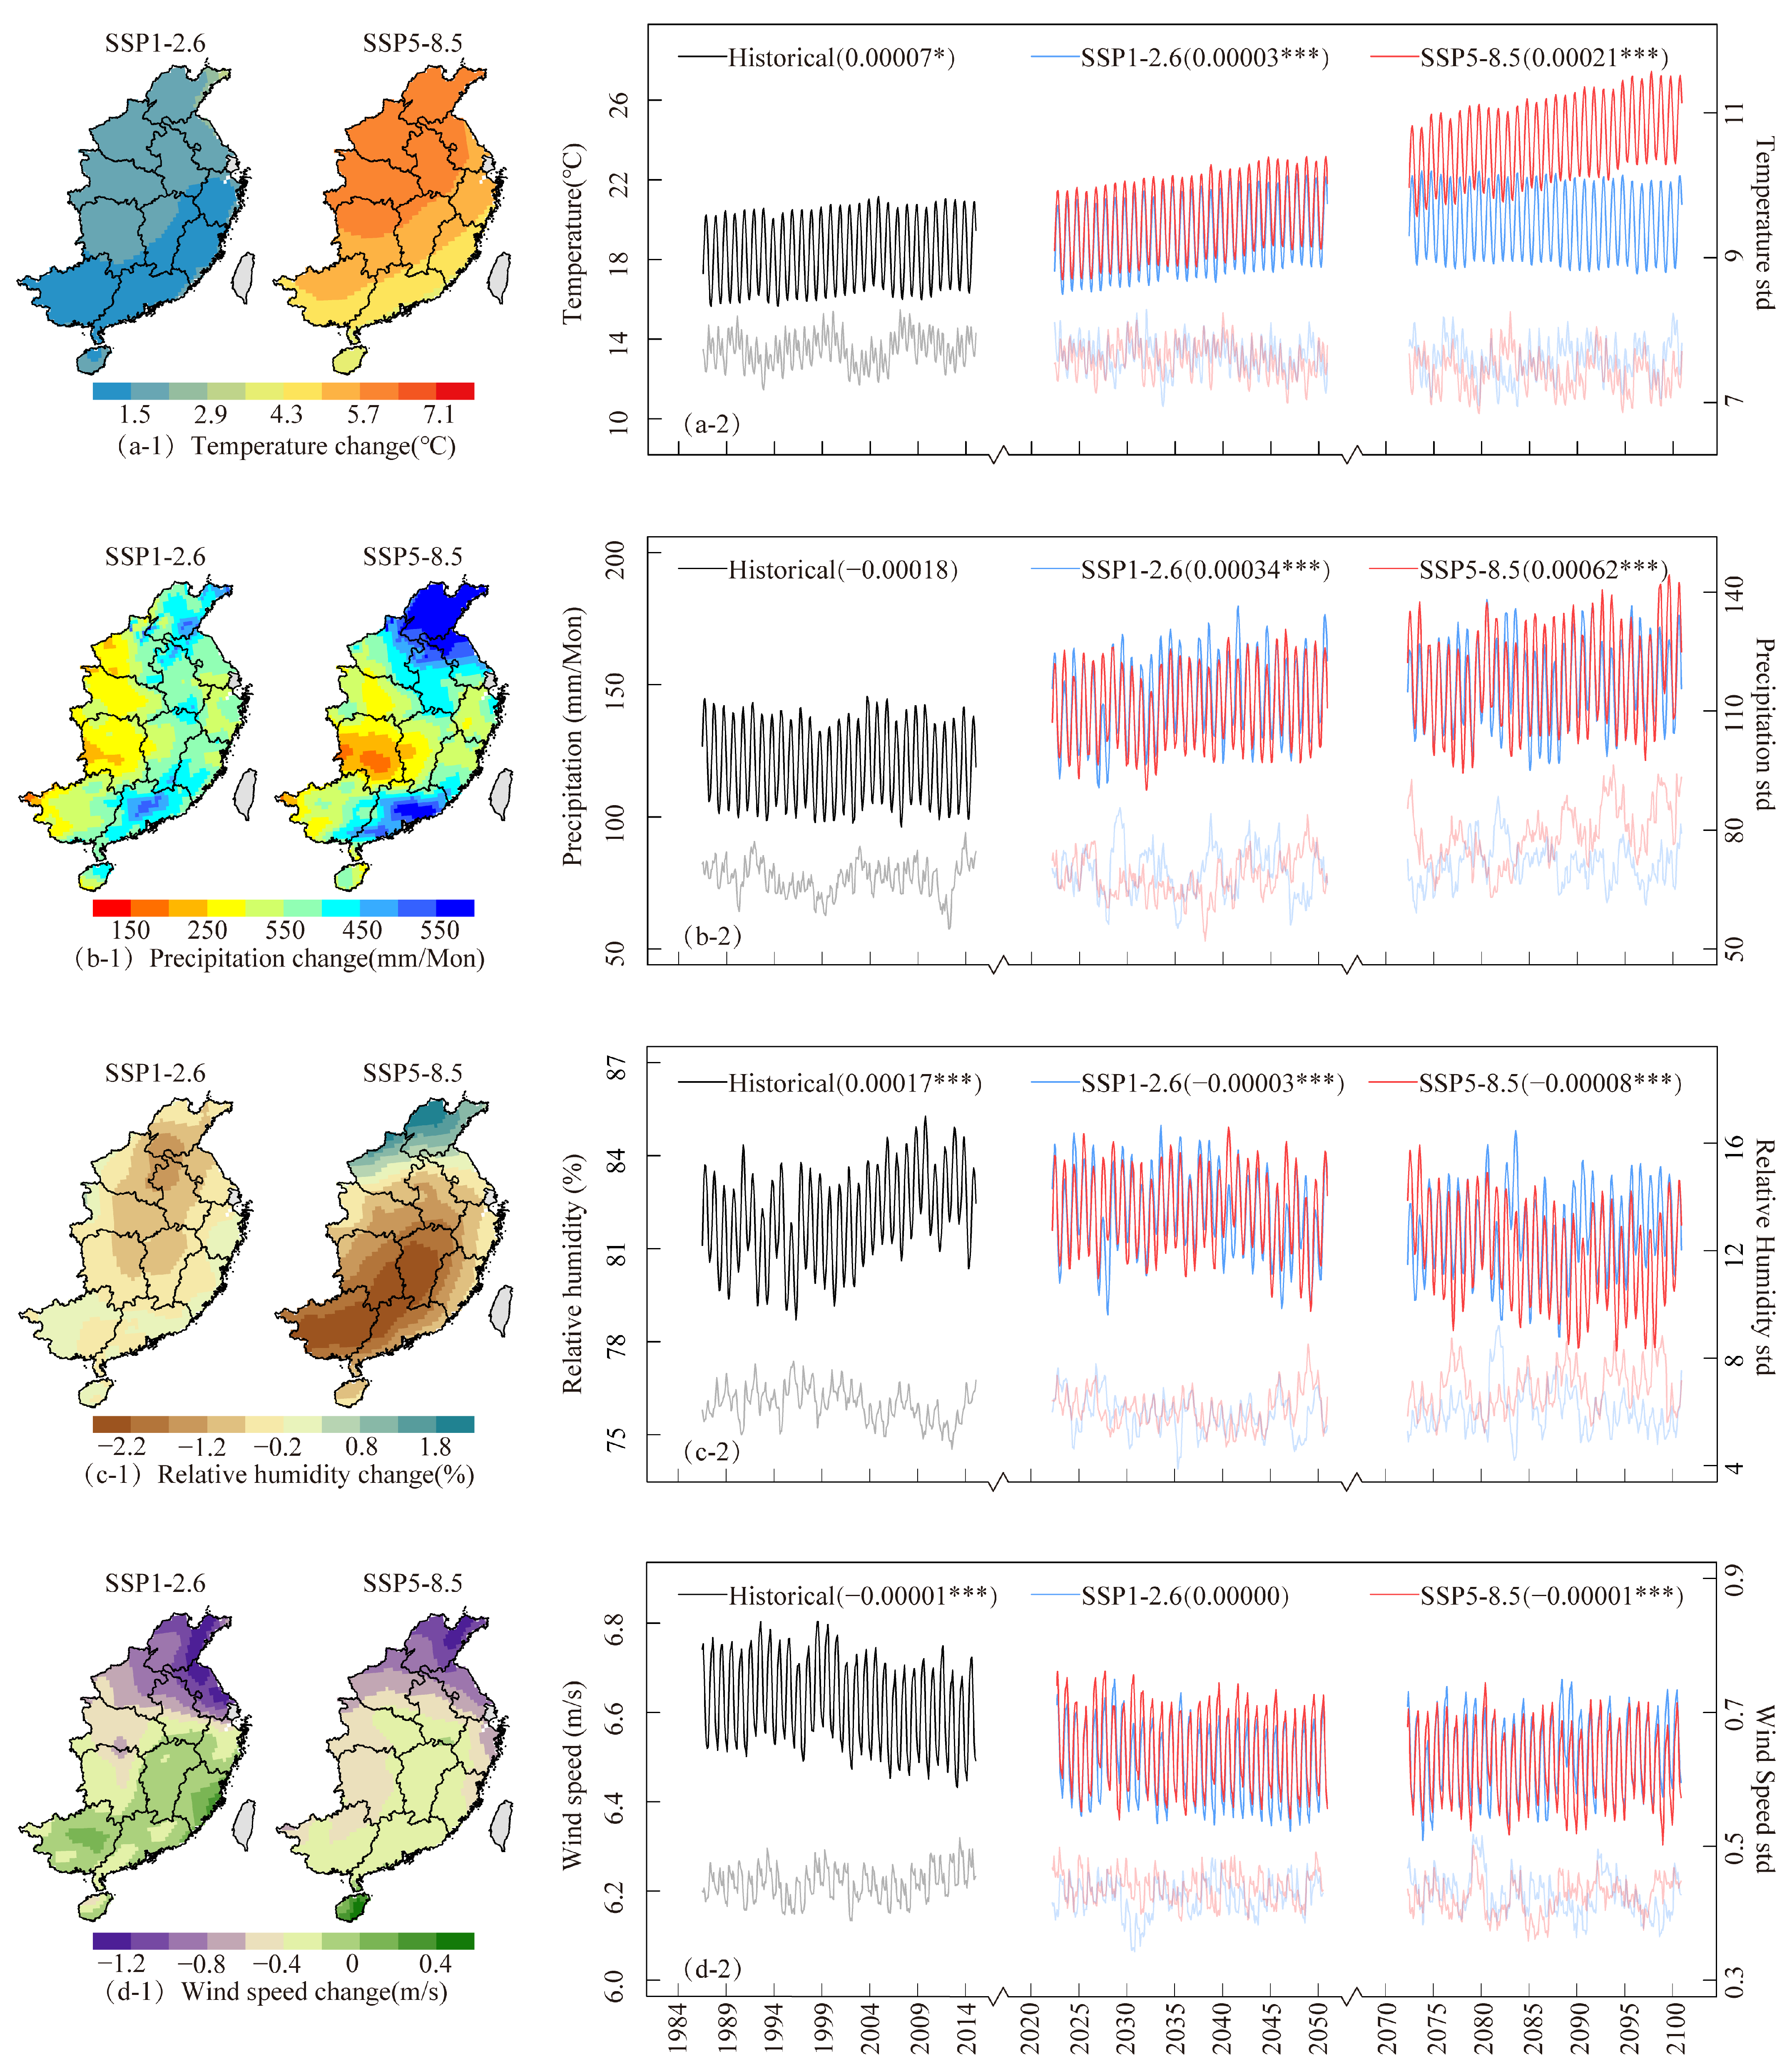
Figure 5 presents the projected spatiotemporal changes in hydrothermal conditions for Southeastern China under various climate change scenarios. To minimize the influence of data fluctuations, we calculated 18-month moving averages and standard deviations for each meteorological factor. Given the pronounced seasonality inherent in meteorological data, the 18-month moving average effectively dampens seasonal fluctuations, facilitating clearer identification of long-term trends and enhancing the stability of statistical analyses.
The historical baseline (1985–2014) mean temperature was 18.4 °C, exhibiting a significant upward trend (p < 0.05) attributable to global warming. According to our projections, temperatures are expected to increase highly significantly (p < 0.001) by the end-21st century (2071–2100) under both scenarios. Under SSP1-2.6, the mean temperature reaches 19.9 °C, whereas SSP5-8.5 leads to a more substantial increase to 23.9 °C, representing a warming of 5.5 °C. Warming was more pronounced in inland areas and at higher latitudes. Future precipitation across Southeastern China is also projected to show a highly significant increasing trend (p < 0.001), increasing from the historical baseline of 120.6 mm to 150.1 mm (SSP1-2.6) and 152.5 mm (SSP5-8.5). The difference in the increase in precipitation among the scenarios was relatively minor. Spatially, increases were significantly greater in coastal areas (e.g., Shandong and Fujian) than in inland areas. Temporally, the standard deviation of future precipitation is projected to increase by 23%, indicating amplified fluctuations between the wet and dry seasons.
The future relative humidity exhibited a significant decreasing trend (p < 0.001), although the magnitude of decrease was small (0.5–1.1%). The historical baseline mean was 82.1%, which decreased to 81.6% (SSP1-2.6) and 81.0% (SSP5-8.5). Spatially, the pattern of humidity decreases differed between the scenarios: SSP1-2.6 presented greater declines primarily in the north, whereas SSP5-8.5 presented stronger decreases concentrated in the south. The drivers of this spatial variability require further investigation. The changes in the wind speed were less pronounced than those in the other factors. The historical baseline mean was 6.62 m/s, decreasing slightly to 6.50 m/s (SSP1-2.6) and 6.49 m/s (SSP5-8.5). However, the spatial pattern of this reduction varied considerably, with the largest decreases (>1.28 m/s across scenarios) concentrated in northern Southeastern China by the end-21st century.

3.4. Projection of Forest Fire Potential

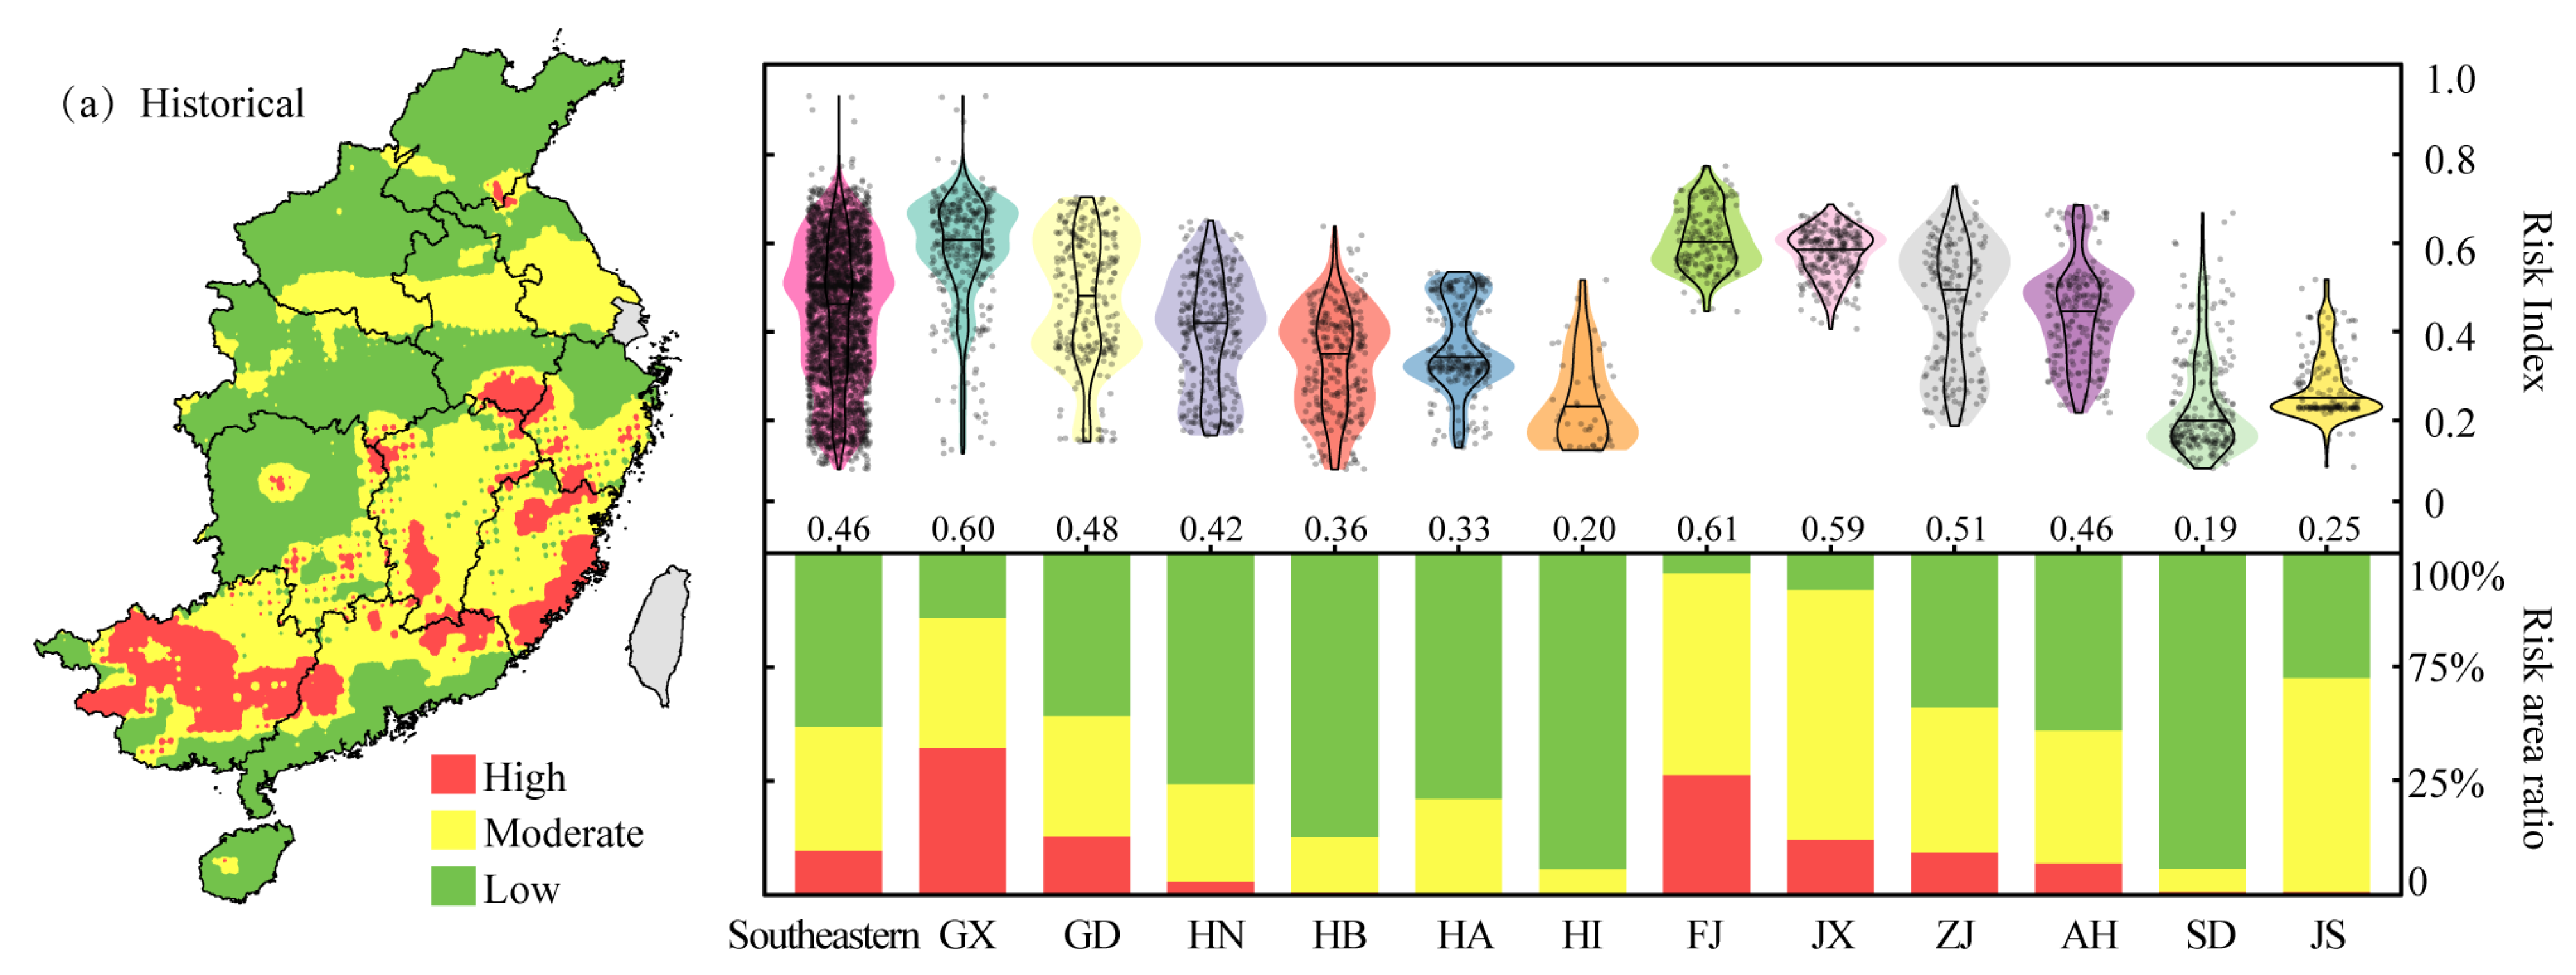
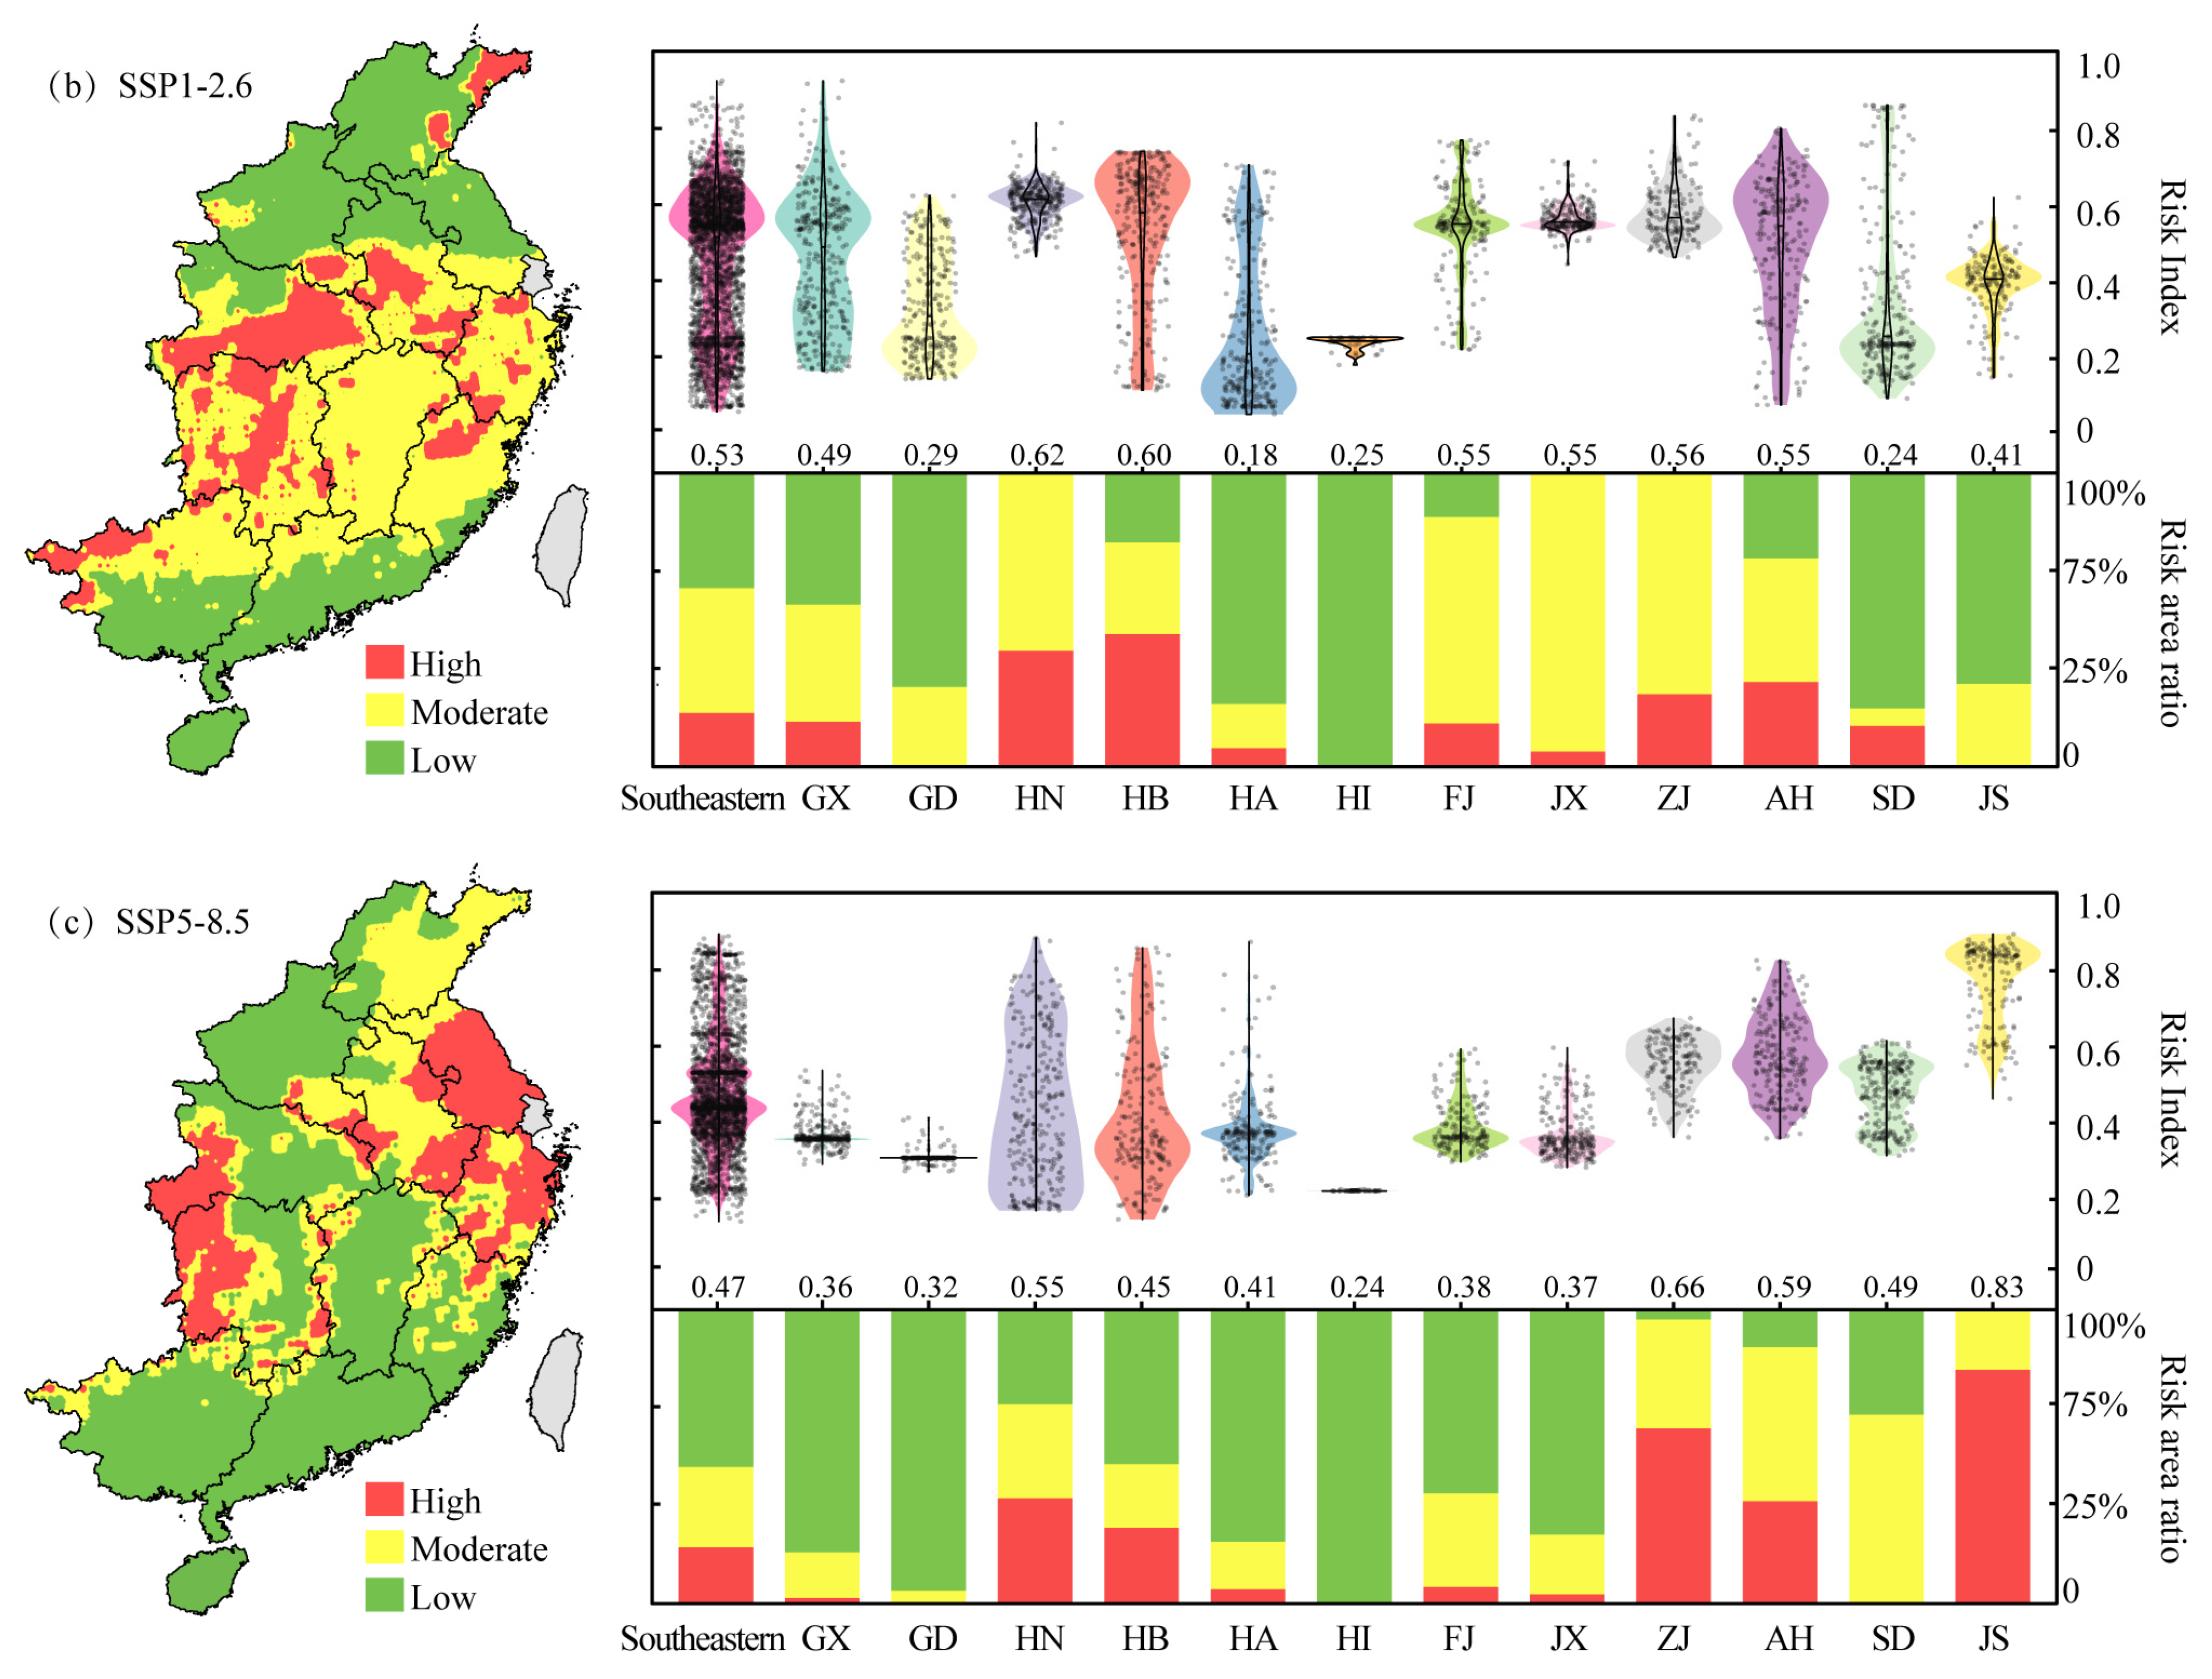
Multiple-scenario climate model projections (SSP1-2.6, SSP5-8.5) revealed significant spatiotemporal differences in forest fire risk across Southeastern China in response to climate change (Figure 6).
During the historical baseline, the risk pattern was predominantly low-to-moderate (Figure 6a), with high-risk areas accounting for only 12.9% of the total area. These factors were primarily concentrated in the southern coastal provinces of Guangxi (high-risk proportion: 43.0%, risk index: 0.60) and Fujian (35.0%, risk index: 0.61). In contrast, high-risk areas were scarce (<1%) in northern provinces such as Shandong, Henan, Hubei, and Jiangsu. Under SSP1-2.6 (Figure 6b), the median regional risk index increased to 0.53, accompanied by notable reorganization: high-risk area coverage is projected to rise to 18.3%, shifting inland to central provinces such as Hubei (risk index: 0.60) and Hunan (0.62), whereas it significantly decreases in Guangxi (0.49) and Fujian (0.55). The high-emission SSP5-8.5 scenario (Figure 6c) intensified this migration trend, with high-risk area coverage potentially increasing to 19.2%. Dramatic shifts occurred in specific provinces: Zhejiang’s low-risk area share plummeted from 45.2% (historical) to 3.4%, whereas its high-risk share surged to 59.6%. Similarly, Jiangsu’s high-risk proportion jumped from 0.8% to 79.5%, reaching a median maximum risk index of 0.83. Conversely, the share of the total study area’s low-risk zones located in Guangdong, Guangxi, and Jiangxi increased to 95.7%, 82.7%, and 76.6%, respectively.
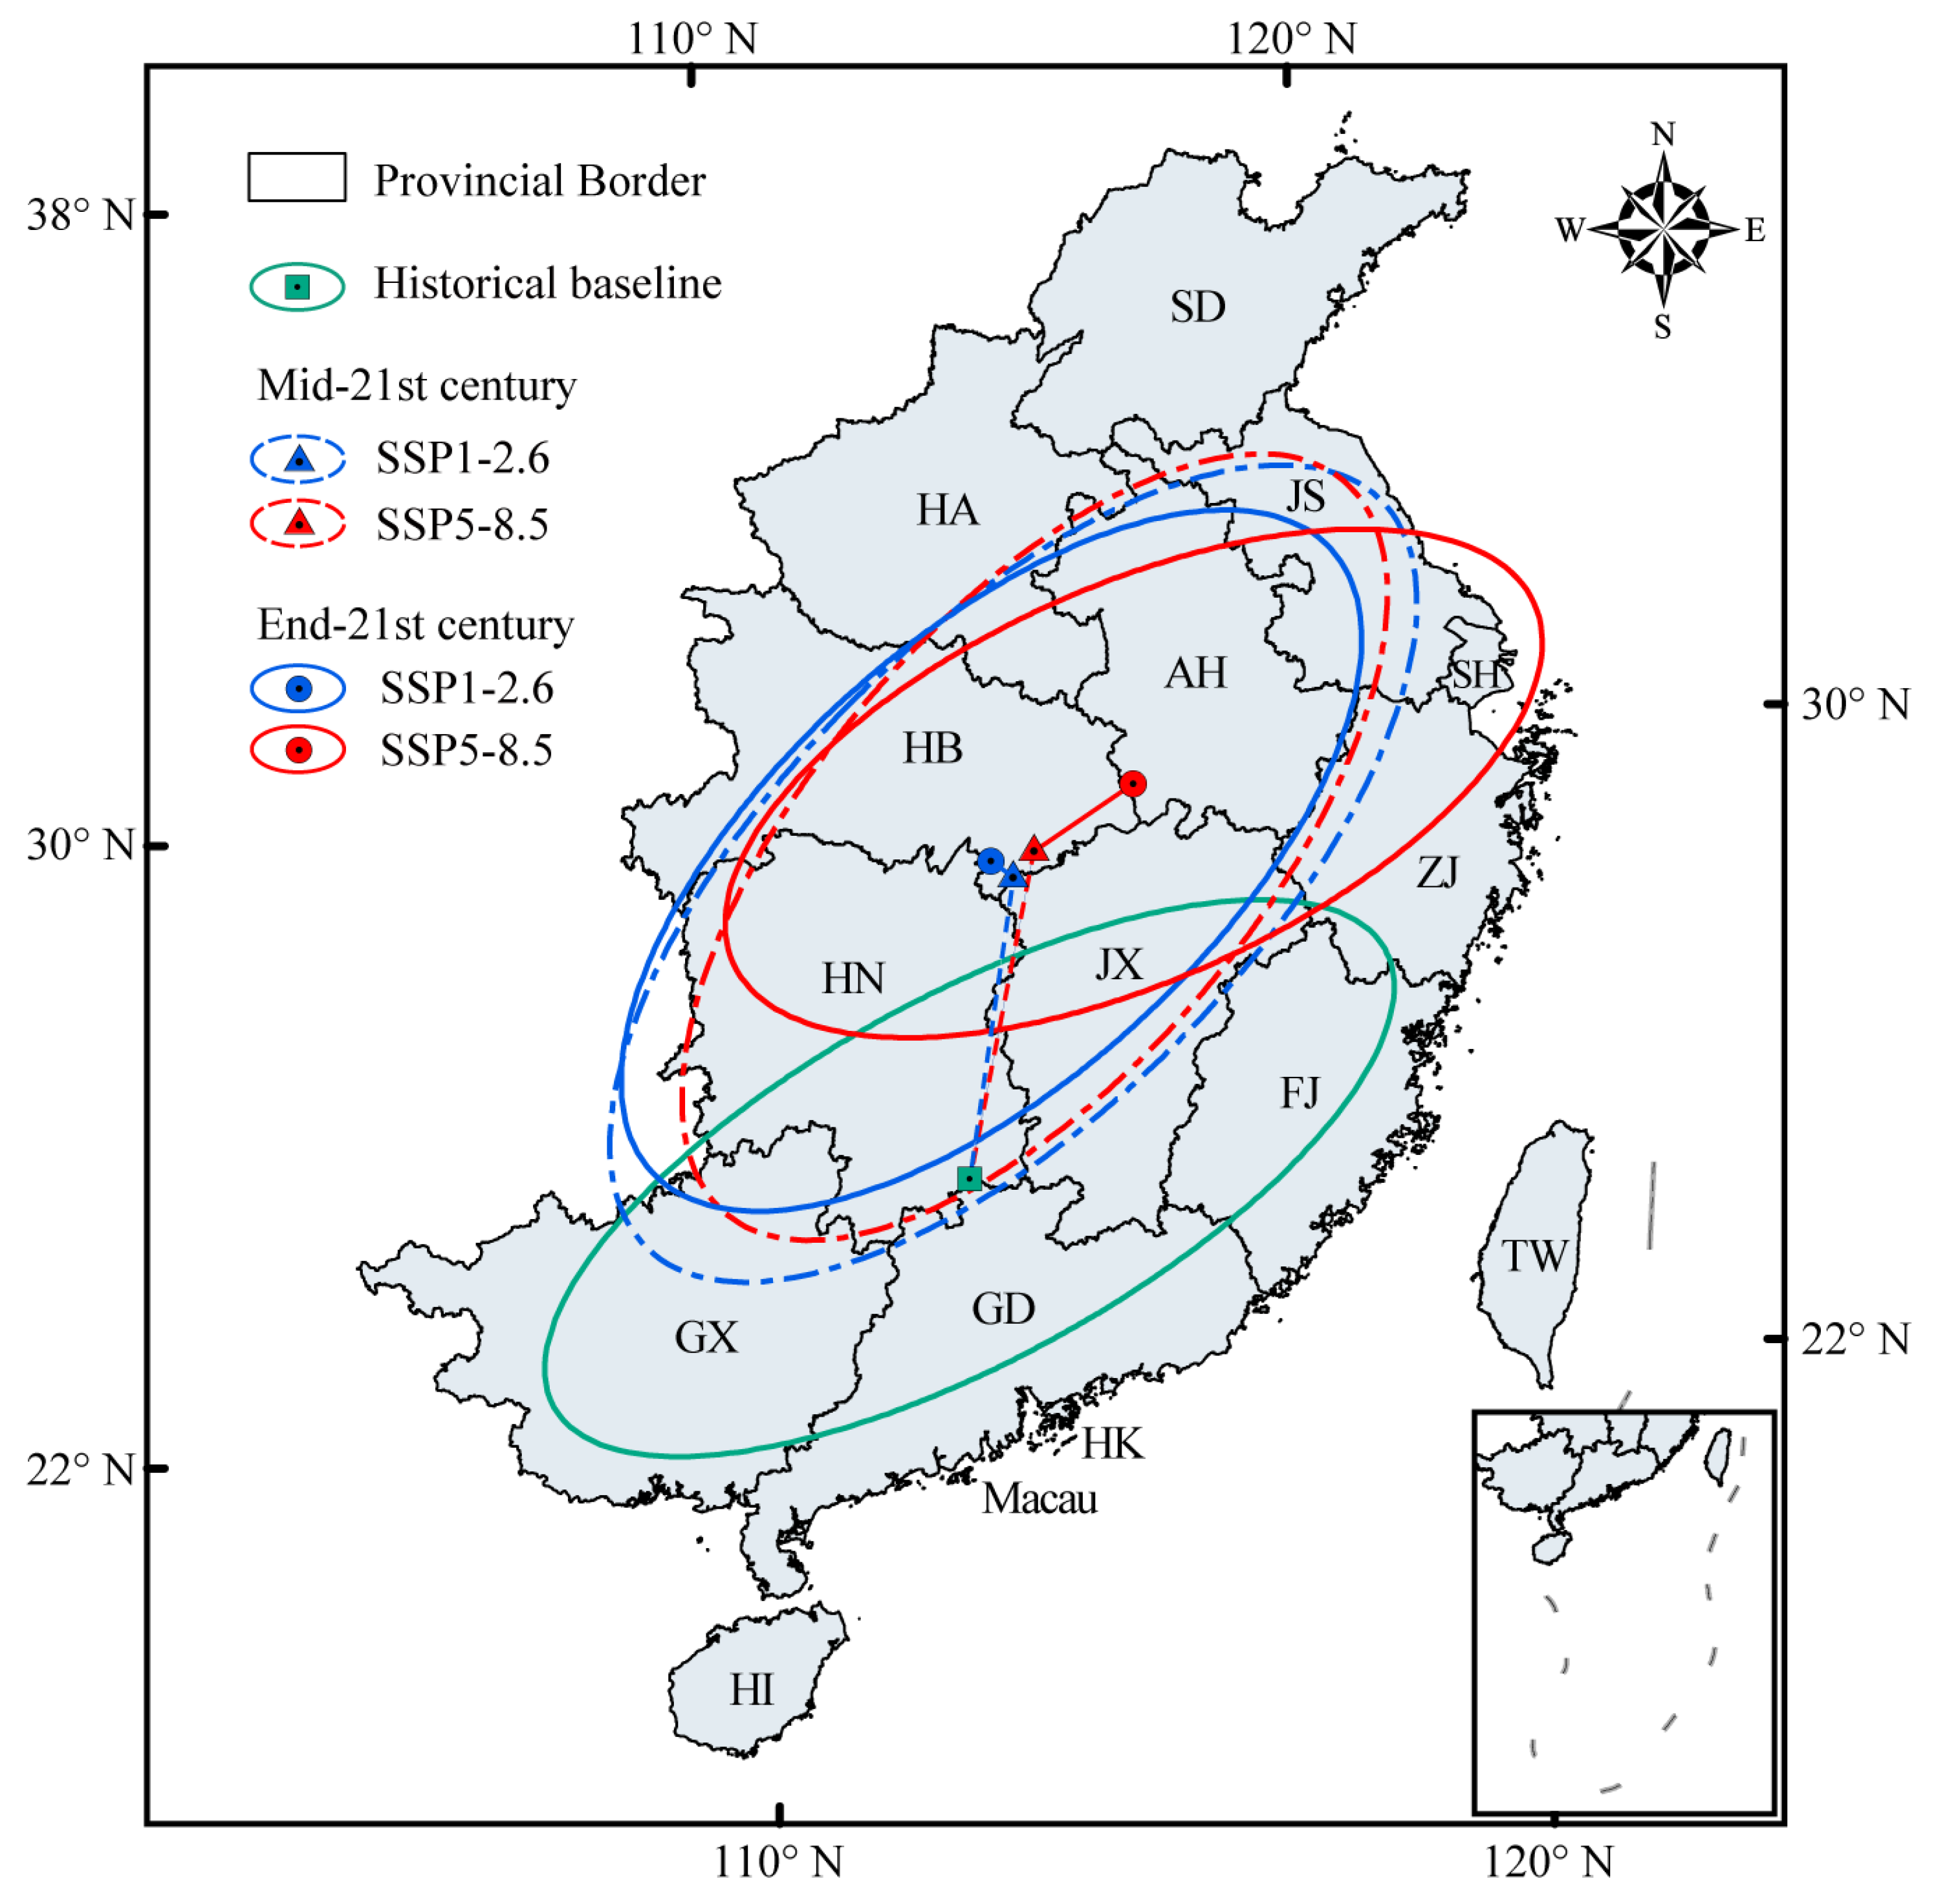
Using the SDE method, we quantified the spatial dynamics of high-risk forest fire areas (Figure 7, Table 2), revealing their migration patterns under climate change. During the historical baseline (1985–2014), the centroid of high-risk areas was located near the Guangdong–Hunan border (X = 817.71 km, Y = 2704.25 km). By the mid-21st century (2021–2050), under both the SSP1-2.6 and SSP5-8.5 scenarios, the centroid is projected to migrate northward near the Jiangxi-Hubei border. The northward shift (ΔY) was substantial (435.51 km for SSP1-2.6, 473.24 km for SSP5-8.5), whereas the eastward shift (ΔX) was minimal (<93 km). This northward migration intensified by the end of the 21st century (2071–2100), particularly under SSP5-8.5. Here, the centroid shifted sharply further north and east (X = 1052.02 km, Y = 3268.47 km) near the Hubei–Anhui border, representing a net shift of 564.22 km north and 234 km east relative to the historical baseline. This trajectory indicates the expansion of high-risk areas into densely populated inland regions of East China, such as Jiangsu and Hubei. The centroid migration path of the SDE closely aligns with the spatial evolution of fire risk depicted in Figure 6, revealing a pronounced northward shift that accelerates under high emissions (SSP5-8.5). Furthermore, compared with those in the mid-21st century, reductions in the SDE area, major axis, and minor axis by the end-21st century indicate a transition from diffuse areas to more spatially aggregated high-risk areas. This aggregation effect was amplified under the high-emission scenario.

4. Discussion

Our analysis systematically elucidates the spatiotemporal differences in forest fire risk in Southeastern China under climate change, identifying significant northward and inland migration in future high-risk areas. This shift reflects complex interactions among climate, ecology, and societal factors. The pronounced regional decline in fire frequency from 2008–2024 can be attributed to China’s long-standing aggressive fire suppression policies. The enhanced forest fire prevention framework, particularly since the revision and strengthening of the Forest Fire Prevention Regulations in 2009, has played a critical role by reinforcing legal liabilities, increasing penalties, and advancing proactive measures in fire source control, public education, and professional firefighting capacity [42,43]. At the same time, large-scale ecological initiatives—such as the Three-North Shelterbelt Forest Program [44], the Natural Forest Protection Project [45], and the comprehensive ban on commercial logging in natural forests rolled out since 2015—have also contributed to short-term fire control [46], while simultaneously altering forest structure and fuel loads [47]. However, the countertrend increase observed since 2016 in the core fire provinces of Guangdong and Fujian—whose combined share rose by 20.9%—suggests that localized climatic and human pressures may be beginning to overcome even these intensified suppression efforts. This aligns with the well-documented “fire paradox,” where highly effective short-term suppression can lead to long-term risk accumulation by allowing for continuous fuel buildup [48], a phenomenon strongly evidenced in western U.S. forests [49].
More critically, our projections under the high-emission SSP5-8.5 scenario suggest a dramatic northward shift in the high-risk centroid by 564.22 km from the historical location near the Guangdong–Hunan border to the Hubei–Anhui border. Concurrently, high-risk area coverage increased in densely populated provinces such as Jiangsu (from <1% to 79.5%) and Zhejiang (from <1% to 59.6%) relative to the historical baseline (Figure 6). This spatial reorganization was directly linked to projected drastic changes in hydrothermal conditions. To investigate this linkage and predict future fire risk, we developed a high-performing meteorologically driven prediction model via the random forest algorithm (R2 = 0.889). This model validates the key regulatory role of meteorological conditions in regional fire dynamics. While the widely used fire weather index (FWI) effectively captures meteorological influences on fire risk globally [17] and performs well in Northeast and Southwest China [18,19], its applicability in Southeastern China is limited because of its distinct local vegetation and climatic characteristics [20]. By capturing region-specific meteorological interactions, our model provides a more reliable alternative for the long-term prediction of forest fire risk in Southeastern China.
The primary driver of this northward high-risk area migration is spatiotemporal heterogeneity in future hydrothermal regimes. Our study indicates stronger future warming inland and at higher latitudes (Figure 5), which intensifies fire-conducive weather and consequently increases wildfire potential (Figure 6). This aligns with global trends [50,51] and further validates our model’s ability to predict high-risk area relocation. Moreover, precipitation increases exhibit coastal-high/inland-low asymmetry. This pattern, coupled with dramatic warming-induced increases in evapotranspiration demand [52], promotes aridification and warming trends in inland provinces. Droughts arising from this water–heat imbalance significantly reduce vegetation water use efficiency [53]. This process directly lowers the live fuel moisture content through reduced transpiration and increased tissue dehydration [54], thereby increasing vegetation flammability and regional fire risk. Seasonal-scale mechanisms also amplify risk. Although future mean precipitation increases, its variability intensifies (the standard deviation increases by 23%), indicating greater fluctuations between the wet and dry seasons. The historical concentration of 74% of fires in the dry season (December–March) may have intensified. This stems partly from a projected weakening of East Asian summer monsoon winds [55], which can shorten the rainy season, potentially leading to an earlier onset or prolongation of the dry season [56], thereby extending the fire risk period. The substantial surge in high-risk area coverage in Zhejiang (59.6%) likely reflects its position at the monsoon forefront, increasing sensitivity to precipitation fluctuations. Furthermore, human activities may exacerbate risks. Higher fire incidence occurs at wildland-urban interfaces than at natural forests [57]. In the highly urbanized Yangtze River Delta (e.g., Jiangsu, Zhejiang), high population density and expanding wildland–urban interfaces create dual vulnerability: abundant combustible material coupled with readily available ignition sources. Additionally, cultural fire practices, such as sacrificial burning during traditional festivals, may further contribute to ignition sources in certain regions and seasons. This anthropogenic ignition potential, superimposed on climatic drying and warming, significantly elevates fire risk. However, while human activities significantly increase the probability of fire ignition [8,25], fire risk fundamentally represents the potential for fire occurrence within a disaster-prone environment. Therefore, when assessing fire potential, a distinction should be made between natural risk factors (objective) and human ignition behaviors (subjective), which are triggers for fire occurrence rather than the risk itself.
A primary limitation of this study is that our future projections of fire risk are based exclusively on climate drivers under SSP scenarios and do not explicitly model future changes in fire management policies or suppression efficacy. Our modeling approach was designed to isolate and quantify the climate-induced component of future fire risk, thereby answering the following question: “All else being equal, how will climate change alone alter the spatiotemporal patterns of fire risk?” This provides a crucial baseline understanding of the pure climate signal, against which the additional impacts of socioeconomic pathways and human interventions can be evaluated in future work. Notably, our risk assessment focused primarily on fire occurrence probability, as consistent, spatially explicit burned area data were unavailable for the study period; however, official reports indicate a concurrent declining trend in both fire frequency and total burned area in recent years. Another limitation is that the CMIP6 models do not fully incorporate warming effects on vegetation composition. Studies suggest that deciduous species gain a competitive edge under warmer, drought-prone conditions [58]. Succession from subtropical evergreen forests to deciduous forests could increase dry-season fuel loads. Neglecting such vegetation feedback may lead to the underestimation of long-term fire risk. Nevertheless, our core findings regarding the climate-driven spatiotemporal evolution of fire risk remain robust. This work projects that forest fire risk in Southeastern China is undergoing a historic transition, characterized by a spatial shift from coastal to inland areas and an evolution in spatial pattern from dispersed to aggregated. This transformation is fundamentally rooted in the disruptive reconfiguration of regional hydrothermal regimes caused by climate change. Furthermore, agricultural burning, a common practice in Southeastern China [59,60], typically occurs during spring and autumn [61]. We further speculate that a future monsoon recession prolonging the dry season could align the agricultural burning period with the climatic high-risk window. This potential overlap might create a dual-peak fire risk season in some provinces of Southeastern China.

5. Conclusions

Through multisource data fusion and machine learning modeling, this study reveals the meteorological factor-driven spatial reorganization of forest fire risk across Southeastern China. We observed a highly significant decreasing trend in fire numbers from 2008–2024. However, Guangdong and Fujian Provinces showed an upward trend after 2016 (p < 0.01), increasing their combined share by 20.9%, indicating a reconfiguration/shift in the spatial concentration of local risk patterns. Seasonally, fires were highly concentrated in the dry season (December–March, 74.0% of the total), which is consistent with the monsoon precipitation regime. Forest fire risk exhibited significant spatiotemporal variability and a clear response to climate change. During the historical baseline (1985–2014), high-risk areas covered 12.9%, were primarily concentrated in southern coastal provinces such as Guangxi and Fujian, and were scarce (<1%) in northern provinces. Multiple scenario simulations project a gradual inland and northward increase in forest fire risk by the end of the 21st century, a trend that is amplified under the high-emission SSP5-8.5 scenario. This axial migration northward (564 km) was nonuniform and accompanied by significant spatial aggregation. Climate change drove this aggregated northward migration of fire risk into densely populated inland areas of Southeastern China through the reconfiguration of hydrothermal patterns.
Our findings demonstrate that climate change impacts forest fire risk not only by altering its magnitude but also by significantly reshaping its spatial distribution and driving the migration of high-risk areas. Therefore, future research should explore region-specific climate change impacts on fire risk, particularly responses under extreme climatic conditions. Additionally, sustained long-term climate observations and data accumulation are essential for enhancing the accuracy of future fire prediction models. The random forest model developed here effectively captures the nonlinear relationships between regional meteorological drivers and fire dynamics. This study overcomes the limitations of traditional fire risk indices and provides a scientific basis for developing tailored forest fire management and prevention strategies in Southeastern China. Given the increasing severity of climate change, future wildfire risk management must transition from static zoning to dynamic response systems. Emerging high-risk areas, notably the Yangtze River Delta and Mid-Yangtze River regions, require prioritized integration into key monitoring networks and differentiated prevention strategies to address the challenges of compound climate risks.

Author Contributions

Conceptualization, methodology, software, validation, formal analysis, investigation, resources, data curation, writing—original draft preparation, visualization, supervision, project administration, and funding acquisition were conducted primarily by D.G.; M.J. contributed to conceptualization, investigation, writing—review and editing, and funding acquisition. All authors have read and agreed to the published version of the manuscript.

Funding

This work was supported by the China Fire and Rescue Institute Scientific Research Project [XFKZD202502] and Key Technologies for Preventing Safety Risks in the Construction and Operation of Photovoltaic Projects [HZ202509-02].

Institutional Review Board Statement

Not applicable.

Informed Consent Statement

Not applicable.

Data Availability Statement

The data are available from the corresponding author on reasonable request.

Conflicts of Interest

The authors declare no conflicts of interest.

References

  1. Abatzoglou, J.T.; Kolden, C.A.; Cullen, A.C.; Sadegh, M.; Williams, E.L.; Turco, M.; Jones, M.W. Climate Change Has Increased the Odds of Extreme Regional Forest Fire Years Globally. Nat. Commun. 2025, 16, 6390. [Google Scholar] [CrossRef]
  2. Zheng, B.; Ciais, P.; Chevallier, F.; Chuvieco, E.; Chen, Y.; Yang, H. Increasing Forest Fire Emissions Despite the Decline in Global Burned Area. Sci. Adv. 2021, 7, eabh2646. [Google Scholar] [CrossRef]
  3. Shivaprasad, K.M.; Sowmya, M.S.; Danakumara, T.; Gowda, M.M.; Kumar, R.; Kumar, S.D.; Kumar, B.S. Chapter 4-Forest Fire and Its Impact on Forest Biodiversity. In Forests for Inclusive and Sustainable Economic Growth; Saikia, P., Kumar, A., Khan, M.L., Lei, X., Eds.; Elsevier: Amsterdam, The Netherlands, 2025; pp. 37–53. [Google Scholar] [CrossRef]
  4. Wunder, S.; Calkin, D.E.; Charlton, V.; Feder, S.; Martínez de Arano, I.; Moore, P.; Rodríguez y Silva, F.; Tacconi, L.; Vega-García, C. Resilient Landscapes to Prevent Catastrophic Forest Fires: Socioeconomic Insights Towards a New Paradigm. For. Policy Econ. 2021, 128, 102458. [Google Scholar] [CrossRef]
  5. Brown, P.T.; Hanley, H.; Mahesh, A.; Reed, C.; Strenfel, S.J.; Davis, S.J.; Kochanski, A.K.; Clements, C.B. Climate Warming Increases Extreme Daily Wildfire Growth Risk in California. Nature 2023, 621, 760–766. [Google Scholar] [CrossRef]
  6. Jones, M.W.; Abatzoglou, J.T.; Veraverbeke, S.; Andela, N.; Lasslop, G.; Forkel, M.; Smith, A.J.P.; Burton, C.; Betts, R.A.; van der Werf, G.R.; et al. Global and Regional Trends and Drivers of Fire Under Climate Change. Rev. Geophys. 2022, 60, e2020RG000726. [Google Scholar] [CrossRef]
  7. Abatzoglou, J.T.; Williams, A.P. Impact of Anthropogenic Climate Change on Wildfire Across Western US Forests. Proc. Natl. Acad. Sci. USA 2016, 113, 11770–11775. [Google Scholar] [CrossRef]
  8. Gong, D.; Sun, L.; Hu, T. Characterizing the Occurrence of Wildland-Urban Interface Fires and Their Important Factors in China. Ecol. Indic. 2024, 165, 112179. [Google Scholar] [CrossRef]
  9. Tian, X.; Zhao, F.; Shu, L.; Wang, M. Forest Fire Risk Assessment for China Under Different Climate Scenarios. Chin. J. Appl. Ecol. 2016, 27, 769–776. [Google Scholar] [CrossRef]
  10. Tian, X.R.; Shu, L.F.; Zhao, F.J.; Wang, M.Y. Impacts of Climate Change on Forest Fire Danger in China. Sci. Ailvae Sin. 2017, 53, 159–169. [Google Scholar] [CrossRef]
  11. Fazel-Rastgar, F.; Sivakumar, V. Weather Pattern Associated with Climate Change During Canadian Arctic Wildfires: A Case Study in July 2019. Remote Sens. Appl. Soc. Environ. 2022, 25, 100698. [Google Scholar] [CrossRef]
  12. Kang, Y.; Jang, E.; Im, J.; Kwon, C.; Kim, S. Developing a New Hourly Forest Fire Risk Index Based on Catboost in South Korea. Appl. Sci. 2020, 10, 8213. [Google Scholar] [CrossRef]
  13. Lan, Z.; Su, Z.; Guo, M.; Alvarado, E.; Guo, F.-T.; Hu, H.; Wang, G.; Oliveira, S. Are Climate Factors Driving the Contemporary Wildfire Occurrence in China? Forests 2021, 12, 392. [Google Scholar] [CrossRef]
  14. Zhao, F.-J.; Liu, Y. Atmospheric Circulation Patterns Associated with Wildfires in the Monsoon Regions of China. Geophys. Res. Lett. 2019, 46, 4873–4882. [Google Scholar] [CrossRef]
  15. Ellis, T.M.; Bowman, D.; Jain, P.; Flannigan, M.D.; Williamson, G.J. Global Increase in Wildfire Risk Due to Climate-Driven Declines in Fuel Moisture. Glob. Change Biol. 2022, 28, 1544–1559. [Google Scholar] [CrossRef]
  16. Vilar, L.; Herrera, S.; Tafur-García, E.; Yebra, M.; Martinez-Vega, J.; Echavarría, P.; Martín, M.P. Modelling Wildfire Occurrence at Regional Scale from Land Use/Cover and Climate Change Scenarios. Environ. Model. Softw. 2021, 145, 105200. [Google Scholar] [CrossRef]
  17. Shmuel, A.; Lazebnik, T.; Heifetz, E.; Glickman, O.; Price, C. Fire Weather Indices Tailored to Regional Patterns Outperform Global Models. npj Nat. Hazards 2025, 2, 74. [Google Scholar] [CrossRef]
  18. Tian, X.; Zhao, F.J.; Shu, L.F.; Wang, M.Y. Changes in Forest Fire Danger for South-Western China in the 21st Century. Int. J. Wildland Fire 2014, 23, 185–195. [Google Scholar] [CrossRef]
  19. Tian, X.; McRae, D.J.; Shu, L.; Zhao, F.; Wang, M. Changes of Forest Fire Danger and the Evaluation of the FWI System Application in the Daxing’anling Region. Sci. Silvae Sin. 2010, 46, 127–132. [Google Scholar] [CrossRef]
  20. Yang, M.; Yao, Q.; Fang, K.; Dong, Z. Applications of Canadian Forest Fire Weather Index System in the World and China. J. Subtrop. Resour. Environ. 2021, 16, 48–54. [Google Scholar] [CrossRef]
  21. Van Wagner, C.E. Development and Structure of the Canadian Forest Fire Weather Index System; Forestry Technical Report; Canadian Forestry Service: Ottawa, ON, Canada, 1987; 35p. [Google Scholar]
  22. Stocks, B.J.; Lynham, T.J.; Lawson, B.D.; Alexander, M.E.; Van Wagner, C.E.; McAlpine, R.S.; Dubé, D.E. Canadian Forest Fire Danger Rating System: An Overview. For. Chron. 1989, 65, 258–265. [Google Scholar] [CrossRef]
  23. Chelli, S.; Maponi, P.; Campetella, G.; Monteverde, P.; Foglia, M.; Paris, E.; Lolis, A.; Panagopoulos, T. Adaptation of the Canadian Fire Weather Index to Mediterranean forests. Nat. Hazards 2015, 75, 1795–1810. [Google Scholar] [CrossRef]
  24. Tian, X.; Zhao, F.; Shu, L.; Wang, M. Distribution Characteristics and the Influence Factors of Forest Fires in China. For. Ecol. Manag. 2013, 310, 460–467. [Google Scholar] [CrossRef]
  25. Zong, X.; Tian, X.; Liu, J. A Fire Regime Zoning System for China. Front. For. Glob. Chang. 2021, 4, 717499. [Google Scholar] [CrossRef]
  26. Tsinko, Y.; Bakhshaii, A.; Johnson, E.A.; Martin, Y.E. Comparisons of Fire Weather Indices Using Canadian Raw and Homogenized Weather Data. Agric. For. Meteorol. 2018, 262, 110–119. [Google Scholar] [CrossRef]
  27. Li, D.; Feng, J.; Dosio, A.; Qi, J.; Xu, Z.; Yin, B. Historical Evaluation and Future Projections of 100-m Wind Energy Potentials Over CORDEX-East Asia. J. Geophys. Res. Atmos. 2020, 125, e2020JD032874. [Google Scholar] [CrossRef]
  28. Sillmann, J.; Kharin, V.V.; Zhang, X.; Zwiers, F.W.; Bronaugh, D. Climate Extremes Indices in the CMIP5 Multimodel Ensemble: Part 1. Model Evaluation in the Present Climate. J. Geophys. Res. Atmos. 2013, 118, 1716–1733. [Google Scholar] [CrossRef]
  29. Su, B.; Huang, J.; Mondal, S.K.; Zhai, J.; Wang, Y.; Wen, S.; Gao, M.; Lv, Y.; Jiang, S.; Jiang, T.; et al. Insight from CMIP6 SSP-RCP Scenarios for Future Drought Characteristics in China. Atmos. Res. 2021, 250, 105375. [Google Scholar] [CrossRef]
  30. You, Q.; Cai, Z.; Wu, F.; Jiang, Z.; Pepin, N.; Shen, S.S.P. Temperature Dataset of CMIP6 Models Over China: Evaluation, Trend and Uncertainty. Clim. Dyn. 2021, 57, 17–35. [Google Scholar] [CrossRef]
  31. Kondylatos, S.; Prapas, I.; Ronco, M.; Papoutsis, I.; Camps-Valls, G.; Piles, M.; Fernandez-Torres, M.A.; Carvalhais, N. Wildfire Danger Prediction and Understanding with Deep Learning. Geophys. Res. Lett. 2022, 49, e2022GL099368. [Google Scholar] [CrossRef]
  32. Thompson, M.P.; Zimmerman, T.; Mindar, D.; Taber, M. Risk Terminology Primer: Basic Principles and a Glossary for the Wildland Fire Management Community; U.S. Department of Agriculture, Forest Service, Rocky Mountain Research Station: Fort Collins, CO, USA, 2016. Available online: https://www.govinfo.gov/content/pkg/GOVPUB-A13-PURL-gpo71455/pdf/GOVPUB-A13-PURL-gpo71455.pdf (accessed on 25 August 2025).
  33. Pettinari, M.L.; Chuvieco, E. Fire Danger Observed from Space. Surv. Geophys. 2020, 41, 1437–1459. [Google Scholar] [CrossRef]
  34. Chen, R.; He, B.; Li, Y.; Fan, C.; Yin, J.; Zhang, H.; Zhang, Y. Estimation of Potential Wildfire Behavior Characteristics to Assess Wildfire Danger in Southwest China Using Deep Learning Schemes. J. Environ. Manag. 2024, 351, 120005. [Google Scholar] [CrossRef] [PubMed]
  35. Koutsias, N.; Balatsos, P.; Kalabokidis, K. Fire Occurrence Zones: Kernel Density Estimation of Historical Wildfire Ignitions at the National Level, Greece. J. Maps 2014, 10, 630–639. [Google Scholar] [CrossRef]
  36. Fu, J.; Niu, J.; Sivakumar, B. Prediction of Vegetation Anomalies Over an Inland River Basin in North-Western China. Hydrol. Process. 2018, 32, 1814–1827. [Google Scholar] [CrossRef]
  37. Han, D.; Liu, S.; Du, Y.; Xie, X.; Fan, L.; Lei, L.; Li, Z.; Yang, H.; Yang, G. Crop Water Content of Winter Wheat Revealed with Sentinel-1 and Sentinel-2 Imagery. Sensors 2019, 19, 4013. [Google Scholar] [CrossRef]
  38. Wu, L.; Zhou, H.; Ma, X.; Fan, J.; Zhang, F. Daily Reference Evapotranspiration Prediction Based on Hybridized Extreme Learning Machine Model with Bio-Inspired Optimization Algorithms: Application in Contrasting Climates of China. J. Hydrol. 2019, 577, 123960. [Google Scholar] [CrossRef]
  39. Scholze, M.; Knorr, W.; Arnell, N.W.; Prentice, I.C. A Climate-Change Risk Analysis for World Ecosystems. Proc. Natl. Acad. Sci. USA 2006, 103, 13116–13120. [Google Scholar] [CrossRef]
  40. Shi, X.; Zhao, D.; Wu, S.; Shi, W.; Dai, E.; Wang, W. Climate Change Risks for Net Primary Production of Ecosystems in China. Human Ecol. Risk Assess. Int. J. 2016, 22, 1091–1105. [Google Scholar] [CrossRef]
  41. Duman, Z.; Mao, X.; Cai, B.; Zhang, Q.; Chen, Y.; Gao, Y.; Guo, Z. Exploring the Spatiotemporal Pattern Evolution of Carbon Emissions and Air Pollution in Chinese Cities. J. Environ. Manag. 2023, 345, 118870. [Google Scholar] [CrossRef] [PubMed]
  42. Han, H.J. Interpretation of the old and new “Forest Fire Prevention Regulations”. Leg. Syst. Soc. 2009, 12, 331–332. [Google Scholar] [CrossRef]
  43. Zhou, Q.; Zhang, H.; Wu, Z. Effects of Forest Fire Prevention Policies on Probability and Drivers of Forest Fires in the Boreal Forests of China during Different Periods. Remote Sens. 2022, 14, 5724. [Google Scholar] [CrossRef]
  44. Zhai, J.; Wang, L.; Liu, Y.; Wang, C.; Mao, X. Assessing the effects of China’s three-north shelter forest program over 40 years. Sci. Total Environ. 2023, 857, 159354. [Google Scholar] [CrossRef]
  45. Qiao, D.; Yuan, W.T.; Ke, S.F. China’s Natural Forest Protection Program: Evolution, impact and challenges. Int. For. Rev. 2021, 23, 338–350. [Google Scholar] [CrossRef]
  46. Yin, R. Evaluating the socioeconomic and ecological impacts of China’s forest policies, program, and practices: Summary and outlook. For. Policy Econ. 2021, 127, 102439. [Google Scholar] [CrossRef]
  47. Hu, T.; Xu, Z.; Yu, C.; Dou, X.; Zhang, Y.; Sun, L. Impacts of different forest fire management policies and fuel treatment models on forest fire risk in boreal forest of China. Ecol. Indic. 2024, 169, 112806. [Google Scholar] [CrossRef]
  48. Hayes, J.P. Fire Suppression and the Wildfire Paradox in Contemporary China: Policies, Resilience, and Effects in Chinese Fire Regimes. Hum. Ecol. 2021, 49, 19–32. [Google Scholar] [CrossRef]
  49. Covington, W.W.; Everett, R.L.; Steele, R.; Irwin, L.L.; Daer, T.A.; Auclair, A.N.D. Historical and Anticipated Changes in Forest Ecosystems of the Inland West of the United States. J. Sustain. For. 1994, 2, 13–63. [Google Scholar] [CrossRef]
  50. Richardson, D.; Black, A.S.; Irving, D.; Matear, R.J.; Monselesan, D.P.; Risbey, J.S.; Squire, D.T.; Tozer, C.R. Global Increase in Wildfire Potential from Compound Fire Weather and Drought. npj Clim. Atmos. Sci. 2022, 5, 23. [Google Scholar] [CrossRef]
  51. Yang, X.; Zhou, B.; Xu, Y.; Han, Z. CMIP6 Evaluation and Projection of Temperature and Precipitation over China. Adv. Atmos. Sci. 2021, 38, 817–830. [Google Scholar] [CrossRef]
  52. Rigden, A.J.; Salvucci, G.D. Stomatal Response to Humidity and CO2 Implicated in Recent Decline in US Evaporation. Glob. Change Biol. 2017, 23, 1140–1151. [Google Scholar] [CrossRef]
  53. Hu, Y.; Wei, F.; Wang, S.; Zhang, W.; Fensholt, R.; Xiao, X.; Fu, B. Critical Thresholds for Nonlinear Responses of Ecosystem Water Use Efficiency to Drought. Sci. Total Environ. 2024, 918, 170713. [Google Scholar] [CrossRef]
  54. Pivovaroff, A.L.; Emery, N.; Sharifi, M.R.; Witter, M.; Keeley, J.E.; Rundel, P.W. The Effect of Ecophysiological Traits on Live Fuel Moisture Content. Fire 2019, 2, 28. [Google Scholar] [CrossRef]
  55. Zhang, Q.; Zeng, J.; Yue, P.; Zhang, L.; Wang, S.; Wang, R. On the Land-Atmosphere Interaction in the Summer Monsoon Transition Zone in East Asia. Theor. Appl. Climatol. 2020, 141, 1165–1180. [Google Scholar] [CrossRef]
  56. Li, Q.; Wei, F.; Li, D. Interdecadal Variation of East Asian Summer Monsoon and Drought/Flood Distribution Over Eastern China in the Last 159 Years. J. Geogr. Sci. 2011, 21, 579–593. [Google Scholar] [CrossRef]
  57. Chas-Amil, M.L.; Prestemon, J.P.; McClean, C.J.; Touza, J. Human-Ignited Wildfire Patterns and Responses to Policy Shifts. Appl. Geogr. 2015, 56, 164–176. [Google Scholar] [CrossRef]
  58. Ge, J.; Xie, Z. Geographical and Climatic Gradients of Evergreen Versus Deciduous Broad-Leaved Tree Species in Subtropical China: Implications for the Definition of the Mixed Forest. Ecol. Evol. 2017, 7, 3636–3644. [Google Scholar] [CrossRef] [PubMed]
  59. He, X.; Huang, Q.; Yang, D.; Yang, Y.; Xie, G.; Yang, S.; Liang, C.; Qin, Z. Spatiotemporal Analysis of Open Biomass Burning in Guangxi Province, China, from 2012 to 2023 Based on VIIRS. Fire 2024, 7, 370. [Google Scholar] [CrossRef]
  60. Zhu, B.; Zhang, Y.; Chen, N.; Quan, J. Assessment of Air Pollution Aggravation During Straw Burning in Hubei, Central China. Int. J. Environ. Res. Public Health 2019, 16, 1446. [Google Scholar] [CrossRef] [PubMed]
  61. Huang, H.N.; Yang, Z.; Guo, Y.; Ma, J.J.; Ming, B.W.; Yang, J.; Guo, C.; Li, L.; Ou, C.Q. Impact of Agricultural Straw Open-Field Burning on Concentrations of Six Criteria Air Pollutants in China. Environ. Pollut. 2025, 373, 126109. [Google Scholar] [CrossRef]
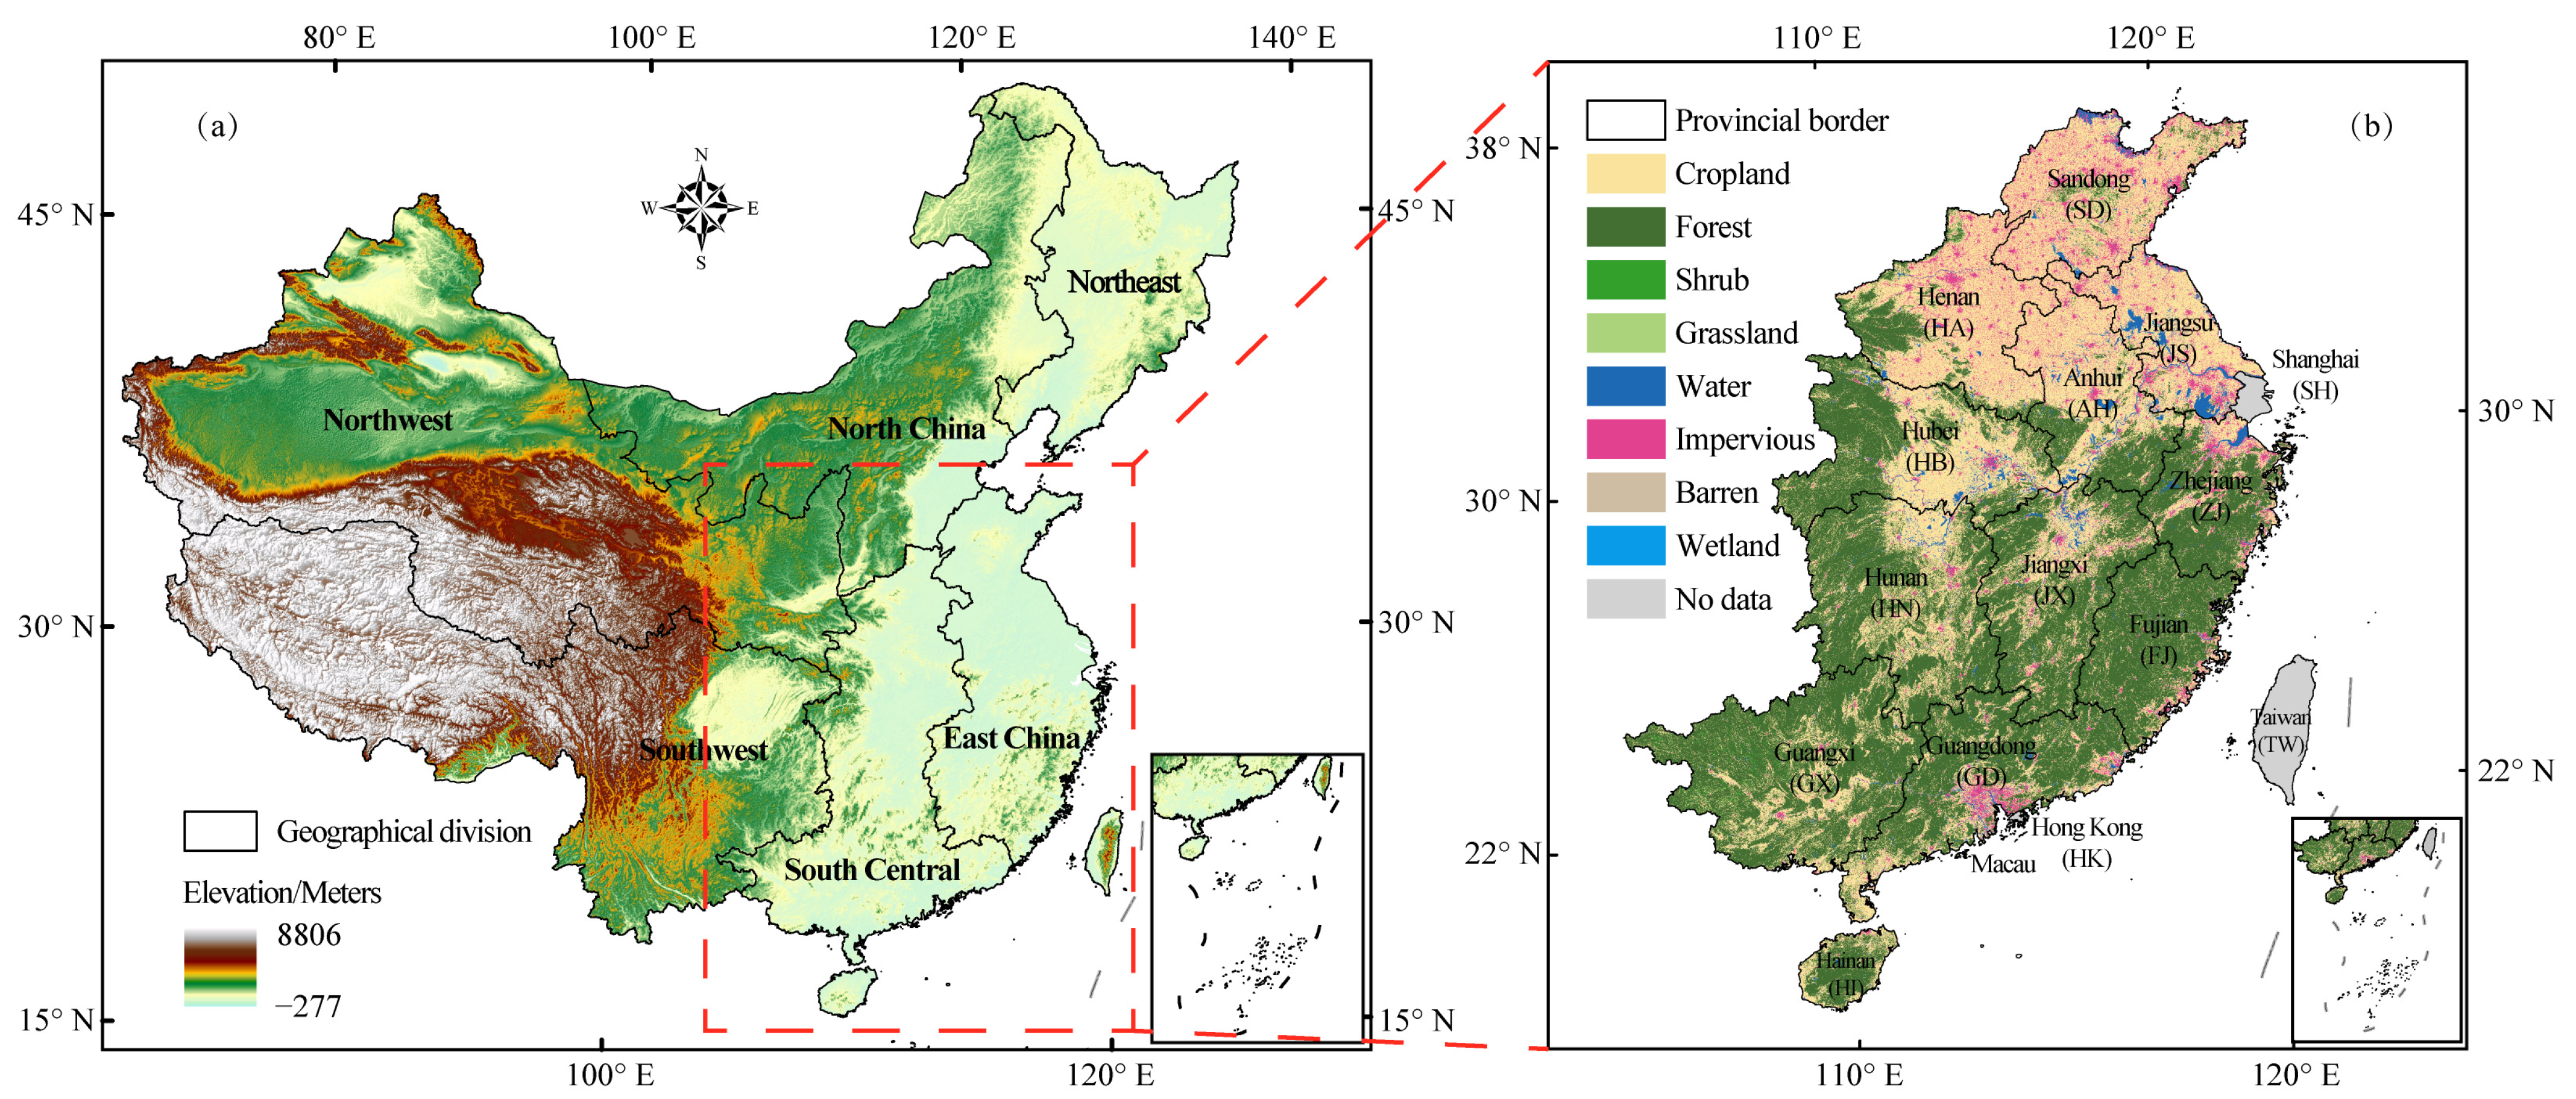
Figure 1. (a) Geographic location of the study area in China. (b) Land use and land cover classification map of the study region. The abbreviations for all Chinese provinces mentioned in this study are defined in this map.
Atmosphere 16 01189 g001
Figure 2. Characteristics of the annual distribution of forest fires in Southeastern China. (a) Total number of fires across the entire Southeastern China. (b) Annual number of fires for South Central China subregion and its constituent provinces. (c) Annual number of fires for East China subregion and its constituent provinces. The numbers in parentheses denote the rate of linear change (fires/year) for the corresponding region or province. Asterisks indicate the statistical significance of the trend: * p < 0.05, ** p < 0.01, *** p < 0.001.
Atmosphere 16 01189 g002
Figure 3. Monthly distribution of forest fires in Southeastern China. The histogram shows the total number of fires recorded monthly across all regions and their respective provinces throughout the entire study period (2008–2024).
Atmosphere 16 01189 g003
Figure 4. (a) Agreement between the observed and predicted values. (b) Distribution of residuals to assess the normality of prediction errors.
Atmosphere 16 01189 g004
Figure 5. Projected changes in hydrothermal conditions (temperature, precipitation, relative humidity, and wind speed) for Southeastern China under different scenarios. The left column (a-1d-1) shows the spatial pattern of the differences in the 30-year averages between the historical baseline (1985–2014) and the end-21st century (2071–2100) at a spatial resolution of 0.1°. The right column (a-2d-2) presents the corresponding 18-month moving average time series for each variable, with the linear trend slope and its significance indicated in the legends (* p < 0.05, *** p < 0.001).
Atmosphere 16 01189 g005
Figure 6. Spatiotemporal evolution of forest fire risk under climate change scenarios. Spatial distribution of the forest fire risk index during (a) the historical baseline period (1985–2014), (b) the end-21st century under SSP1-2.6, and (c) the end-21st century under SSP5-8.5. For each period, the bar charts quantify the proportional area coverage of different risk levels (low, moderate, high) for the entire study region and key provinces, whereas the violin plots depict the corresponding probability density distribution and median value of the risk index.
Atmosphere 16 01189 g006aAtmosphere 16 01189 g006b
Figure 7. Northward migration and spatial aggregation of high-risk areas. The standard deviational ellipses depict the centroid shift and dispersion changes in high-risk zones from the historical baseline to the mid- and end-21st century under SSP1-2.6 and SSP5-8.5 scenarios.
Atmosphere 16 01189 g007
Table 1. Performance metrics of the random forest model across the five folds of cross-validation. (RMSE: root mean square error; MAE: mean absolute error; R2: coefficient of determination; CCC: concordance correlation coefficient).
ModelRMSEMAER2CCC
Fold10.05560.03100.8850.936
Fold20.05570.03140.8890.937
Fold30.05770.03230.8780.932
Fold40.05530.03120.8870.938
Fold50.05770.03220.8860.935
Mean0.05640.03160.8850.936
Table 2. Standard deviation ellipse parameters for high-risk areas of forest fires in Southeastern China.
PeriodScenarioEllipse Area
(104 km2)
Centroid X
(km)
Centroid Y
(km)
Major Axis
(km)
Minor Axis
(km)
Historical
(1985–2014)
Historical baseline55.06817.712704.25677.09258.90
Mid-21st century
(2021–2050)
SSP1-2.679.02880.263139.76748.04336.31
SSP5-8.568.26910.693177.49684.42317.48
End-21st century
(2071–2100)
SSP1-2.664.47848.973158.22658.01311.88
SSP5-8.555.421052.023268.47626.80281.47
Disclaimer/Publisher’s Note: The statements, opinions and data contained in all publications are solely those of the individual author(s) and contributor(s) and not of MDPI and/or the editor(s). MDPI and/or the editor(s) disclaim responsibility for any injury to people or property resulting from any ideas, methods, instructions or products referred to in the content.