Article

A New Anticyclone Identification Method Based on Mask R-CNN Model and Its Application

1
Key Laboratory of Ecosystem Carbon Source and Sink, China Meteorological Administration (ECSS-CMA), Wuxi University, Wuxi 214105, China
2
Public Meteorological Service Centre, China Meteorological Administration, Beijing 100081, China
3
Xiamen Key Laboratory of Straits Meteorology, Xiamen Meteorological Bureau, Xiamen 361000, China
4
Guangdong Meteorological Observatory, Guangzhou 510080, China
*
Author to whom correspondence should be addressed.
Atmosphere 2025, 16(10), 1140; https://doi.org/10.3390/atmos16101140
Submission received: 26 August 2025 / Revised: 22 September 2025 / Accepted: 26 September 2025 / Published: 28 September 2025

Abstract

In recent decades, frequent cold waves and low-temperature events in mid-to-high latitude Eurasia have severely impacted socioeconomic activities in Northeast China. Accurately identifying anticyclones is essential due to their close relation to cold air activity. This study proposes a new anticyclone identification method using the Mask region-based convolutional neural network (Mask R-CNN) model to detect synoptic-scale anticyclones by capturing their two-dimensional structural features and investigating their relationship with snow-ice disasters in Northeast China. It is found that compared with traditional objective identification methods, the new method better captures the overall structural characteristics of anticyclones, significantly improving the description of large-scale, strong anticyclones. Specifically, it incorporates 7.3% of small-scale anticyclones into larger-scale systems. Anticyclones are closely correlated with local cooling and cold air mass changes over Northeast China, with 60% of anticyclones accompanying regional cold air mass accumulation and temperature drops. Two case studies of the rare rain-snow and cold wave events revealed that these events were preceded by the generation and eastward expansion of an upstream anticyclone identified by the new method. This demonstrates that the proposed method can effectively track anticyclones and the evolution of cold high-pressure systems, providing insights into extreme cold events.

1. Introduction

In recent decades, frequent occurrences of cold waves and low-temperature events in the mid-to-high latitudes of Eurasia [1,2,3,4,5] have significantly impacted residents’ daily lives while posing severe challenges to socio-economic sectors, including energy supply, transportation, and agricultural production. For instance, two intense cold waves during the 2020/2021 winter caused widespread, severe, and persistent cooling across China [5]. In early November 2021, Liaoning Province experienced rare combined rain-snow, cold wave, and gale events, with snowfall accumulation exceeding that of the historic “3.04” blizzard in 2007 and breaking all meteorological records since 1951 [6].
The frequent and intense anticyclone (i.e., cold high) activity over Eurasia during autumn and winter serves as a primary driver for the formation of the semi-permanent high-pressure system in the Siberian High region. This activity also exhibits close linkages with cold air variations [7,8,9]. As anticyclones develop and move eastward, surface cold highs intensify, triggering large-scale cold wave outbreaks that frequently induce severe weather phenomena, including sharp temperature drops, blizzards, freezing rain, and gale-force winds. Objective identification and tracking of anticyclone activity enable effective inference of strong cold air trajectories and cold wave incursions, predicting ensuing severe weather (such as abrupt cooling, blizzards, and freezing rain), and providing meteorological support for disaster prevention and reduction in surrounding urban areas.
Previous studies have established multi-year anticyclone datasets through manual analysis (e.g., Lu et al. [9]), which can characterize anticyclone activity features. However, manual analysis is time-intensive, has limited spatial coverage, and cannot maintain real-time data updates. Furthermore, objective identification algorithms have been proposed for anticyclones in sea level pressure (SLP) fields and low-level vorticity fields based on their fundamental characteristics of being large-scale high-pressure systems with negative vorticity [8,10,11]. These algorithms primarily identify anticyclone positions by locating maximum SLP and minimum vorticity at lower atmospheric levels. Nevertheless, under complex terrain conditions or during cold high fragmentation events, such methods often misidentify large-scale anticyclones as multiple small-scale high-pressure systems, failing to accurately represent their holistic characteristics. Identifying anticyclones on weather maps is analogous to image segmentation tasks in computer vision. Deep learning models are extensively applied to object recognition in images [12,13,14] in meteorological research: Hong et al. [15] employed a convolutional neural network (CNN) model for typhoon tracking; Lu et al. [9,16] leveraged the Mask R-CNN model to identify cyclones and anticyclones, respectively, demonstrating robust performance for such weather systems [17,18]; Qin et al. [19] implemented the DETR model to detect cold fronts in satellite cloud imagery. Additionally, deep learning models have been widely applied in research areas such as weather forecasting [20,21,22], climate analysis [23,24], and classification [25,26].
However, current deep learning models typically require large labeled datasets for training to acquire object identification capabilities, and constructing such datasets consumes substantial human and material resources. Consequently, developing suitable labeled datasets remains a major challenge in machine learning [27]. Moreover, the performance of trained models often depends on the quality of labeled samples. Given that manually identified anticyclones have limited geographical coverage and quantity—often focusing on large-scale systems significantly impacting current conditions—while objective identification algorithms can more readily provide broader anticyclone identification results but may fragment them into multiple small-scale systems, this study integrates limited manually labeled anticyclone samples with objective identification algorithms and the Mask R-CNN model to comprehensively identify anticyclone activity over Eurasia. The Mask R-CNN model was proposed by He et al. [13] by adding a parallel branch to predict the object’s spatial profile upon the Faster R-CNN model [28] (i.e., a CNN architecture commonly used for object classification and localization). This extension enables pixel-level instance segmentation and has demonstrated competitive performance among existing methods [9,13,16]. Additionally, the Mask R-CNN model, which has been extensively pre-trained on the COCO dataset, can be adapted through transfer learning for the objective identification of other target objects [13]. The detailed implementation steps are described in Section 2.2: the new anticyclone identification method based on the Mask R-CNN model. Section 3 presents the performance of the proposed method in anticyclone detection. By integrating it with the evolution process of cold wave events, this section analyzes the identified anticyclonic activities over Siberia and elucidates their influence on cold wave intrusions and severe weather events, such as sharp temperature drops and snowstorms in surrounding regions. Section 4 summarizes the advantages and limitations of the proposed approach, along with potential directions for future work.

2. Data and Methods

2.1. Data

This study utilizes ERA5 reanalysis data released by the European Centre for Medium-Range Weather Forecasts (ECMWF) [29], covering the period from 1981 to 2023. The dataset employed features a spatial resolution of 2.5° × 2.5° with a temporal resolution of 6 h, and includes multiple meteorological variables such as SLP, surface pressure, and surface air temperature. To enhance the accuracy of anticyclone identification, the data were interpolated onto a T255 Gaussian grid with an approximate resolution of 0.7° × 0.7°. Daily snowfall and surface temperature data from Chinese meteorological stations are also used.

2.2. Methods: The New Anticyclone Identification Method Based on Mask R-CNN Model

To automatically and objectively identify the two-dimensional features of anticyclones, the Mask R-CNN model was introduced. Its workflow and an example are shown in Figure 1, which is divided into the following four steps:
(1)
Manual annotation: Manual analysis and identification were conducted for major anticyclone systems over the Mongolian Plateau region (40–55° N, 80–120° E) during winter seasons from 2008 to 2012. Specifically, the field of SLP over Eurasia (20–70° N, 0–180° E) at each timestamp was plotted as a figure, comprising 72 × 256 grid points. Then, according to the spatial distribution of SLP, the outermost SLP value of a single high-pressure system over the Mongolian Plateau region was manually determined to identify anticyclone systems with closed isobars. All grid points enclosed by the outermost closed isobar of each system were designated as the anticyclone’s influence area (for further methodological details, please refer to Zhang et al. [17]). This process generated a manually labeled dataset of anticyclone systems in these five years in winter, including their positions, shapes, and influence areas (manual labels shown in Figure 1, i.e., the dataset used for pre-training the Mask R-CNN model in step 2). Statistically, a total of 1671 anticyclones were manually annotated over the Mongolian Plateau during the winters from 2008 to 2012.
(2)
Mask R-CNN model pre-identification (that is, the pre-training phase illustrated at the top of Figure 1): The manually labeled 5-year anticyclone data were used to train the Mask R-CNN model. In this study, a GPU parallel computing architecture was employed, with the batch size set to 4, the number of epochs set to 30, the number of classes set to 2 (i.e., anticyclone and background), and the field of SLP over Eurasia at each timestamp was extracted and normalized into a grayscale image, with a size of 72 × 256 pixels by using the formula.
g = 255 × g G m i n G m a x G m i n
where g′ indicates the normalized SLP of each point or pixel, g denotes the original SLP of each point or pixel (unit: hPa), and Gmin and Gmax indicate the maximum and minimum values, respectively, within the SLP field of each timestamp. The grayscale normalization does not adversely affect identification, as anticyclones are typically represented as regions of higher SLP. In this study, brighter areas in the grayscale images generally correspond to anticyclones, which are distinct from the darker regions representing other meteorological features. Then, the model was initialized using pre-trained weights from the COCO dataset. The grayscale images and 5-year manual labels were used as inputs, leveraging transfer learning to enhance its capability for anticyclone detection. The number of steps per epoch was set to 10,000, and the validation steps were set to 5000 to mitigate overfitting. Finally, the fields of SLP (i.e., grayscale images) from 2013 to 2017 were input to the trained model to obtain the corresponding anticyclone identification results for each timestamp (expanded labels shown in Figure 1, i.e., one dataset used for re-training the Mask R-CNN model in step 4). Additionally, to ensure identification accuracy, only anticyclone detection results with a confidence level greater than 80% were retained.
(3)
Objective identification: Since manual identification focused on labeling large-scale anticyclones significantly impacting the Mongolian Plateau and surrounding areas, an objective weather system identification algorithm was additionally applied in this study to increase the number of anticyclone samples. This algorithm processes the SLP data directly to identify anticyclonic systems over Eurasia (20–70° N, 0–180° E), without the need for image conversion, a key distinction from deep learning-based methods. It locates the anticyclones by detecting the SLP maximum points on the original SLP data, and determines their area by searching the outer contour lines outward. For further methodological details, please refer to Lu [30]. This procedure generated another labeled anticyclone dataset using a traditional objective method, providing one of the inputs for re-training the Mask R-CNN model (labels by traditional objective method shown in Figure 1).
(4)
Mask R-CNN model re-training, and anticyclone re-identification: The anticyclone labels obtained from Step 2 (i.e., the results of Mask R-CNN model pre-trained by manual annotation) and Step 3 (i.e., the results of traditional objective methods), covering the period from 2013 to 2017, were integrated into a new anticyclone training dataset. Specifically, when two anticyclone labels overlapped, their union was taken as the new anticyclone label, and when one label entirely contained another, the larger-scale label was regarded as the new anticyclone label.
Then, the constructed dataset of anticyclones was input into the Mask R-CNN model for re-training based on the pre-trained weights. Finally, the grayscale images of SLP from 1981 to 2023 were input into the fully trained Mask R-CNN model to generate long-term anticyclone identification results.

3. Results

3.1. The Performance of the New Identification Method

Following the workflow shown in Figure 1, the Mask R-CNN model was first pre-trained using the manually labeled anticyclone dataset from 2008 to 2012. The outputs from the pre-trained model (i.e., expanded labels by Mask R-CNN model from 2013 to 2017) were then merged with the objective identification results (i.e., labels by traditional objective method from 2013 to 2017) to form a new training dataset. The Mask R-CNN model was subsequently retrained using this combined dataset. Finally, SLP data for each timestamp were individually input into the twice-trained Mask R-CNN model to obtain the final anticyclone identification results.
Figure 2 presents the results of anticyclone identification by the Mask R-CNN model at different timestamps. Based on fields of SLP at 12:00 UTC on 16 December 2022 (Figure 2a,c), a massive surface high-pressure system extending from the Balkhash-Baikal region to the Huang-Huai area was observed. This system exhibited distinct outer closed isobars and a well-shown anticyclonic wind field circulation, with the SLP value at its center exceeding 1035 hPa and reaching a maximum value of 1055 hPa. However, the objective identification method fragmented this system into three small-scale high-pressure systems (Figure 2b). Although each system possessed corresponding closed outer isobars, their adjacent wind fields lacked discernible anticyclonic circulation features, indicating deficiencies in representing anticyclone integrity and describing circulation patterns. In contrast, Mask R-CNN identified it as a unified large-scale anticyclone system whose influence area aligned substantially with the 1035 hPa isobar coverage, demonstrating greater performance in anticyclone identification.
Similarly, in the identification results for 06:00 UTC on 27 January 2023, the objective method identified the high-pressure system near Mongolia as five distinct small-scale high-pressure systems. These systems were closely clustered, with an average distance between them typically less than 700 km. In contrast, the Mask R-CNN model recognized the cluster as a single, coherent entity. The anticyclone identified by the model encompassed nearly the entire area characterized by SLP ≥ 1035 hPa and exhibited clear anticyclonic circulation in its vicinity, thereby better representing the integral characteristics of the anticyclone system.
Additionally, we utilized the matching ratio as a metric to evaluate the discrepancy between the results identified by the Mask R-CNN model and the manually annotated data, using the period from 2008 to 2012 as an example. The matching ratio is defined as the sum of the number of times in which both the Mask R-CNN model and manual annotation identified an anticyclone and the number of times in which neither method detected one, divided by the total number of time steps. Its formula is as follows:
m a t c h i n g r a d i o = T b o t h i d e n t i f i e d + T n e i t h e r i d e n t i f i e d T
Statistically, the average matching rate over the five-year period was 95.2%. The rate exceeded 90% in all individual years, reaching a maximum of 98.3%. Furthermore, compared with the manual annotations, the Mask R-CNN model detected an average of 7 additional anticyclones per year.
To demonstrate that the proposed method captures the two-dimensional characteristics of large-scale intense anticyclones more effectively than traditional objective identification methods, we quantified the number of small-scale anticyclones identified by the traditional method that were entirely enclosed within the large-scale anticyclones detected by the Mask R-CNN model. The ratio of these small-scale anticyclones to the total number of anticyclones identified by the traditional method was calculated. It was found that 7.3% of the results from 1981 to 2023 were incorporated into large-scale intense anticyclonic regions. This indicates that the Mask R-CNN model helps reduce the fragmentation rate in anticyclone identification.

3.2. The Application of the New Identification Method

3.2.1. Tracking the Development and Evolution of Anticyclones

Utilizing the anticyclone data generated by the new identification method, characteristic information of anticyclones over Eurasia at various timestamps can be obtained. Subsequently, anticyclone activity was tracked to derive their movement paths, thereby characterizing their development and evolution features (following the method described by Lu, 2017 [30]). Specifically, (1) anticyclone center detection, i.e., the grid point with a maximum value of SLP. The date, longitude, latitude, and SLP value for each grid point are recorded. (2) Based on the identified anticyclone center across successive timestamps, calculate their distance. If the distance between them in successive timestamps is less than 850 km, they are associated as belonging to the trajectory of the same anticyclone activity. Furthermore, the anticyclone activity with lifespans shorter than 12 h was excluded.
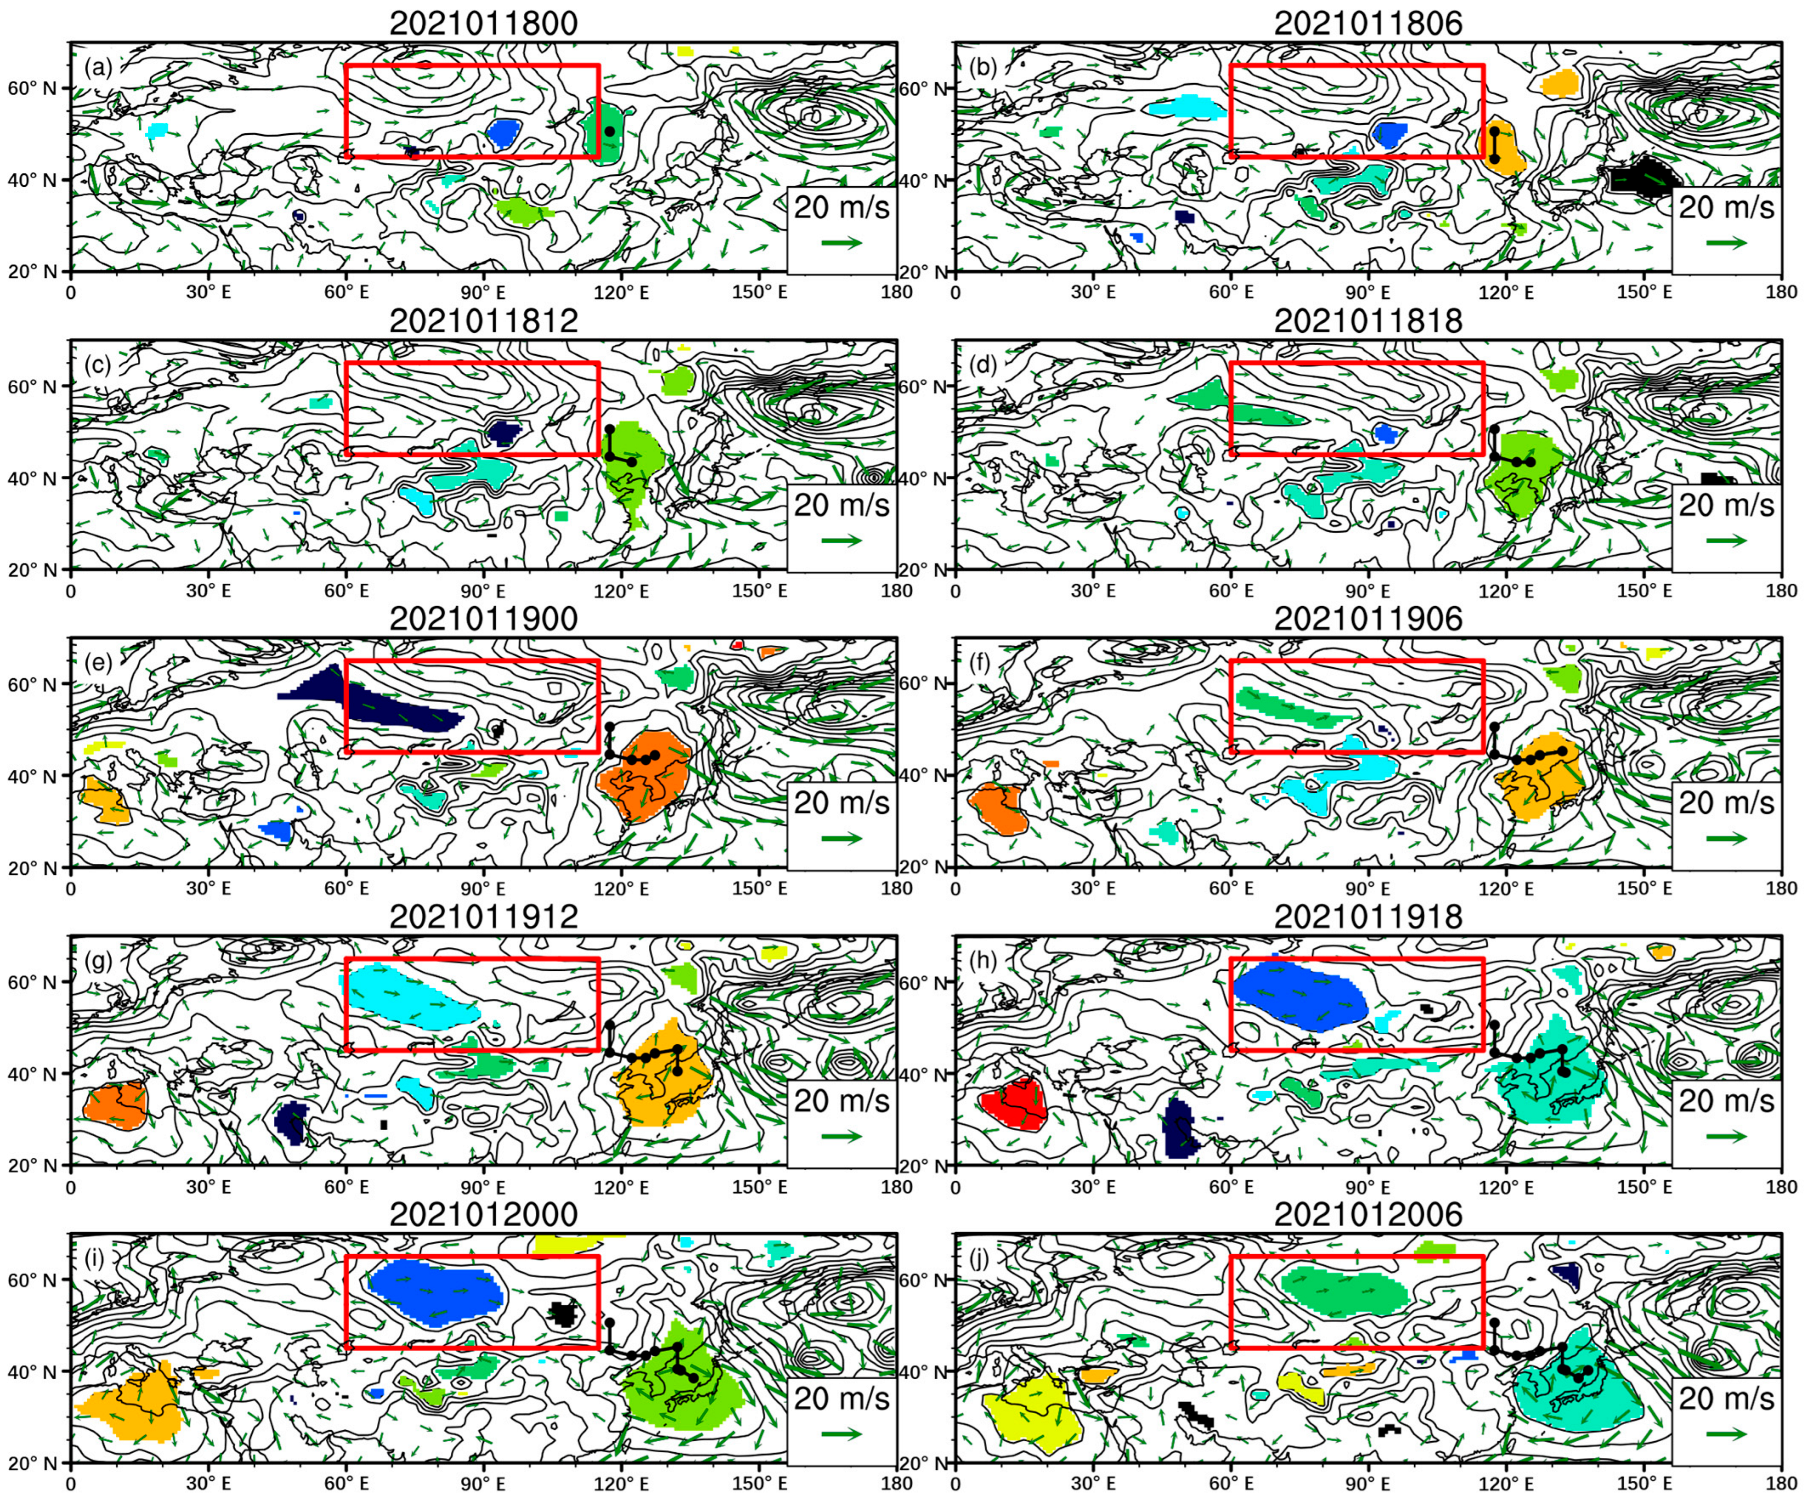
Taking an anticyclone activity located east of Lake Baikal at 00:00 UTC on 18 January 2021 as an example (Figure 3), we further analyze the efficacy of the new method for identifying and tracking anticyclone activity. This anticyclone system initially developed at 50.56° N, 117.42° E with a central SLP of 1033.77 hPa (Figure 3a). After 6 h (Figure 3b), the anticyclone migrated southward while its central SLP intensified to 1034.11 hPa. Subsequently, the system further developed and propagated eastward. By 00:00 UTC on 19 January 2021 (Figure 3e), the central pressure attained peak intensity (1036.97 hPa). The anticyclone then gradually weakened while moving southeastward and entered the oceanic domain. At 06:00 UTC on 20 January 2021 (Figure 3j), the center was positioned over the Sea of Japan. Due to the relatively warmer sea surface temperature compared to winter continental conditions, the cold anticyclone further weakened, reducing its central pressure to 1030.5 hPa. The system subsequently entered the Pacific Ocean and dissipated. This case demonstrates that the Mask R-CNN model successfully captured the spatial evolution and morphological changes during the anticyclone’s lifecycle. The horizontal profile of the anticyclone identified by this model corresponded well with the distribution of outermost closed SLP isobars, indicating robust performance in characterizing the two-dimensional structure of anticyclones.

3.2.2. Evolution Characteristics of an Anticyclone During a Cold Wave Event

The results above demonstrate that the new identification method performs well in capturing the shape, position, and influence area of anticyclone systems. In fact, synoptic-scale surface anticyclone activity constitutes an important component of the Siberian High, and its spatiotemporal evolution significantly influences regional climate variability. The trajectory of anticyclones, typically guided by northwesterly flows, corresponds to the southward intrusion of surface cold highs and is associated with the onset and development of cold wave events. Therefore, this new anticyclone identification method was applied to analyze cold high activity during a cold wave event and to evaluate its indicative role for the onset and development of the cold wave, to test its practical utility.
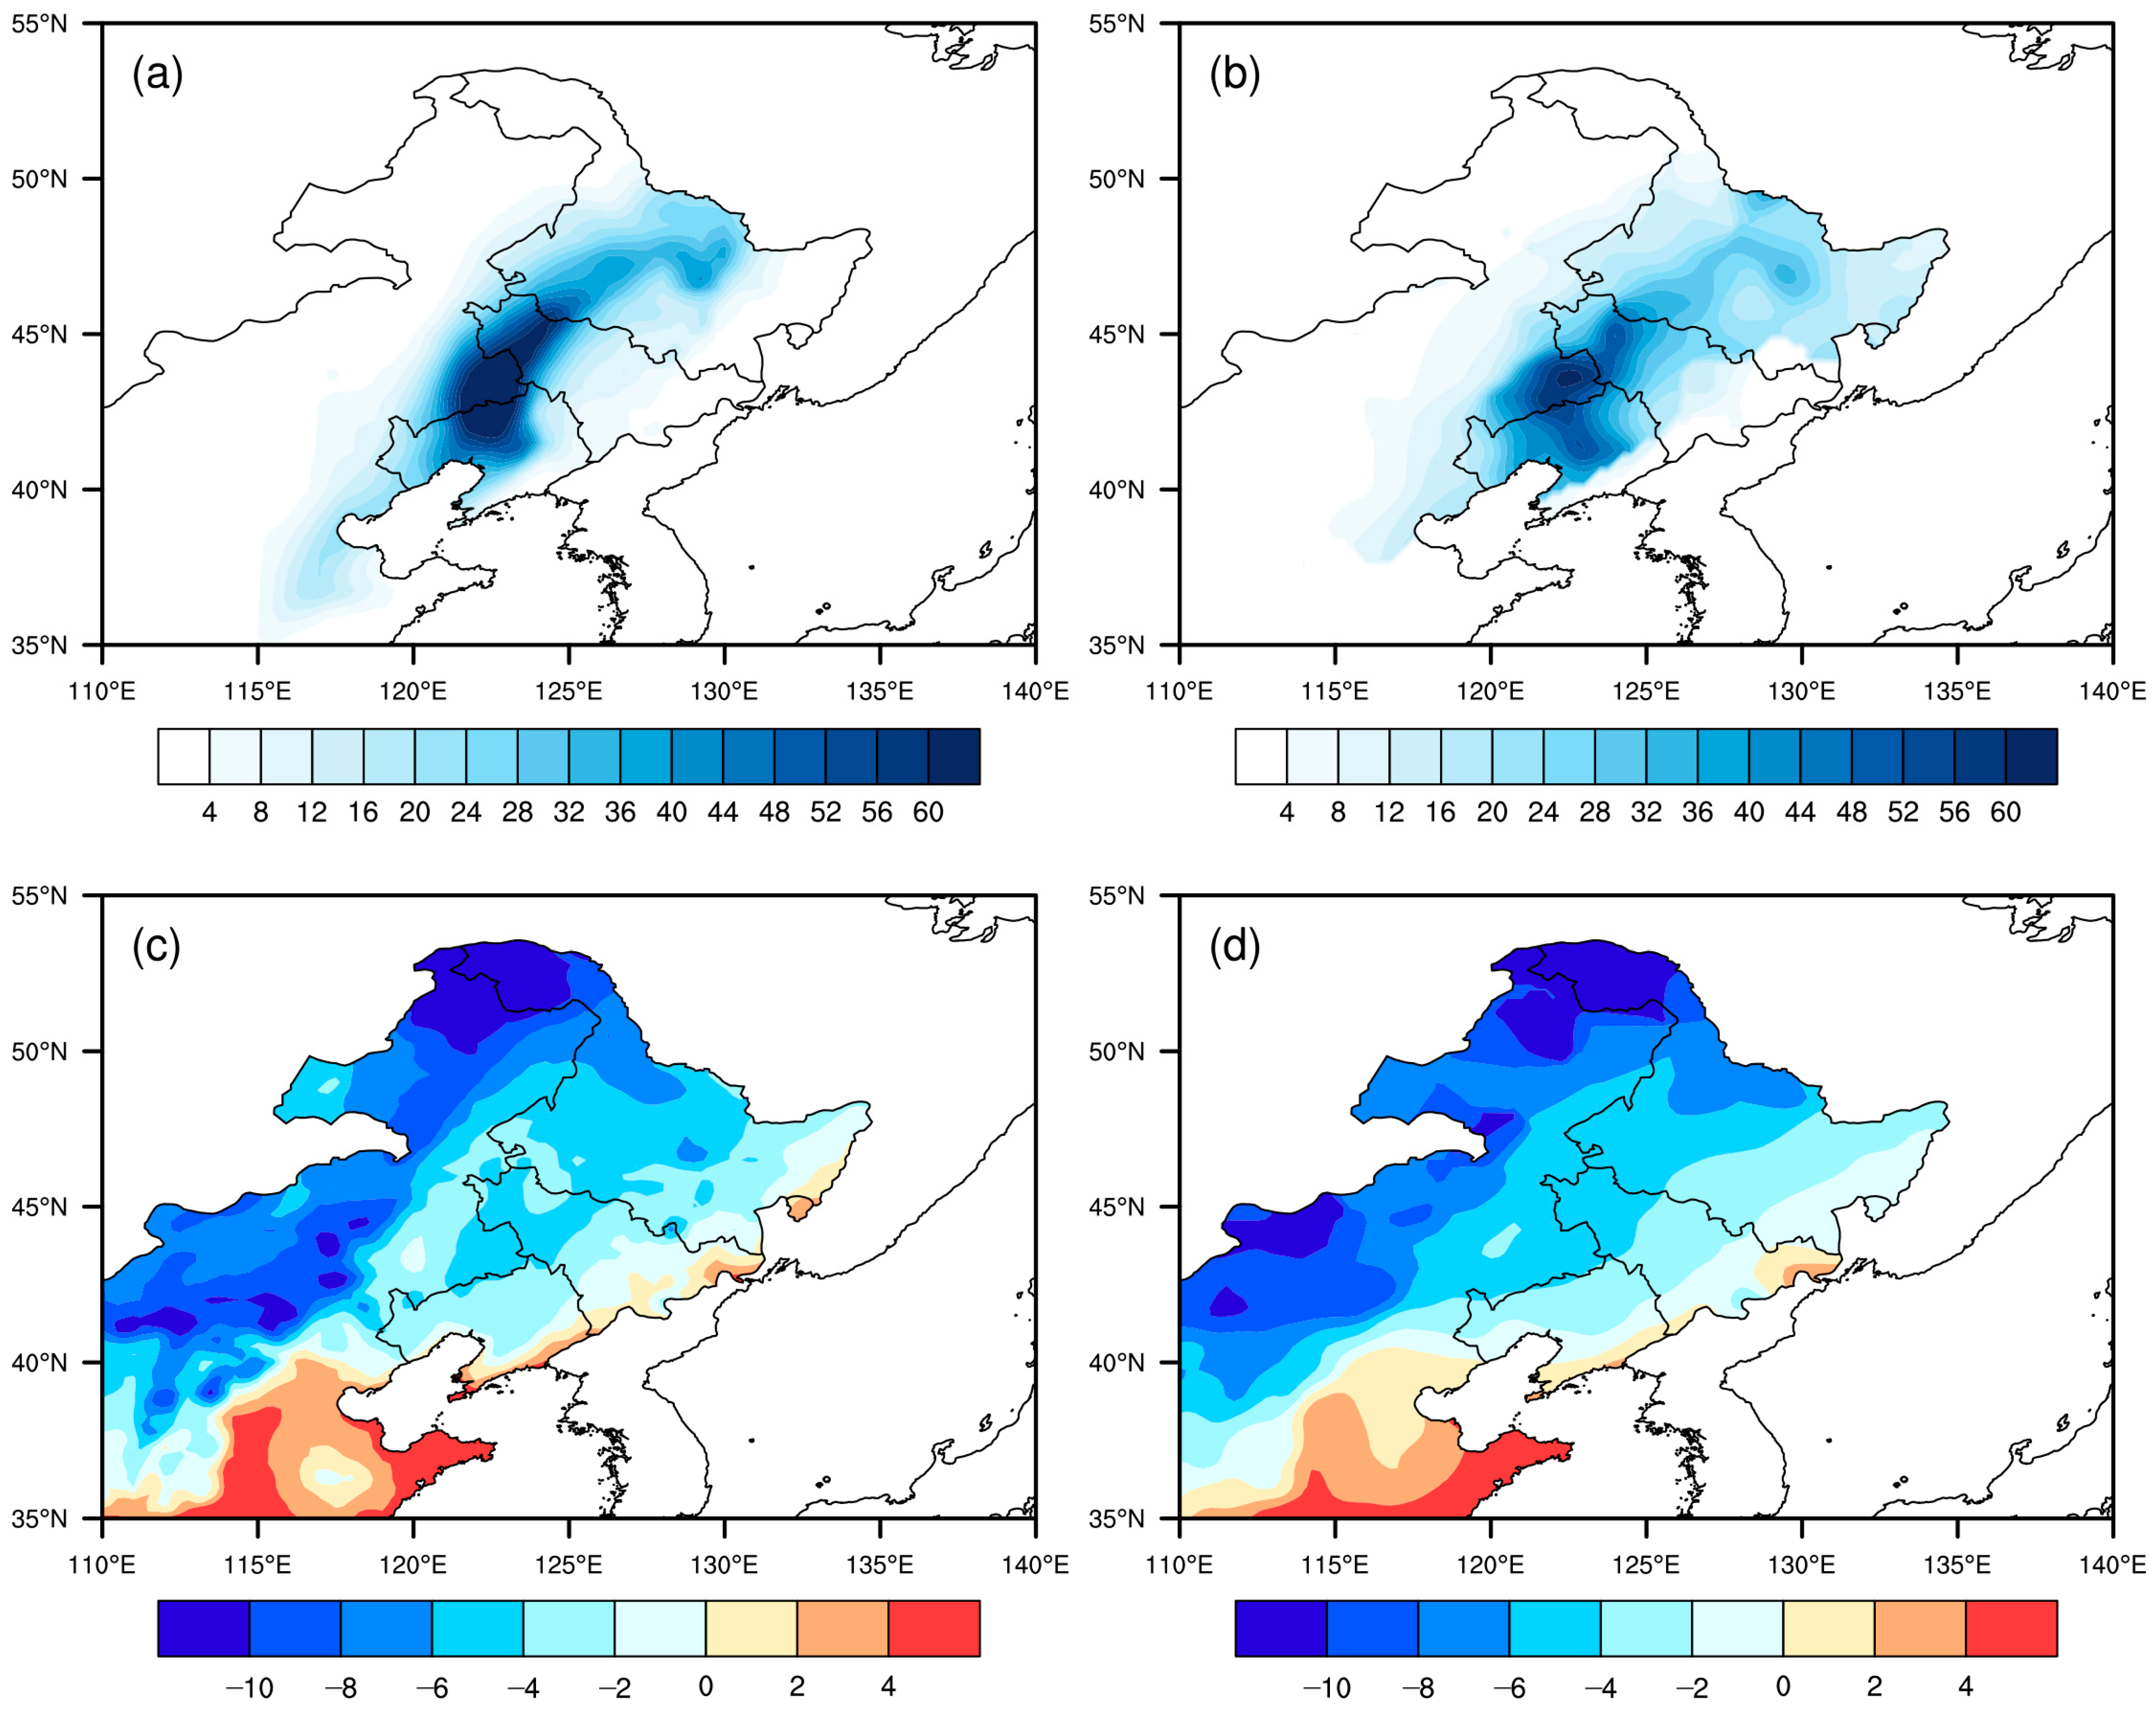
In early November 2021, Liaoning Province was affected by a rare compound extreme event, accompanied by freezing rain, heavy snowfall, a severe cold wave, and strong gales. Figure 4 presents the distribution of snowfall and surface temperature during 7–9 November 2021, revealing extensive heavy snowfall across Liaoning, Jilin, and Heilongjiang provinces. The snowfall maximum occurred near Shenyang city in Liaoning, western Jilin, as well as central Heilongjiang. During this cold wave episode, the cumulative snowfall exceeded that recorded during the extreme snowstorm on 4 March 2007, breaking meteorological records in Liaoning since 1951 [6]. Both station observations and the ERA5 reanalysis data accurately captured the intensity of this snowfall event, with maximum cumulative snowfall exceeding 50 mm. The ERA5 reanalysis demonstrates strong spatial consistency with station data in identifying heavy snow areas and snowfall intensity. Furthermore, the surface temperature distributions show good agreement between these two datasets.
Figure 5 presents the anticyclone identification results and their evolution progress during the precursor phase and mature stage of this cold wave event. As shown in Figure 5, on 2 November 2021, an anticyclone was situated near the Ural Mountains, exhibiting a central pressure of 1035.16 hPa. The anticyclone subsequently extended southeastward while expanding its spatial influence area and intensifying continuously. By 5 November 2021, it covered 43.8% of the Siberian region with a strengthened central SLP of 1051.02 hPa. The system then propagated toward central and eastern China, peaking in intensity on 6 November 2021 (1055.2 hPa) and persisting for several days over southern Siberia and upstream regions of Northeast China.
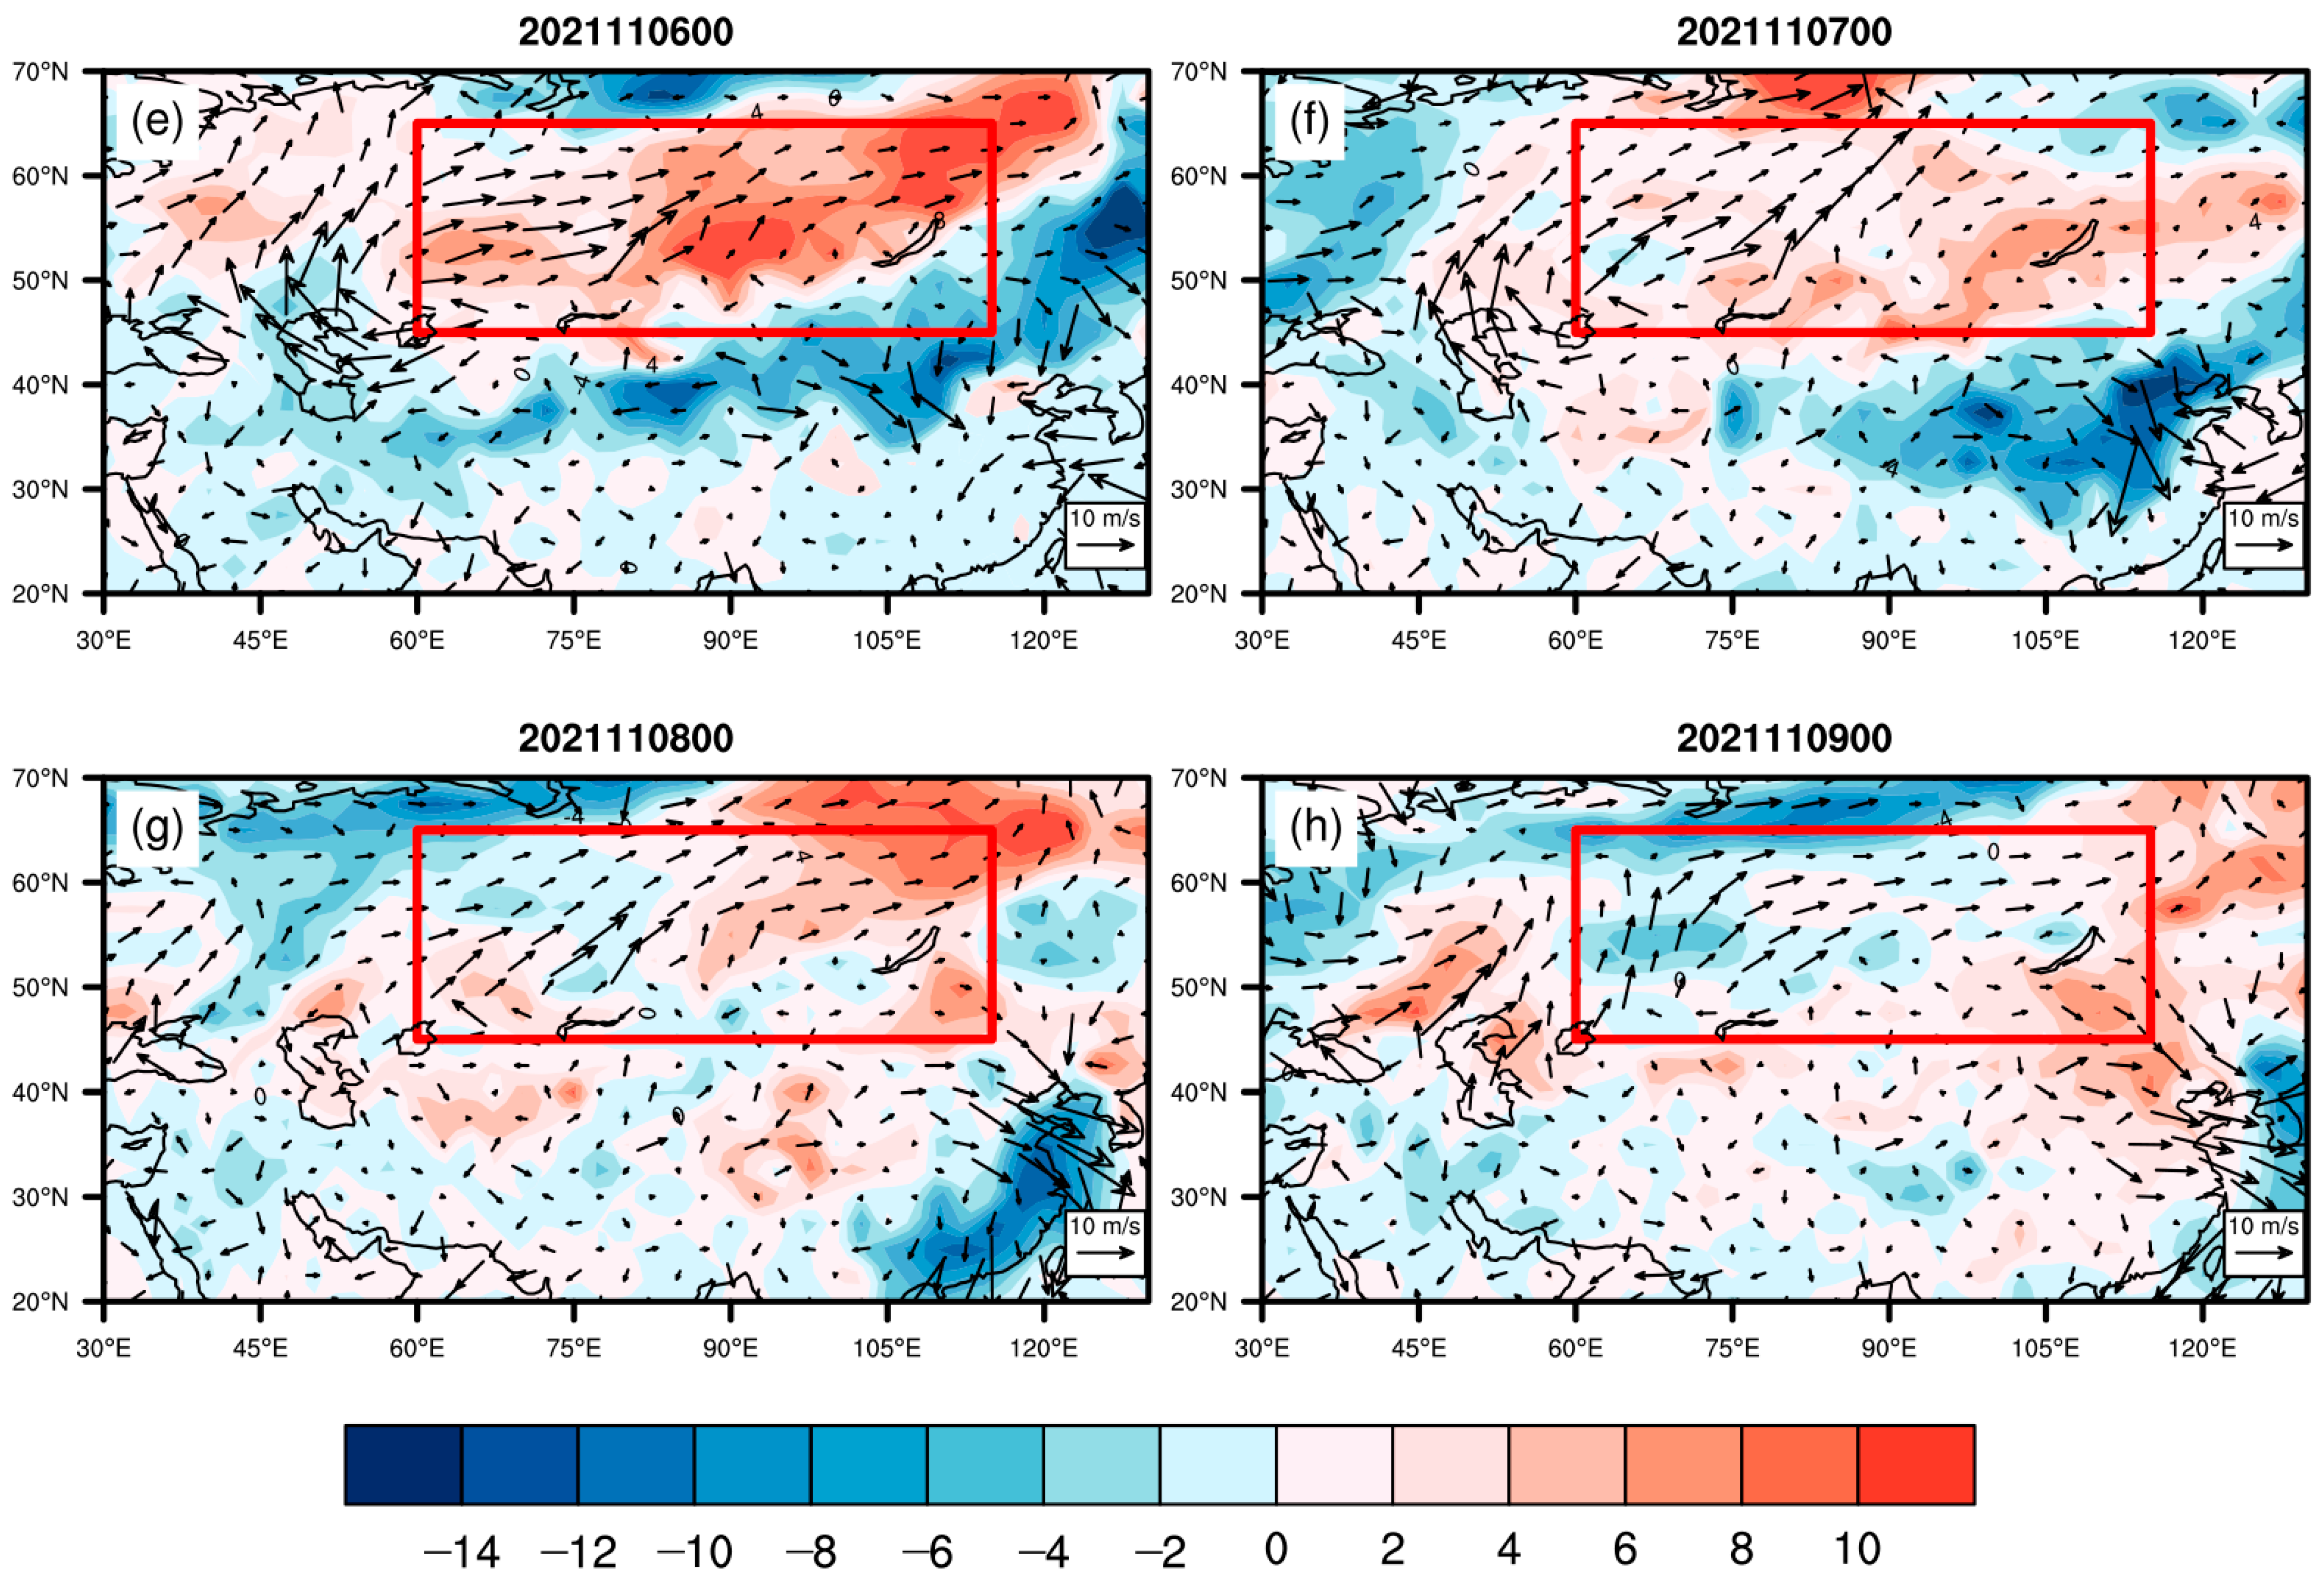
The new method distinctly reveals that although the horizontal extent of this anticyclone contracted moderately, its core migrated eastward while extending southeastward and intensifying. Under sustained forcing from this upstream system, the East Asian winter monsoon amplified substantially. Cold air advection along the high’s southeastern flank, driven by robust northerly flow, triggered widespread abrupt cooling across Northeast and North China during 5–6 November (Figure 6d,e), with 24 h temperature declines reaching 6 °C. This is beneficial to extreme snowfall and cold wave conditions in Northeast China from 7 to 9 November. Subsequently, during 7–8 November, the anticyclone migrated southeastward, accompanied by extreme 24 h cooling events over Jiangnan and South China, with localized temperature decreases ranging from 8 to 14 °C (Figure 6f,g). Following the fragmentation and filling of this anticyclone activity, the penetration of cold air ceased. This led to stabilized atmospheric conditions and a slight temperature recovery across most regions by 9 November (Figure 6h). This demonstrates that the anticyclone domains identified by the new method exhibit strong spatial correspondence with cooling regions. The trajectory of the anticyclone is closely linked to cold-air development and cold wave evolution, effectively capturing downstream weather responses.
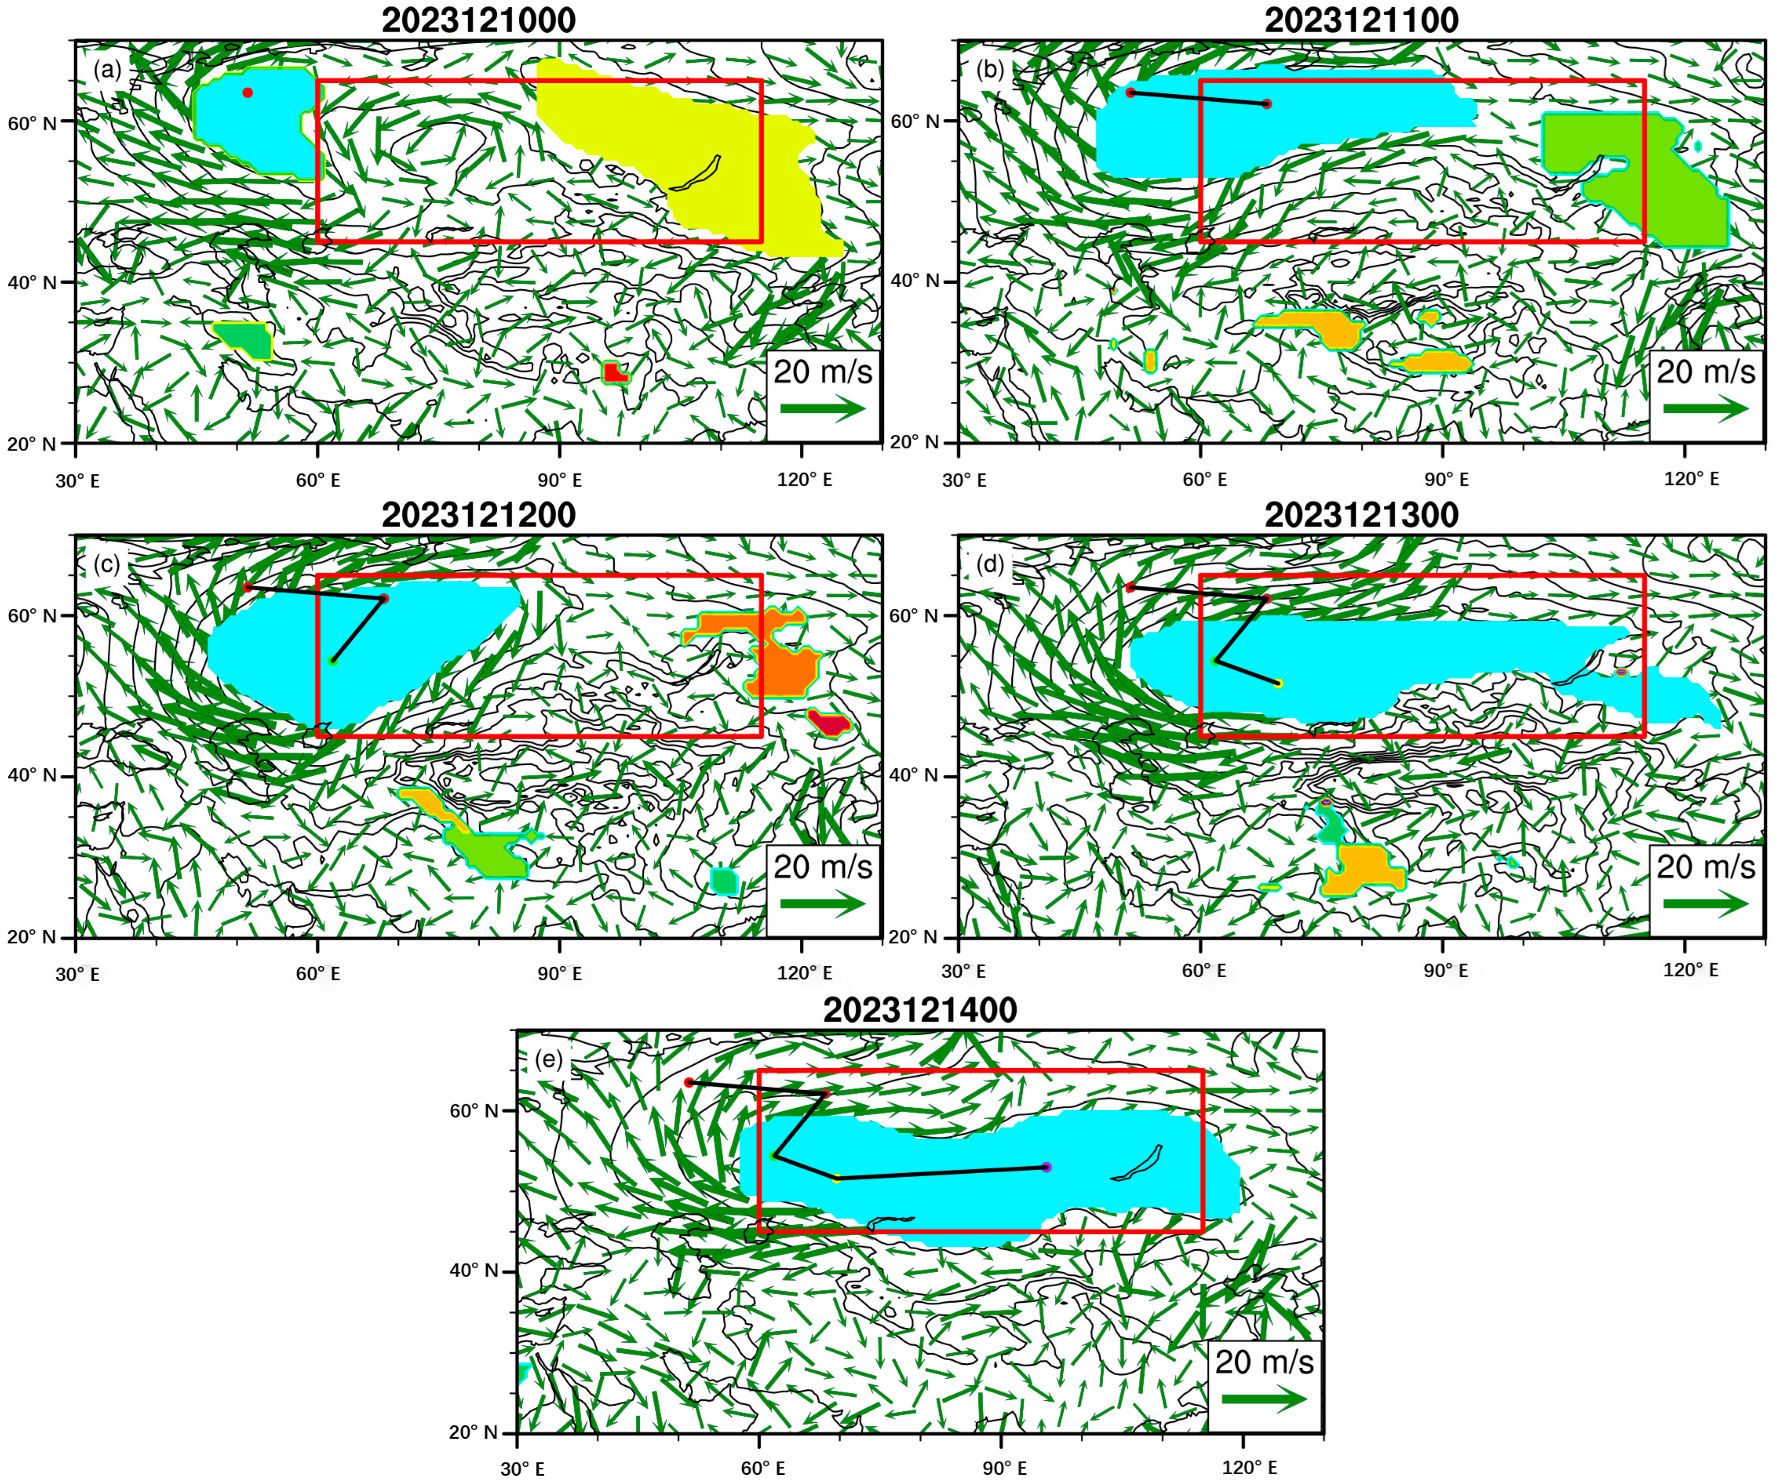
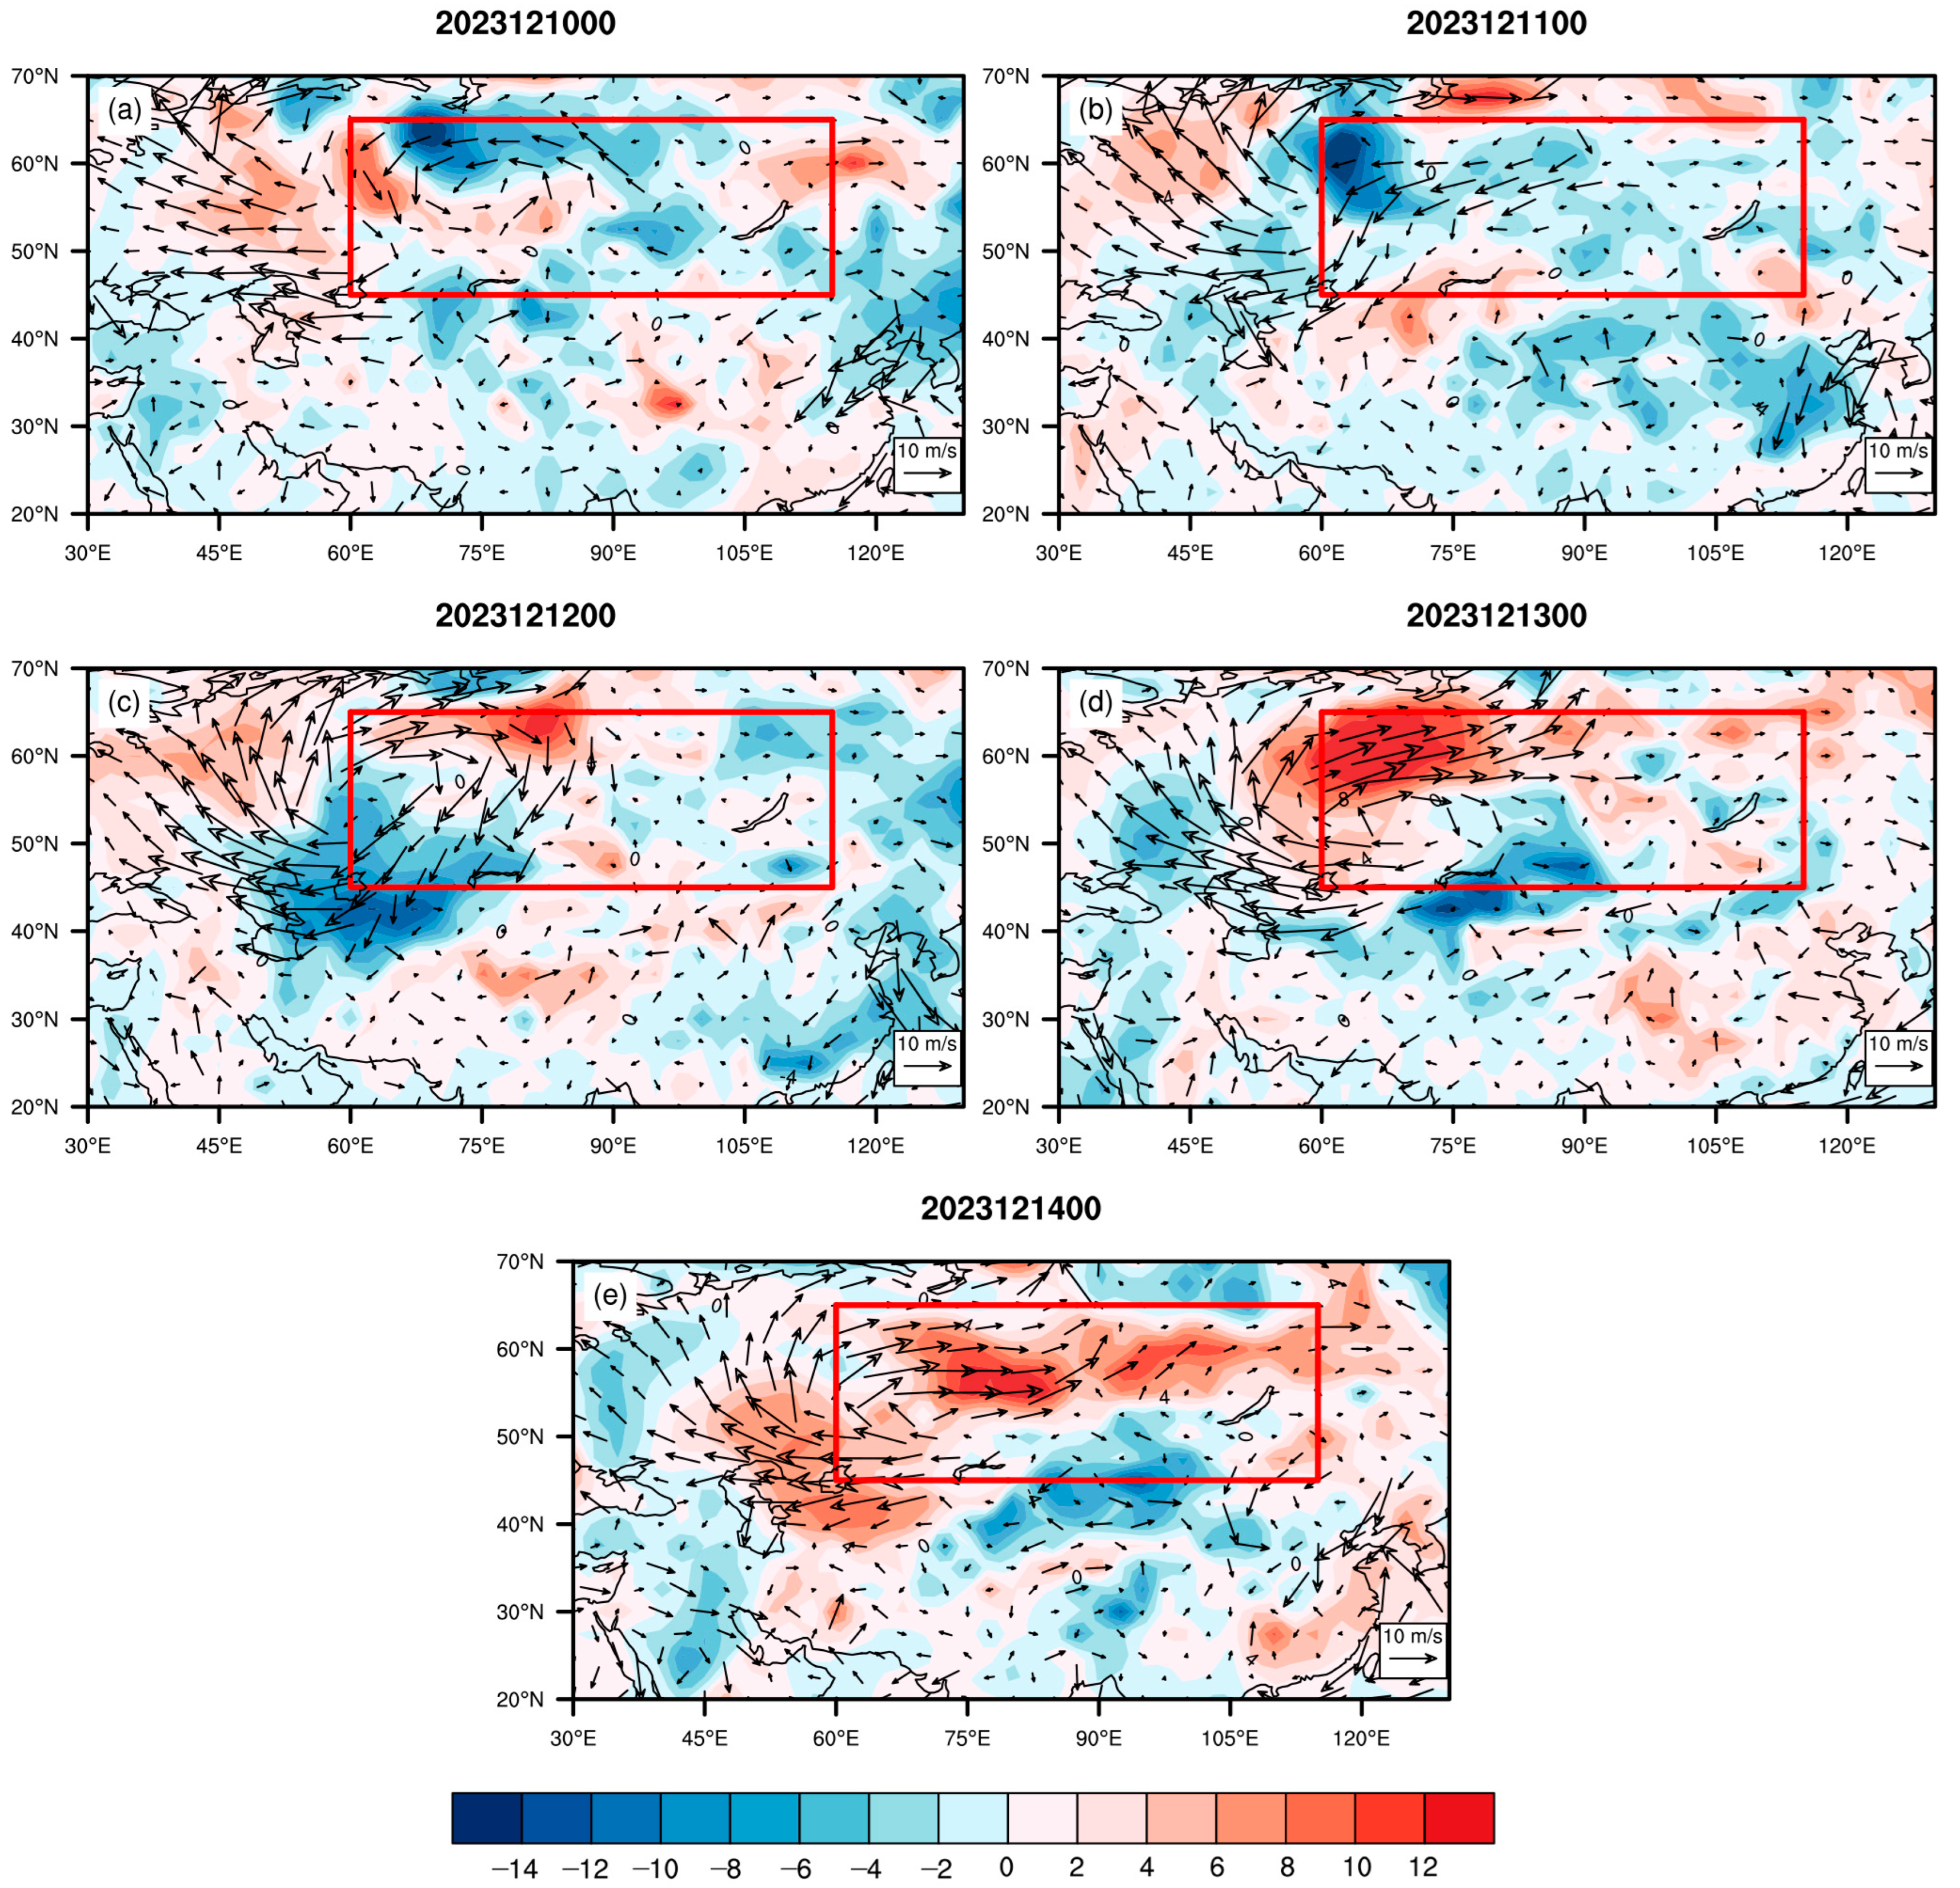
An additional recent cold wave case was also analyzed. From 12 to 14 December 2023, a snowfall and cold wave event occurred in the Beijing-Tianjin-Hebei region and northwestern Shandong Province. According to station observations, the area of heaviest snowfall was primarily located near the border between Hebei and Shandong (Figure 7b), with a maximum cumulative snowfall of 18 mm. ERA5 reanalysis data are largely consistent with observations and reveal a secondary snowfall center in eastern Liaoning Province, with approximately 10 mm of cumulative snowfall (Figure 7a). Although less intense than the event of 2–9 November 2021, this episode featured lower surface temperatures across northern China (Figure 7c,d). Figure 8 illustrates the evolution of precursor anticyclonic activity associated with the cold wave. A relatively weak, small-scale anticyclone was initially observed near the Ural Mountains on December 10. It subsequently intensified, expanded, and moved southeastward, persisting over Siberia during 13–14 December. A noticeable temperature decrease occurred over the Beijing–Tianjin–Hebei and Shandong regions on 11–12 December, consistent with the anticyclone’s development (Figure 9). The Mask R-CNN model accurately captured the antecedent anticyclonic activity linked to this cold wave.

3.3. The Relationship Between Anticyclone and Regional Abnormal Cooling

The preceding analysis reveals that during the development of Siberian anticyclones, these systems transport cold air southeastward, typically inducing cooling and snow-ice events in southeastern and downstream regions. Therefore, the North, Central, and East China domain (30–50° N, 100–120° E) was selected to examine linkages between the Siberian High and regional cooling anomalies during winter. Using the identified two-dimensional anticyclone structure, the horizontal spatial coverage of each anticyclone was quantified. An anticyclone was classified as a Siberian anticyclone if it satisfied both criteria: (1) its SLP center was located within the Siberian sector (45–65° N, 60–115° E), (2) its coverage exceeded 25% of the area within the Siberian region.
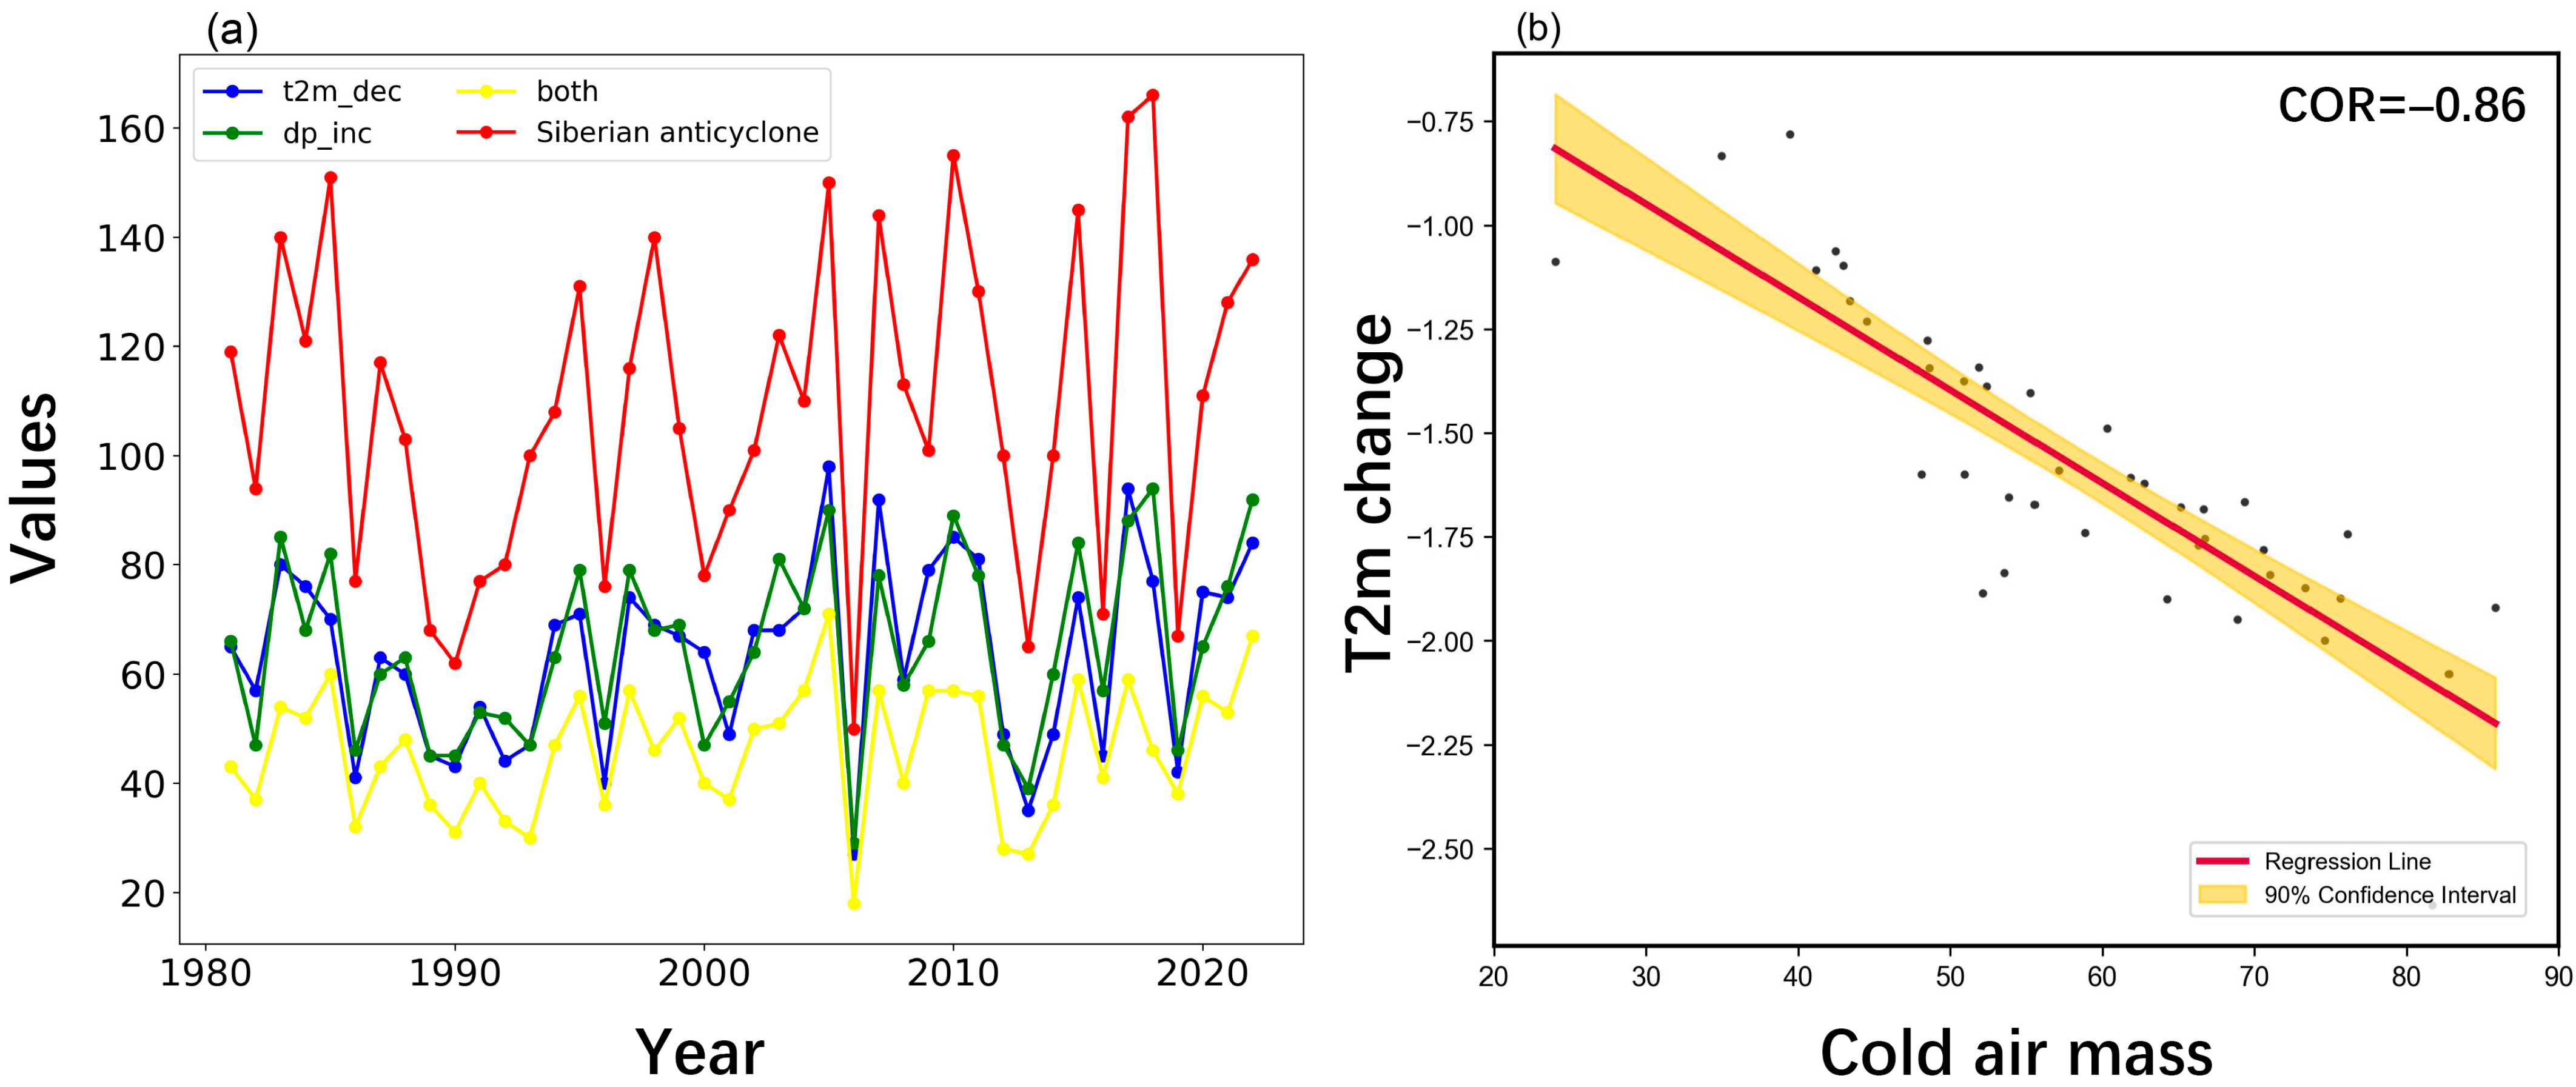
During the occurrence of the Siberian anticyclone, the 24 h increase in cold air mass (CAM) transported at corresponding grid points, the frequency of CAM enhancement days, the 24 h reduction in 2 m temperature (t2m), and the frequency of cooling days in downstream regions, including North China, Central China, and East China, were further quantified. Results indicate that during the winter of 1981/1982–2022/2023, the Siberian High occurred at an average frequency of 109 times annually (Figure 10a). On 60% of these days, downstream CAM enhancement and regional cooling were observed. The time series of Siberian High influence days exhibited high correlation with regional CAM enhancement (r = 0.88) and cooling (r = 0.92), both statistically significant at p < 0.01. This demonstrates a robust linkage between winter Siberian anticyclone activity and downstream CAM accumulation with regional cooling. To validate the relationship between Siberian High-transported CAM and regional cooling, Figure 10b displays the regression of regional 24 h temperature decrease against anticyclone-transported CAM enhancement. A significant negative correlation (r = −0.86, p < 0.01) confirms that variations in CAM volume transported by Siberian Highs directly induce downstream temperature changes.

4. Conclusions and Discussion

This study presents a new anticyclone identification method based on the Mask R-CNN model, enabling automated detection of two-dimensional structural features of Eurasian anticyclones in SLP fields. The approach clarifies connections between morphological changes in anticyclones, cold-air activity, and regional cold wave events. The principal findings are as follows:
(1)
Compared with the identification results by the traditional objective method, this method effectively detects anticyclones that more accurately represent their comprehensive structural characteristics. Statistically, the average matching radio from 2008 to 2012 was 95.2%. It robustly identifies large-scale, intense anticyclones that substantially influence synoptic-scale weather conditions and are consistently linked to well-defined anticyclonic circulation patterns, especially for anticyclones over Siberia and Mongolia.
(2)
The anticyclone systems identified and tracked by this new method effectively characterize the development and movement trajectories of cold-air activity, offering significant indicative value for cold wave processes and severe weather events such as abrupt cooling and snowfall. Applied to the 7–9 November 2021 cold wave case, this method detected anticyclone precursor activity originating near the Ural Mountains on 2 November, followed by continuous southeastward extension and propagation. The system persisted over southern Siberia and upstream regions of Northeast China during 6–9 November, inducing widespread drastic cooling across Northeast and North China. For the cold wave case occurring from December 12 to 14, 2023, a significant anticyclone activity was also detected in the preceding period. These results demonstrate the method’s capability to infer cold-air development and cold wave evolution through the identification and tracking of anticyclone dynamics and cold high characteristics, thereby providing critical technical support for weather forecasting, traffic management optimization, and early warning decisions in northern Chinese cities.
(3)
Further analysis reveals significant associations between Siberian anticyclone activity and downstream temperature (or CAM) variations in China’s North, Central, and East regions. During the winter of 1981/1982–2022/2023, Siberian High events occurred at an average frequency of 109 occurrences annually, with downstream 24 h CAM enhancement and cooling observed concurrently on 60% of event days. The time series of Siberian High influence days showed strong correlations with regional CAM enhancement (r = 0.88) and cooling (r = 0.92), both statistically significant (p < 0.01). Additionally, a significant negative correlation (r = −0.86, p < 0.01) exists between 24 h cooling magnitude and anticyclone-transported CAM enhancement. These results confirm the important influence of Siberian anticyclone activity on downstream CAM accumulation and regional cooling, which is closely related to cold-air activity and winter cold wave processes.
The new anticyclone identification method proposed in this study enables accurate detection of anticyclone activity across Eurasia, thereby establishing a foundation for analyzing cold-air activity and its impacts on downstream weather. Compared to the traditional objective identification method and manual annotation, the proposed method more effectively captures the overall structural features of large-scale anticyclones. However, this study has not explored the potential of applying a similar training strategy to other deep learning models, such as DETR. The effectiveness of this approach in different architectural contexts remains uncertain and represents a valuable direction for future research. Additionally, this study investigates the influence of precursor anticyclonic activity on two intense cold wave events, providing important guidance for disaster prevention and early warning in northern Chinese cities. Future research could leverage the anticyclone identification results to conduct further statistical analyses of the underlying mechanisms between these phenomena, to address practical challenges such as ice and snow disaster mitigation on highways and railways in these regions.

Author Contributions

Conceptualization, H.W.; Formal analysis, Y.K. and P.X.; Supervision, H.W.; Writing—original draft, Y.K. and Y.Z. All authors have read and agreed to the published version of the manuscript.

Funding

This research was jointly funded by China State Railway Group Science and Technology Research and Development Program (N2024T008), Guangdong basic and applied basic research foundation (2024A1515510002), and Wuxi University Research Start-up Fund for High-level Talents (2025r061).

Institutional Review Board Statement

Not applicable.

Informed Consent Statement

Not applicable.

Data Availability Statement

ERA5 reanalysis data were available from the European Centre for Medium-Range Weather Forecasts (ECMWF, Hersbach et al., 2020 [29], https://cds.climate.copernicus.eu/cdsapp#!/dataset/reanalysis-era5-single-levels?tab=overview, accessed on 25 August 2025, or https://cds.climate.copernicus.eu/cdsapp#!/dataset/reanalysis-era5-pressure-levels?tab=overview, accessed on 25 August 2025).

Conflicts of Interest

The authors declare no conflicts of interest.

Abbreviations

The following abbreviations are used in this manuscript:
CNNConvolutional neural network
Mask R-CNNMask region-based convolutional neural network
SLPSea level pressure
CAMCold air mass

References

  1. Guirguis, K.; Gershunov, A.; Schwartz, R.; Bennett, S. Recent warm and cold daily winter temperature extremes in the Northern Hemisphere. Geophys. Res. Lett. 2011, 38, L17701. [Google Scholar] [CrossRef]
  2. Cohen, J.L.; Furtado, J.C.; Barlow, M.A.; Alexeev, V.A.; Cherry, J.E. Arctic warming, increasing snow cover and widespread boreal winter cooling. Environ. Res. Lett. 2012, 7, 014007. [Google Scholar] [CrossRef]
  3. Wang, L.; Chen, W. The East Asian winter monsoon: Re-amplification in the mid-2000s. Chin. Sci. Bull. 2014, 59, 430–436. [Google Scholar] [CrossRef]
  4. Lu, C.; Xie, S.; Qin, Y.; Zhou, J. Recent Intensified Winter Coldness in the Mid-High Latitudes of Eurasia and Its Relationship with Daily Extreme Low Temperature Variability. Adv. Meteorol. 2016, 2016, 3679291. [Google Scholar] [CrossRef]
  5. Peng, J.; Sun, S.; Chen, B. Maintenance and development of Ural blocking high and its relationship with severe cold wave activities in 2020/2021 winter. Chin. J. Atmos. Sci. 2023, 47, 1421–1433. (In Chinese) [Google Scholar]
  6. Gao, Q.; Jin, W.; Gao, Q.; Xu, Q.; Tian, L.; Liu, D.; Han, G. Diagnostic analysis of the extreme rain-snow process in Liaoning province from November 7–9, 2021. J. Meteorol. Environ. 2024, 40, 1–8. (In Chinese) [Google Scholar] [CrossRef]
  7. Ioannidou, L.; Yau, M.K. A climatology of the Northern Hemisphere winter anticyclones. J. Geophys. Res. Atmos. 2008, 113, D08119. [Google Scholar] [CrossRef]
  8. Zhang, X.; Lu, C.; Guan, Z. Weakened cyclones, intensified anticyclones and recent extreme cold winter weather events in Eurasia. Environ. Res. Lett. 2012, 7, 044044. [Google Scholar] [CrossRef]
  9. Lu, C.; Zhang, Y.; Guan, Z. Winter anticyclone activities in Siberia and their relationship to the regional temperature anomaly. Int. J. Climatol. 2022, 42, 6293–6310. [Google Scholar] [CrossRef]
  10. Qin, Y.J.; Lu, C.H. Characteristics of the anticyclone over Eurasia and its relationship with the winter temperature in China. Trans. Atmos. Sci. 2017, 40, 418–424. (In Chinese) [Google Scholar]
  11. Zhi, X.; Tian, X.; Liu, P.; Hu, Y. Interdecadal variations in winter extratropical anticyclones in East Asia and their impacts on the decadal mode of East Asian surface air temperature. Meteorol. Atmos. Phys. 2019, 131, 1763–1775. [Google Scholar] [CrossRef]
  12. LeCun, Y.; Bengio, Y.; Hinton, G. Deep learning. Nature 2015, 521, 436–444. [Google Scholar] [CrossRef] [PubMed]
  13. He, K.; Gkioxari, G.; Dollár, P.; Girshick, R. Mask r-cnn. In Proceedings of the IEEE International Conference on Computer Vision, Venice, Italy, 22–29 October 2017; pp. 2961–2969. [Google Scholar] [CrossRef]
  14. Kirillov, A.; He, K.; Girshick, R.; Rother, C.; Dollár, P. Panoptic segmentation. In Proceedings of the IEEE/CVF Conference on Computer Vision and Pattern Recognition, Long Beach, CA, USA, 15–20 June 2019; pp. 9404–9413. [Google Scholar] [CrossRef]
  15. Hong, S.; Kim, S.; Joh, M.; Song, S.K. Globenet: Convolutional neural networks for typhoon eye tracking from remote sensing imagery. arXiv 2017, arXiv:1708.03417. [Google Scholar] [CrossRef]
  16. Lu, C.H.; Kong, Y.; Guan, Z.Y. A Mask R-CNN model for reidentifying extratropical cyclones based on quasi-supervised thought. Sci. Rep. 2020, 10, 15011. [Google Scholar] [CrossRef]
  17. Zhang, Y.; Lu, C. Detection of the synoptic southeastward-extending Siberian cold high during 1978–2017. Atmos. Ocean. Sci. Lett. 2022, 15, 100140. [Google Scholar] [CrossRef]
  18. Kong, Y.; Lu, C.; Guan, Z.; Chen, X. Comparison of intense summer arctic cyclones between the marginal ice zone and central arctic. J. Geophys. Res. Atmos. 2024, 129, e2023JD039620. [Google Scholar] [CrossRef]
  19. Qin, Y.; Liu, Q.; Lu, C. Cold Front Identification Using the DETR Model with Satellite Cloud Imagery. Remote Sens. 2024, 17, 36. [Google Scholar] [CrossRef]
  20. Abdulla, N.; Demirci, M.; Ozdemir, S. Design and evaluation of adaptive deep learning models for weather forecasting. Eng. Appl. Artif. Intell. 2022, 116, 105440. [Google Scholar] [CrossRef]
  21. Bochenek, B.; Ustrnul, Z. Machine learning in weather prediction and climate analyses—Applications and perspectives. Atmosphere 2022, 13, 180. [Google Scholar] [CrossRef]
  22. Zhou, K.; Zheng, Y.; Li, B.; Dong, W.; Zhang, X. Forecasting different types of convective weather: A deep learning approach. J. Meteorol. Res. 2019, 33, 797–809. [Google Scholar] [CrossRef]
  23. Chen, L.; Han, B.; Wang, X.; Zhao, J.; Yang, W.; Yang, Z. Machine learning methods in weather and climate applications: A survey. Appl. Sci. 2023, 13, 12019. [Google Scholar] [CrossRef]
  24. Higgins, T.B.; Subramanian, A.C.; Graubner, A.; Kapp-Schwoerer, L.; Watson, P.A.; Sparrow, S.; Kashinath, K.; Kim, S.; Monache, L.D.; Chapman, W. Using deep learning for an analysis of atmospheric rivers in a high-resolution large ensemble climate data set. J. Adv. Model. Earth Syst. 2023, 15, e2022MS003495. [Google Scholar] [CrossRef]
  25. Ghada, W.; Estrella, N.; Menzel, A. Machine learning approach to classify rain type based on Thies disdrometers and cloud observations. Atmosphere 2019, 10, 251. [Google Scholar] [CrossRef]
  26. Kalkan, M.; Bostancı, G.E.; Güzel, M.S.; Kalkan, B.; Özsarı, Ş.; Soysal, Ö.; Köse, G. Cloudy/clear weather classification using deep learning techniques with cloud images. Comput. Electr. Eng. 2022, 102, 108271. [Google Scholar] [CrossRef]
  27. Deng, J.; Dong, W.; Socher, R.; Li, L.J.; Li, K.; Fei-Fei, L. Imagenet: A large-scale hierarchical image database. In Proceedings of the 2009 IEEE Conference on Computer Vision and Pattern Recognition, Miami, FL, USA, 20–25 June 2009; pp. 248–255. [Google Scholar] [CrossRef]
  28. Ren, S.; He, K.; Girshick, R.; Sun, J. Faster r-cnn: Towards real-time object detection with region proposal networks. IEEE Trans. Pattern Anal. Mach. Intell. 2016, 39, 1137–1149. [Google Scholar] [CrossRef]
  29. Hersbach, H.; Bell, B.; Berrisford, P.; Hirahara, S.; Horányi, A.; Muñoz-Sabater, J.; Nicolas, J.; Peubey, C.; Radu, R.; Schepers, D.; et al. The ERA5 global reanalysis. Q. J. R. Meteorol. Soc. 2020, 146, 1999–2049. [Google Scholar] [CrossRef]
  30. Lu, C.H. A modified algorithm for identifying and tracking extratropical cyclones. Adv. Atmos. Sci. 2017, 34, 909–924. [Google Scholar] [CrossRef]
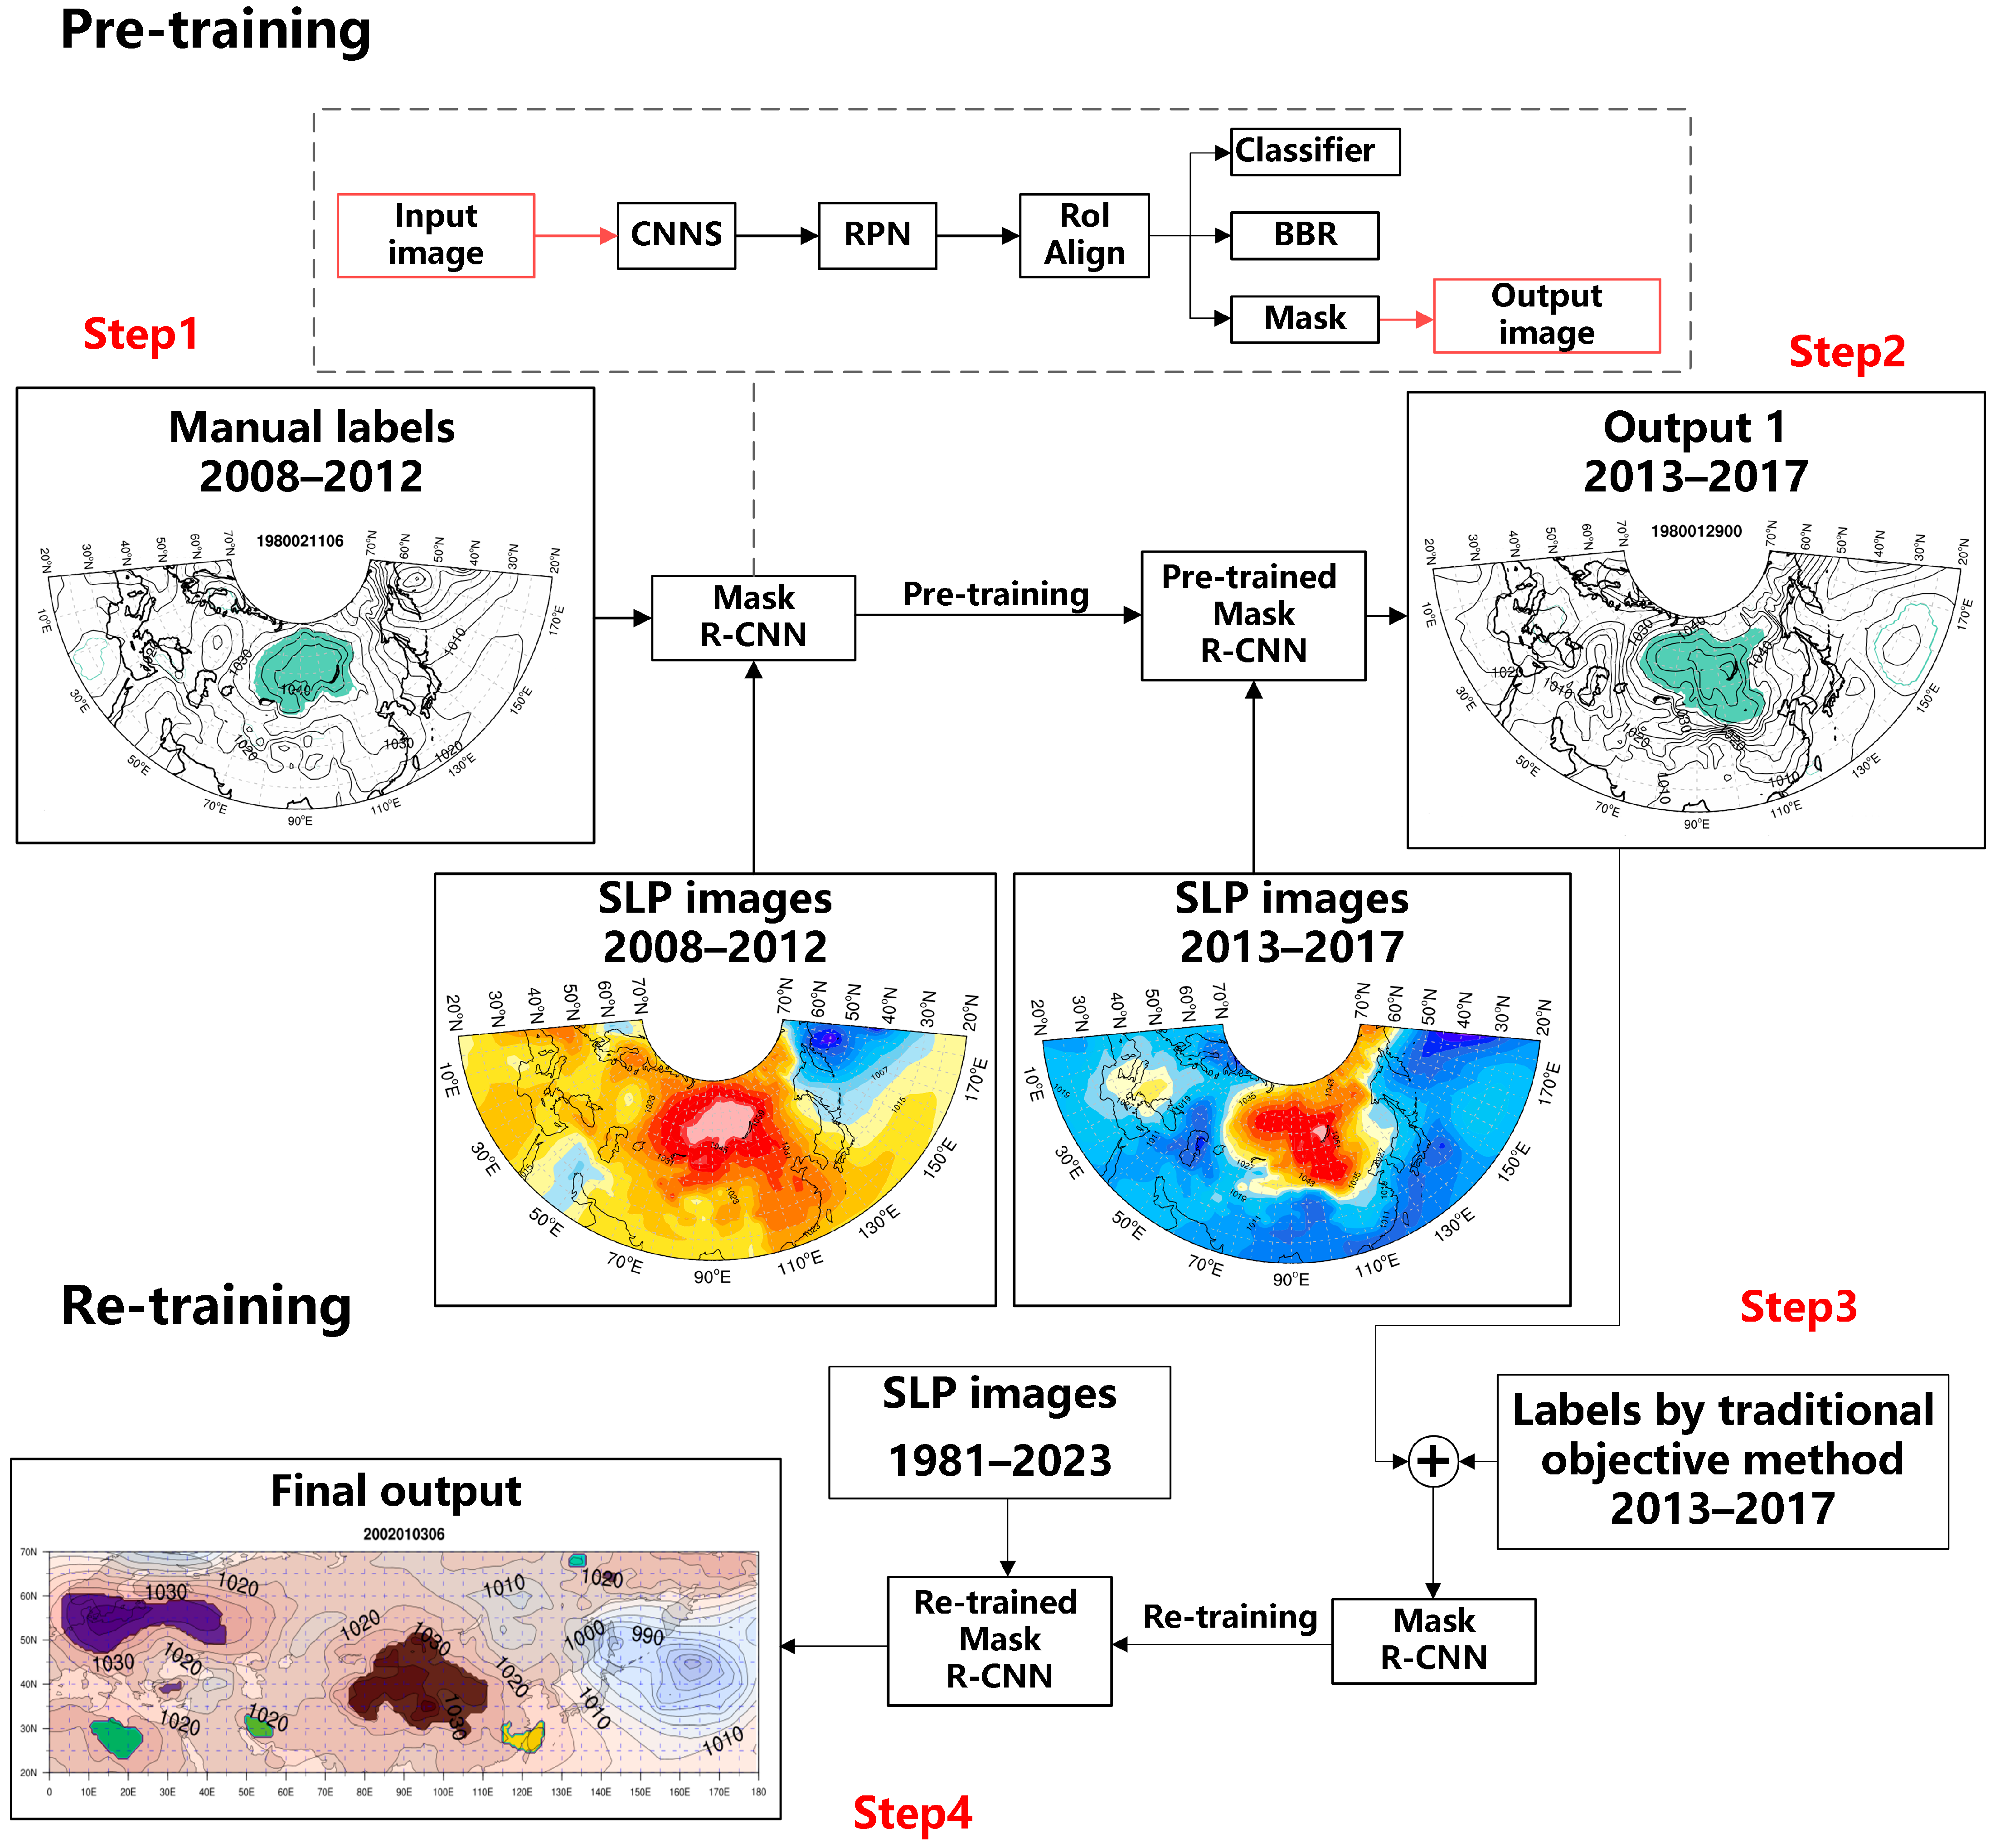
Figure 1. The process of anticyclone identification based on the Mask-R-CNN model. The upper gray dashed box shows a simplified structure of the Mask R-CNN model. “Manual labels” represents anticyclone identification data generated by manual annotation in step 1, “Output1” represents output by the pre-trained Mask R-CNN model in step 2, “Labels by traditional objective method” represents the results from the traditional objective method in step 3, and “Final output” represents the output by the re-trained Mask R-CNN model in step 4. The distinct colors in “Manual labels”, “Output1”, and “Final output” correspond to individual anticyclone outlines, while the contours represent the sea level pressure (SLP) fields.
Atmosphere 16 01140 g001
Figure 2. The identification results for anticyclones at (a,c) 12:00 UTC on 16 December 2022 and (b,d) 06:00 UTC on 27 January 2023. (a,b) are the results from the traditional objective method, (c,d) are the results from the Mask R-CNN model. The distinct colors in figures correspond to individual anticyclone outlines, while the contours represent the SLP fields. The arrows in figures indicate the surface wind vectors.
Atmosphere 16 01140 g002
Figure 3. The evolution of an anticyclone activity initiated at 00:00 UTC on 18 January 2021. Panels (aj) depict the anticyclone identification results at 6-h intervals from 00:00 UTC on 18 January to 06:00 UTC on 20 January 2021. The black line is the trajectory of this anticyclone activity. The distinct colors in figures correspond to individual anticyclone outlines, while the contours represent the SLP fields. The arrows in figures indicate the surface wind vectors. The red box delimits the Siberian region (45° N–65° N, 60° E–115° E).
Atmosphere 16 01140 g003
Figure 4. The distribution of (a,b) snowfall (units: mm), and (c,d) surface temperature (units: °C) during 7–9 November 2021. (a,c) The results from ERA5 reanalysis data (b,d) are the results from Chinese station data.
Atmosphere 16 01140 g004
Figure 5. The evolution of anticyclone activity from 2 to 9 November 2021. Panels (ah) depict the anticyclone identification results at 24-h intervals from 00:00 UTC on 2 November to 00:00 UTC on 9 November 2021. The black line is the trajectory of this anticyclone activity. The distinct colors in figures correspond to individual anticyclone outlines, while the contours represent the SLP fields. The arrows in figures indicate the surface wind vectors. The red box delimits the Siberian region (45–65° N, 60–115° E).
Atmosphere 16 01140 g005
Figure 6. The evolution of 24 h temperature change (fill colors, units: °C) and 1000-hPa wind fields (vector arrows, units: m·s−1) from 2 to 9 November 2021. Panels (ah) depict the 24 h temperature change and 1000-hPa wind fields from 00:00 UTC on 2 November to 00:00 UTC on 9 November 2021. The red box delimits the Siberian study region (45–65° N, 60–115° E).
Atmosphere 16 01140 g006aAtmosphere 16 01140 g006b
Figure 7. The distribution of (a,b) snowfall (units: mm), and (c,d) surface temperature (units: °C) during 12–14 December 2023. (a,c) are the results from ERA5 reanalysis data, (b,d) are the results from Chinese station data.
Atmosphere 16 01140 g007
Figure 8. The evolution of anticyclone activity from 10 to 14 December 2023. Panels (ae) depict the anticyclone identification results at 24-h intervals from 00:00 UTC on 10 December to 00:00 UTC on 14 December 2023. The black line is the trajectory of this anticyclone activity. The distinct colors in figures correspond to individual anticyclone outlines, while the contours represent the SLP fields. The arrows in figures indicate the surface wind vectors. The red box delimits the Siberian region (45–65° N, 60–115° E).
Atmosphere 16 01140 g008
Figure 9. The evolution of 24 h temperature change (fill colors, units: °C) and 1000-hPa wind fields (vector arrows, units: m·s−1) from 10 to 14 December 2023. Panels (ae) depict the 24 h temperature change and 1000-hPa wind fields from 00:00 UTC on 10 December to 00:00 UTC on 14 December 2023. The red box delimits the Siberian study region (45–65° N, 60–115° E).
Atmosphere 16 01140 g009
Figure 10. (a) Time series (units: days/year) of Siberian High influence days (red line), regional 2m temperature (t2m) cooling days (blue line), days with regional anticyclone-induced CAM enhancement (green line), and concurrent regional cooling with CAM enhancement days (yellow line) during the winter of 1981/1982–2022/2023. (b) Regression of regional 24 h cooling magnitude (units: K) against regional anticyclone-transported CAM enhancement magnitude (units: hPa).
Atmosphere 16 01140 g010
Disclaimer/Publisher’s Note: The statements, opinions and data contained in all publications are solely those of the individual author(s) and contributor(s) and not of MDPI and/or the editor(s). MDPI and/or the editor(s) disclaim responsibility for any injury to people or property resulting from any ideas, methods, instructions or products referred to in the content.