Article

Characterization of Particulate Matter in Indoor Air from Cooking Activities in Rural Indonesian Households

by
Muhammad Amin
1,2,3,*,
Vera Surtia Bachtiar
4,
Zarah Arwieny Hanami
5 and
Muralia Hustim
5
1
Faculty of Geoscience and Civil Engineering, Institute of Science and Engineering, Kanazawa University, Kanazawa 920-1192, Ishikawa, Japan
2
Program Profesi Insinyur, Sekolah Pascasarjana, Universitas Andalas, Padang 25163, West Sumatra, Indonesia
3
Faculty of Engineering, Universitas Sumatra Utara, Padang Bulan, Kec. Medan Baru, Kota Medan 20222, Sumatera Utara, Indonesia
4
Faculty of Engineering, Universitas Andalas, Limau Manis, Pauh, Padang 25175, West Sumatra, Indonesia
5
Faculty of Engineering, Universitas Hasanuddin, Gowa 92171, South Sulawesi, Indonesia
*
Author to whom correspondence should be addressed.
Atmosphere 2025, 16(10), 1124; https://doi.org/10.3390/atmos16101124
Submission received: 24 July 2025 / Revised: 11 September 2025 / Accepted: 22 September 2025 / Published: 25 September 2025
(This article belongs to the Special Issue Enhancing Indoor Air Quality: Monitoring, Analysis and Assessment)

Abstract

Indoor air pollution remains a critical health issue in the rural areas of low- and middle-income countries like Indonesia, where solid fuels are commonly used for cooking. This study assessed real-time indoor particulate matter (PM) concentrations in three rural households in Jorong V Botung, West Sumatra, using PurpleAir low-cost sensors (PurpleAir Inc., Draper, UT, USA). Mass concentrations of PM1, PM2.5, and PM10, along with size-segregated number concentrations (0.3–10 µm), were monitored continuously over six days (30 March–4 April 2024) during the Eid al-Fitr holiday, which involves extensive cooking activities. PM2.5 concentrations frequently exceeded 200 µg/m3, with a peak of 249.9 µg/m3 recorded during morning cooking hours. The smallest particle size (0.3–0.5 µm) dominated number concentrations, reaching up to 17,098 particles/dL, while larger particle levels were significantly lower. Strong positive correlations (r > 0.95) were observed among PM1, PM2.5, PM10 and AQI, indicating that cooking emissions substantially contributed to indoor PM levels. The findings highlight the need for targeted interventions, including clean fuel subsidies, improved ventilation, and public awareness efforts. This study contributes critical data on indoor air quality in rural Indonesia and supports broader initiatives to reduce exposure to household air pollution in Southeast Asia.

1. Introduction

Indoor air quality (IAQ) has become a critical concern worldwide, not only in developing countries but also in developed nations [1,2]. This concern is primarily driven by the well-established link between indoor air pollution and serious health consequences, including respiratory and cardiovascular diseases, as well as premature mortality [3,4]. The World Health Organization (WHO) reports that air pollution contributes to over 7 million deaths annually, with indoor exposure accounting for a significant proportion [5]. Alarmingly, more than 2 million of these deaths occur in Southeast Asia (SEA), a region comprising mostly developing nations such as Indonesia [6,7].
One of the leading sources of indoor air pollution is the incomplete combustion of solid biomass fuels such as firewood, which is widely used in rural environment [8,9]. In many rural households, cooking is still performed indoors without proper ventilation [10,11,12], resulting in the accumulation of harmful air pollutants. These pollutants, particularly particulate matter (PM), can remain suspended in the air for hours, infiltrating other areas of the home such as living room and even bedroom and increasing the risk of long-term exposure. Furthermore, IAQ not only influenced by the indoor combustion sources but also it could be affected by the outdoor situation which could penetrate through the natural ventilation which commonly found in the rural area [13,14,15].
PM is one of the most significant indoor air pollutants due to its direct association with various adverse health outcomes [16,17,18]. PM is commonly classified into PM10 (≤10 µm), PM2.5 (≤2.5 µm), and PM1 (≤1 µm) and ultrafine particles (UFP) based on aerodynamic diameter. The smaller the particle, the deeper it can penetrate into the human respiratory system, potentially reaching the alveoli and even entering the bloodstream [19,20,21]. Despite its health significance, size-segregated analysis of PM—such as in the ranges of 0.3–0.5 µm, 0.5–1 µm, and beyond 1 µm—is still rare in indoor air pollution studies. The danger increases further when PM contains toxic substances such as polycyclic aromatic hydrocarbons (PAHs), which are known carcinogens [22,23].
In Indonesia, especially in rural areas, many households continue to rely heavily on firewood for cooking [24,25,26]. Cultural norms, economic limitations, and limited access to cleaner alternatives such as liquefied petroleum gas (LPG) hinder the transition to safer cooking methods. In some communities, fear or unfamiliarity with LPG stoves further delays adoption. Even when LPG is available, many families still use a combination of fuels depending on the cooking activity. However, combustion of wood is known to emit significantly higher levels of PM, carbon monoxide (CO), and volatile organic compounds (VOCs) compared to LPG [27,28,29].
Poor kitchen design further exacerbates the problem. Many rural Indonesian homes lack effective ventilation systems such as chimneys, exhaust fans, or even well-placed windows [30,31]. As a result, cooking smoke accumulates indoors, posing a particularly serious threat to women and young children who are most frequently present during cooking activities [32,33]. Without intervention, prolonged exposure to indoor pollutants increases both acute and chronic health risks [34,35]. Despite the list of the problem above, there is still a major research gap in indoor air pollution studies in Indonesia, particularly in rural settings. Most available studies focus on urban ambient air pollution [36], with limited work addressing indoor exposure in traditional kitchens. Several challenges, including high equipment costs and limited access to electricity in remote areas, have restricted research efforts in these communities.
Recent advancements in low-cost sensor technology, such as PurpleAir, have made it more feasible to conduct air quality monitoring in resource-limited environments. These sensors are portable, user-friendly, and can operate on battery power (power bank), making them ideal for deployment in rural homes. Their ability to provide real-time, size-resolved PM data has opened new opportunities for monitoring indoor air quality and identifying exposure risks at finer temporal scales. In response to these challenges and opportunities, this study aims to fill the research gap by monitoring and analyzing indoor PM levels during cooking activities in rural Indonesian households. The specific objectives are: (1) to characterize the mass and size-segregated number concentrations of PM emitted during cooking using low-cost sensors and (2) to estimate potential health risks associated with indoor PM exposure, particularly among vulnerable populations such as women and children.

2. Methodology

2.1. Study Area and Household Selection

This study was conducted in Jorong V Botung, a remote village located in Nagari Kotonopan, Rao Utara Subdistrict, Pasaman Regency, West Sumatra Province, Indonesia. Situated within the Bukit Barisan Mountain range, the area is geographically isolated and difficult to access due to steep terrain and limited infrastructure. The community consists mainly of farming households engaged in rice cultivation, rubber tapping, and cacao farming. The region experiences consistently high rainfall and humidity throughout the year, with unreliable electricity supply and no cellular network coverage, further emphasizing the remoteness of the site.
Household selection was based on availability and willingness to participate. All selected households shared similar socioeconomic backgrounds and energy usage patterns. Importantly, all households relied primarily on firewood as their main cooking fuel (100%), consistent with national evidence that biomass remains a dominant cooking energy source in rural Indonesia [37]. While LPG stoves were present in some homes, they were rarely used and typically reserved for simple tasks such as boiling water. During the monitoring period, the three selected households relied exclusively on firewood for cooking, reflecting typical rural practices.
To provide clearer context for the study environment, Figure 1 presents a sketch of the household layouts and cooking areas, including sensor placement within each kitchen. This illustration highlights the indoor cooking conditions under which pollutant measurements were carried out.

2.2. Monitoring Period and Cooking Conditions

Monitoring was conducted over six consecutive days, from 30 March–4 April 2024, coinciding with Eid al-Fitr (Idul Fitri)—a period characterized by prolonged and culturally significant cooking. This timing provided an ideal opportunity to capture indoor PM concentrations under conditions of intensive household activity. The three selected households had sensors installed in their kitchens at typical breathing height (~1 m above the floor) as can be seen in Figure 1. In one home, the kitchen was directly connected to the bedroom without a partition, allowing pollutants to disperse into the sleeping area. Measurements were recorded continuously for 24 h per day using PurpleAir sensors (PurpleAir Inc., Draper, UT, USA).
Due to limited literacy and participant availability, it was not feasible to maintain detailed time–activity diaries or to quantify fuel proportions, ignition methods, or food quantities cooked. Instead, household members verbally confirmed typical cooking schedules, which were used to interpret PM patterns. Importantly, throughout the entire monitoring period, all three households relied exclusively on firewood for cooking, with no LPG use reported. The most intensive cooking occurred on 30 March, when community-wide meat preparation for the Eid celebration led to day-long cooking events, resulting in markedly elevated indoor PM levels. During cooking, a small kitchen window was usually opened to allow smoke to escape, but it was closed immediately afterward, which often resulted in residual smoke accumulation indoors.

2.3. Sensor Specifications and Data Output

PurpleAir low-cost sensors were employed for PM monitoring. Each unit is equipped with dual Plantower PMS5003 (Plantower Co., Ltd., Beijing, China) optical particle counters (OPCs), which operate on the principle of laser light scattering to estimate both particle size and concentration. The detection range of these sensors spans 0.3–10 µm, and outputs include mass concentrations of PM1, PM2.5, and PM10, along with number concentrations across six size bins: 0.3–0.5 µm, 0.5–1.0 µm, 1.0–2.5 µm, 2.5–5.0 µm, 5.0–10.0 µm, and >10.0 µm. Additional environmental parameters such as temperature and relative humidity (RH) were also recorded. Data were logged at 2 min intervals to capture fine-scale temporal variability.
To ensure data reliability, readings from the two internal PMS5003 sensors were compared at each time point. Measurements were excluded if the paired sensors differed by more than 40% or 5 µg/m3, and the final reported values were calculated as the average of the valid readings. Although co-location with reference-grade instruments was not feasible due to equipment limitations and the remoteness of the study area, PurpleAir sensors have been extensively evaluated in previous peer-reviewed studies under both indoor and outdoor conditions, demonstrating reasonable agreement with reference monitors after appropriate data quality checks [38,39,40,41]. The absence of direct calibration is acknowledged as a limitation of this study but does not detract from the ability of the sensors to characterize relative variations and temporal patterns in household PM concentrations.

2.4. Data Analysis

Data analysis was conducted using Microsoft Excel and Python 3.11 within Jupyter Notebook (Project Jupyter, open-source). Following validation, PM mass and number concentration data were aggregated into hourly averages to minimize short-term noise and highlight daily patterns. Analyses focused on mass concentrations (PM1, PM2.5, and PM10) and size-segregated number concentrations to capture temporal variations associated with cooking activities.
Time-series plots were generated with Matplotlib (v3.8.0) and Seaborn (v0.13.0) in Python 3.11 within Jupyter Notebook (Project Jupyter, open-source) to visualize PM dynamics in all households, with particular attention to the intensive cooking day of 30 March. The Air Quality Index (AQI) values were automatically generated by the PurpleAir sensor software using WHO guideline breakpoints for PM2.5. Since PM2.5 is the most health-relevant size fraction, AQI derived from PM2.5 was used for subsequent interpretation of indoor air quality.
Daily averages of PM2.5 were calculated from the valid data available for each household on each day. When electricity interruptions led to incomplete data coverage, the averages were computed from the effective monitoring period for that day. These cases are noted in the Results section. Although this approach did not always yield full 24 h datasets, it ensured consistency across households and provided representative values of daily exposure under real-world rural conditions. Day- and nighttime PM concentrations were also calculated, with “day” defined as 06:00–18:00 and “night” as 18:00–06:00.
Although precise cooking times were not recorded, cooking periods were approximated through participant interviews and cross-checked against PM peaks, enabling comparison between cooking and non-cooking intervals. Together, this approach enabled a practical and context-appropriate assessment of indoor PM exposure in rural Indonesian households, despite the logistical constraints of the remote field setting.
Furthermore, this study did not quantify the air exchange rate (AER) or infiltration rate in the kitchens, as ventilation was entirely natural. As mentioned in the previous section, household members typically opened small windows during cooking and closed them afterward. The absence of AER data limits the ability to fully quantify the relationship between ventilation and PM concentrations. Future studies should address this limitation to better capture the dynamics of indoor air exchange in rural households.

2.5. Health Risk Estimation

To evaluate the potential health burden of PM2.5, Chronic Daily Intake (CDI) was estimated for the women and children which are the vulnerable group in the studied of household exposure. CDI represents the amount of pollutant inhaled per unit body weight per day and provides an indicative measure of exposure intensity. It was calculated using the following equation by USEPA [42]:
CDI   =   C   ×   I R   ×   E F   ×   E D B W   ×   A T
where C represents the concentration of PM2.5 (mg·m−3), IR is the inhalation rate (m3·day−1), EF is the exposure frequency (days·year−1), ED is the exposure duration (years), BW is the body weight (kg), and AT is the averaging time (days). For non-cancer chronic exposure, AT is equal to the product of exposure duration and 365 days (AT = ED × 365) By adopting this convention, the formula can be simplified to:
C D I =   C   ×   I R   ×   E F   B W   ×   365
Assuming year-round exposure (EF = 365 days·year−1), the expression reduces further to a daily dose per kilogram of body weight:
C D I   =   C   ×   I R   B W
In this formulation, C refers to the 24 h average indoor concentration of PM2.5, expressed in milligrams per cubic meter after conversion from micrograms per cubic meter. The inhalation rate (IR) and body weight (BW) are subgroup-specific. For adult women, an inhalation rate of 10.8 m3·day−1 and a body weight of 55 kg were applied. For children, an inhalation rate of 8.0 m3·day−1 and a body weight of 15 kg were used. CDI is expressed in units of mg·kg−1·day−1 and provides an indicative measure of daily exposure. Because there is no universally accepted inhalation reference concentration for PM2.5, hazard quotients were not calculated. Instead, CDI values are presented as dose indicators that allow comparison between population subgroups.

3. Results and Discussion

3.1. Real-Time Mass Concentration of PM

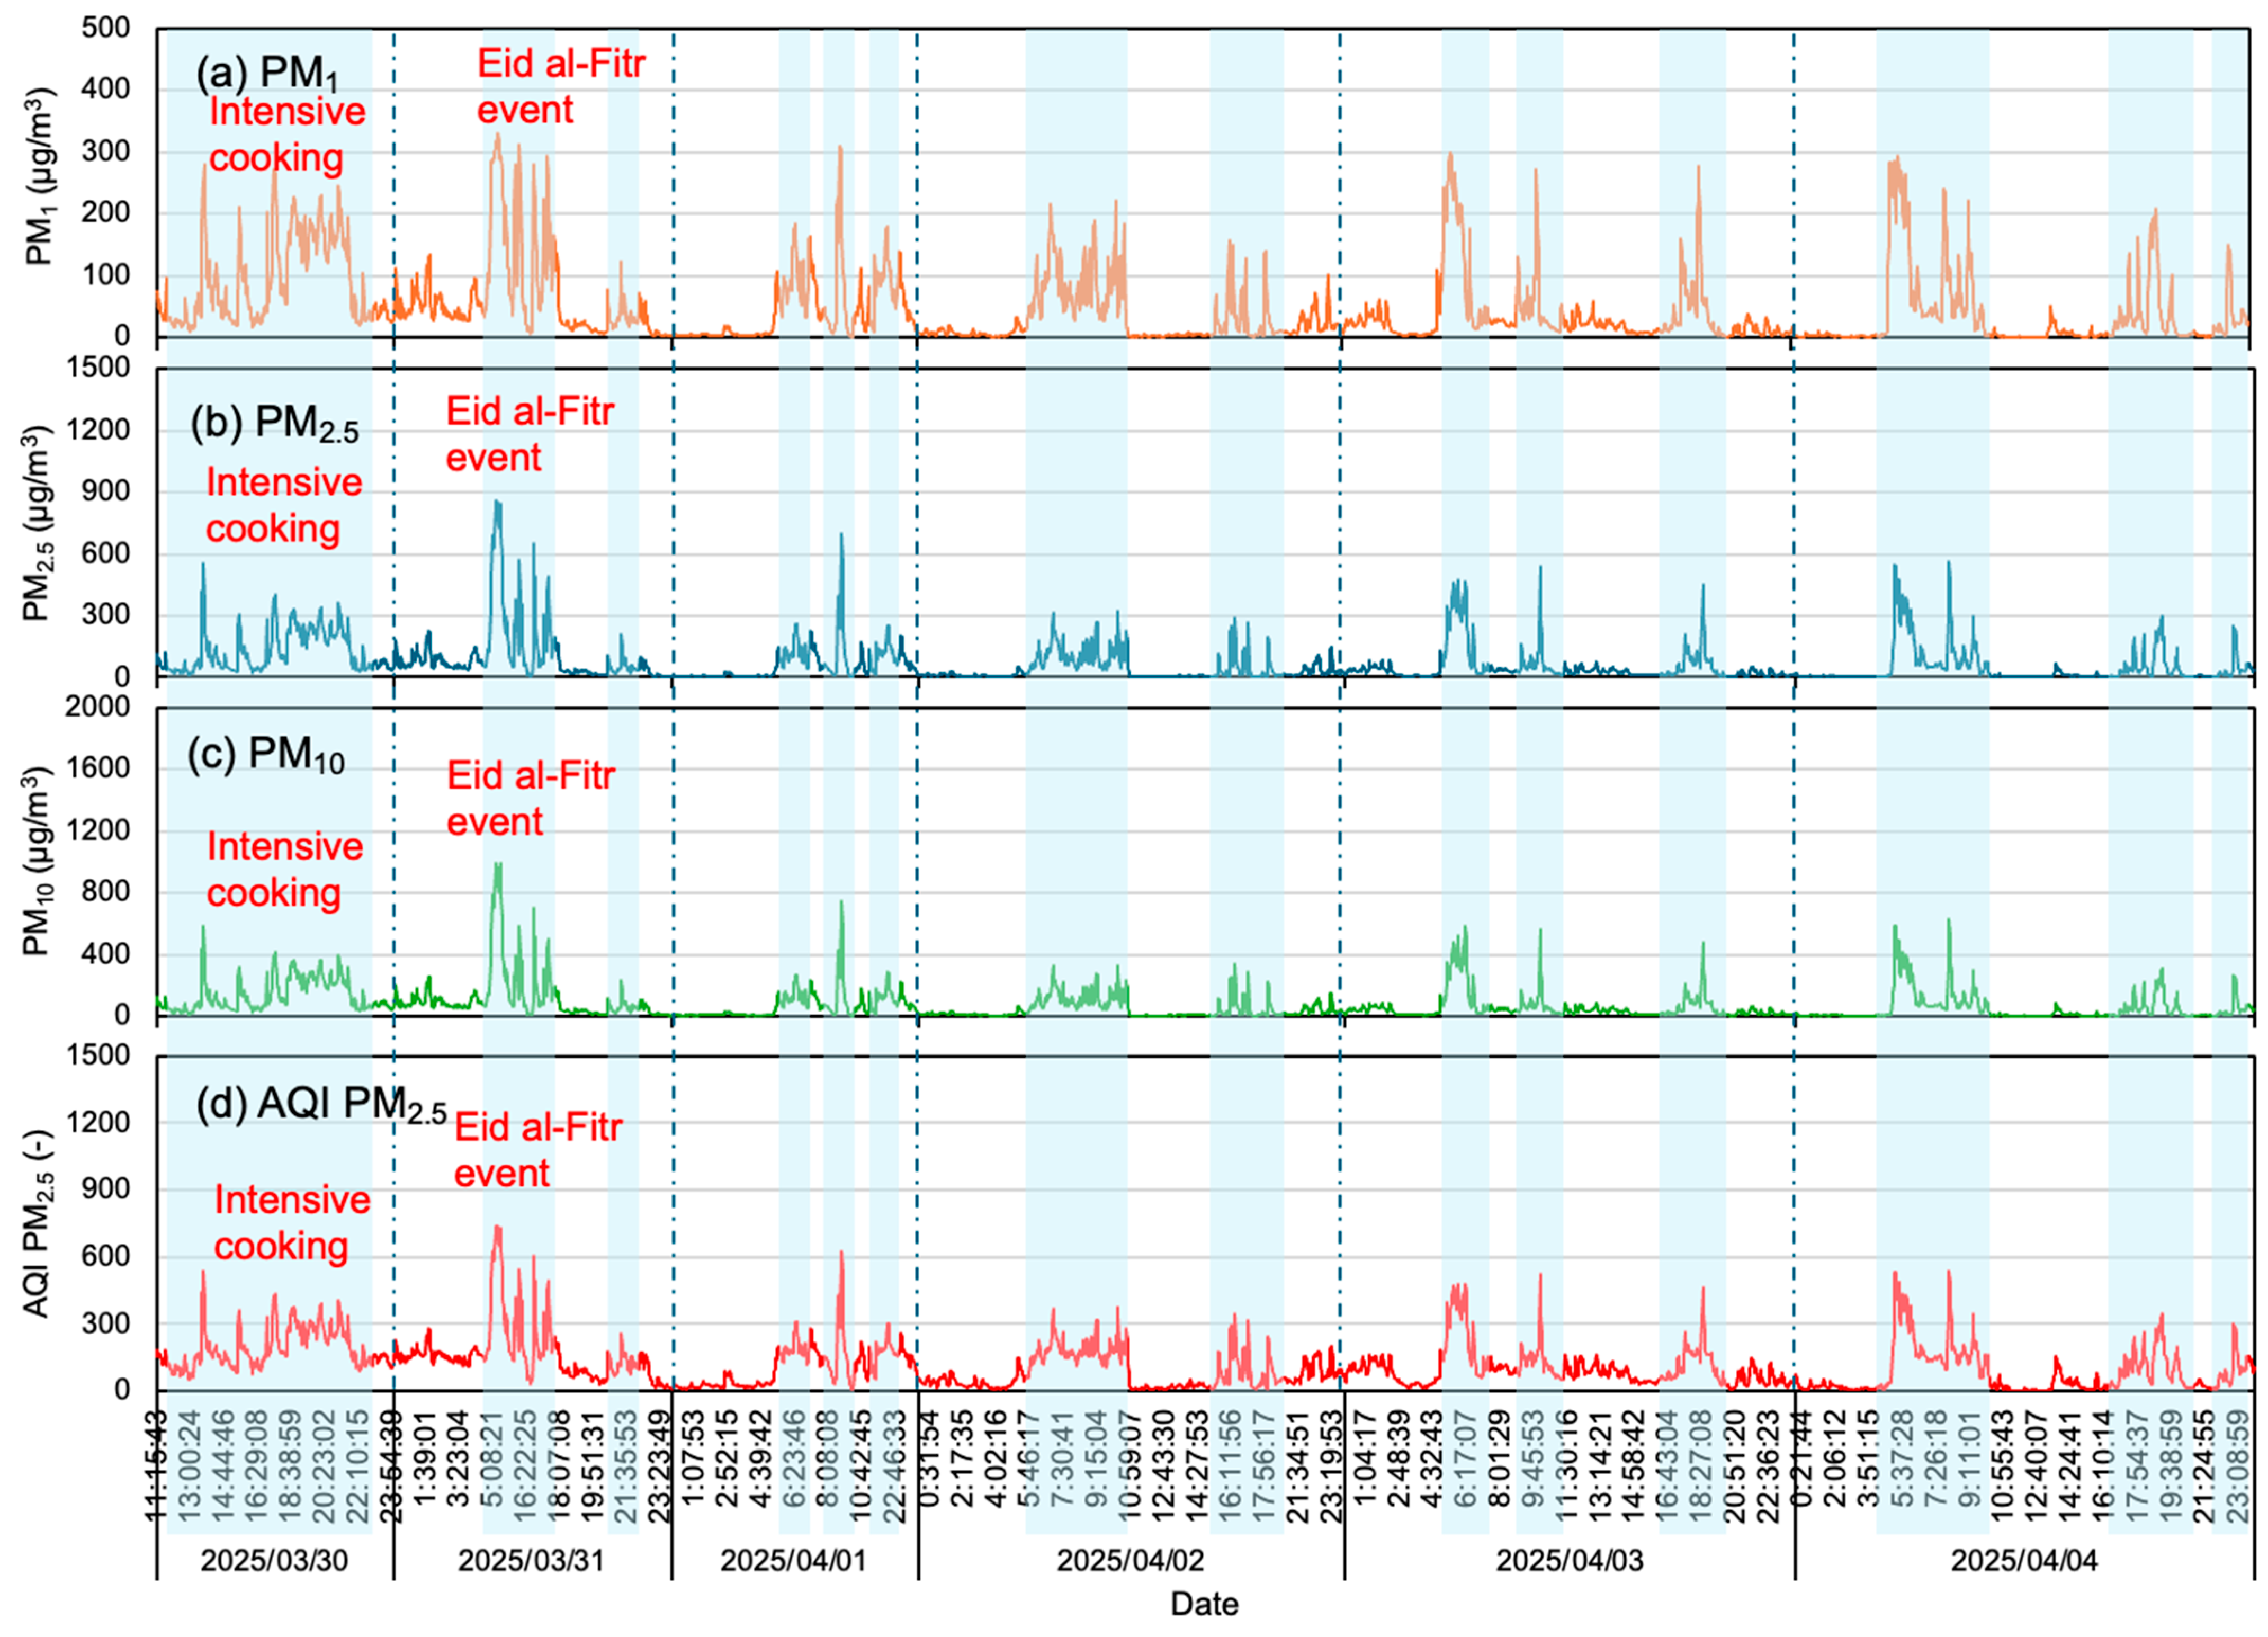
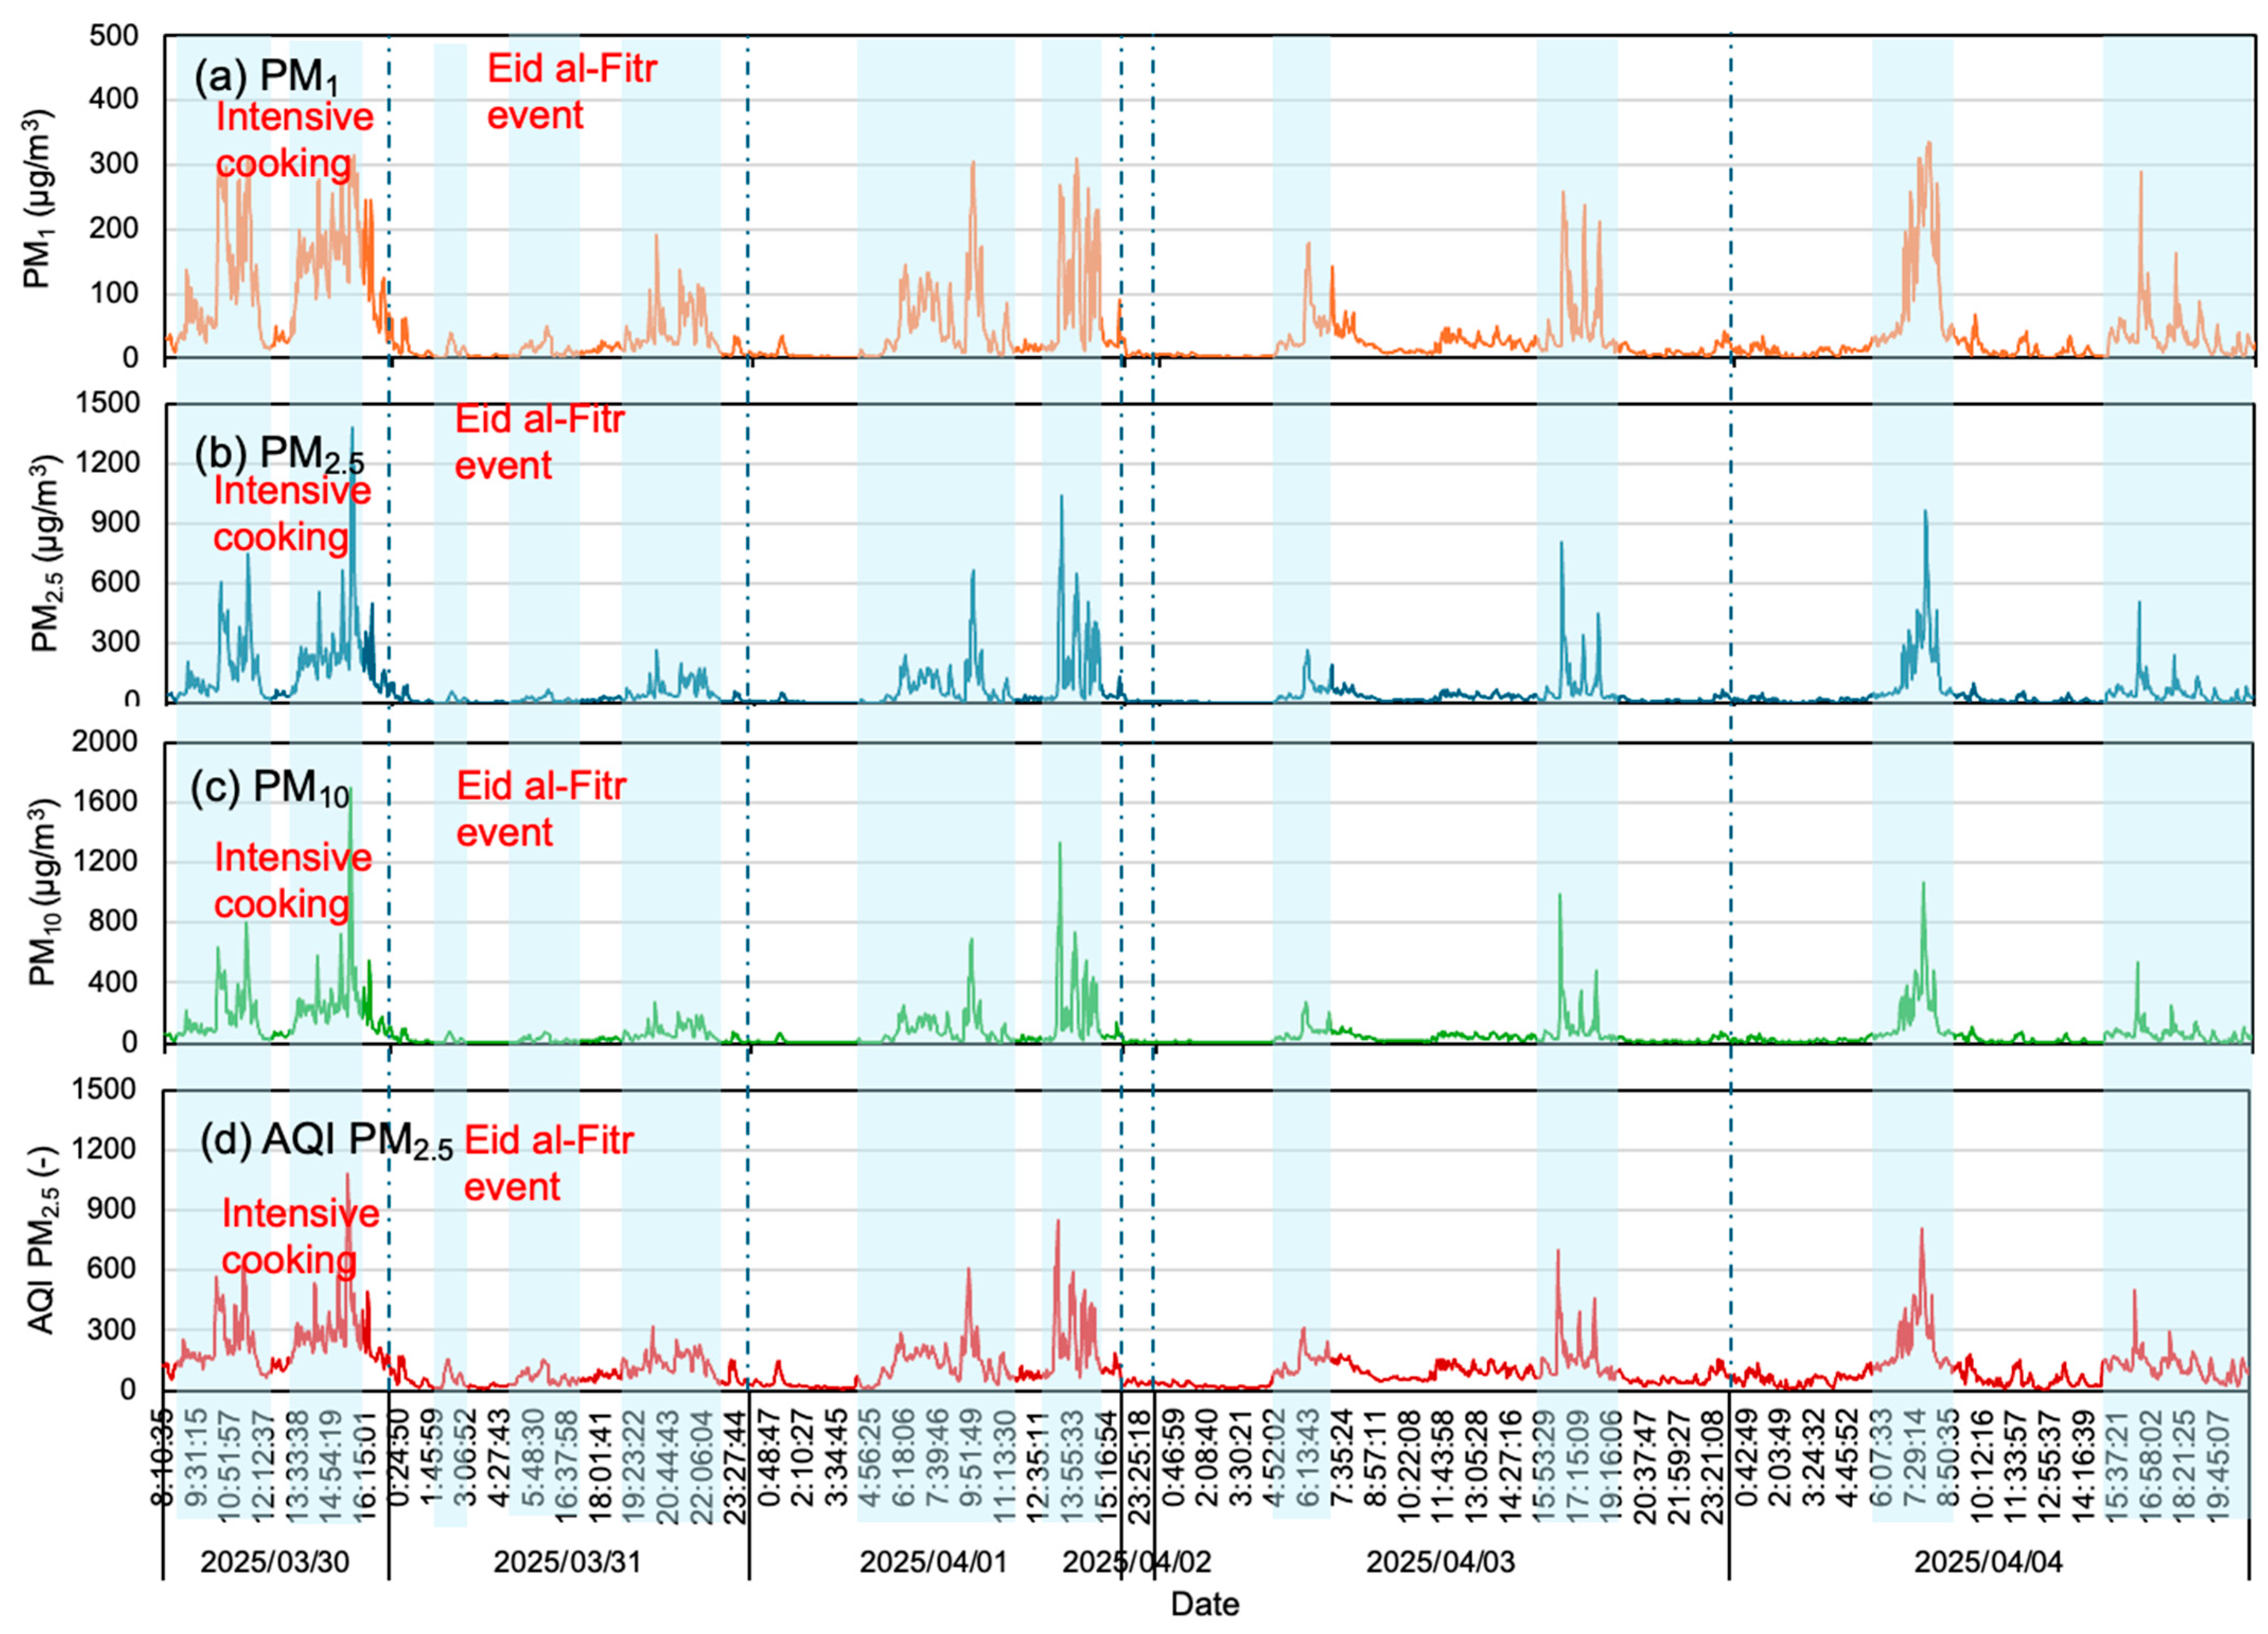
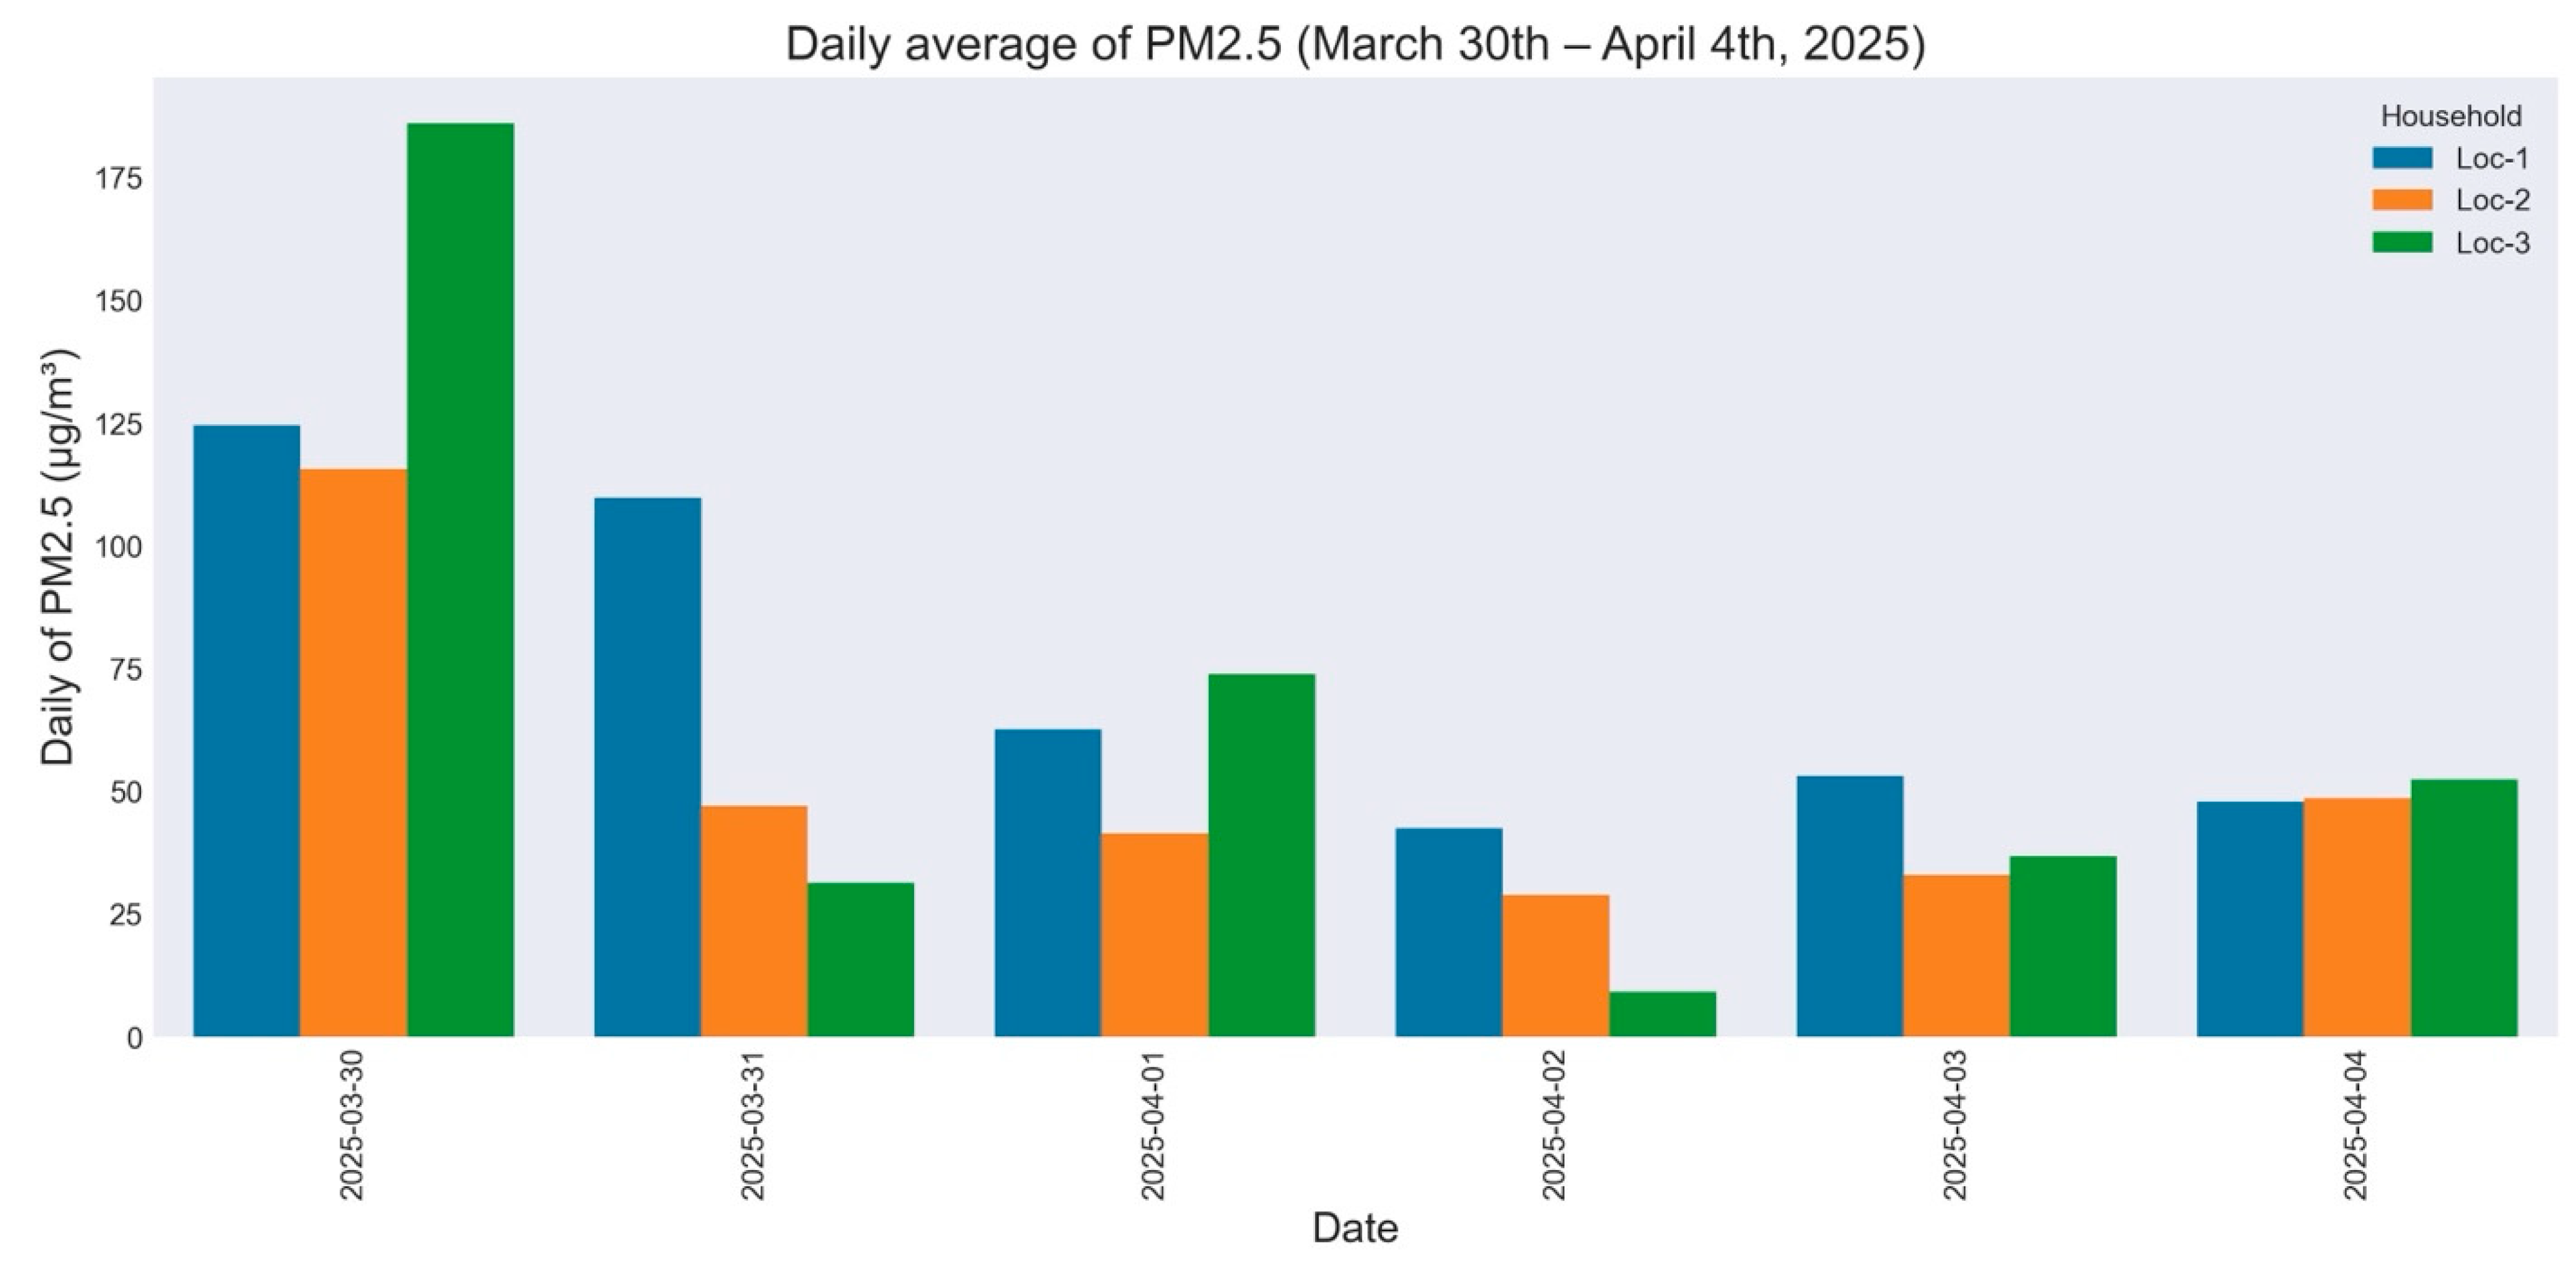
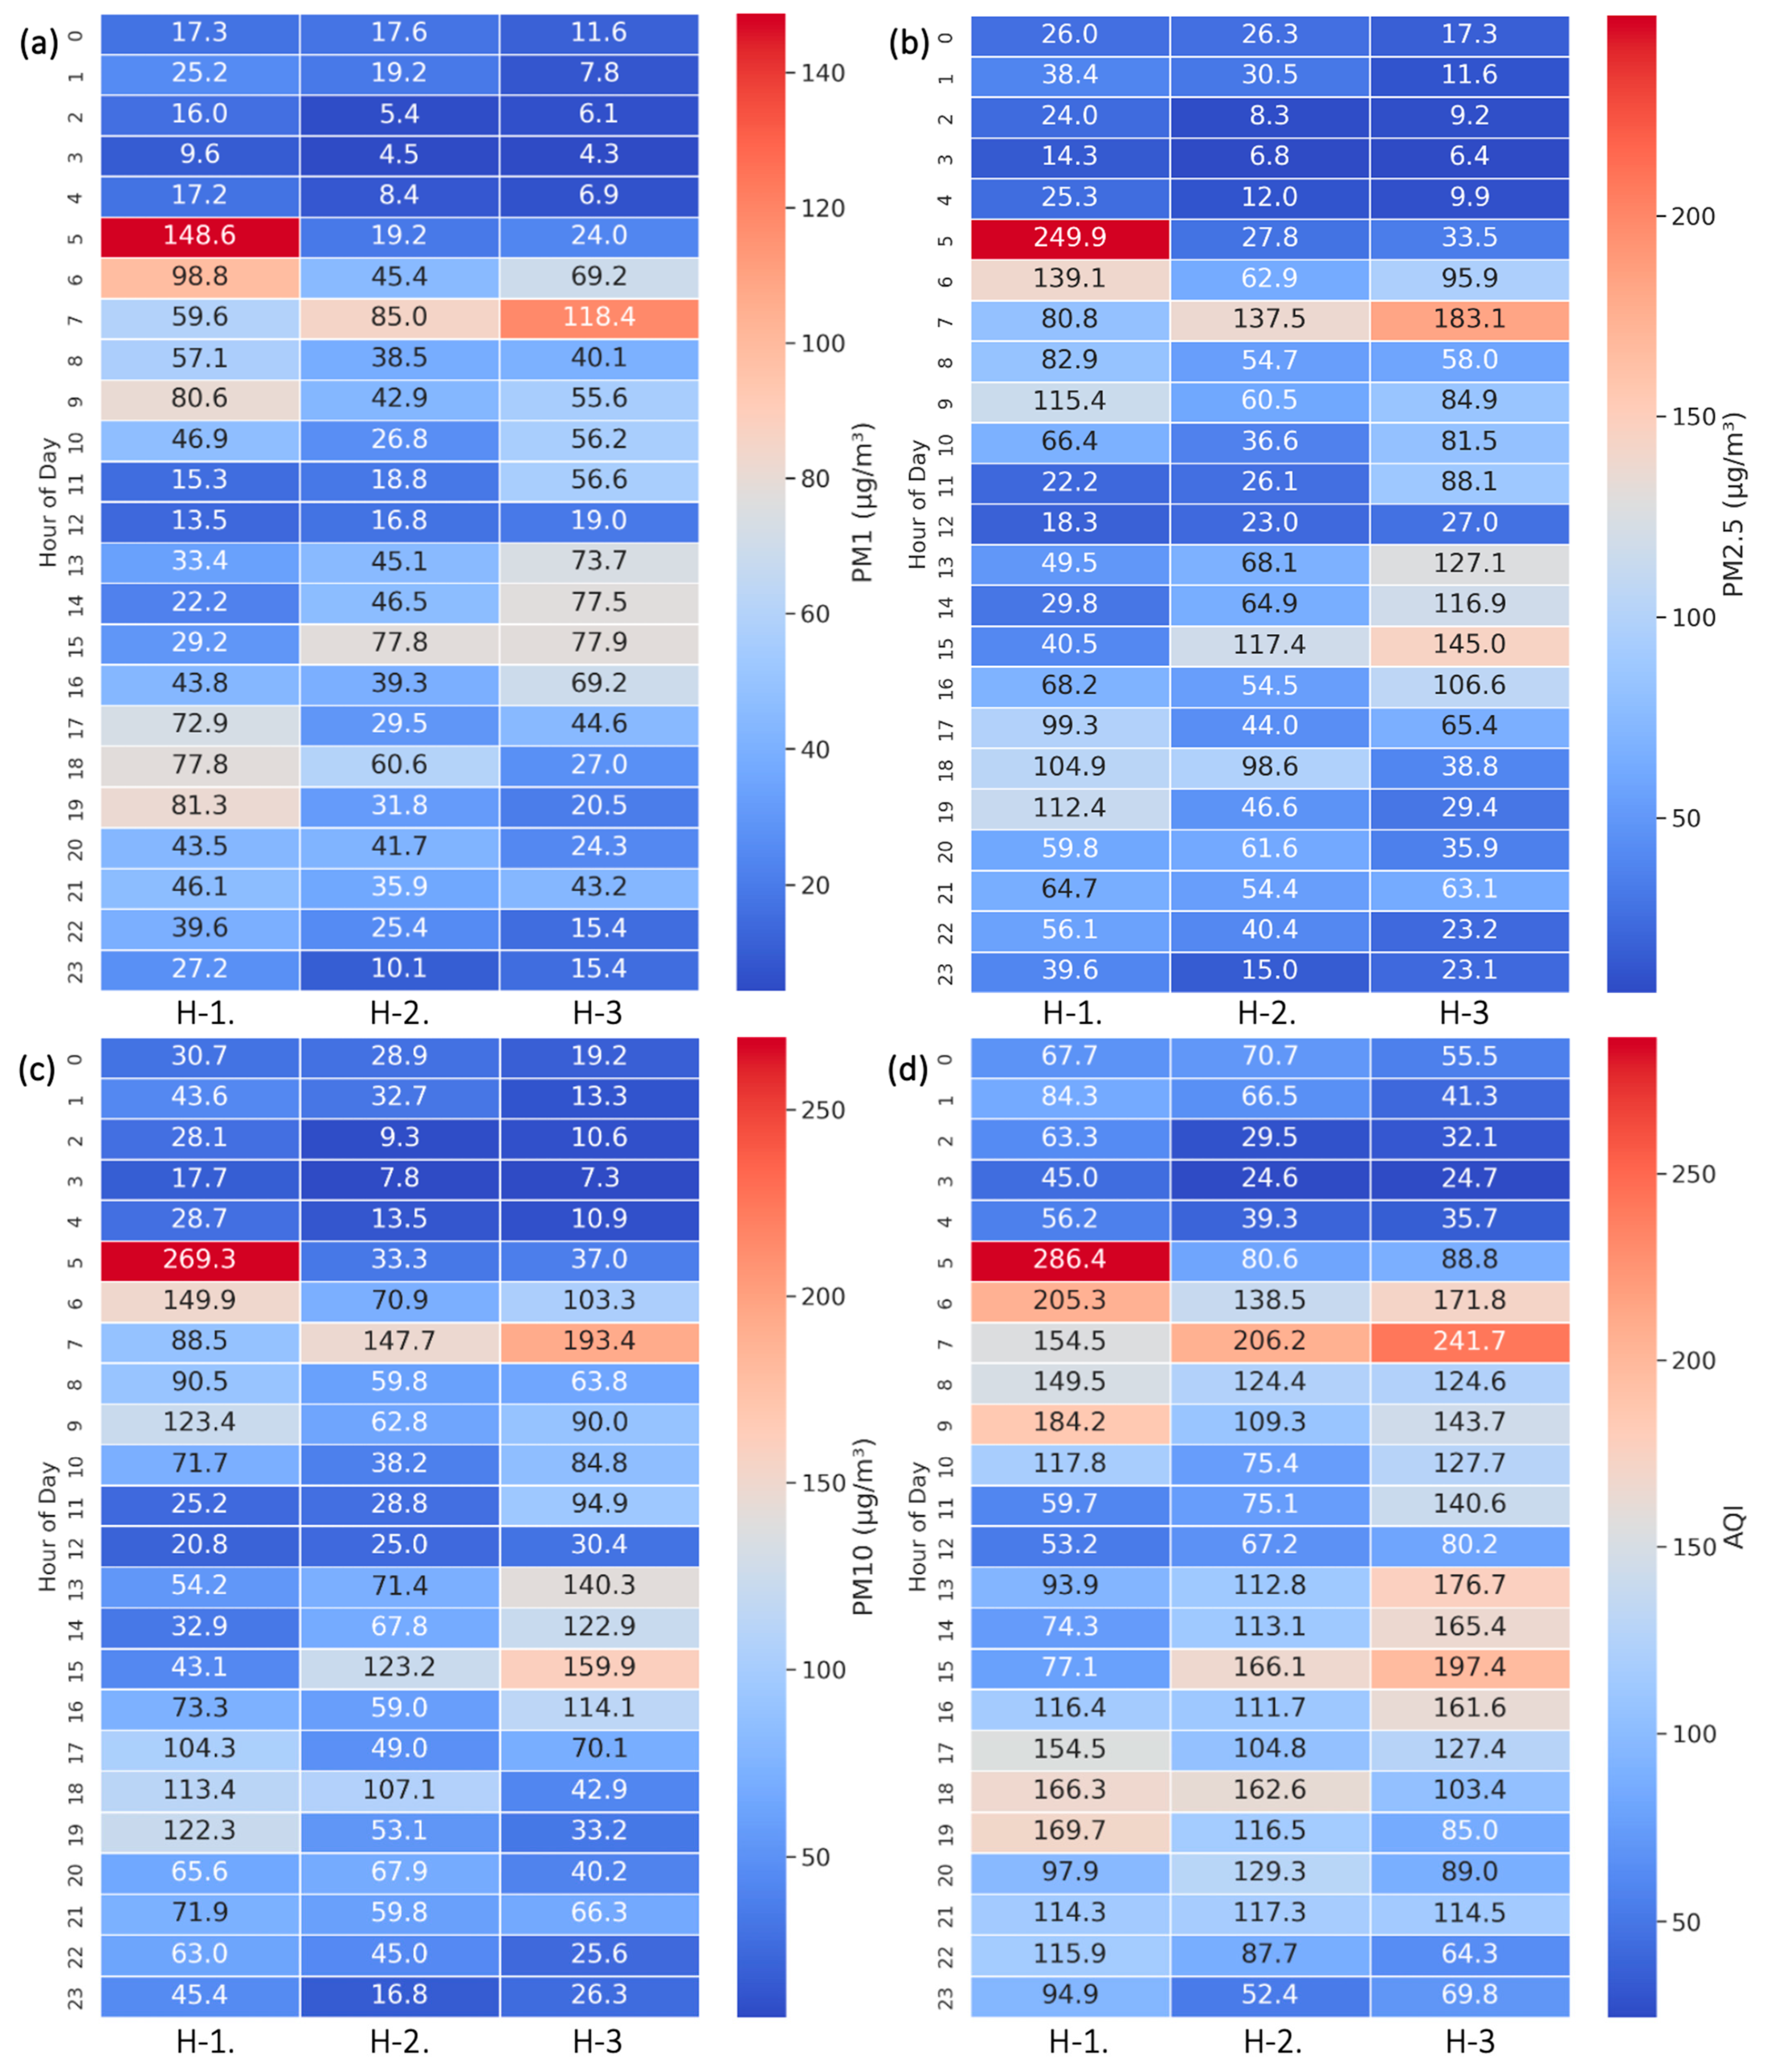
Continuous monitoring of PM in the three households—designated as H-1, H-2, and H-3—revealed distinct temporal variations in indoor air quality over the 24 h cycle. Mass concentrations of PM1, PM2.5, and PM10 were recorded continuously and then aggregated into hourly averages to identify trends and peak exposure periods. Figure 2, Figure 3 and Figure 4 present the real-time PM profiles for each household, while Figure 5 shows the 24 h averages. Heatmaps are summarized in Figure 6, and hourly means and diurnal patterns are provided in Table 1 and Table S1.
Across all households, the highest PM concentrations were recorded on 30 March, coinciding with community-wide food preparation for Eid al-Fitr, when villagers typically spend nearly the entire day cooking before sunset. Household 1 (H-1) exhibited the highest PM levels, particularly during early morning cooking hours. Between 05:00 and 06:00, PM1, PM2.5, and PM10 reached 148.6 ± 112.3 µg/m3, 249.9 ± 233.8 µg/m3, and 269.3 ± 259.5 µg/m3, respectively. These peaks coincided with breakfast preparation and were accompanied by a sharp rise in AQI (286.4 ± 194.5), indicating unhealthy air quality. A second spike occurred between 18:00 and 20:00, aligned with dinner activities.
Household 2 (H-2) showed moderate but distinct diurnal fluctuations. Morning peaks (06:00–08:00) recorded PM2.5 concentrations of 62.9 ± 45.8 to 137.5 ± 145.2 µg/m3, while PM10 rose to 147.7 ± 157.1 µg/m3. Evening peaks were also evident, with PM2.5 ranging from 46.6 ± 32.3 to 98.6 ± 116.1 µg/m3. Household 3 (H-3) demonstrated a different pattern, with elevated PM2.5 levels peaking later in the morning (183.1 ± 184.5 µg/m3) and continuing into the early afternoon (13:00–15:00, 145.0 ± 238.3 µg/m3). These variations likely reflect differences in cooking duration and ventilation practices among households.
Across all sites, PM concentrations were minimal during late-night to early-morning hours (00:00–04:00), when household activities ceased, and occupants were asleep. Sharp increases in PM levels began around 05:00 and again between 17:00 and 20:00, corresponding to daily cooking routines. The large standard deviations during peak hours underscore the episodic nature of biomass combustion events such as frying and grilling.

3.2. Size-Segregated Number Concentration of PM

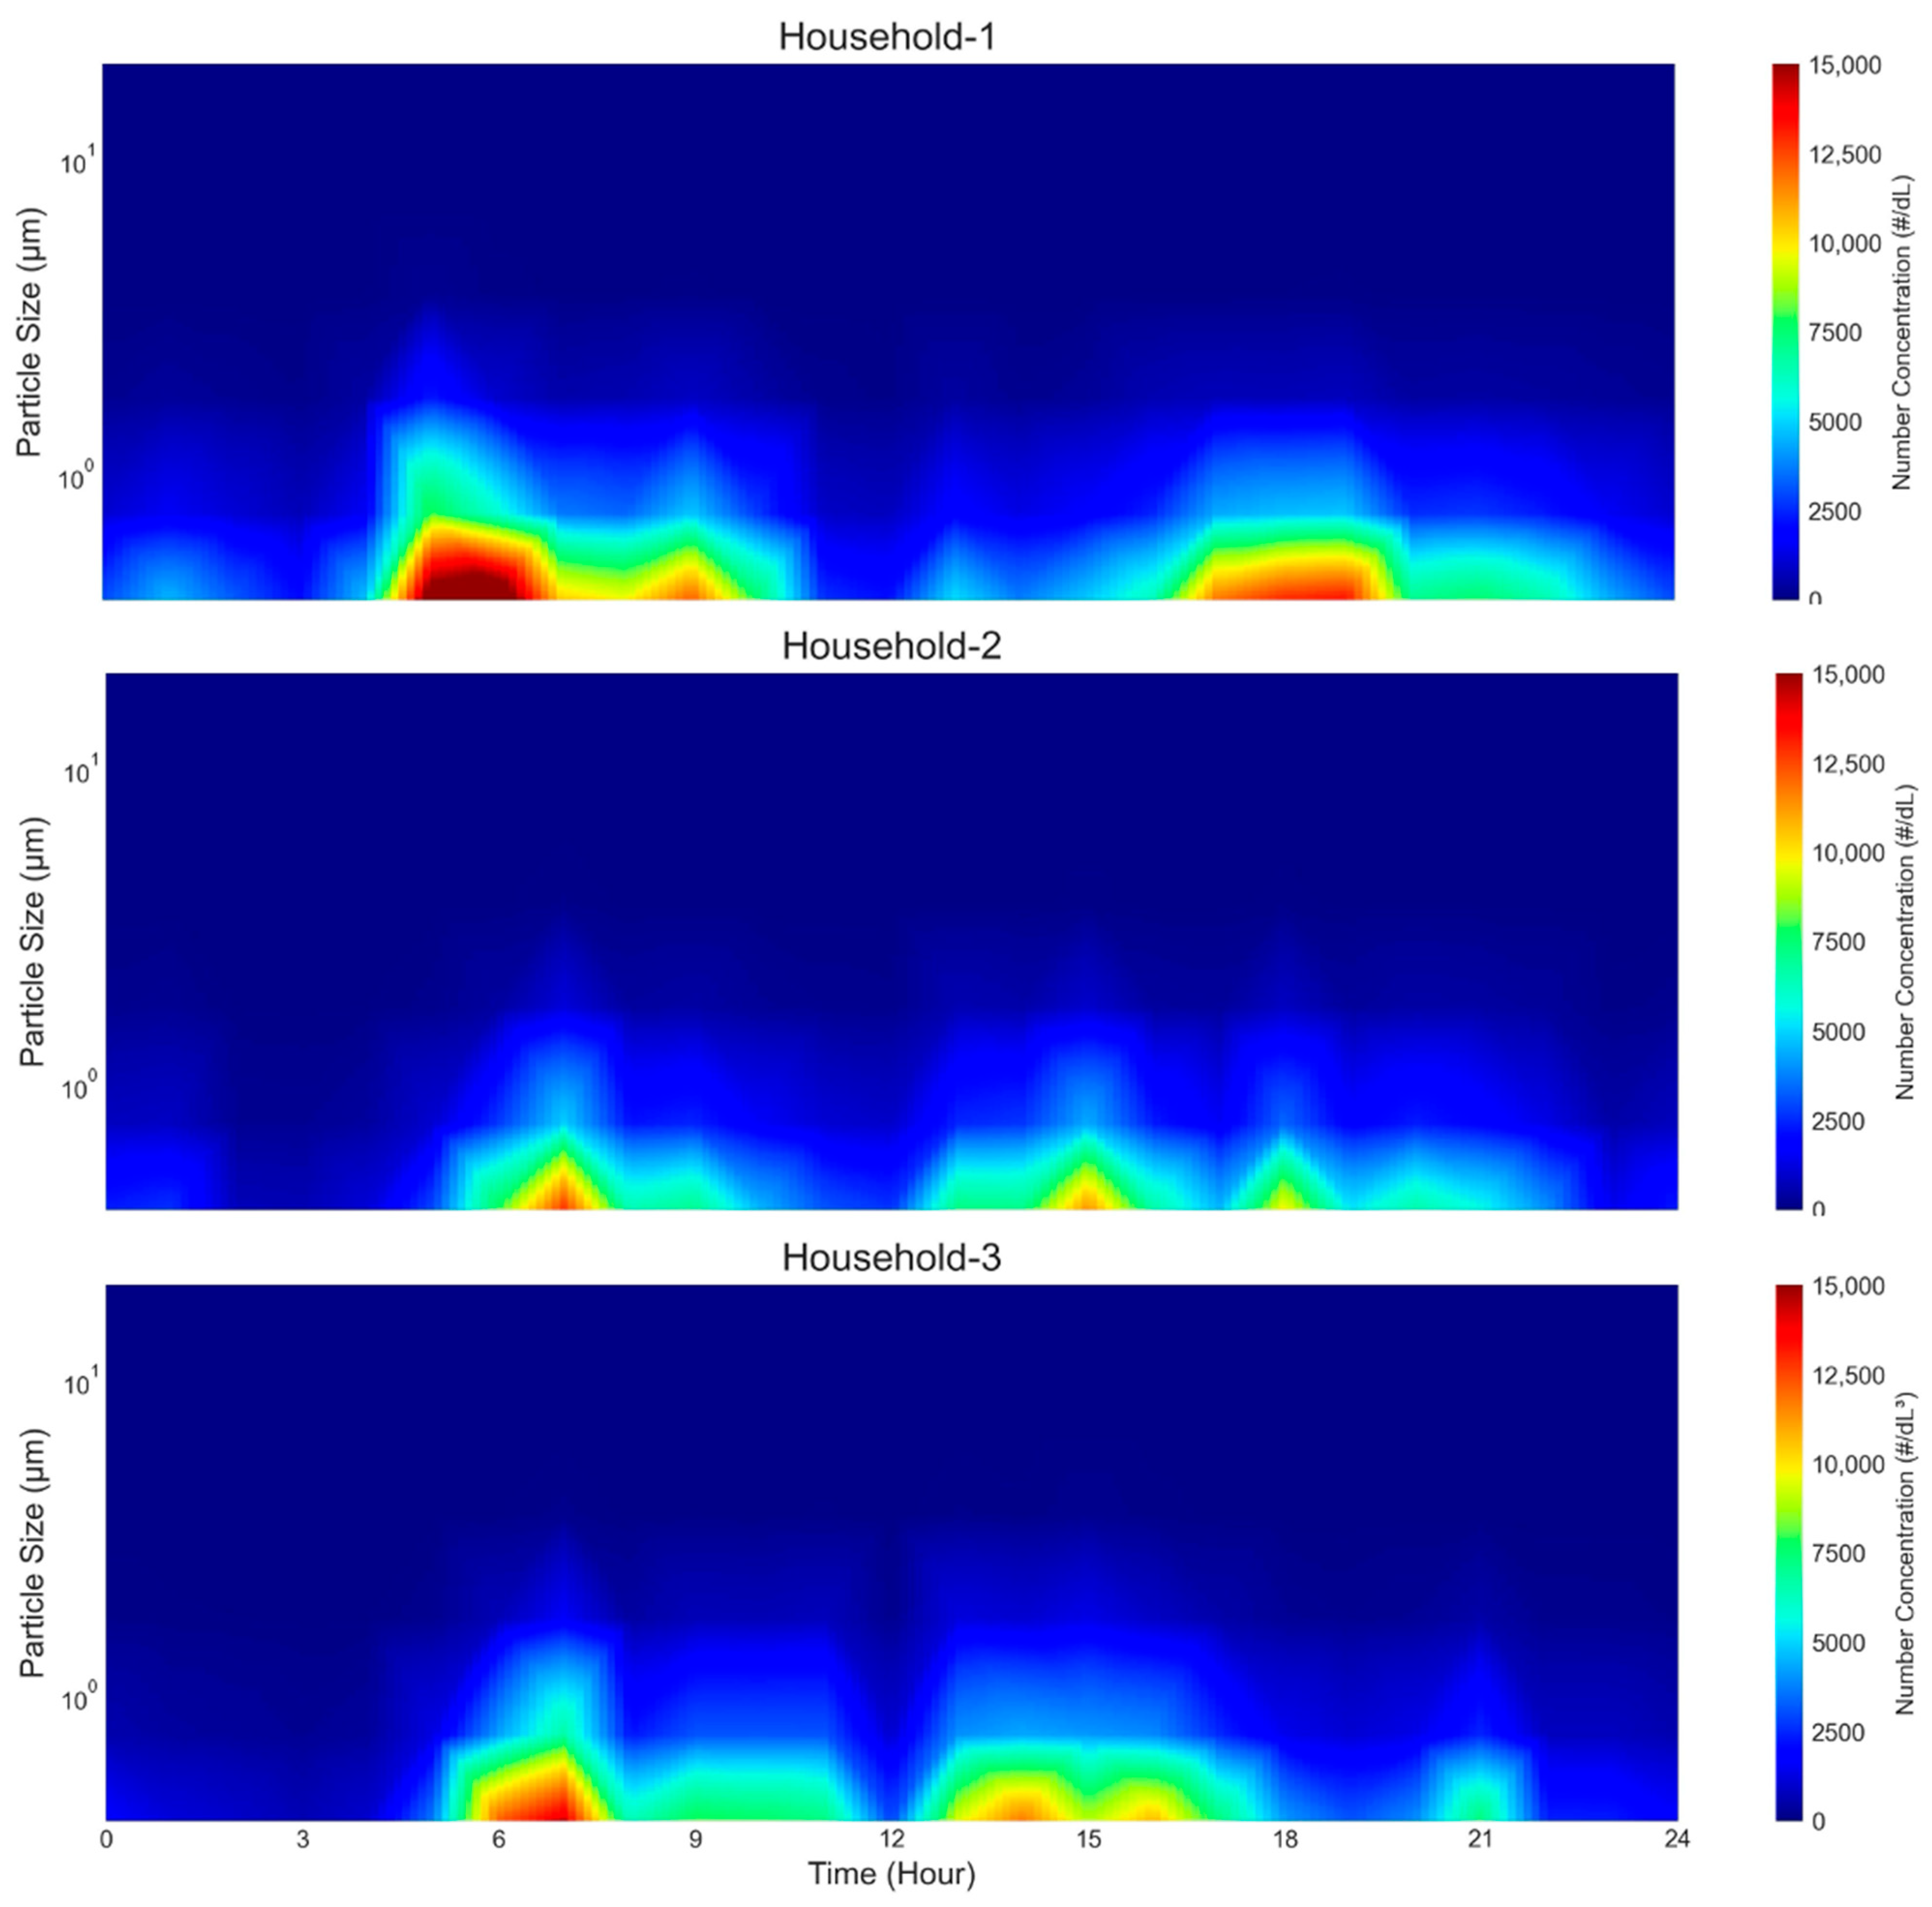
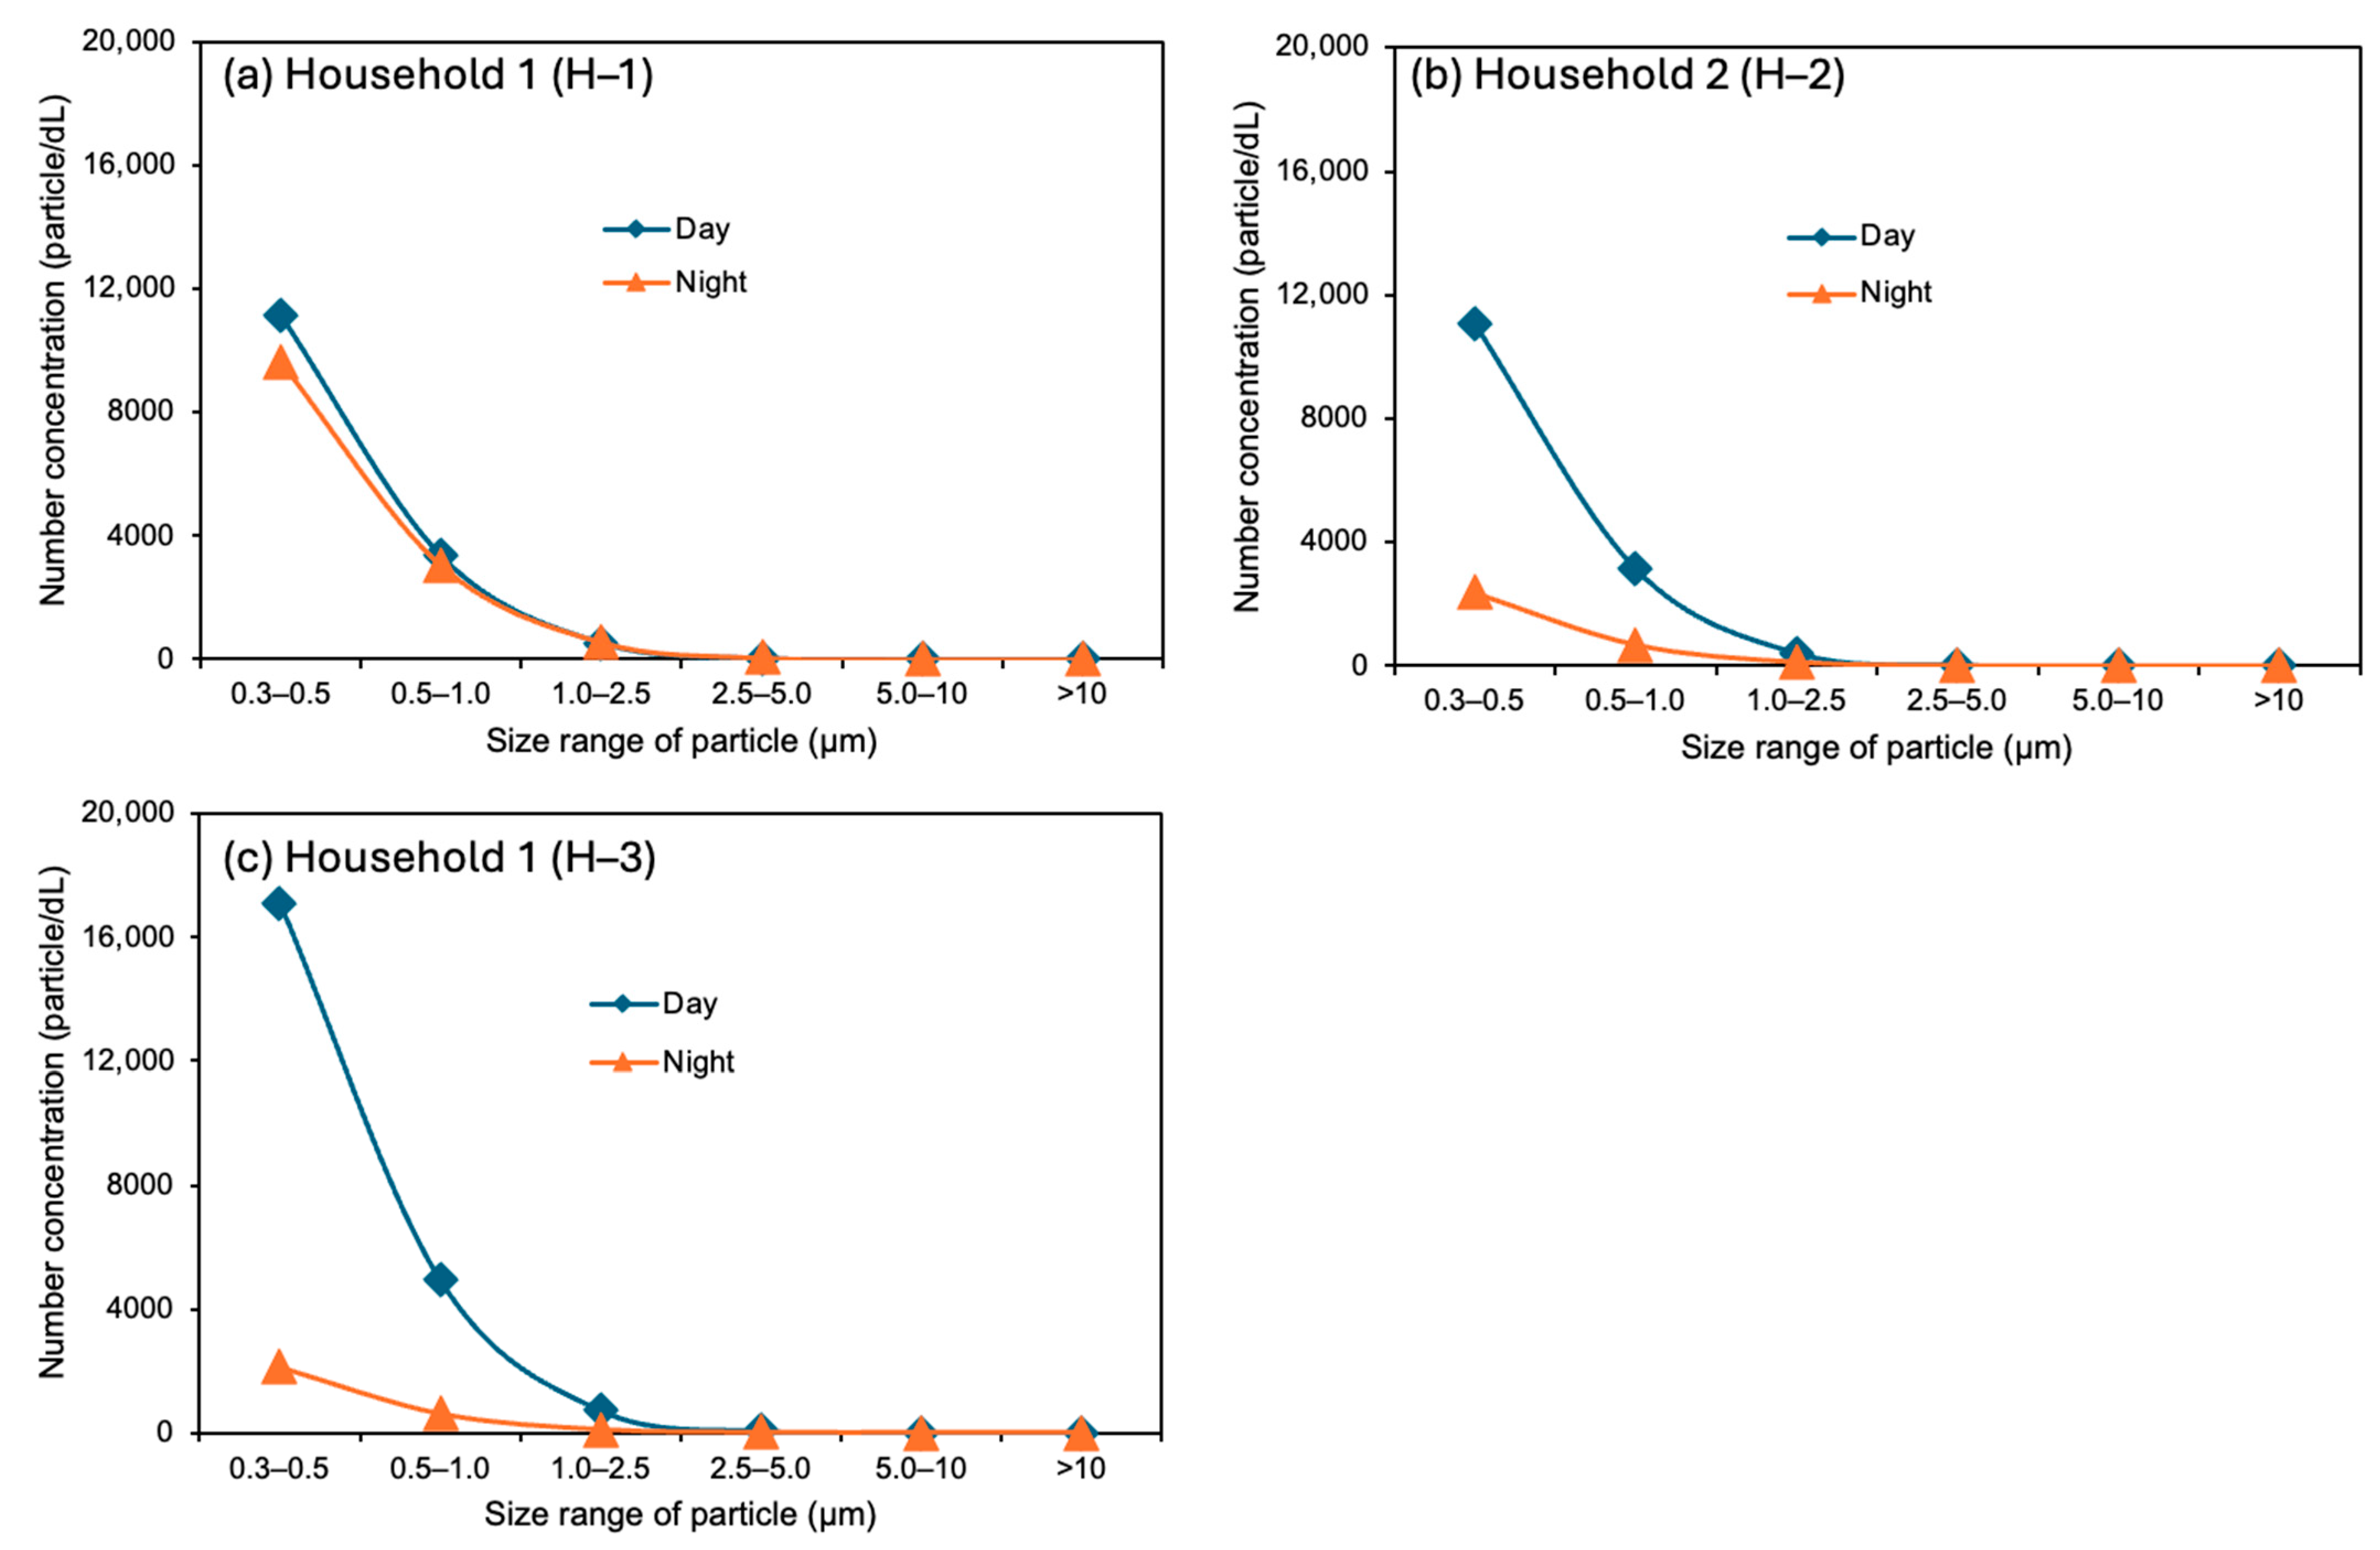
The size-segregated number concentration analysis provided further insight into indoor PM characteristics. Measurements were divided into six size bins: 0.3–0.5 µm, 0.5–1.0 µm, 1.0–2.5 µm, 2.5–5.0 µm, 5.0–10.0 µm, and >10.0 µm. Figure 7 and Figure 8 illustrate the temporal patterns and diurnal distribution. The detail value of the particle size distribution can be seen in Table S2. Across all households, the highest number concentrations were observed in the 0.3–0.5 µm bin, consistent with emissions from incomplete combustion. In H-1, particle numbers peaked at 17,098.0 ± 9578.5 particles/dL between 06:00 and 07:00, correlating with elevated PM mass concentrations. A second surge occurred between 17:00–19:00, again linked to cooking activities. H-2 presented a similar trend, with the 0.3–0.5 µm concentration reaching 12,848.0 ± 8465.2 particles/dL at 07:00–08:00. H-3 recorded its highest number of fine particles during 07:00–08:00 as well (14,157.7 ± 12,056.9 particles/dL), with minimal coarse-mode particles detected (>10 µm typically below 10 particles/dL).
These findings emphasize that fine particles dominate household air during cooking, posing serious respiratory health risks, especially in the absence of adequate ventilation. Interestingly, in H-1, the difference between daytime and nighttime concentrations was less pronounced compared to the other locations, although levels were still higher during the day. This may be because the household was continuously busy with cooking and social activities from community members throughout the day and night. In contrast, H-2 and H-3 followed more typical household routines, with cooking largely confined to morning and evening, resulting in clearer day–night contrasts in PM levels.

3.3. Size-Segregated Number Concentration and Correlation Among PM Parameters in Relation to Cooking Activities

The dominance of fine particles during cooking periods was observed consistently across all households. The 0.3–0.5 µm fraction spiked during breakfast and dinner preparation times, reinforcing cooking as the primary PM source. These submicron particles are particularly hazardous due to their capacity to reach the alveolar region of the lungs and potentially enter the bloodstream.
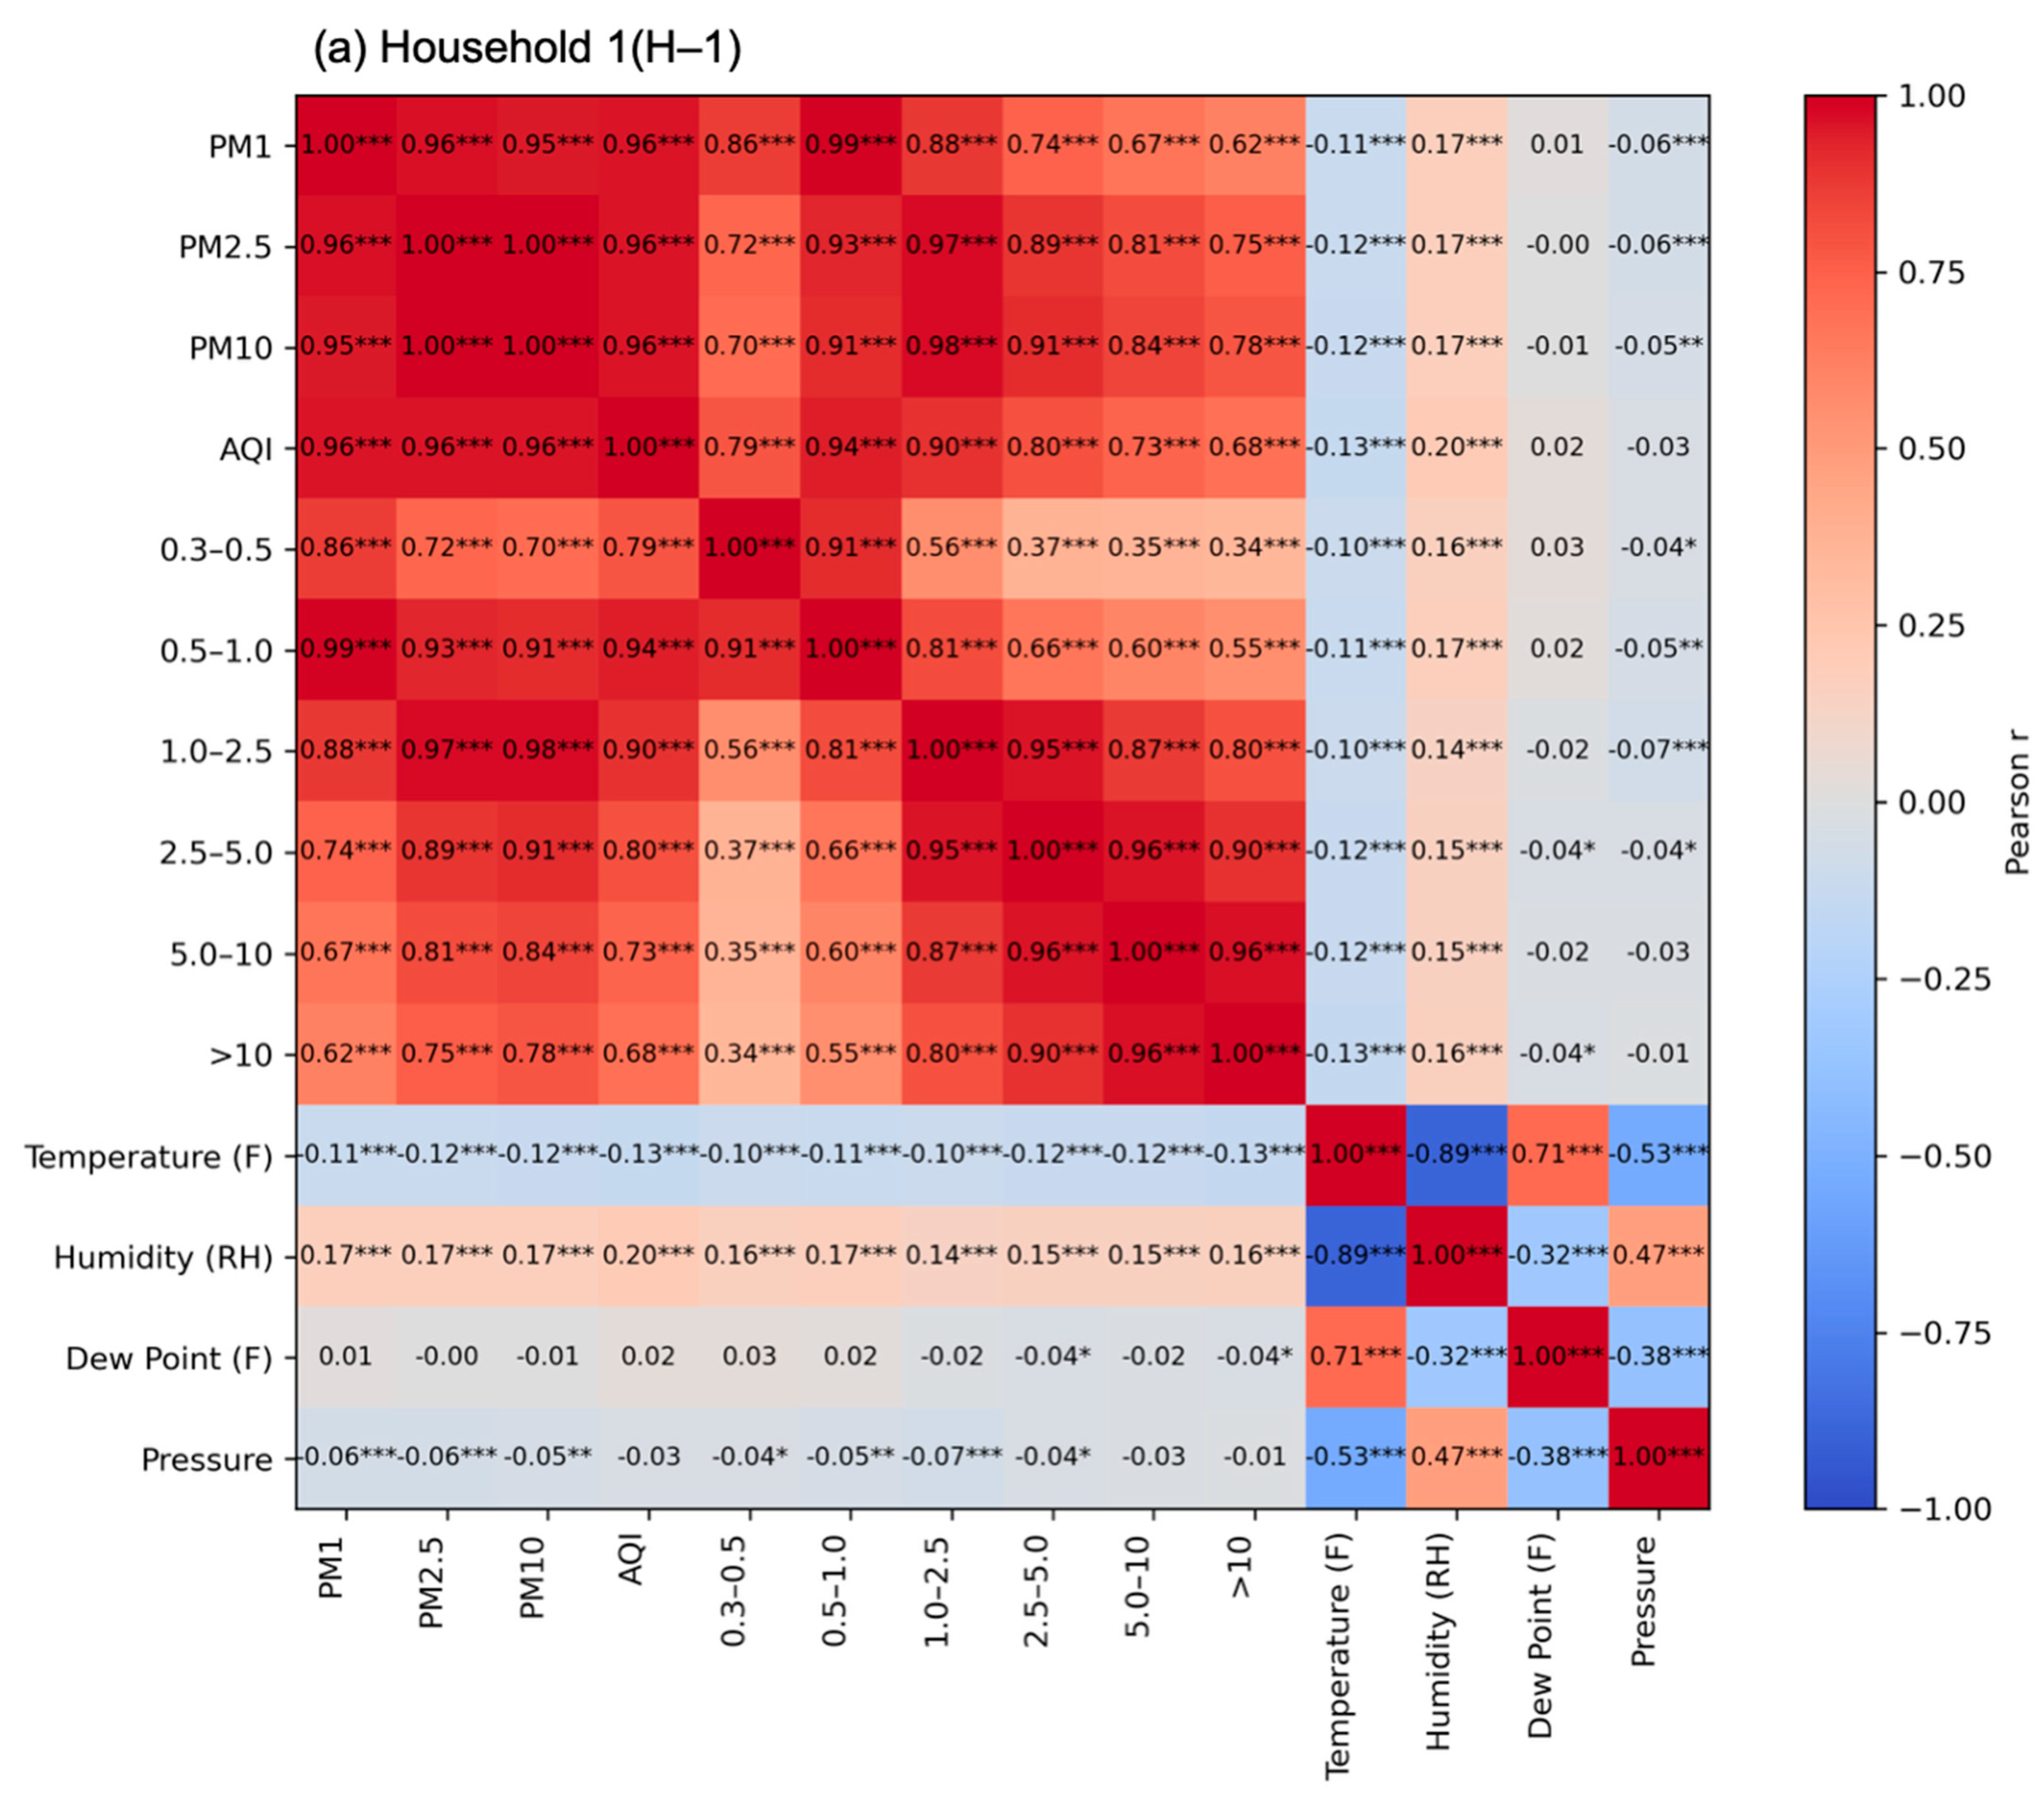
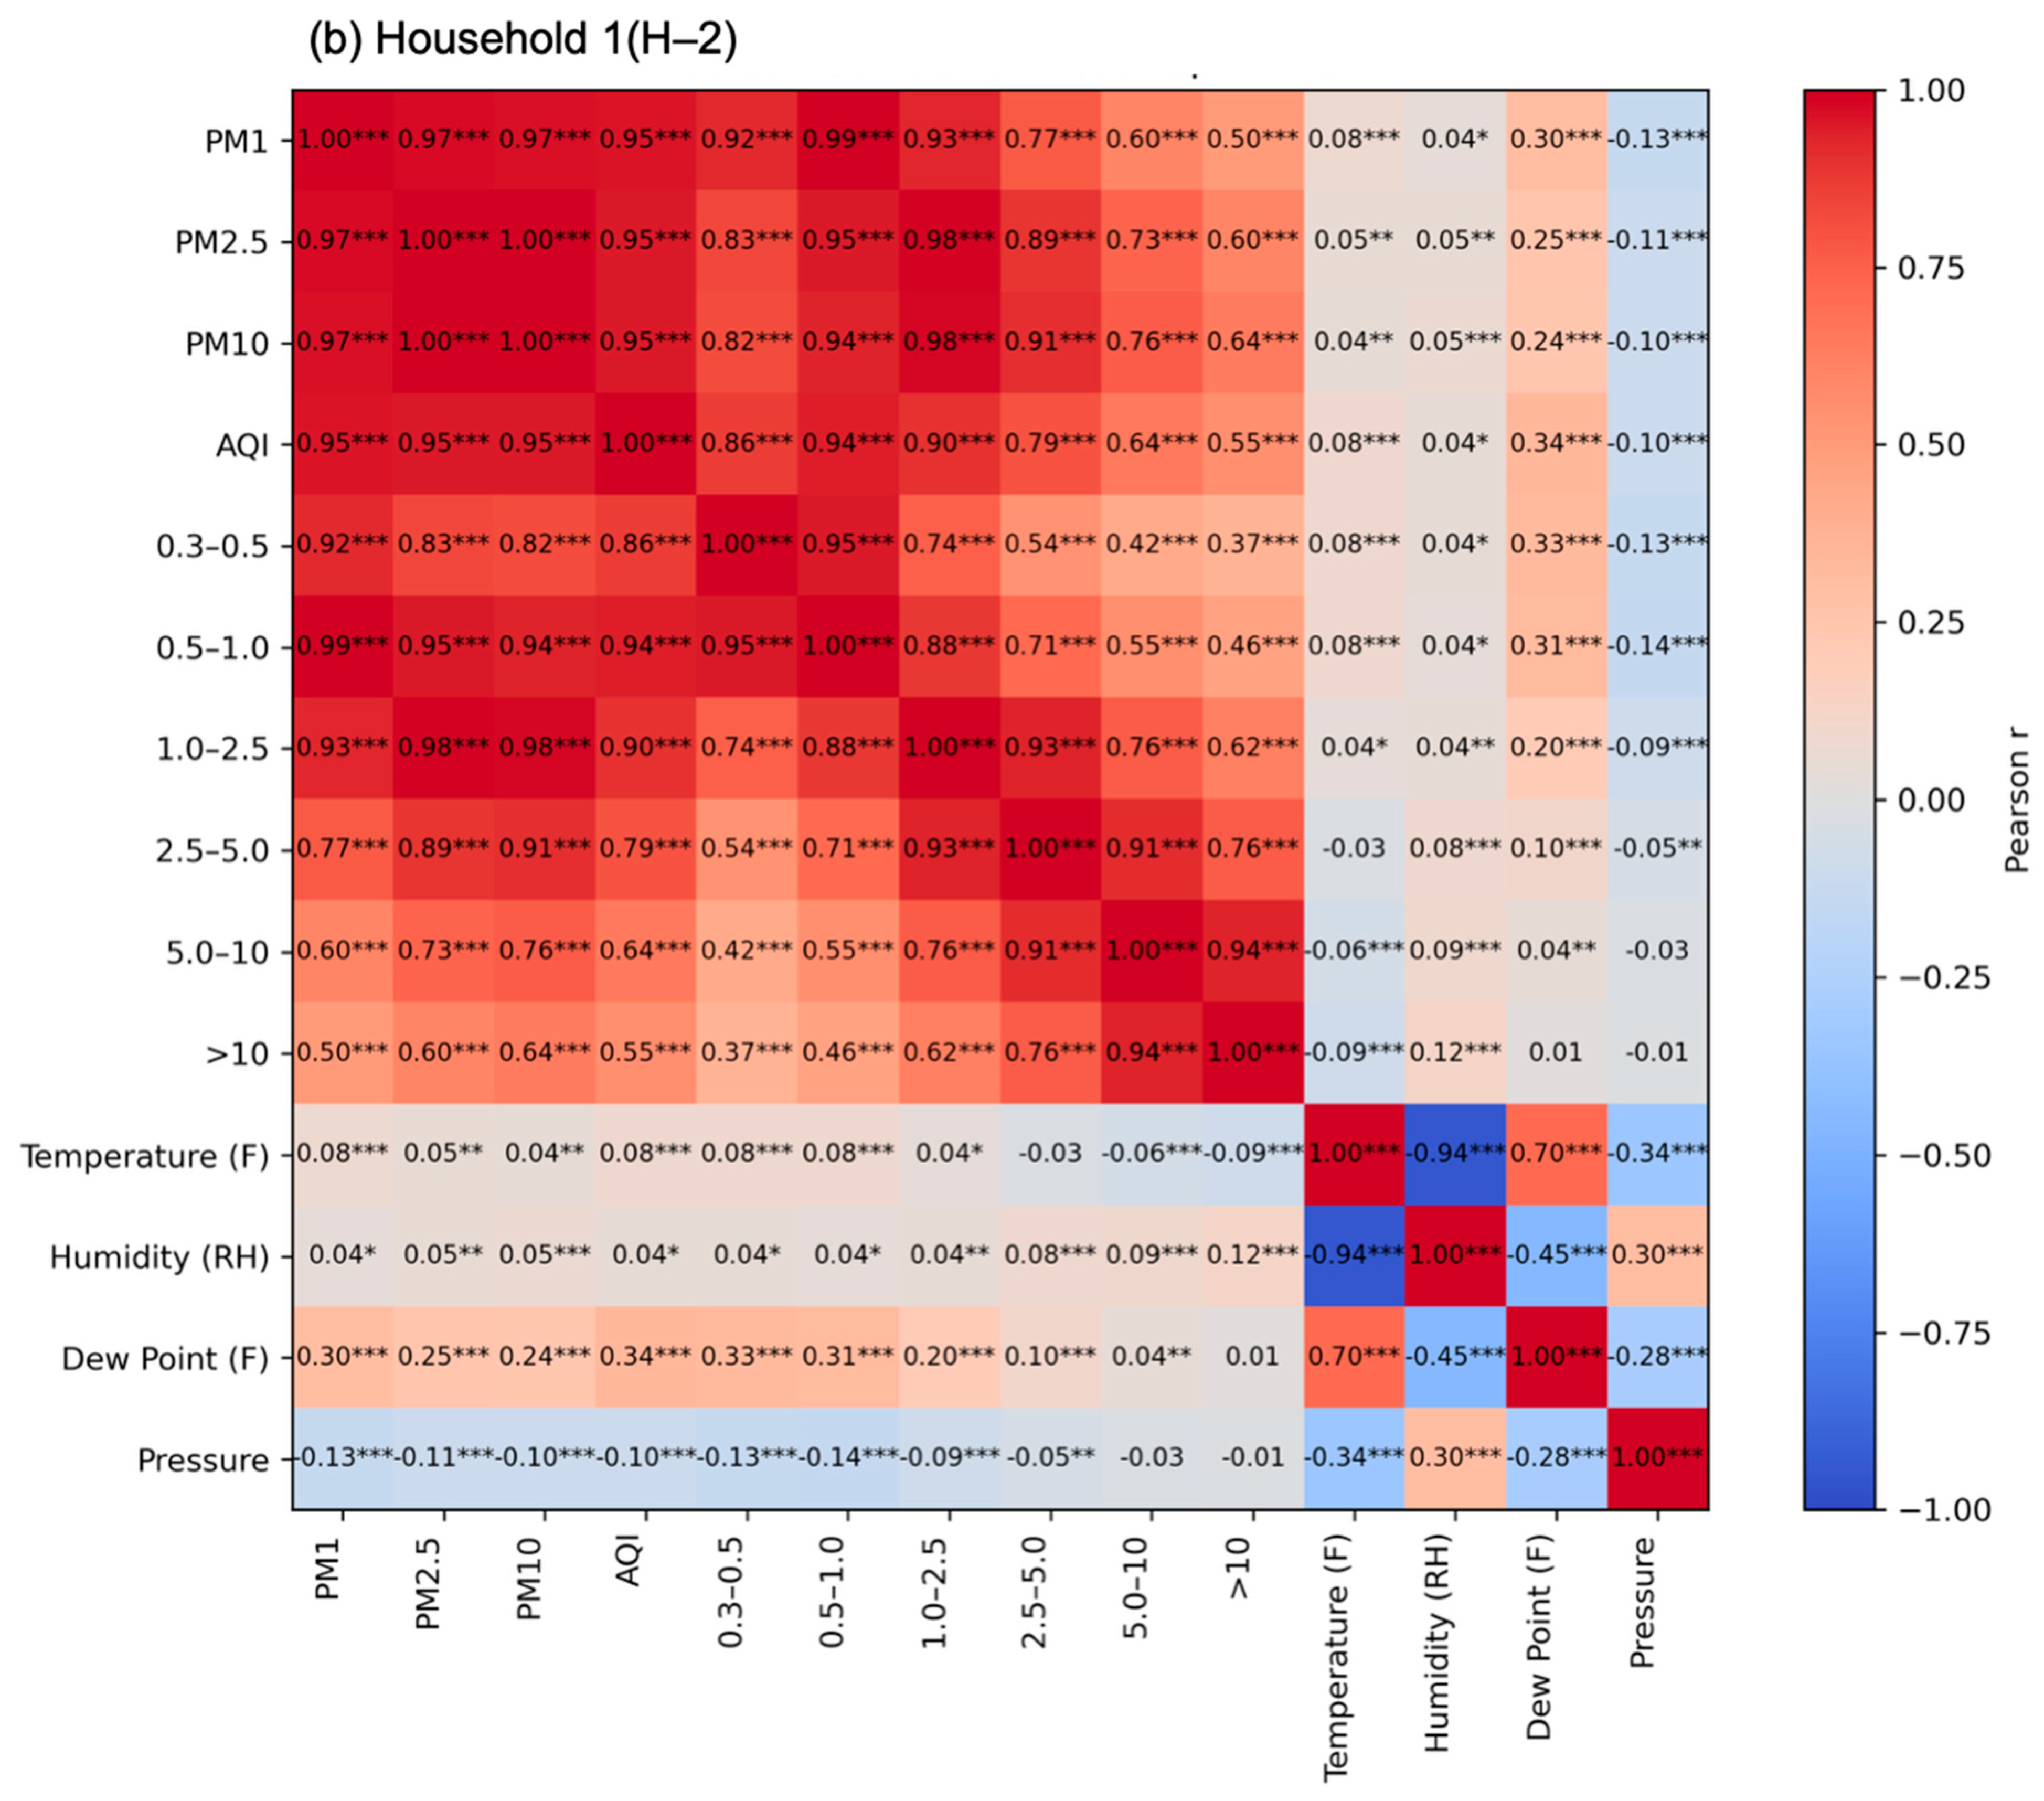
Correlation analysis further supported these observations. Pearson correlation heatmaps (Figure 9) revealed strong positive relationships (r > 0.95) among PM1, PM2.5, PM10, and AQI, particularly during high-emission cooking periods. The number concentrations of smaller particles (0.3–1.0 µm) also showed strong correlations with PM1 and PM2.5 (r = 0.80–0.97), especially in H-2 and H-3. In contrast, larger particle fractions (2.5–5.0 µm and >10 µm) exhibited weaker correlations, suggesting contributions from non-combustion sources such as human movement or dust resuspension.
It should also be noted that the type of food being cooked can influence particle emissions, particularly those with high fat content that may produce more smoke during frying or grilling. Although this study did not systematically record specific ingredients, observational context indicated that on 30 March, the day before Eid al-Fitr, all three households prepared beef dishes as part of the celebration. This likely contributed to the exceptionally high PM levels observed on that day. We have acknowledged the absence of detailed food-type information as a limitation and recommend that future studies incorporate systematic recording of cooking ingredients and methods to better link food type with emission patterns.
The estimated Chronic Daily Intake (CDI) of PM2.5 varied across the three households summarized in Table S3. For women, CDI values ranged from 0.0091 to 0.0131 mg·kg−1·day−1, while for children the values were higher, ranging from 0.0246 to 0.0355 mg·kg−1·day−1. These findings indicate that children experience approximately 2.5–3 times greater inhaled doses per body weight compared to women under the same household conditions.

4. Conclusions and Recommendation

This study investigated indoor air quality in a remote rural village in West Sumatra, Indonesia, during a culturally significant period characterized by intensive cooking activities. Using low-cost PurpleAir sensors, we conducted six days of continuous monitoring in three traditional households that rely primarily on firewood for cooking. The results revealed substantial fluctuations in PM1, PM2.5, and PM10 concentrations, with peak levels consistently aligning with morning and evening cooking periods. The most extreme pollution events occurred on 30th March, ahead of the Eid al-Fitr celebration, when communal food preparation was at its peak. PM2.5 levels exceeded 200 µg/m3 in some households, far surpassing WHO indoor air quality guidelines. Size-segregated number concentrations further emphasized the dominance of fine and ultrafine particles (0.3–0.5 µm), which reached concentrations above 15,000 particles/dL during cooking. These particles, produced by incomplete combustion, pose significant health risks due to their deep lung penetration capabilities. Correlation analysis confirmed strong relationships among PM mass fractions and AQI (r > 0.95), while number concentrations of smaller particles were closely associated with PM1 and PM2.5 levels. In summary, traditional indoor cooking with solid fuels in rural, poorly ventilated homes significantly degrades indoor air quality and elevates exposure to harmful fine particles. These findings underscore the critical need for targeted interventions, including improved kitchen ventilation, the adoption of cleaner cooking technologies, and community-based education initiatives. This study not only highlights a pressing environmental health issue in rural Indonesia but also provides broader insights applicable to similar low-resource settings across Southeast Asia.
The findings of this study have several implications for IAQ interventions and policy development in rural Indonesia. First, the high PM levels in households that rely on firewood highlight the urgent need for cleaner stove technologies, such as improved biomass stoves. Second, simple ventilation enhancements, including the installation of larger windows and using chimneys to reduce pollutant accumulation indoors. And third, behavioral interventions, such as keeping windows open for longer period after cooking to mitigate and prevent the accumulation of PM indoors.

Supplementary Materials

The following supporting information can be downloaded at: https://www.mdpi.com/article/10.3390/atmos16101124/s1, Table S1. Day and nighttime average of all parameters and PM ratio in all households; Table S2. Hourly average and stdev of size-resolved PMs in all households.; Table S3. CDI for women and children in each household.

Author Contributions

Conceptualization, M.A.; methodology, M.A.; formal analysis, M.A.; investigation, M.A.; resources, M.A.; data curation, M.A.; writing—original draft preparation, M.A.; writing—review and editing, V.S.B., Z.A.H., M.H., visualization, M.A.; supervision, V.S.B. All authors have read and agreed to the published version of the manuscript.

Funding

This research did not receive any specific grant from funding agencies in the public, commercial, or not-for-profit sectors.

Institutional Review Board Statement

Not applicable.

Informed Consent Statement

Not applicable.

Data Availability Statement

The datasets generated and/or analyzed during the current study are not publicly available but are available from the corresponding author for reasonable request.

Acknowledgments

The authors would like to express their sincere gratitude to the residents of Jorong V Botung, West Sumatra, for their generous cooperation and hospitality during the sampling period. This study would not have been possible without their willingness to allow access to their homes and actively support the data collection process. We deeply appreciate their contribution to advancing knowledge on indoor air quality in rural Indonesia.

Conflicts of Interest

The authors declare that they have no known competing financial interests or personal relationships that could have appeared to influence the work reported in this paper.

References

  1. Gilbey, S.E.; Reid, C.M.; Zhao, Y.; Soares, M.J.; Rumchev, K.B. Factors affecting indoor environmental air quality of non-smoking residences in Perth, Western Australia. Indoor Built Environ. 2023, 32, 961–976. [Google Scholar] [CrossRef]
  2. Morino-Rangel, A.; Baek, J.; Roh, T.; Xu, X.; Carrillo, G. Assessing impact of household intervention on indoor air quality and health of children with asthma in the US-Mexico border: A pilot study. J. Environ. Public Health 2020, 2020, 6042146. [Google Scholar] [CrossRef] [PubMed]
  3. Tahir, A.; Abbasi, N.A.; He, C.; Ahmad, S.R. Exposure and human health risk assessment of chlorinated paraffins in indoor and outdoor dust from a metropolitan city, Lahore, Pakistan. Chemosphere 2023, 340, 140687. [Google Scholar] [CrossRef] [PubMed]
  4. Kaewrat, J.; Janta, R.; Sichum, S.; Kanabkaew, T. Indoor air quality and human health risk assessment in the open-air classroom. Sustainability 2021, 13, 8302. [Google Scholar] [CrossRef]
  5. Kuehn, B.M. WHO: More than 7 million air pollution deaths each year. JAMA 2014, 311, 1486. [Google Scholar] [CrossRef]
  6. Azad, S.; Bahauddin, K.M.; Uddin, M.H.; Parveen, S. Indoor air pollution and prevalence of acute respiratory infection among children in rural area of Bangladesh. J. Biol. Agric. Healthc. 2014, 4, 60–71. [Google Scholar]
  7. Krishnamoorthy, Y.; Sarveswaran, G.; Sivaranjini, K.; Sakthivel, M.; Majella, M.G.; Kumar, S. Association between indoor air pollution and cognitive impairment among adults in rural Puducherry, South India. J. Neurosci. Rural. Pract. 2018, 9, 529–534. [Google Scholar] [CrossRef]
  8. Rajper, S.A.; Nazir, A.; Ullah, S.; Li, Z. Perceived health risks of exposure to indoor air pollution from cooking fuels in Sindh, Pakistan. Pol. J. Environ. Stud. 2020, 29, 2833–2844. [Google Scholar] [CrossRef]
  9. Mannan, M.; Al-Ghamdi, S.G. Indoor air quality in buildings: A comprehensive review on the factors influencing air pollution in residential and commercial structure. Int. J. Environ. Res. Public Health 2021, 18, 3276. [Google Scholar] [CrossRef] [PubMed]
  10. Clark, M.L.; Reynolds, S.J.; Burch, J.B.; Conway, S.; Bachand, A.; Peel, J.L. Indoor air pollution, cookstove quality, and housing characteristics in two Honduran communities. Environ. Res. 2010, 110, 12–18. [Google Scholar] [CrossRef]
  11. Lee, H.; Pan, C.; Hsu, H. Indoor air quality and improvement strategies of using mechanical ventilation in confined spaces. In Proceedings of the 2023 9th International Conference on Applied System Innovation (ICASI), Chiba, Japan, 21–25 April 2023; pp. 261–263. [Google Scholar]
  12. Indu, G.; Sm, S.N.; Mahesh, P.A. Indoor air pollution in rural south Indian kitchens from biomass-fuel usage and the predicted lung deposition in women. Atmos. Environ. 2024, 336, 120732. [Google Scholar] [CrossRef]
  13. Sonntag, D.B.; Jung, H.; Harline, R.P.; Peterson, T.C.; Willis, S.E.; Christensen, T.R.; Johnston, J.D. Infiltration of Outdoor PM2.5 Pollution into Homes with Evaporative Coolers in Utah County. Sustainability 2024, 16, 177. [Google Scholar] [CrossRef]
  14. Nkosi, V.; Wichmann, J.; Voyi, K.V. Indoor and outdoor PM10 levels at schools located near mine dumps in Gauteng and North West Provinces, South Africa. BMC Public Health 2017, 17, 42. [Google Scholar] [CrossRef]
  15. Yun, H.; Seo, J.H.; Yang, J. Development of particle filters for portable air purifiers by combining melt-blown and polytetrafluoroethylene to improve durability and performance. Indoor Air 2024, 2024, 5055615. [Google Scholar] [CrossRef]
  16. Yun, H.; Seo, J.H.; Kim, Y.G.; Yang, J. Impact of scented candle use on indoor air quality and airborne microbiome. Sci. Rep. 2025, 15, 5543. [Google Scholar] [CrossRef] [PubMed]
  17. Lado, E.P.; Awiti, J.O.; Mwai, D. The effect of indoor air pollution on under-five child health in South Sudan. BMC Public Health 2025, 25, 2124. [Google Scholar] [CrossRef]
  18. Kim, S.; Gurmu, B.L.; Kim, M.; Song, C.; Lee, M.; Lim, C.C.; Rule, A.M.; Yang, K.I. Effect of indoor air quality on potential risk of obstructive sleep apnea: Results from Korea National Health and Nutrition Examination Survey. BMC Public Health 2025, 25, 1306. [Google Scholar] [CrossRef]
  19. Muoth, C.; Grossgarten, M.; Karst, U.; Ruiz, J.; Astruc, D.; Moya, S.E.; Diener, L.; Grieder, K.; Wichser, A.; Jochum, W.; et al. Impact of particle size and surface modification on gold nanoparticle penetration into human placental microtissues. Nanomedicine 2017, 12, 1119–1133. [Google Scholar] [CrossRef]
  20. Löndahl, J.; Wollmer, P.; Gudmundsson, A.; Nicklasson, H.; Swietlicki, E.; Rissler, J. Measurement of respiratory tract deposition of inhaled particles (0.015–5 µm), lung function and breathing pattern for a group of 67 adults and children. Eur. Respir. J. 2017, 50, PA2638. [Google Scholar]
  21. Chen, L.; Yousaf, M.; Xu, J.; Ma, X.; Zhou, X.; Li, G.; Symonds, J.; Chen, R.; Tang, S.; Salehi, F.; et al. Ultrafine particles deposition in human respiratory tract: Experimental measurement and modeling. Ecotoxicol. Environ. Saf. 2025, 295, 118123. [Google Scholar] [CrossRef]
  22. Singh, L.; Agarwal, T. Polycyclic aromatic hydrocarbons (PAHs) exposure through cooking environment and assessment strategies for human health implications. Hum. Ecol. Risk Assess. Int. J. 2022, 28, 635–663. [Google Scholar] [CrossRef]
  23. Feng, R.; Xu, H.; Gu, Y.; Gao, M.; Bai, Y.; Liu, M.; Shen, Z.; Sun, J.; Qu, L.; Hang Ho, S.S.; et al. Deposition effect of inhaled particles in the human: Accurate health risks of personal exposure to PAHs and their derivatives from residential solid fuel combustion. Atmos. Environ. 2023, 294, 119510. [Google Scholar] [CrossRef]
  24. Arcenas, A.L.; Bojö, J.; Larsen, B.K.; Ruiz Ñunez, F. The economic costs of indoor air pollution: New results for Indonesia, the Philippines, and Timor-Leste. J. Nat. Resour. Policy Res. 2010, 2, 75–93. [Google Scholar] [CrossRef]
  25. Sulistyorini, L.; Li, C.; Lutpiatina, L.; Utama, R.D.; Nurlailah. Gendered impact of age, toilet facilities, and cooking fuels on the occurrence of acute respiratory infections. Int. J. Environ. Res. Public Health 2022, 19, 14582. [Google Scholar] [CrossRef]
  26. Syamsiro, M.; Nasution, R.A.; Surono, U.B.; Pambudi, N.A.; Kismurtono, M. Dry and wet torrefaction of empty fruit bunch to produce clean solid fuel for cooking application. J. Phys. Conf. Ser. 2019, 1175, 012127. [Google Scholar] [CrossRef]
  27. Chen, T.; Chen, J.; Liu, Z.; Chi, K.H.; Chang, M.B. Characteristics of PM and PAHs emitted from a coal-fired boiler and the efficiencies of its air pollution control devices. J. Air Waste Manag. Assoc. 2021, 72, 85–97. [Google Scholar] [CrossRef]
  28. Jagger, P.; McCord, R.; Gallerani, A.; Hoffman, I.; Jumbe, C.B.; Pedit, J.; Phiri, S.; Krysiak, R.; Maleta, K. Household air pollution exposure and risk of tuberculosis: A case–control study of women in Lilongwe, Malawi. BMJ Public Health 2024, 2, e000176. [Google Scholar] [CrossRef]
  29. Kashtan, Y.S.; Nicholson, M.; Finnegan, C.J.; Ouyang, Z.; Lebel, E.D.; Michanowicz, D.R.; Shonkoff, S.B.; Jackson, R.B. Gas and propane combustion from stoves emits benzene and increases indoor air pollution. Environ. Sci. Technol. 2023, 57, 9653–9663. [Google Scholar] [CrossRef]
  30. Zhou, G.; Yang, Y.; Jing, B.; Sun, B.; Hu, S.; Liu, Z. Study on temporal and spatial evolution law for dust pollution in double roadway ventilation. Environ. Sci. Pollut. Res. 2022, 29, 34419–34436. [Google Scholar] [CrossRef]
  31. Tolis, E.; Karanotas, T.; Svolakis, G.; Panaras, G.; Bartzis, J.G. Air quality in cabin environment of different passenger cars: Effect of car usage, fuel type and ventilation/infiltration conditions. Environ. Sci. Pollut. Res. 2021, 28, 51232–51241. [Google Scholar] [CrossRef] [PubMed]
  32. Maung, T.Z.; Bishop, J.E.; Holt, E.; Turner, A.M.; Pfrang, C. Indoor air pollution and the health of vulnerable groups: A systematic review focused on particulate matter (PM), volatile organic compounds (VOCs) and their effects on children and people with pre-existing lung disease. Int. J. Environ. Res. Public Health 2022, 19, 8752. [Google Scholar] [CrossRef]
  33. Basile, J.N.; Bloch, M.J. Exposure to air pollution increases the incidence of hypertension and diabetes in Black women living in Los Angeles. J. Clin. Hypertens. 2012, 14, 142–147. [Google Scholar] [CrossRef]
  34. Fasola, S.; Maio, S.; Baldacci, S.; La Grutta, S.; Ferrante, G.; Forastiere, F.; Stafoggia, M.; Gariazzo, C.; Silibello, C.; Carlino, G.; et al. Short-Term Effects of Air Pollution on Cardiovascular Hospitalizations in the Pisan Longitudinal Study. Int. J. Environ. Res. Public Health 2021, 18, 1164. [Google Scholar] [CrossRef] [PubMed]
  35. Bozzola, E.; Agostiniani, R.; Pacifici Noja, L.; Park, J.; Lauriola, P.; Nicoletti, T.; Taruscio, D.; Taruscio, G.; Mantovani, A. The impact of indoor air pollution on children’s health and well-being: The experts’ consensus. Ital. J. Pediatr. 2024, 50, 69. [Google Scholar] [CrossRef]
  36. Amin, M.; Ramadhani, A.A.; Putri, R.M.; Auliani, R.; Torabi, S.E.; Hanami, Z.A.; Suryati, I.; Bachtiar, V.S. A review of particulate matter (PM) in Indonesia: Trends, health impact, challenges, and options. Environ. Monit. Assess. 2024, 197, 11. [Google Scholar] [CrossRef]
  37. ASTAE (Asia Sustainable and Alternative Energy Program). Indonesia: Toward Universal Access to Clean Cooking; East Asia and Pacific Clean Stove Initiative Series; World Bank: Washington, DC, USA, 2013. [Google Scholar]
  38. Tryner, J.; L’orange, C.; Mehaffy, J.; Miller-Lionberg, D.; Hofstetter, J.C.; Wilson, A.; Volckens, J. Laboratory evaluation of low-cost PurpleAir PM monitors and in-field correction using co-located portable filter samplers. Atmos. Environ. 2020, 220, 117067. [Google Scholar] [CrossRef]
  39. Stavroulas, I.; Grivas, G.; Michalopoulos, P.; Liakakou, E.; Bougiatioti, A.; Kalkavouras, P.; Fameli, K.; Hatzianastassiou, N.; Mihalopoulos, N.; Gerasopoulos, E. Field Evaluation of Low-Cost PM Sensors (Purple Air PA-II) Under Variable Urban Air Quality Conditions, in Greece. Atmosphere 2020, 11, 926. [Google Scholar] [CrossRef]
  40. Smith, S.; Trefonides, T.; Srirenganathan Malarvizhi, A.; LaGarde, S.; Liu, J.; Jia, X.; Wang, Z.; Cain, J.; Huang, T.; Pourhomayoun, M.; et al. A Systematic Study of Popular Software Packages and AI/ML Models for Calibrating In Situ Air Quality Data: An Example with Purple Air Sensors. Sensors 2025, 25, 1028. [Google Scholar] [CrossRef] [PubMed]
  41. Kaur, K.; Kelly, K.E. Laboratory evaluation of the Alphasense OPC-N3, and the plantower PMS5003 and PMS6003 sensors. J. Aerosol Sci. 2023, 171, 106181. [Google Scholar] [CrossRef]
  42. U.S. Environmental Protection Agency (USEPA). Exposure Factors Handbook. EPA/600/R-09/052F; Office of Research and Development: Washington, DC, USA, 2011. [Google Scholar]
Figure 1. Study area located in Jorong V Botung, Nagari Kotonopan, Rao Utara Subdistrict, Pasaman Regency, West Sumatra Province, Indonesia.
Atmosphere 16 01124 g001
Figure 2. Real-time PMs concentration and AQI in the first location (H–1) (a) PM1 (b) PM2.5 (c) PM10 (d) AQI PM2.5. The blue highlight indicates periods of cooking activities.
Atmosphere 16 01124 g002
Figure 3. Real-time PMs concentration and AQI in the second location (H–2) (a) PM1 (b) PM2.5 (c) PM10 (d) AQI PM2.5. The blue highlight indicates periods of cooking activities.
Atmosphere 16 01124 g003
Figure 4. Real-time PMs concentration and AQI in the third location (H–3) (a) PM1 (b) PM2.5 (c) PM10 (d) AQI PM2.5. The blue highlight indicates periods of cooking activities.
Atmosphere 16 01124 g004
Figure 5. Daily average of PM2.5 in all household.
Atmosphere 16 01124 g005
Figure 6. Hourly heatmaps of PMs concentration and AQI in all locations (a) PM1 (b) PM2.5 (c) PM10 (d) AQI PM2.5.
Atmosphere 16 01124 g006
Figure 7. Hourly particle size distribution heatmap in all locations.
Atmosphere 16 01124 g007
Figure 8. Day and nighttime difference in particle size-distribution in all households (a) H-1 (b) H-2 (c) H-3.
Atmosphere 16 01124 g008
Figure 9. Pearson correlation heatmaps among the parameters in all households (a) H-1 (b) H-2 (c) H-3. * p < 0.05; ** p < 0.01; *** p < 0.001.
Atmosphere 16 01124 g009aAtmosphere 16 01124 g009bAtmosphere 16 01124 g009c
Table 1. Hourly average of PM concentration in all household.
TimePM1 (µg/m3)PM2.5 (µg/m3)PM10 (µg/m3)AQI-PM2.5 (–)
H-1H-2H-3H-1H-2H-3H-1H-2H-3H-1H-2H-3
00:00–01:0017.3 ± 20.817.6 ± 20.911.6 ± 11.426.0 ± 32.226.3 ± 33.517.3 ± 17.630.7 ± 37.028.9 ± 35.219.2 ± 19.267.7 ± 57.470.7 ± 50.255.5 ± 35.4
01:00–02:0025.2 ± 29.619.2 ± 33.47.8 ± 7.238.4 ± 48.030.5 ± 57.211.6 ± 10.943.6 ± 53.432.7 ± 59.013.3 ± 12.884.3 ± 68.266.5 ± 70.241.3 ± 29.8
02:00–03:0016.0 ± 18.95.4 ± 6.96.1 ± 7.624.0 ± 28.88.3 ± 10.69.2 ± 11.628.1 ± 33.19.3 ± 11.710.6 ± 13.363.3 ± 56.729.5 ± 28.132.1 ± 31.1
03:00–04:009.6 ± 12.44.5 ± 6.44.3 ± 4.314.3 ± 18.36.8 ± 9.46.4 ± 5.917.7 ± 22.67.8 ± 10.47.3 ± 6.045.0 ± 46.824.6 ± 25.924.7 ± 19.6
04:00–05:0017.2 ± 27.68.4 ± 10.36.9 ± 6.125.3 ± 40.012.0 ± 15.59.9 ± 8.428.7 ± 43.913.5 ± 17.110.9 ± 8.856.2 ± 61.339.3 ± 36.935.7 ± 24.9
05:00–06:00148.6 ± 112.319.2 ± 13.824.0 ± 24.2249.9 ± 233.827.8 ± 20.433.5 ± 35.1269.3 ± 259.533.3 ± 26.137.0 ± 36.8286.4 ± 194.580.6 ± 38.188.8 ± 44.0
06:00–07:0098.8 ± 59.845.4 ± 33.569.2 ± 39.6139.1 ± 95.562.9 ± 45.895.9 ± 58.7149.9 ± 106.970.9 ± 46.6103.3 ± 58.9205.3 ± 82.9138.5 ± 44.2171.8 ± 47.1
07:00–08:0059.6 ± 41.085.0 ± 62.4118.4 ± 94.880.8 ± 54.8137.5 ± 145.2183.1 ± 184.588.5 ± 54.0147.7 ± 157.1193.4 ± 193.5154.5 ± 48.1206.2 ± 113.3241.7 ± 144.4
08:00–09:0057.1 ± 48.638.5 ± 26.040.1 ± 44.382.9 ± 89.154.7 ± 38.158.0 ± 68.090.5 ± 96.159.8 ± 38.563.8 ± 69.7149.5 ± 81.5124.4 ± 42.7124.6 ± 66.7
09:00–10:0080.6 ± 66.342.9 ± 57.455.6 ± 62.4115.4 ± 120.460.5 ± 85.584.9 ± 114.6123.4 ± 125.062.8 ± 86.890.0 ± 118.9184.2 ± 101.0109.3 ± 91.2143.7 ± 104.9
10:00–11:0046.9 ± 55.526.8 ± 44.156.2 ± 81.666.4 ± 85.836.6 ± 61.581.5 ± 125.971.7 ± 88.838.2 ± 63.184.8 ± 129.4117.8 ± 93.575.4 ± 73.4127.7 ± 124.2
11:00–12:0015.3 ± 18.318.8 ± 16.756.6 ± 75.422.2 ± 27.126.1 ± 23.588.1 ± 134.025.2 ± 30.528.8 ± 26.294.9 ± 142.159.7 ± 57.275.1 ± 46.6140.6 ± 123.1
12:00–13:0013.5 ± 14.916.8 ± 16.719.0 ± 11.318.3 ± 19.323.0 ± 21.727.0 ± 16.320.8 ± 21.825.0 ± 23.530.4 ± 19.353.2 ± 50.267.2 ± 43.180.2 ± 40.8
13:00–14:0033.4 ± 53.945.1 ± 73.773.7 ± 79.649.5 ± 88.868.1 ± 119.1127.1 ± 177.854.2 ± 92.771.4 ± 122.7140.3 ± 208.693.9 ± 96.3112.8 ± 121.1176.7 ± 152.0
14:00–15:0022.2 ± 26.446.5 ± 62.977.5 ± 80.429.8 ± 34.764.9 ± 94.9116.9 ± 131.532.9 ± 36.467.8 ± 96.5122.9 ± 136.974.3 ± 55.5113.1 ± 97.0165.4 ± 129.1
15:00–16:0029.2 ± 48.277.8 ± 79.077.9 ± 87.840.5 ± 67.5117.4 ± 139.9145.0 ± 238.343.1 ± 69.6123.2 ± 148.4159.9 ± 274.977.1 ± 81.8166.1 ± 132.2197.4 ± 185.2
16:00–17:0043.8 ± 63.739.3 ± 43.269.2 ± 67.868.2 ± 112.454.5 ± 62.9106.6 ± 128.073.3 ± 117.059.0 ± 64.8114.1 ± 141.5116.4 ± 111.3111.7 ± 73.9161.6 ± 117.7
17:00–18:0072.9 ± 72.829.5 ± 32.444.6 ± 48.399.3 ± 104.244.0 ± 57.965.4 ± 79.0104.3 ± 106.349.0 ± 63.870.1 ± 82.1154.5 ± 105.4104.8 ± 60.1127.4 ± 81.9
18:00–19:0077.8 ± 67.760.6 ± 58.527.0 ± 14.6104.9 ± 92.698.6 ± 116.138.8 ± 22.4113.4 ± 99.2107.1 ± 123.142.9 ± 23.9166.3 ± 91.1162.6 ± 104.1103.4 ± 32.7
19:00–20:0081.3 ± 71.931.8 ± 20.620.5 ± 15.3112.4 ± 100.646.6 ± 32.329.4 ± 21.6122.3 ± 107.453.1 ± 35.333.2 ± 23.9169.7 ± 97.6116.5 ± 42.985.0 ± 36.6
20:00–21:0043.5 ± 66.341.7 ± 42.724.3 ± 29.159.8 ± 91.061.6 ± 65.235.9 ± 40.565.6 ± 97.467.9 ± 66.340.2 ± 42.597.9 ± 101.4129.3 ± 64.789.0 ± 56.1
21:00–22:0046.1 ± 58.835.9 ± 46.743.2 ± 40.064.7 ± 82.354.4 ± 77.463.1 ± 58.571.9 ± 88.759.8 ± 78.466.3 ± 60.1114.3 ± 91.9117.3 ± 76.0114.5 ± 70.2
22:00–23:0039.6 ± 38.025.4 ± 36.515.4 ± 19.956.1 ± 54.140.4 ± 63.723.2 ± 31.263.0 ± 58.045.0 ± 69.425.6 ± 32.9115.9 ± 64.087.7 ± 70.264.3 ± 45.8
23:00–00:0027.2 ± 26.410.1 ± 7.015.4 ± 13.339.6 ± 38.515.0 ± 11.123.1 ± 20.545.4 ± 42.016.8 ± 12.926.3 ± 23.194.9 ± 57.152.4 ± 27.769.8 ± 42.4
Disclaimer/Publisher’s Note: The statements, opinions and data contained in all publications are solely those of the individual author(s) and contributor(s) and not of MDPI and/or the editor(s). MDPI and/or the editor(s) disclaim responsibility for any injury to people or property resulting from any ideas, methods, instructions or products referred to in the content.