Article

Assessments of Satellite-Based Aerosol Optical Depth for Monitoring Air Quality of the Large Port of Busan, Korea

1
Division of Earth Environmental System Sciences, Major of Spatial Information Engineering, Pukyong National University, Busan 48513, Republic of Korea
2
Department of Civil, Urban, Earth and Environmental Engineering, Ulsan National Institute of Science and Technology, Ulsan 44919, Republic of Korea
*
Author to whom correspondence should be addressed.
Atmosphere 2025, 16(10), 1123; https://doi.org/10.3390/atmos16101123
Submission received: 21 July 2025 / Revised: 7 September 2025 / Accepted: 22 September 2025 / Published: 25 September 2025
(This article belongs to the Special Issue Atmospheric Pollution in Highly Polluted Areas)

Abstract

Busan’s major port is among the largest trading ports worldwide; however, it is also one of the ten most polluted ports globally. This study aims to assess the effectiveness of satellite-derived aerosol data for monitoring particulate matter levels in Busan. Aerosol optical depth (AOD) from the Visible Infrared Imaging Radiometer (VIIRS) Deep Blue product tends to be sparse near coastlines due to higher retrieval uncertainties. To increase the number of samples along the coastal area, we established optimized quality control criteria, resulting in more than three times the number of samples. The VIIRS AOD showed a positive correlation with surface particulate matter (PM2.5) measurements (r = 0.42). The ratios of VIIRS AOD to surface PM2.5 and PM10 were higher in coastal areas, probably due to greater hygroscopic growth of particles. This connection can assist in estimating surface PM concentrations using satellite data. Both VIIRS AOD and surface PM concentrations exhibit a negative correlation with terrain elevation, primarily due to the locations of emission sources and altitude-dependent weather factors such as temperature and humidity. We expect that combining higher-resolution ancillary databases, including digital elevation maps and meteorology, with satellite-based AOD will enhance the detail of air quality evaluations in port cities.

1. Introduction

Ports are essential hubs in the global supply chain, accommodating various industrial and logistics activities. However, they considerably exacerbate air pollution due to intensive shipping operations, cargo handling, and associated industrial activities [1]. Marine vessels generally have a much longer lifespan than road vehicles, frequently using older engines and lower-quality fuel, which results in diminished air quality in nearby areas [2]. While numerous studies have addressed outdoor air pollution from road traffic, there is still limited research on ship-related air pollution [2]. Traditional air quality monitoring in port environments primarily relies on ground-based stations; although these stations offer excellent temporal resolution, they often fall short on the spatial coverage needed to capture the diverse pollution patterns across complex port areas.
Busan stands as one of the largest trading ports worldwide. Its substantial capacity can accommodate ships exceeding 20 kilotons, which includes a range of vessels like oil tankers, cargo ships, fishing vessels, and cruise ships. Globally, it ranks among the top ten most polluted ports in terms of air quality, primarily due to activities within the port [3,4]. Nevertheless, gaining a clear understanding of air quality in port regions like Busan through ground-based in situ measurements is currently difficult, as their spatial coverage is limited by security concerns from port authorities [4].
Satellite remote sensing techniques can effectively enhance the spatial reach of ground-based air quality measurements in port cities, delivering insights into trace gases [5,6,7]. Nonetheless, aerosol retrievals for coastal pixels are quite uncertain due to difficulties arising from the subpixel mixing of land and ocean surfaces. The Deep Blue (DB) algorithm does not generate aerosol products for these pixels [8,9]. Similarly, the Dark Target (DT) algorithm also shuns unsuitable pixels that are mixed with water and land along coastlines [10]. To enhance the precision of aerosol products in coastal areas, Ahmad et al. (2010) [11] proposed new aerosol models for the Sea-viewing Wide Field-of-View Sensor (SeaWiFS) and Moderate Resolution Imaging Spectroradiometer (MODIS) measurements. However, these models continue to face uncertainties due to surface reflectance challenges near the coast [11].
Aerosol optical depth (AOD) is a key metric obtained through satellite remote sensing that measures how much light is diminished by atmospheric aerosols [12]. Elevated AOD values signify a higher quantity and size of aerosol particles, showing a positive correlation with gravitational mass concentration (or particulate matter; PM). However, this relationship is complex, as it is affected by several factors such as the vertical distribution of aerosols, the composition of particles, hygroscopic growth due to humidity, and varying meteorological conditions like temperature and wind speed [13,14,15]. Kumar et al. (2007) estimated surface PM2.5 concentrations over Delhi, India, using MODIS Dark Target AOD products with an empirical regression approach [16]. Yang et al. (2019) analyzed the relationship between PM2.5 and AOD in 368 cities across mainland China over several years; they reported significant spatiotemporal variations in this relationship, with weaker correlation over coastal regions during the warm season [17]. They also discussed the impact of topography and meteorology on the relationship to understand their fundamental relationship. Zhai et al. (2021) used the GEOS-Chem chemical transport model to analyze the main factors influencing the AOD-PM2.5 relationship across East Asia [18]. Tian et al. (2023) discussed the importance of satellite-based AOD in estimating surface PM2.5 concentrations using various machine learning methods (e.g., Random Forest, Extra-trees, XGBoost, and LightGBM), and showed that satellite data significantly contribute in remote areas with sparse surface observation stations [19]. Consequently, accurately converting satellite-derived AOD data into ground-level PM estimates necessitates careful examination of these complicating variables, especially in coastal regions.
To facilitate effective air quality management, Busan City is developing a CubeSat instrument, known as BusanSat-B, which will measure radiances and polarization at wavelengths of 410, 555, 670, and 865 nm, with a planned launch in 2026 [20]. This study aims to enhance the BusanSat mission by examining satellite-based aerosol products to gather information on aerosol concentration over Busan, Korea, utilizing a comprehensive ground-based in situ network. In our assessments, we analyze the spatiotemporal variations between the satellite-derived AOD data and ground-based measurements of PM2.5 and PM10 to understand their fundamental relationship in the vicinity of the port area. We anticipate that this study will be valuable for satellite retrieval of PM and will enhance our understanding of air pollution in coastal regions.

2. Data

2.1. S-NPP/VIIRS Deep Blue Aerosol Optical Depth

The Suomi National Polar-Orbiting Partnership (S-NPP) satellite has carried the Visible Infrared Imaging Radiometer Suite (VIIRS) since its launch in 2011. S-NPP flies in a Sun-synchronous orbit at an average altitude of 839 km and passes at around 13:30 UTC in the daytime. The VIIRS is a passive imaging spectroradiometer that measures 22 moderate-resolution channels, spanning the visible to thermal infrared range (i.e., 0.412–12.01 μm), with a nominal footprint size of 750 m at nadir [8].
In this study, we analyzed 550 nm AOD data from the NASA DB product of VIIRS in 2023 (VIIRS AOD hereafter), which utilizes the MODIS Collection 6.1 (C6.1) algorithm over land and the Satellite Ocean Aerosol Retrieval (SOAR) algorithm over water surfaces [8,9]. This version of the algorithm utilizes NASA L1b as a basis and applies additional absolute calibration corrections [8,9,21]. The MODIS C6 algorithm is a second-generation DB algorithm that provides aerosol products over vegetated surfaces and brighter surfaces (e.g., urban areas). Additionally, this version of the product features enhanced cloud detection schemes and aerosol optical models, resulting in significantly improved validation results compared to the MODIS Collection 5 data [22,23]. The SOAR algorithm was initially developed to derive aerosol information from SeaWiFS measurements and has since been extended to include VIIRS data. It is routinely processed by the NASA Atmosphere Science Investigator-led Processing System (Atmosphere SIPS) [9].
As this study aims to assess the capability of the satellite data to understand air quality over coastal areas, the primary VIIRS data are the MODIS C6.1 products over land. The quality assurance (QA) flag of the MODIS C6.1 product is assigned a QA value of 1 to 3 based on extensive validation. A retrieval with a QA value of 1 may have some potential problems with the retrieval (e.g., cloud contamination or an unrealistic surface reflectance model), while higher QA values (i.e., 2 and 3) indicate better accuracies [9]. Figure 1 shows the annual mean values of unsuitable pixel fraction (UPF) and cell average elevation (CAE) of the VIIS AOD gridded to a 0.05° resolution. The UPF values of the VIIRS DB algorithm are included in the standard level 2 product file, which is based on their quality checking criteria [9]. Note that the unsuitable pixels also include the cloud-contaminated scenes; therefore, we assume that using lower UPF values can remove the major cloudy samples. As illustrated in Figure 1a, a higher fraction of unsuitable pixels in the retrievals is distributed along the coastal areas, including the major ports of Busan (i.e., North Port and New Port of Busan), mainly due to the subpixel mixed surface type [8,9]. Therefore, utilizing retrievals with higher values of the QAs might suffer from the lack of samples in these areas. In Section 3, we analyzed the sensitivity of the AOD retrievals to various QA values to secure a larger number of satellite retrievals. As shown in Figure 1b, the terrain shape of Busan is very complex, which may result in varying levels of accuracy for the AOD products. We also analyzed its impact in the following sections.
To compare and validate the MODIS AOD data in this region, we used the nearest AERONET measurements (Version 3.0, Level 2.0) at Ulsan, South Korea (35.582° N latitude, 129.190° E longitude, and 106 m above sea level). However, note that this site is outside the range plotted in Figure 1.

2.2. Surface Air-Quality Monitoring Network of the Korea Ministry of Environment

The Korea Ministry of Environment (KME) has implemented a comprehensive air-quality monitoring network across South Korea since the early 2000s. The parameters measured include PM2.5, PM10, NO2, CO, O3, and SO2 [24]. This study involved a comparison between satellite-derived AOD data and PM2.5 and PM10 concentrations obtained through the β-ray absorption method using PM beta gauges (model PM10B.G, Wedding & Associates Inc., Pinellas Park, FL, USA) [25]. In 2023, measurements for PM were recorded at 26 locations in Busan, with the majority (24 sites) situated on the roofs of public buildings with fewer than five stories, which facilitates the measurement of ambient concentrations. Two instruments are positioned near major roads at a height of about 2.5 m above ground level to assess roadside air quality. The KME conducts monthly inspections of all instruments and implements a two-step quality assurance protocol. In the first step, it screens for abnormal data based on instrument conditions, and in the second step, it excludes any data that falls outside the normal range or rate of change. The instruments collect PM concentrations every five minutes, and these values are averaged hourly after quality assurance processes. The hourly data can be accessed publicly on the Air Korea website (https://www.airkorea.or.kr/eng/, last accessed on 21 September 2025) and were utilized for analysis in this study [24,26].

3. Results

3.1. Spatiotemporal Variabilities of the Aerosols over Busan

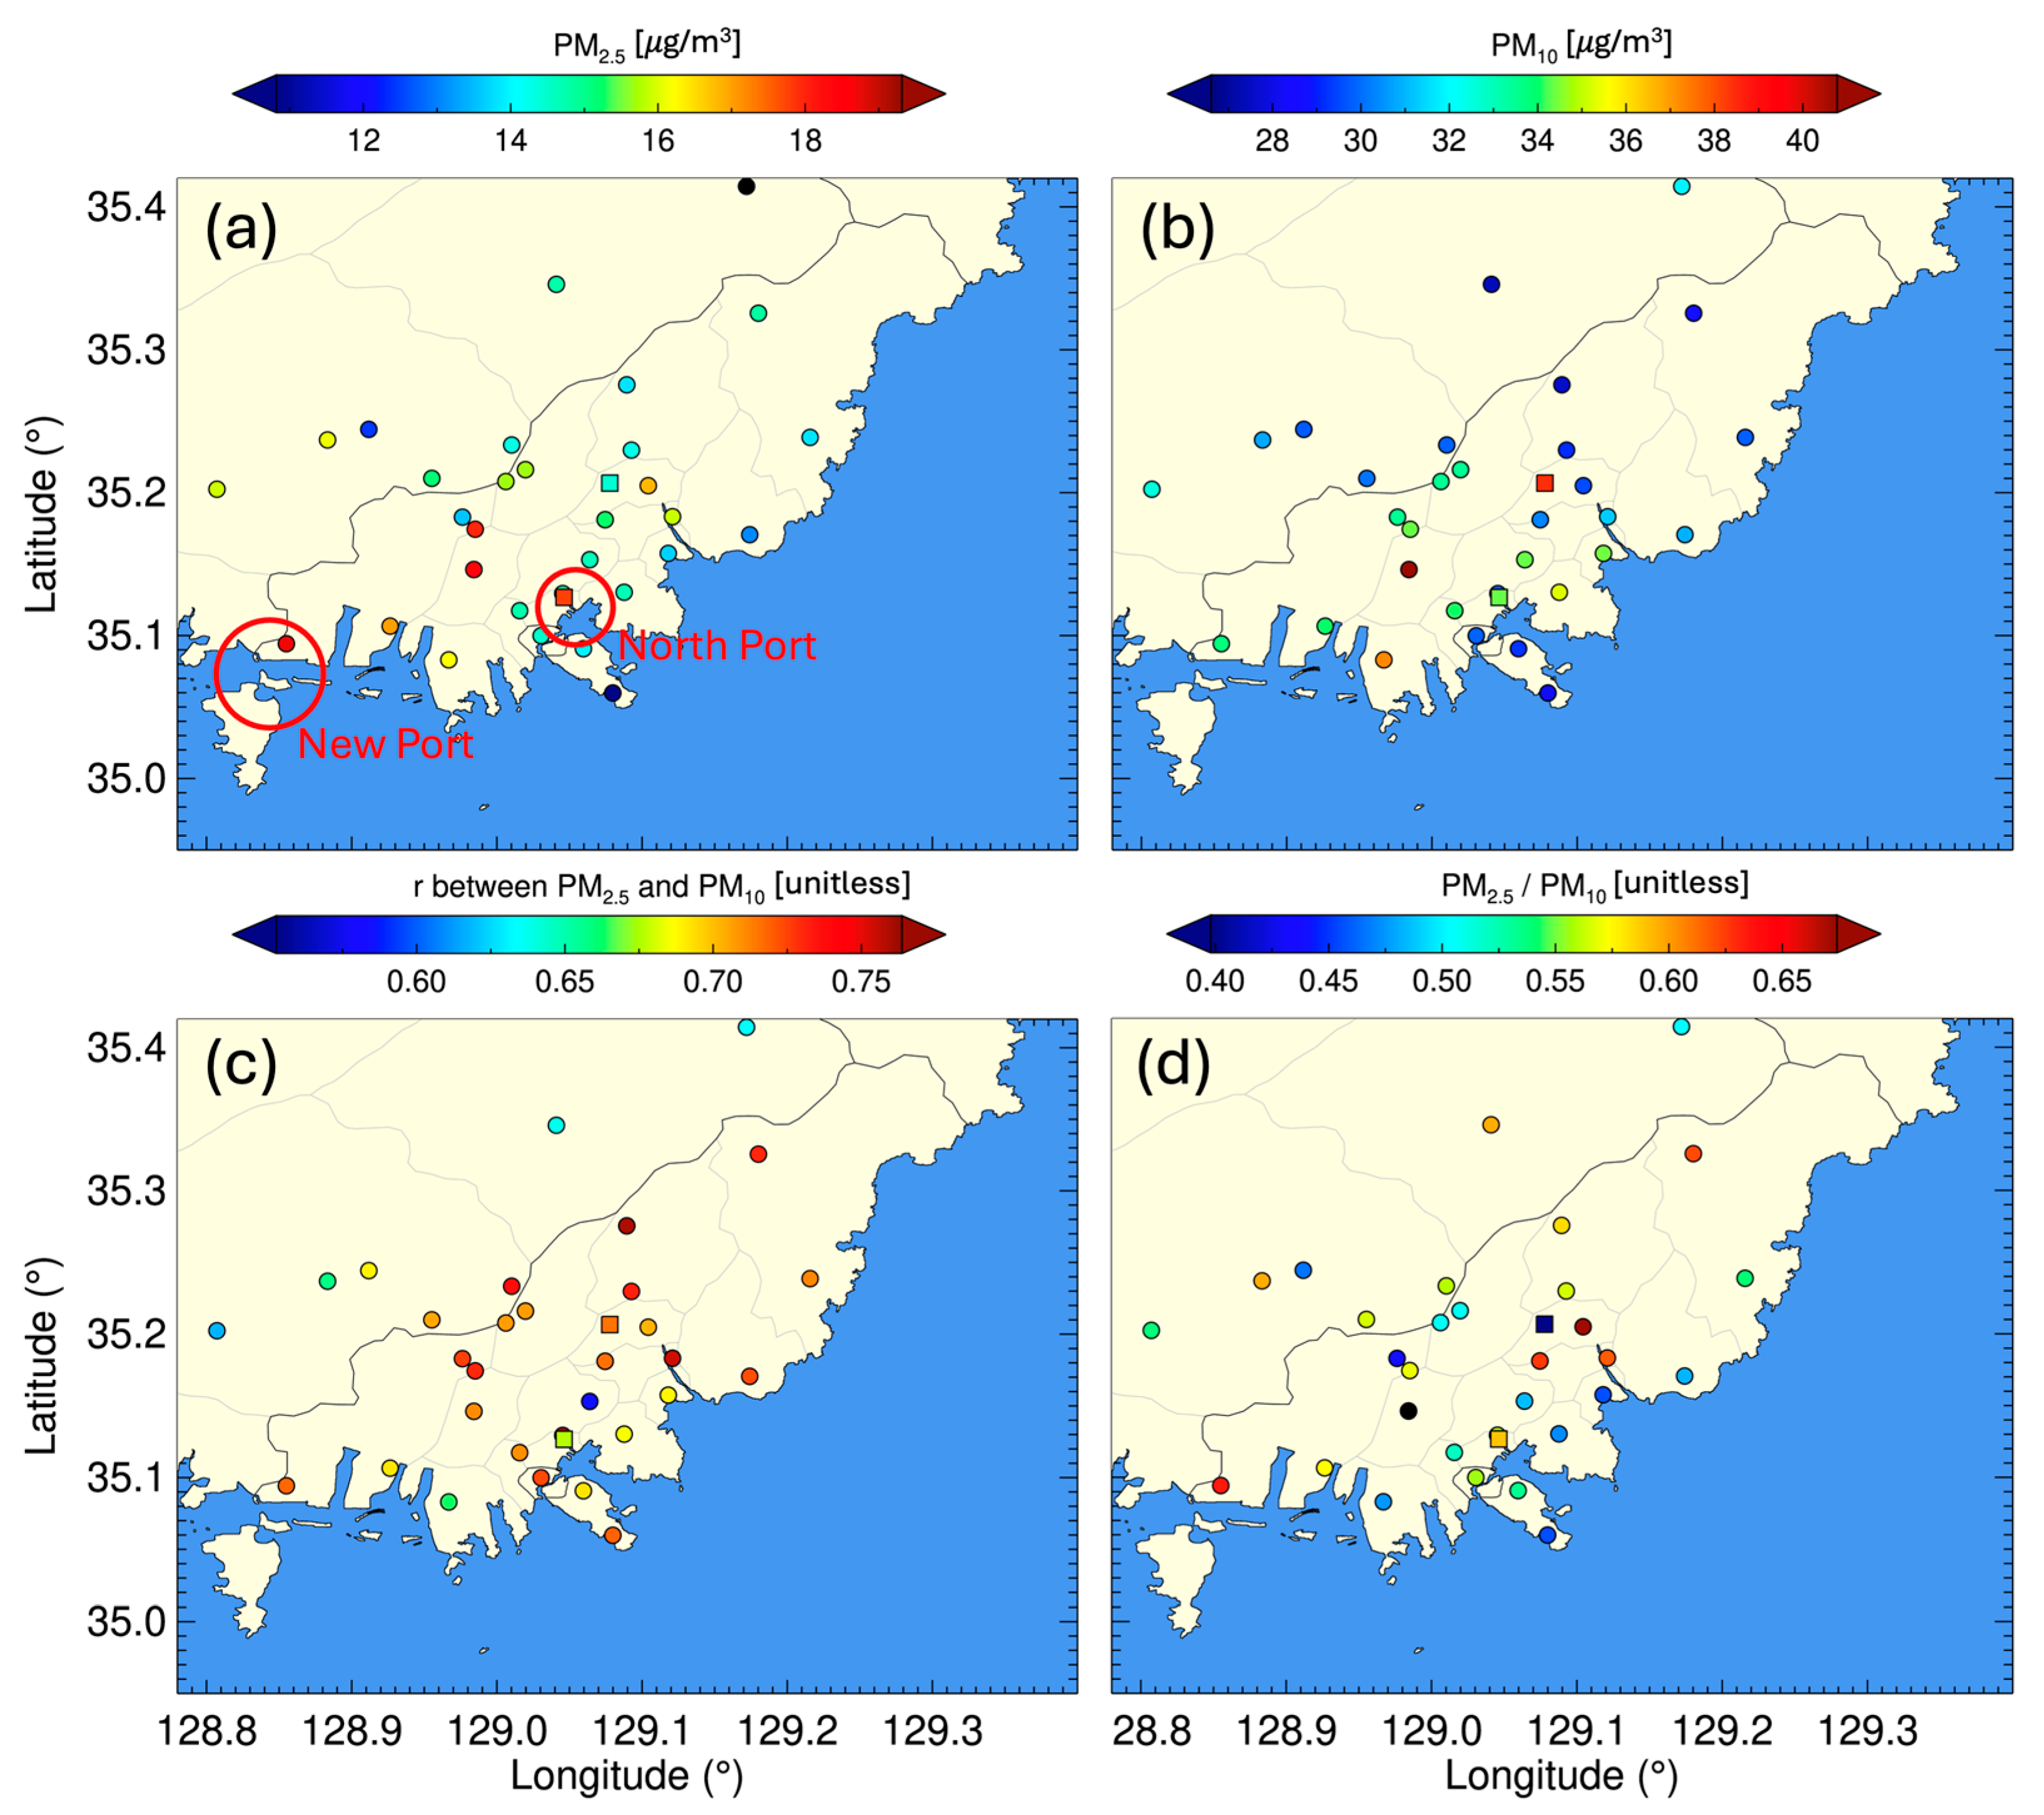
Panels a and b in Figure 2 display the average PM2.5 and PM10 levels measured by the KME network close to Busan, Korea, in 2023. The black line on this figure marks the boundary of Busan City. The colors within the circles indicate data from ambient monitoring stations, whereas the squares represent data from roadside monitoring stations. Although Busan has a greater number of measurement stations than the rural areas, the figure reveals a limited number of monitoring sites near major ports. Particularly, PM2.5 and PM10 concentrations exhibit distinct levels near North Port, demonstrating significant spatial variability in aerosol abundance (see Figure 2a,b).
The correlation and ratio between PM2.5 and PM10 reveal important insights regarding the sources and types of aerosol particles [27]. Higher correlation coefficients and ratio values indicate that PM concentrations are primarily influenced by fine particles (e.g., sulfate, nitrate, and organic aerosols). In contrast, lower values of these parameters suggest the presence of coarse particles (e.g., dust, pollen, spores, and fly ash) [27,28]. The reduced correlation at a roadside station in North Port, when compared to other locations in Busan, suggests that this area may be affected by fossil fuel combustion, as well as fly ash generated from local transportation, cargo handling, and industrial activities (Figure 2c).
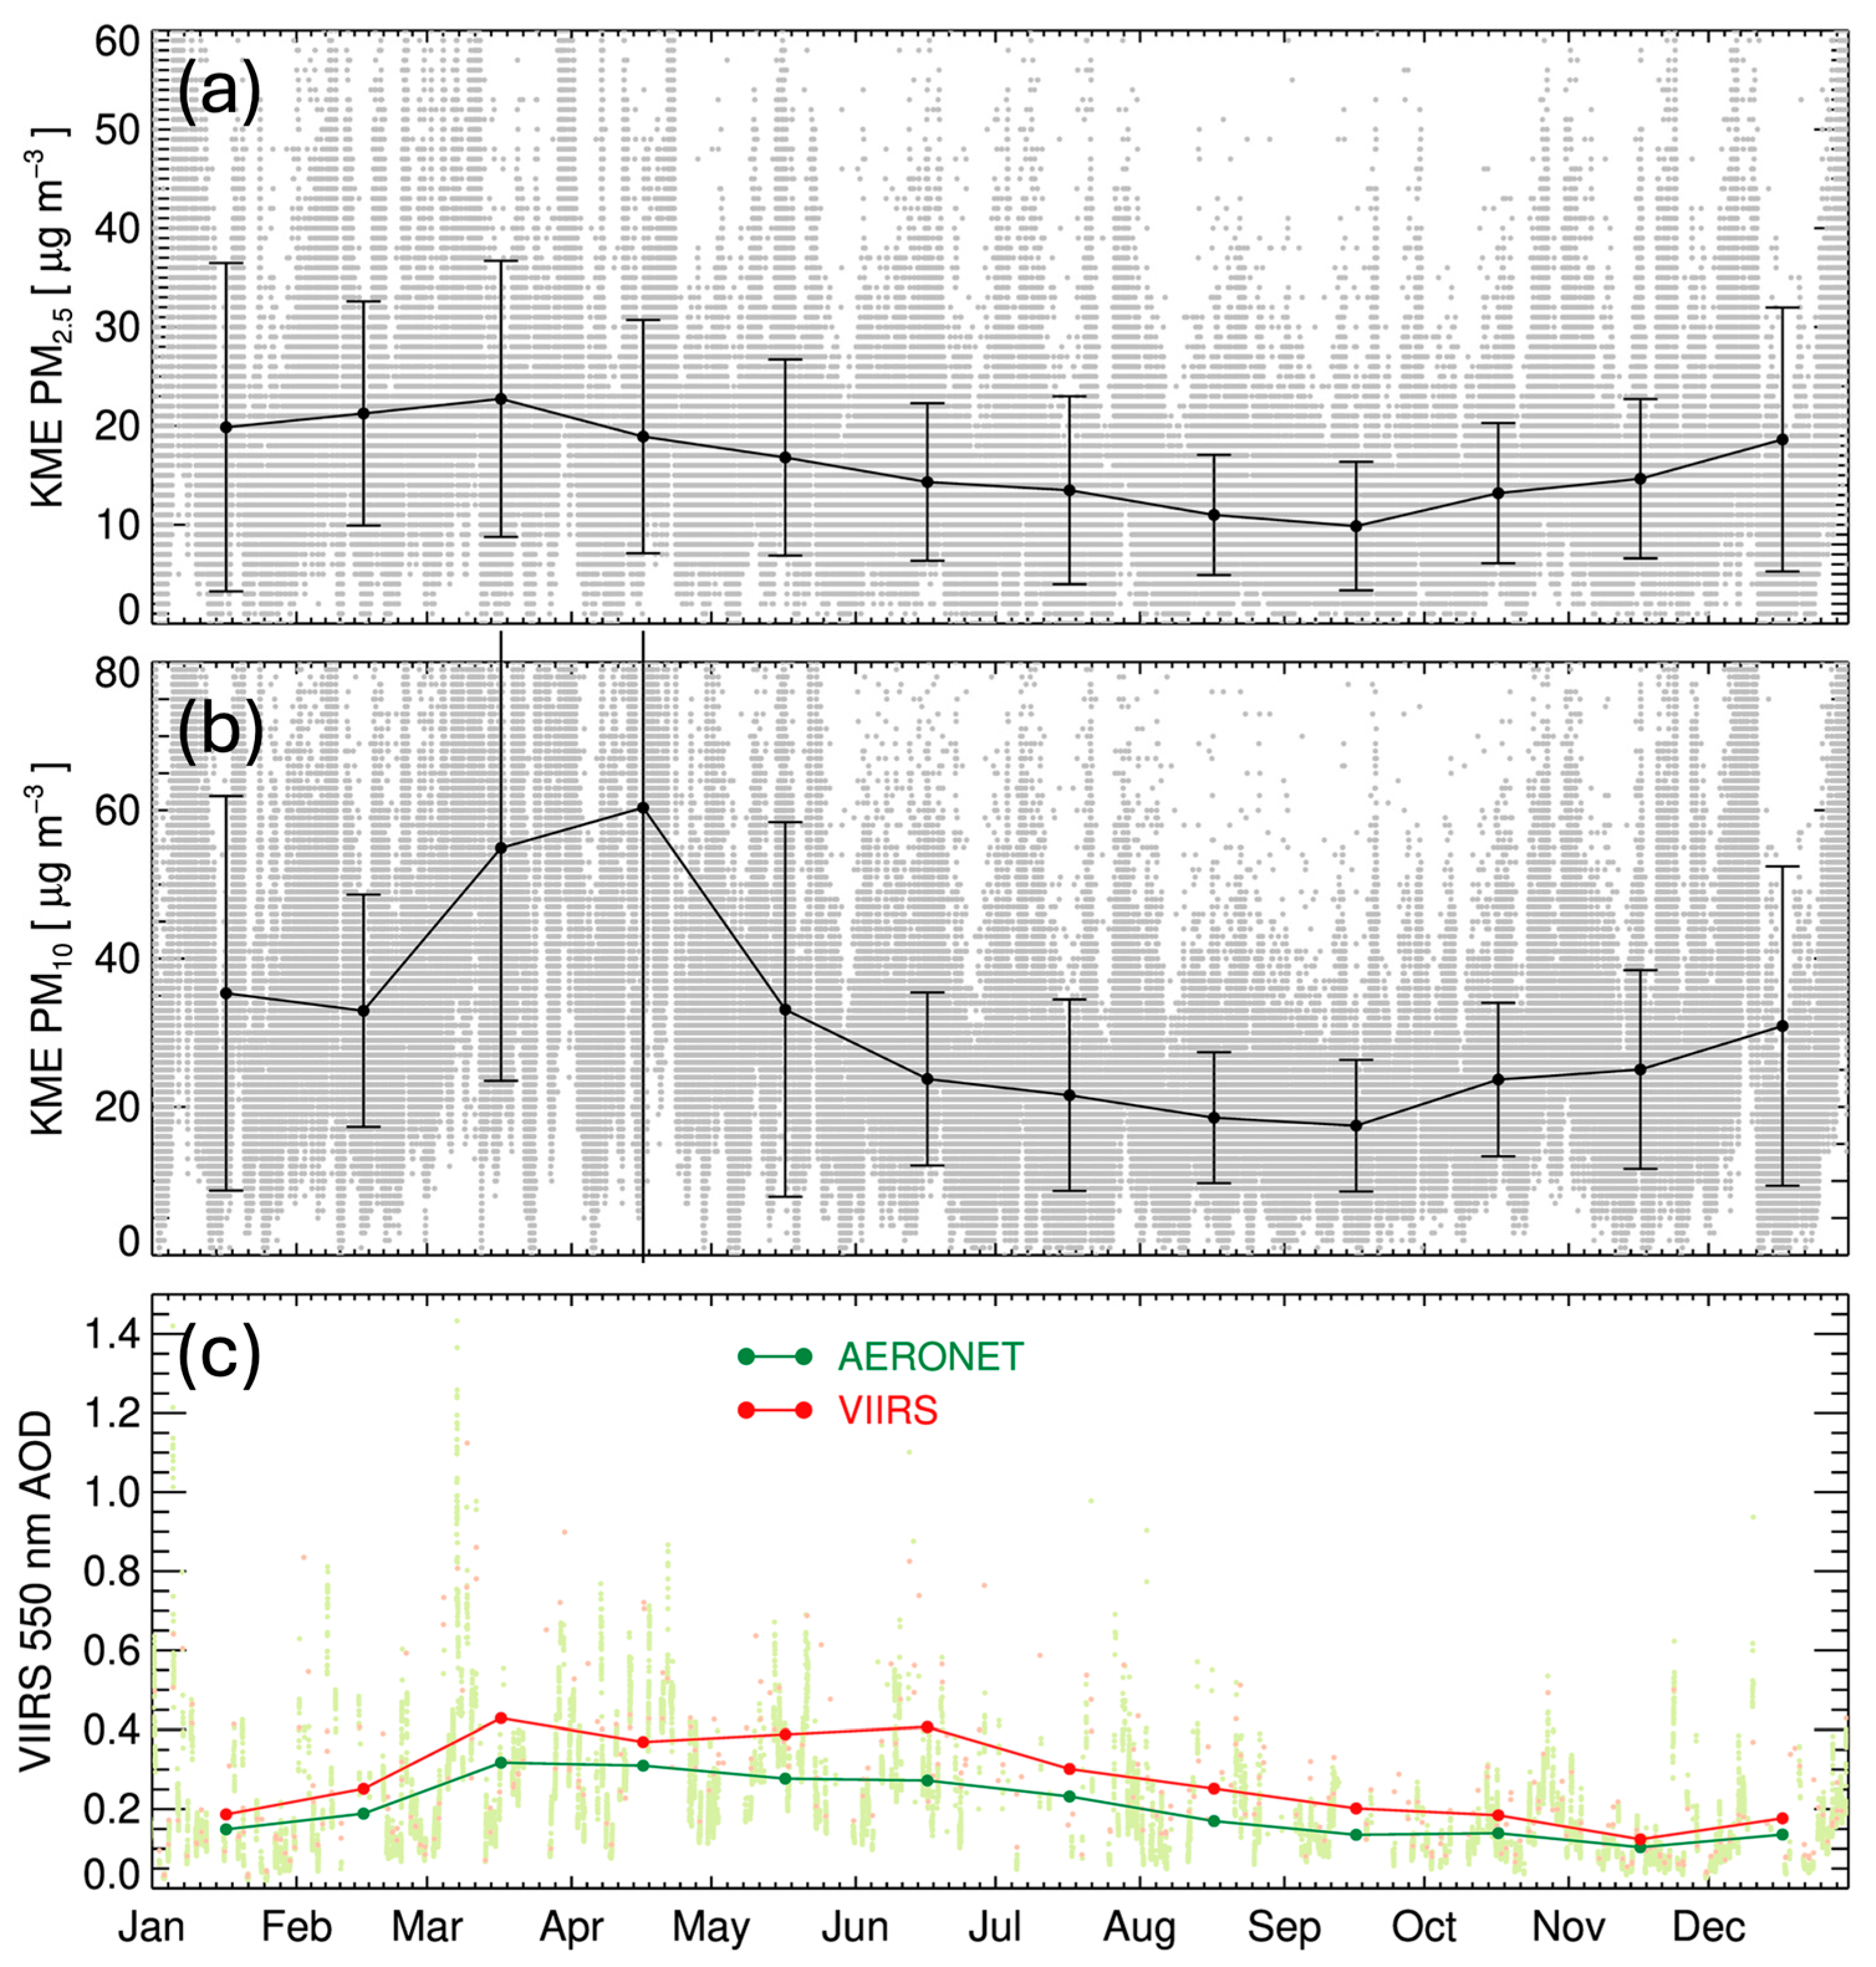
Figure 3 presents the temporal variations in PM2.5, PM10, and AOD at 550 nm within the spatial domain shown in Figure 2. With approximately 0.07 higher values of the VIIRS AOD compared to AERONET, they exhibited a high correlation (r = 0.98). Note that the AERONET AOD values are measured at a single site during the daytime, and the VIIRS values are sampled around Busan at the VIIRS overpass time, which can be associated with biases. The monthly average PM2.5 values exhibited patterns similar to those of the AOD values, indicating moderate correlation coefficients (r = 0.41 with AERONET and r = 0.30 with VIIRS), with peaks in spring, likely due to stagnant air conditions around the Korean peninsula [29], followed by decreases. However, AOD values are comparatively lower in November and December, while PM2.5 values are higher. This discrepancy is due to the less active hygroscopic growth of particles under dry conditions during this time. The PM10 concentrations were significantly higher in March and April, mainly due to increased dust transport during spring, as illustrated in Figure 3b.

3.2. Sensitivity of the Quality Standard Criteria on the VIIRS AOD

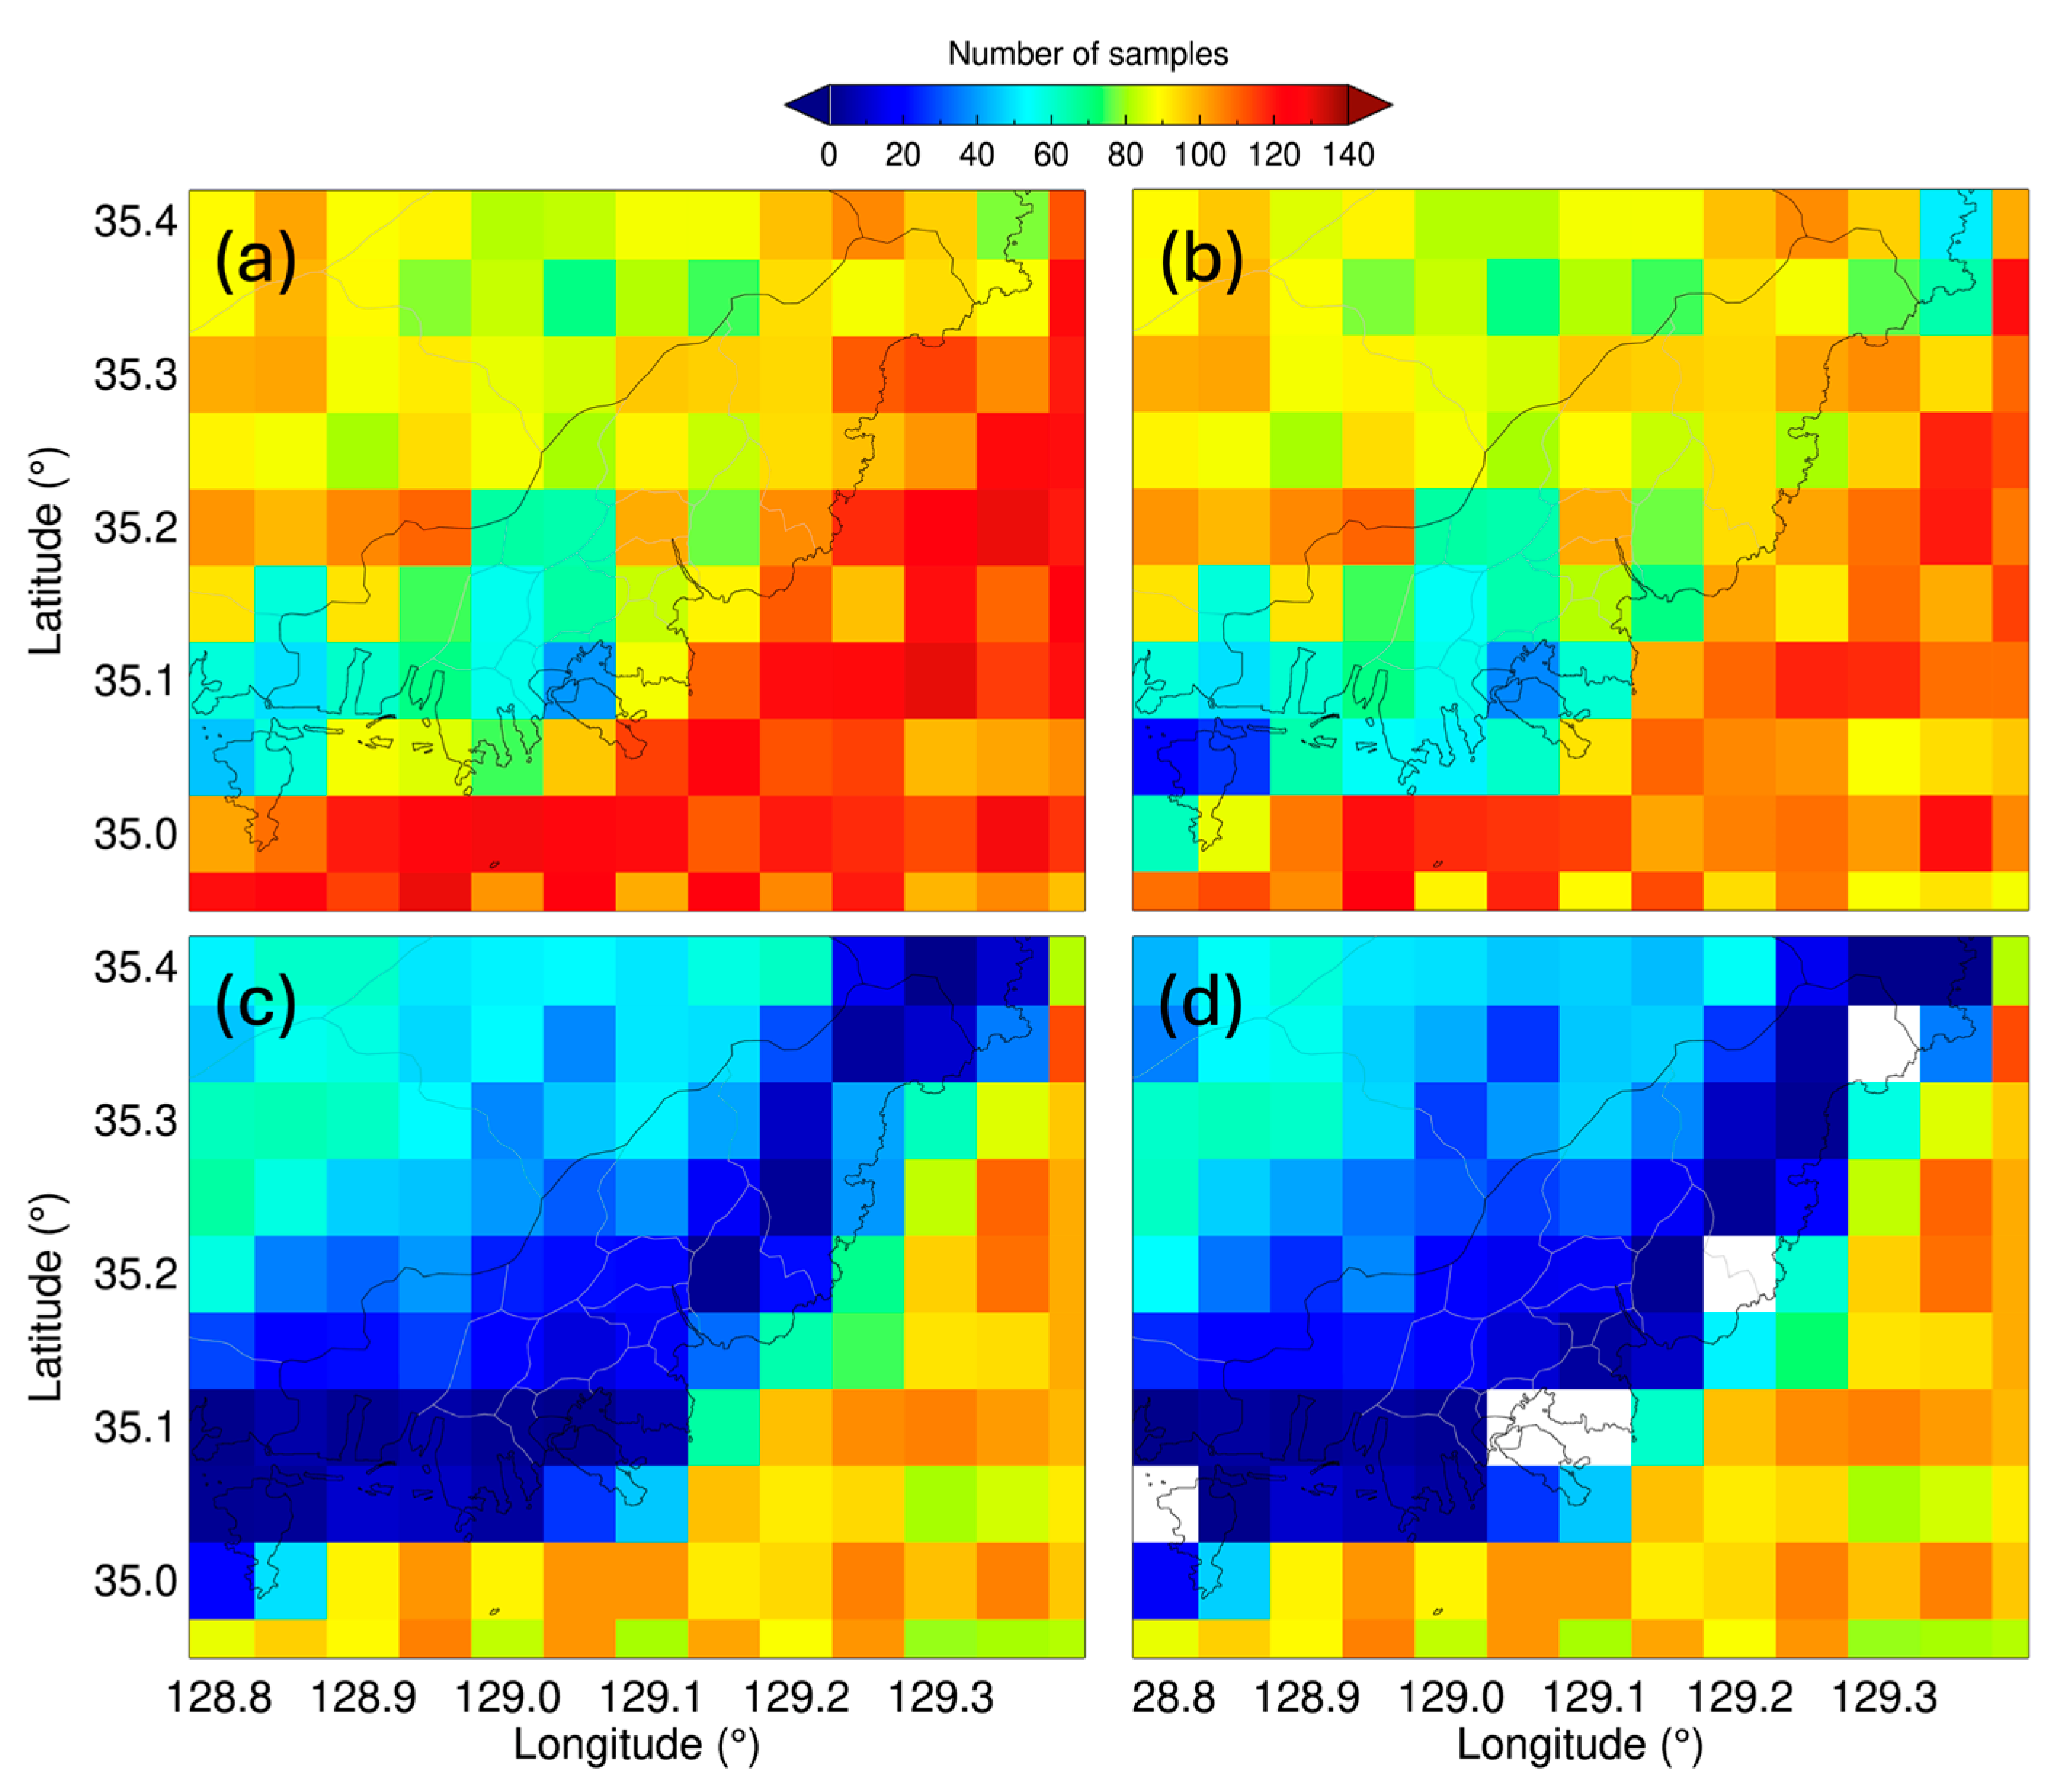
Figure 4 illustrates the number of VIIRS AOD samples categorized by different QA criteria across a 0.05° grid resolution in 2023 near Busan, Korea. In Figure 4a, the total number of AOD retrievals for all QA values (1–3) is shown, highlighting the greatest number of samples in comparison to the other panels. Figure 4b also presents the data for all AOD retrievals, concentrating on UPF values below 0.9. This suggests that unsuitable pixels make up less than 90%, indicating that at least 10% of the pixels utilized for the retrieval are considered reliable. The sample counts in Figure 4a,b are similar, but noticeable differences are observed along the coastline and in marine regions. Figure 4c shows those with QA values of 2 and 3, and Figure 4d presents those with QA of 3 only. Figure 4c,d emphasize that a significant portion of retrievals are screened when AOD retrievals with higher QA values are sorted. Specifically, the limited number of AOD samples along the coast (i.e., fewer than about 40 per year) could lead to considerable uncertainties in obtaining air quality information from satellite data in these areas.
It is generally recommended to use higher-QA retrievals of VIIRS AOD for both land and ocean [8,9]. However, given the limited availability of coastal data, we evaluated all AOD samples, including those assigned a QA of one, to obtain a greater number of satellite retrievals in coastal regions. Table 1 presents a summary of the comparison of 550 nm AOD from AERONET and VIIRS across various data quality levels, from QA levels 1 to 3, with UPF values ranging from 0 to 1. For the collocation of AERONET and VIIRS AOD data, we collected VIIRS products with pixel centers within ±0.5° of the AERONET site and averaged the AERONET samples taken within ±30 min of the VIIRS overpass time. We used a larger spatial window for the collocation because the spatial distribution of AOD is generally uniform over such areas. The VIIRS AOD retrievals exhibit enhanced consistency with AERONET data when stricter UPF criteria are applied, although this results in fewer samples (refer to Table 1). This study assesses the viability of utilizing satellite data to monitor air quality in port cities, focusing on all QA values of the VIIRS AOD data where UPF values fall below 0.9. As indicated in Table 1, this approach yields a notably larger number of samples that share comparable validation statistics. Figure 5 illustrates examples of scatter plots, including all QA values with UPF less than 0.9, QA values exceeding 1, and those above 2.
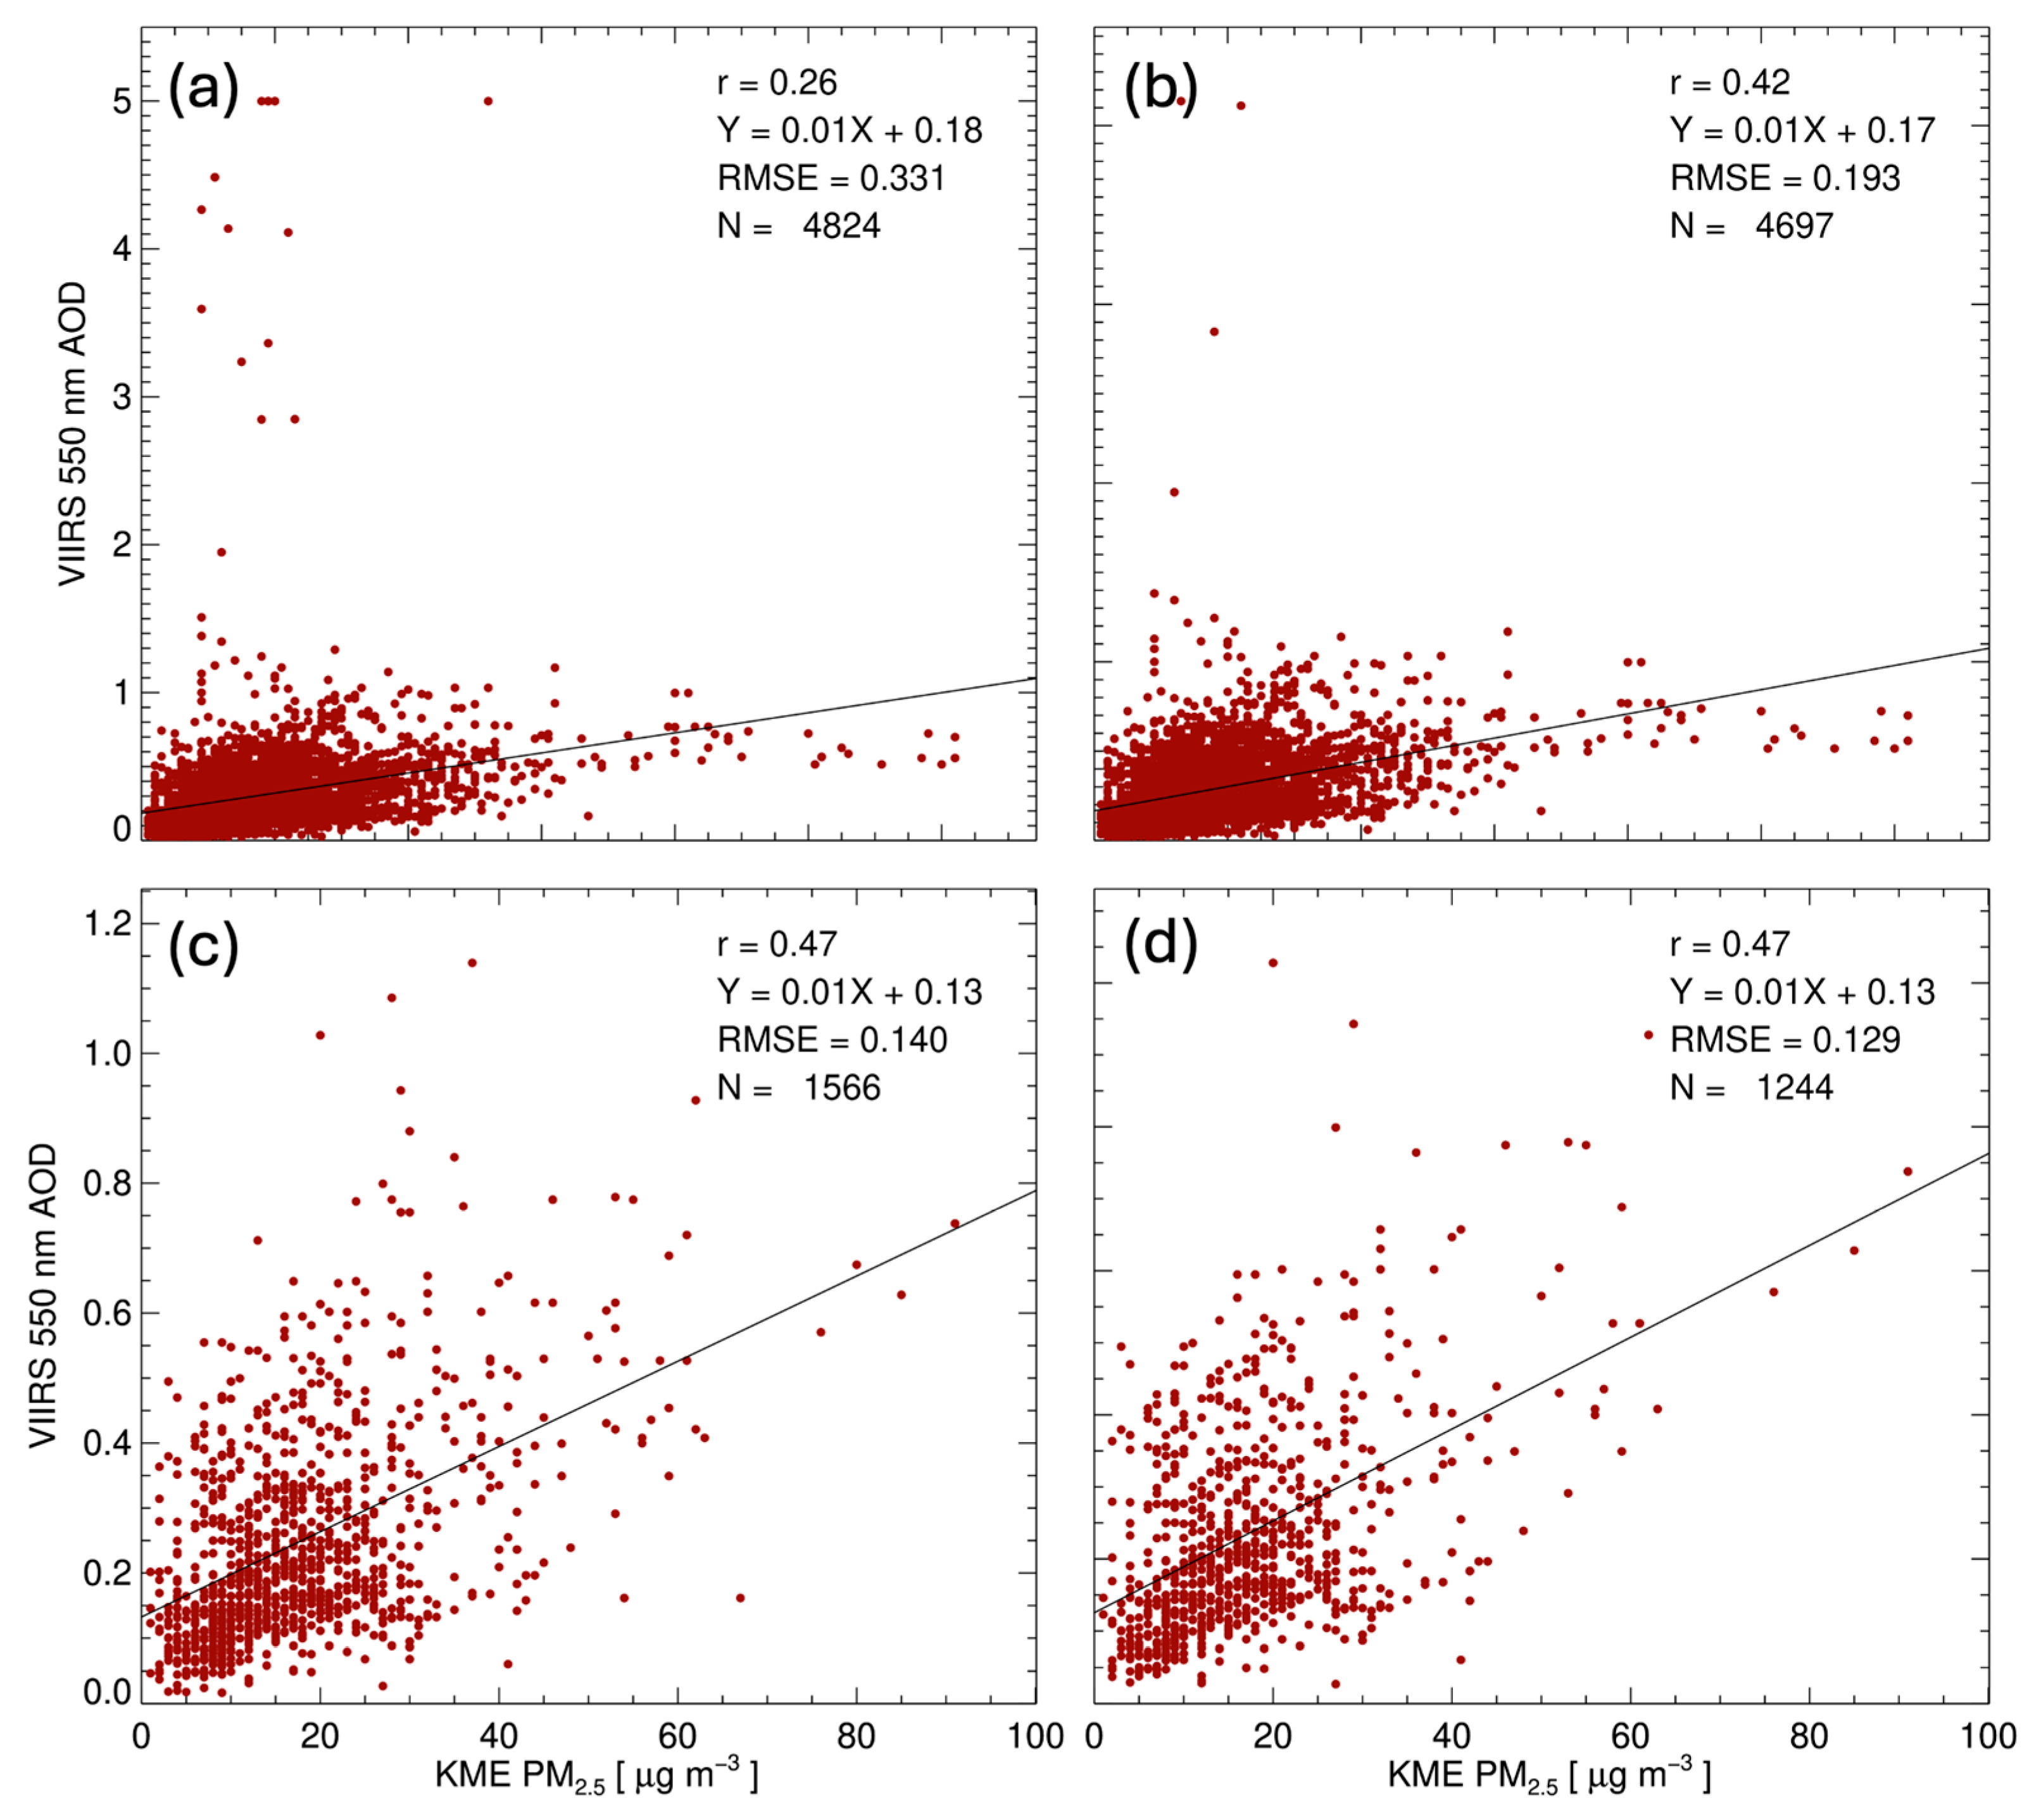
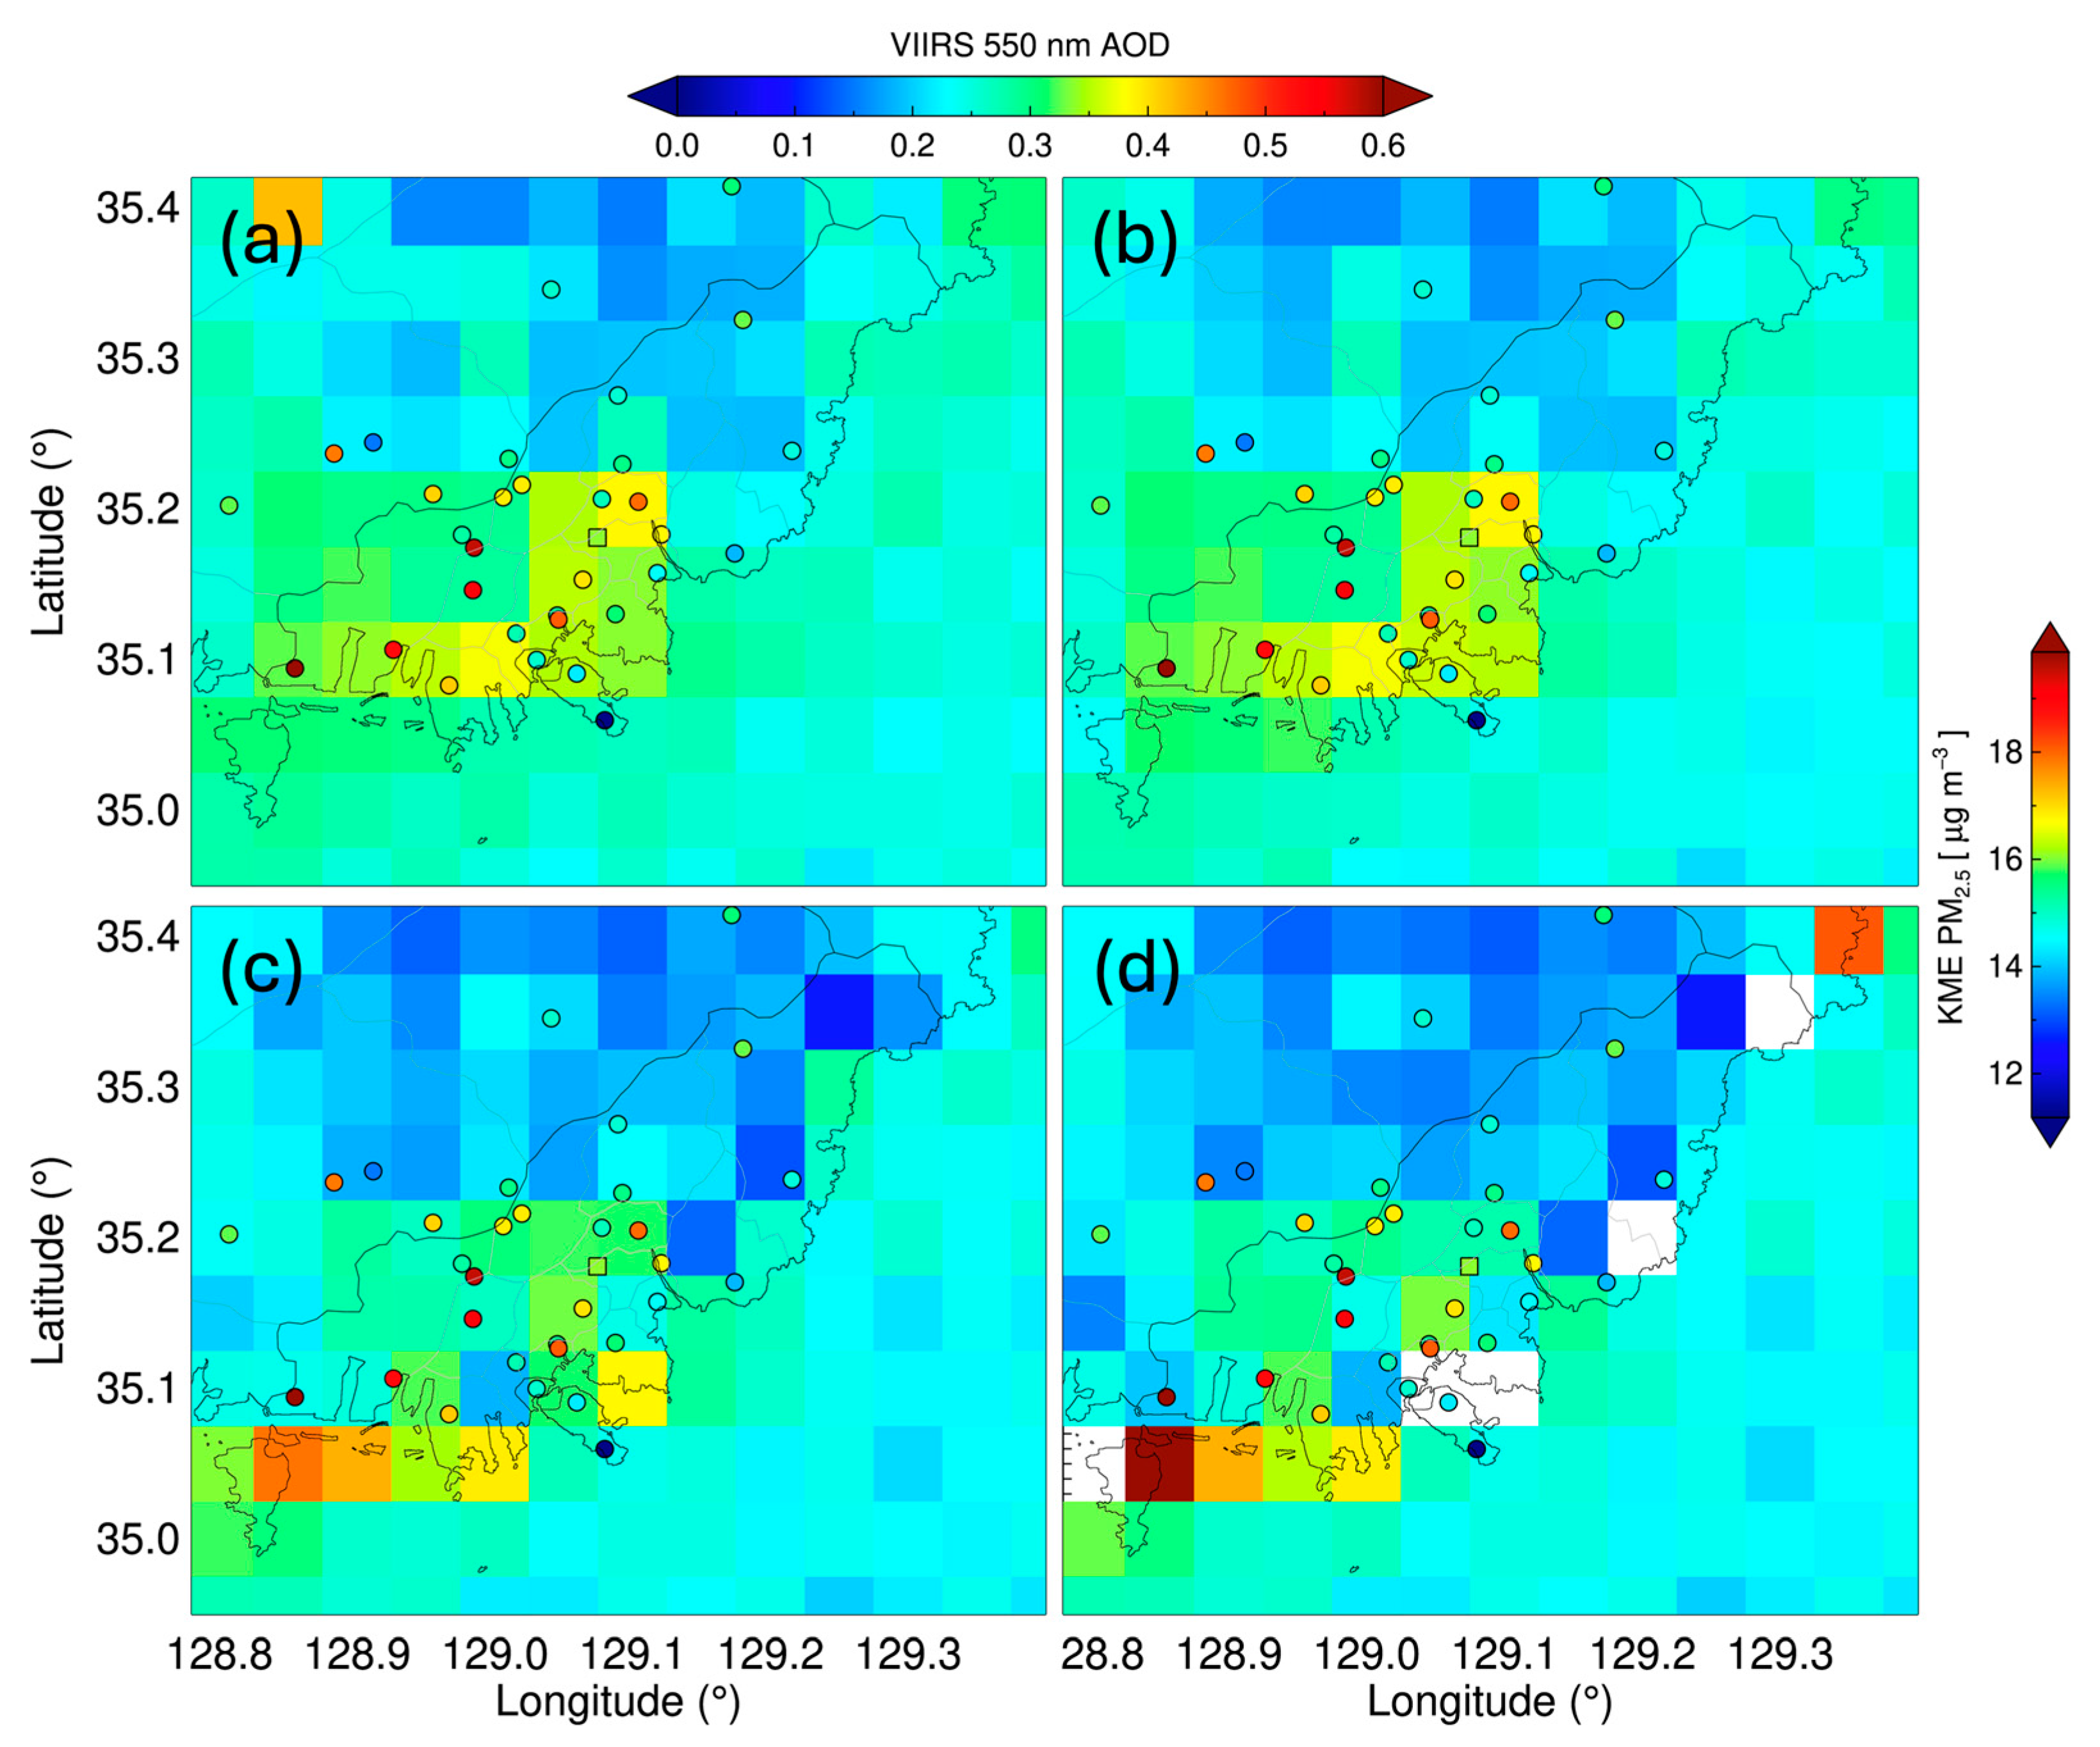
Figure 6 presents a comparison between the VIIRS AOD and KME PM2.5 samples gathered in Busan, Korea, during 2023. The KME samples were collected within ±30 min of the VIIRS overpass time, and the VIIRS data were spatially sampled within ±0.05° of each KME station, which is narrower than the spatial sampling used for the AERONET AOD comparison, as spatial variability of the PM is generally higher than that of AOD. Panel (a) includes AOD data with all quality flags and UPF values, whereas panel (b) only considers UPF values higher than 0.9. Panel (c) highlights samples with QA values of 2 and 3, while panel (d) focuses exclusively on samples with a QA value of 3. Figure 6a displays some outliers with elevated values (AOD exceeding about 2.0), which likely resulted from cloud contamination in the VIIRS data. These outliers, along with all quality flags and UPF values, had an adverse impact on the correlation between PM2.5 and AOD, even with the largest number of collocated samples (i.e., N = 4824). Removing the AOD for UPF values greater than 0.9 effectively eliminated outliers, improved correlation, and preserved a similar number of samples (N = 4697), as illustrated in Figure 6b. By adopting QA values of 2 and 3, we eliminated the outliers shown in Figure 6a,b, though this resulted in a noticeable decline in retrievals.
Figure 7 compares the spatial distribution of annual mean VIIRS AOD with various criteria used in Figure 6 and surface PM2.5 concentrations from the KME network for 2023. Overall, the annual mean AOD values across different quality controls exhibited reasonable consistency, except in coastal areas, primarily due to the more active hygroscopic growth of particles and the complicated mixing layer variabilities. The aim of employing higher QA values is to achieve more reliable AOD values. Nevertheless, the increased variation in sample sizes results in increased spatial variability in the annual mean AOD values compared to those obtained using broader quality standards (see the lower panels versus the upper panels of Figure 7).
As discussed regarding Figure 4 and Figure 6, the reduction in the AOD sample size is particularly noticeable in the coastal region, where we are focusing on collecting aerosol data. As a result, even with some high-bias outliers in AOD evident in Figure 4, employing all QA values combined with limited UPF values (i.e., UPF under 0.9) provides a significant number of samples, particularly over the coastal regions. Furthermore, expanding the sample size over an extended period (such as a year) allows us to reduce the impact of these AOD outliers (see Figure 7). Given that aerosols have a longer lifetime than trace gases (e.g., nitrogen dioxide and sulfur dioxide) [30], their spatial distribution over a year is expected to fluctuate less within the domain of this study, as illustrated in Figure 7b.

3.3. Relationship Between the AOD and Surface PM Concentrations

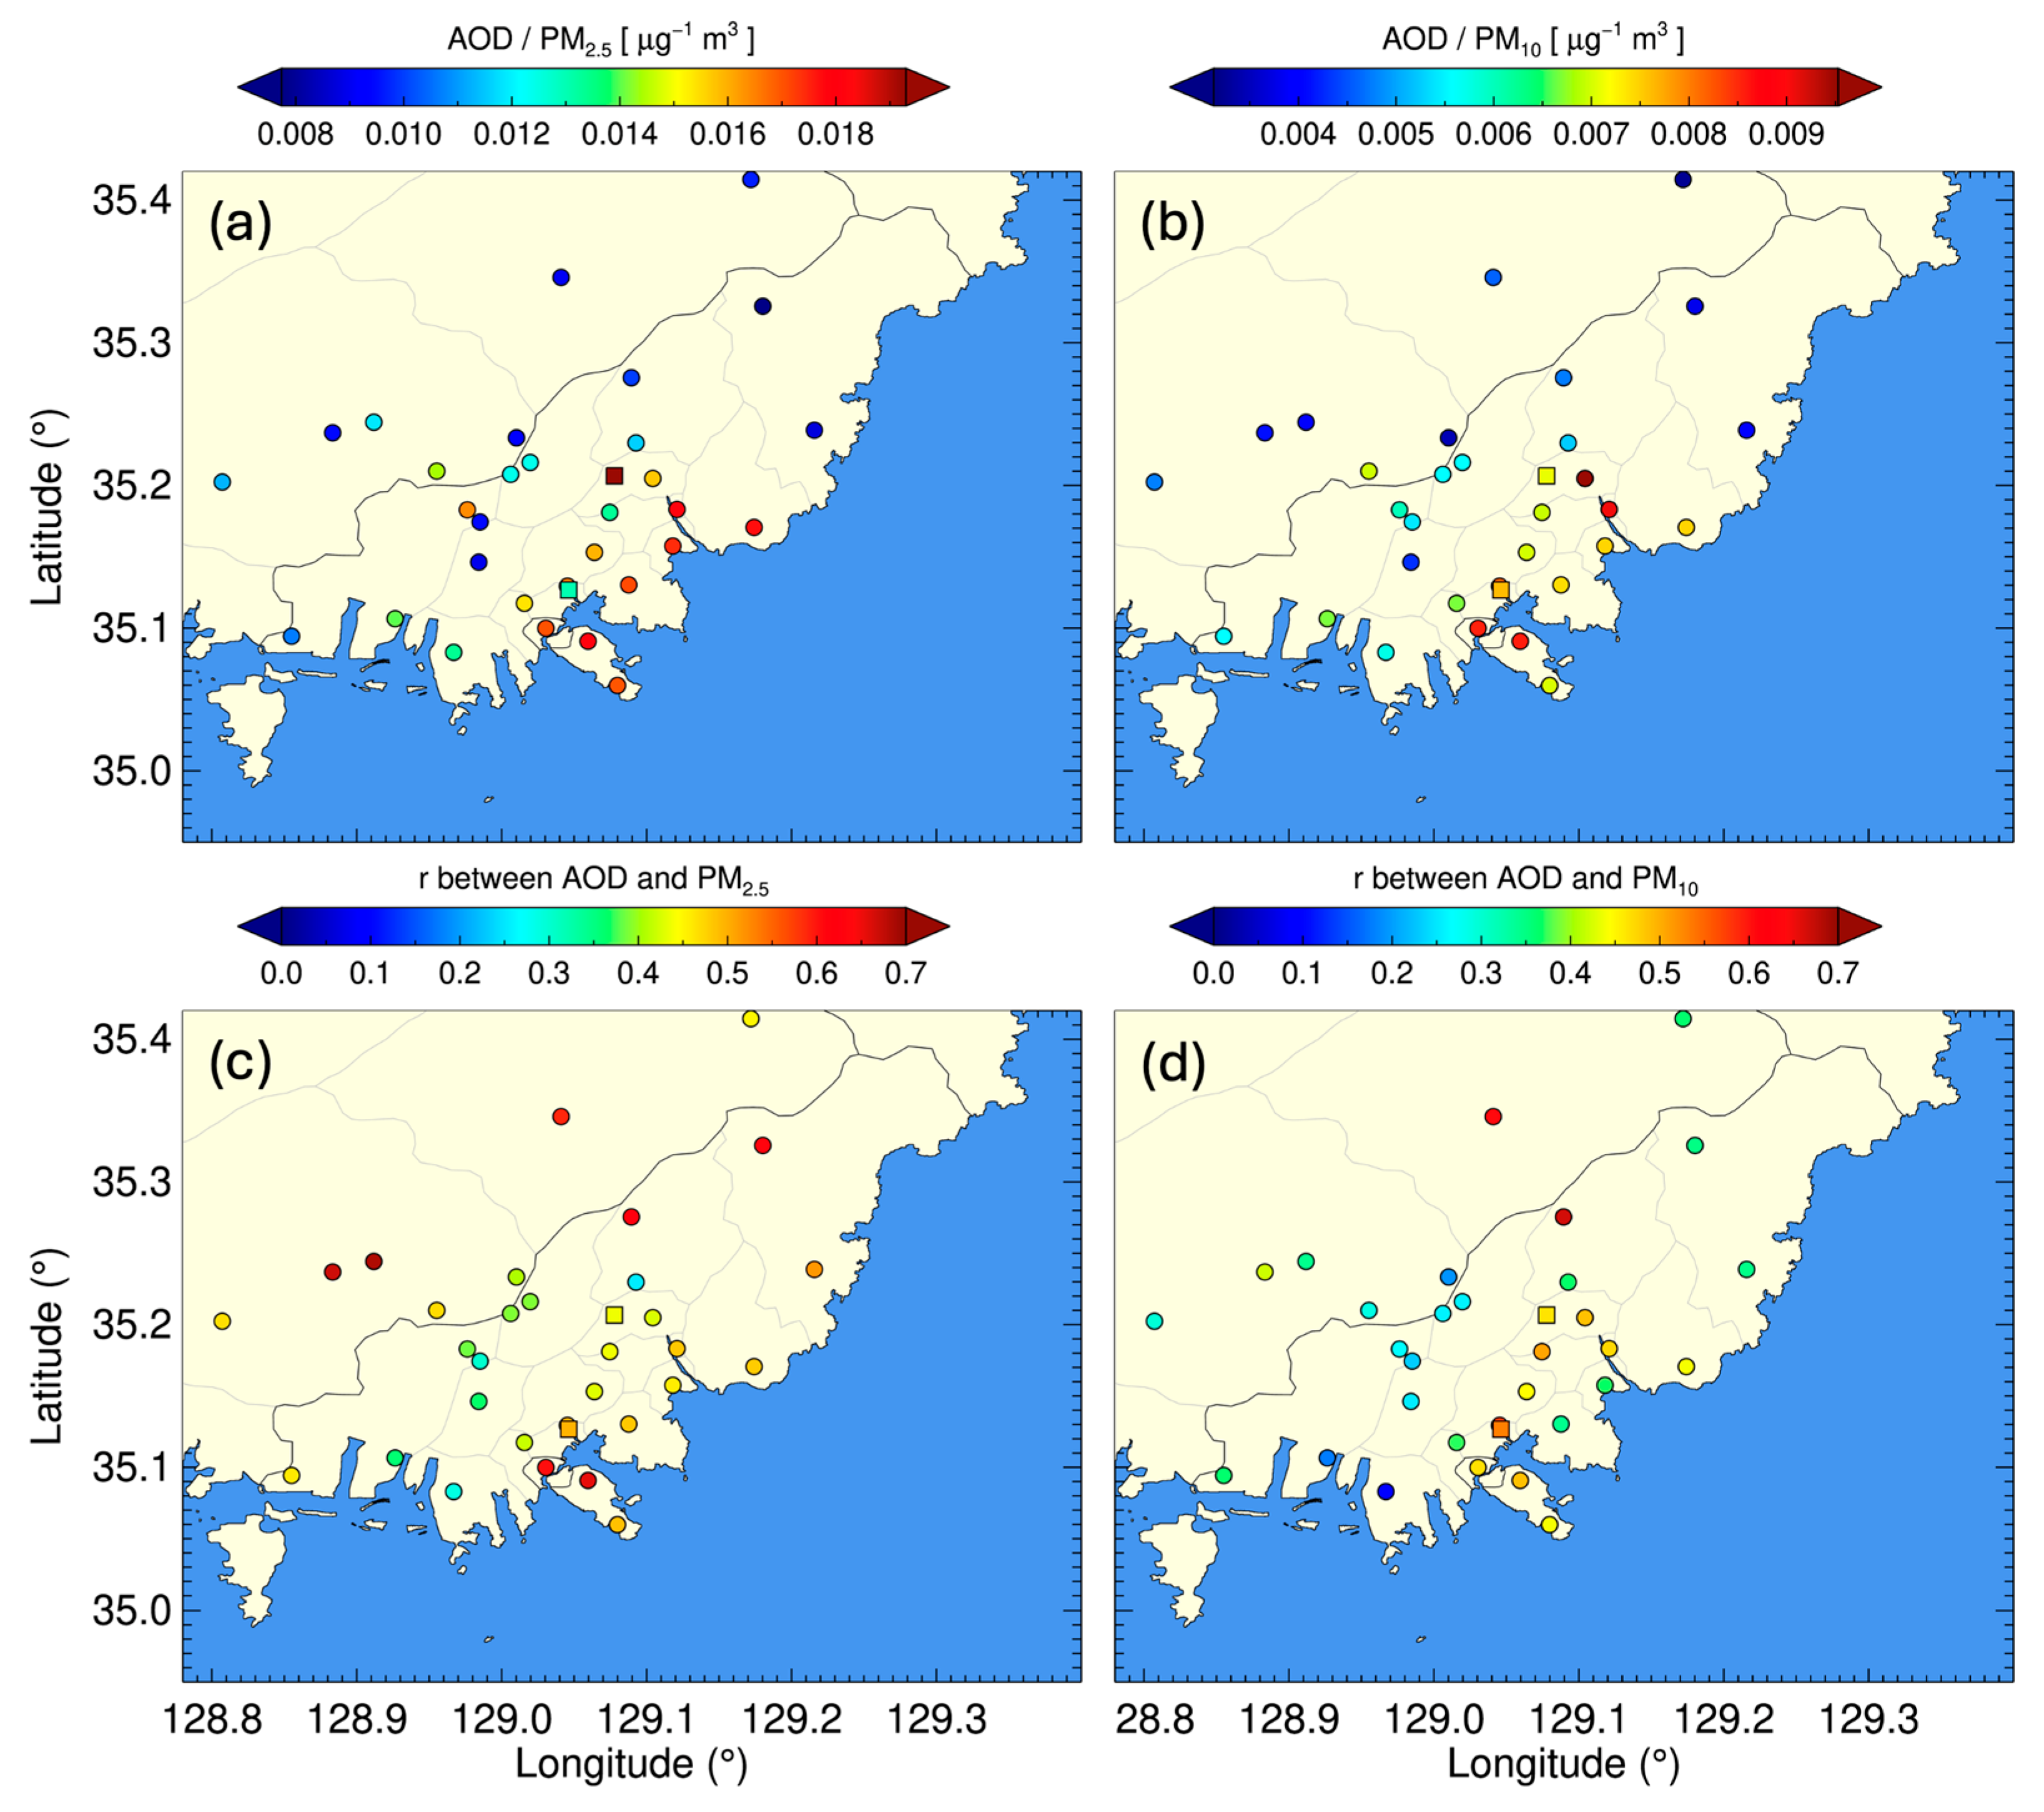
The upper panels of Figure 8 show the ratio of VIIRS AOD to surface PM concentrations (APx hereafter), with the subscript x indicating PM2.5 or PM10. It is crucial to note that PM concentrations are measured under dry conditions, whereas AOD reflects aerosol light extinction under ambient conditions. Higher APx values indicate more efficient scattering of light by particles. This mass scattering efficiency increases with smaller particle sizes per unit mass or in high-humidity environments due to hygroscopic growth [15,31]. As shown in Figure 8a,b, elevated AP2.5 and AP10 values are predominantly near the coast, likely because of intensified particle growth under humid conditions. A few outliers of this trend appeared at roadside monitoring stations with rectangles, which can be attributed to complex variabilities near the main emission sources.
Figure 8c,d present the correlation coefficients between AOD and PM concentrations in 2023. The data indicate that PM2.5 has a stronger correlation with VIIRS AOD compared to PM10. This is because light extinction at 550 nm is more sensitive to fine particles (diameters smaller than about 2.5 µm) [15]. A uniform correlation was observed between AOD and PM2.5 along the coast compared to the inland stations, suggesting that satellite-based AOD data in this region can be effectively used to monitor port air quality, particularly when additional data are utilized (e.g., humidity and boundary layer height).
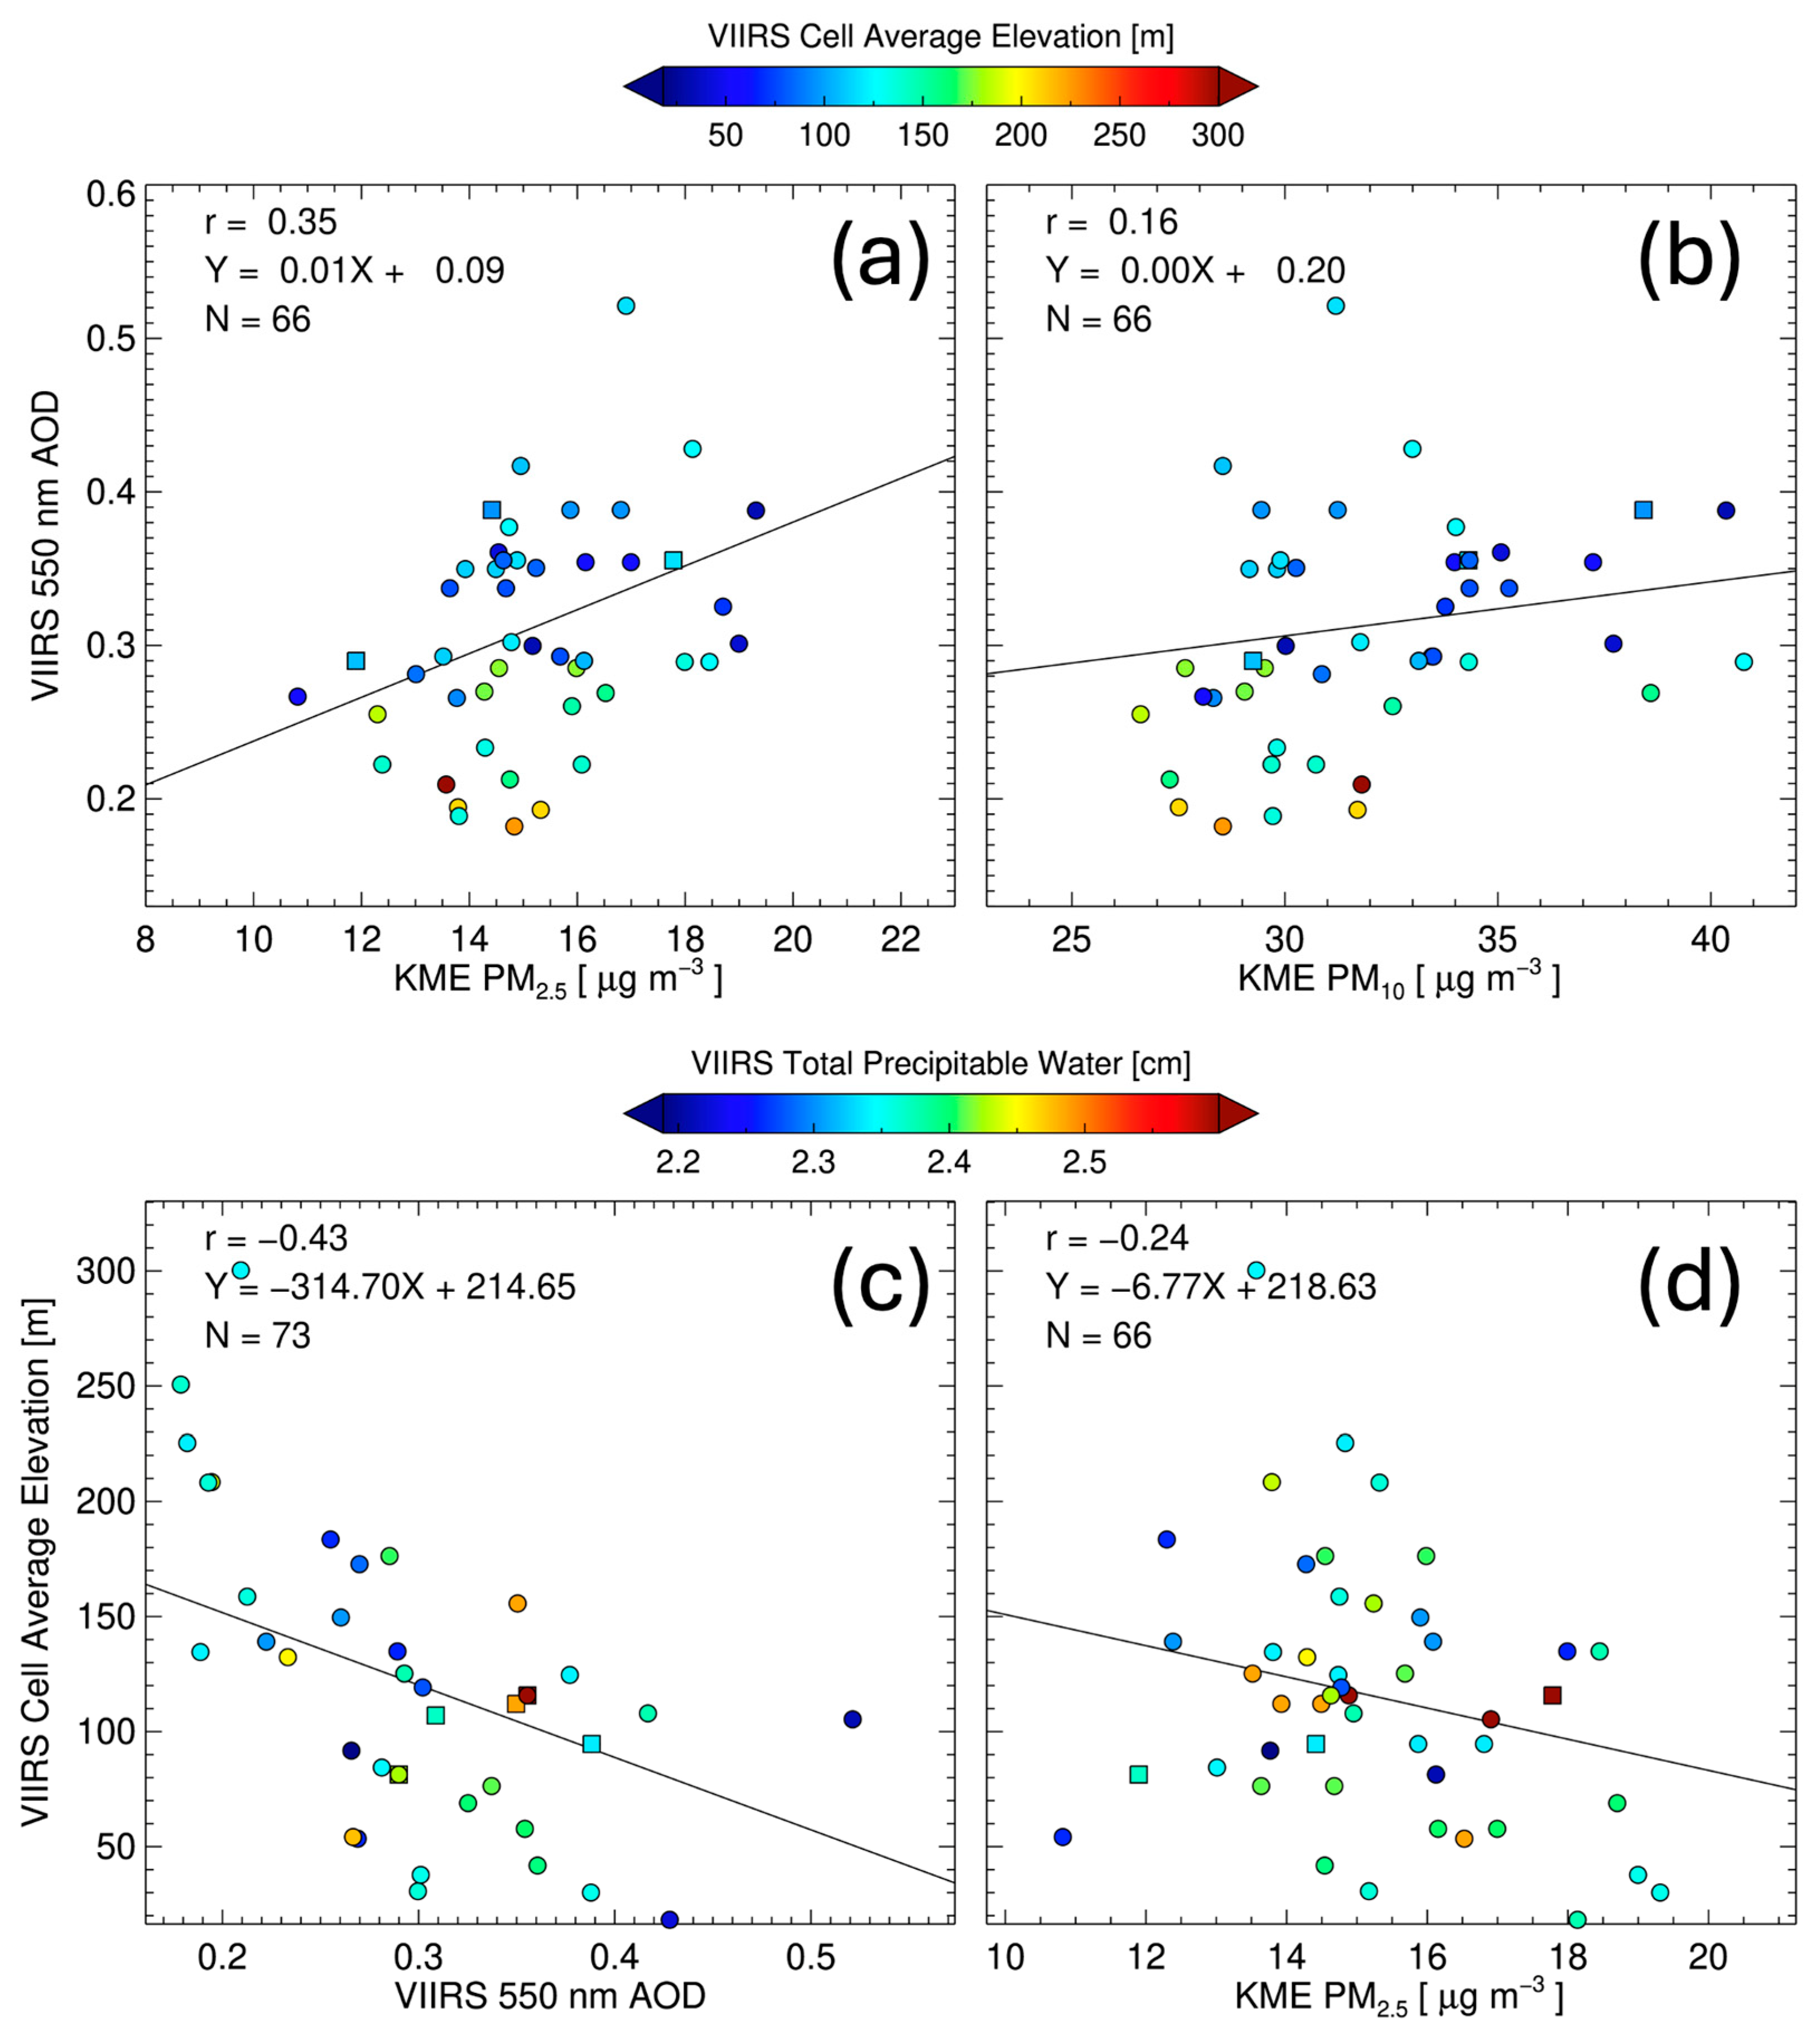
Figure 9 illustrates the relationship between the annual mean PM values and VIIRS AOD at each site depicted in Figure 8. Colors represent the cell average elevation from the VIIRS data. The average levels of PM2.5 and PM10 show positive correlations with VIIRS AOD (r-values of 0.35 and 0.16), though these are lower than the correlations observed with individual samples (see Figure 6). As noted in the discussion of Figure 8, PM2.5 has a stronger correlation with AOD compared to PM10, suggesting that satellite measurements are more effective for monitoring PM2.5.
The VIIRS AOD exhibited a negative correlation (r = −0.43) with the average elevation of the cells, as shown in Figure 9c. Additionally, PM2.5 and PM10 levels were also negatively correlated with terrain height, as demonstrated in Figure 9b,d (r = −0.24 and −0.40, respectively). This pattern is primarily caused by the spatial distribution of aerosol emission sources, which are predominantly situated in flat, low-altitude regions. Another reason for the negative correlation between AOD and terrain height is that lower-altitude areas tend to be more humid due to their proximity to the ocean, which encourages more active hygroscopic growth. We anticipate that integrating higher-resolution ancillary databases, such as digital elevation maps, population distribution, and meteorological data, with satellite-based AOD will enhance the resolution of air quality assessments in port cities.

4. Summary and Conclusions

This study evaluates the effectiveness of satellite-derived aerosol data (i.e., VIIRS Deep Blue AOD) in monitoring particulate matter levels over the large port city of Busan, South Korea. VIIRS AOD samples tend to be sparse near coastlines because of higher uncertainties caused by subpixel mixing of land and ocean surfaces. To enhance the VIIRS AOD measurements in this area, we utilized all quality levels of the product over Busan. We established optimized quality control criteria, resulting in more than three times the number of samples compared to the standards specified in operational guidelines. The VIIRS AOD samples demonstrated a positive correlation with surface PM2.5 measurements (r = 0.42) and exhibited a reasonable spatial distribution. The ratios of VIIRS AOD to surface PM2.5 and PM10 were higher in coastal regions, likely owing to increased hygroscopic growth of particles. This relationship can help estimate surface PM levels from satellite observations. Notably, both VIIRS AOD and surface PM concentrations show a negative correlation with terrain elevation, influenced by the location of emission sources and altitude-dependent meteorological conditions (e.g., temperature and humidity).

Author Contributions

Conceptualization, U.J., Y.J. and S.L.; methodology, U.J., S.K., Y.J. and S.S.P.; Software, U.J. and S.L.; Validation, S.K. and S.L.; Formal analysis, U.J. and S.L.; Writing—original draft preparation, U.J.; Writing—review and editing, S.K., S.L., Y.J. and S.S.P.; visualization, U.J. and S.L.; supervision, U.J.; project administration, U.J.; funding acquisition, U.J. All authors have read and agreed to the published version of the manuscript.

Funding

This work was supported by the Pukyong National University Research Fund in 2023 (202312290001). This research was also supported by Global—Learning & Academic research institution for Master’s·PhD students, and Postdocs (LAMP) Program of the National Research Foundation of Korea (NRF) grant funded by the Ministry of Education (No. RS-2023-00301702). Additionally, this research was conducted as part of the “Marine Data-based New Industry Development project”, funded by the Busan Metropolitan City and managed by Busan Technopark in 2024.

Institutional Review Board Statement

Not applicable.

Informed Consent Statement

Not applicable.

Data Availability Statement

The VIIRS Deep Blue AOD data are available at NASA LAADS DAAC (https://ladsweb.modaps.eosdis.nasa.gov/), and the AERONET data are available at their webpage (https://aeronet.gsfc.nasa.gov/). Surface PM data from the Korean Ministry of Environment are available at: https://www.airkorea.or.kr/eng/, last accessed on 21 September 2025.

Acknowledgments

We appreciate NASA and KME for providing satellite and in situ measurement data.

Conflicts of Interest

The authors declare no conflicts of interest.

Abbreviations

The following abbreviations are used in this manuscript:
AODAerosol Optical Depth
APxratio of VIIRS AOD to surface PM concentrations
C6.1Collection 6.1
CAEcell average elevation
DBDeep Blue
DTDark Target
KMEKorea Ministry of Environment
MBEmean-bias-error
MODISModerate Resolution Imaging Spectroradiometer
PMparticulate matter
QAquality assurance
RMSEroot-mean-squared-error
SeaWiFSSea-Viewing Wide Field-of-View Sensor
SIPSAtmospheres Science Investigator-Led Processing System
S-NPPSuomi National Polar-Orbiting Partnership
SOARSatellite Ocean Aerosol Retrieval
UPFunsuitable pixel fraction
VIIRSVisible Infrared Imaging Radiometer

References

  1. Ducruet, C.; Martin, B.P.; Sene, M.A.; Prete, M.L.; Sun, L.; Itoh, H.; Pigné, Y. Ports and their influence on local air pollution and public health: A global analysis. Sci. Tot. Environ. 2024, 915, 170099. [Google Scholar] [CrossRef] [PubMed]
  2. Mueller, D.; Uibel, S.; Takemura, M.; Klingelhoefer, D.; Groneberg, D.A. Ships, ports and particulate air pollution—An analysis of recent studies. J. Occup. Med. Toxicol. 2011, 6, 31. [Google Scholar] [CrossRef] [PubMed]
  3. Wan, Z.; Zhu, M.; Chen, S.; Sperling, D. Three steps to a green shipping industry. Nature 2016, 530, 275–277. [Google Scholar] [CrossRef]
  4. Loh, A.; Kim, D.; An, J.G.; Hyun, S.; Yim, U.H. Shipping-related air pollution at Busan Port: The unceasing threat of black carbon. J. Hazard. Mater. 2025, 488, 137434. [Google Scholar] [CrossRef]
  5. Jeong, U.; Hong, H. Assessment of tropospheric concentrations of NO2 from the TROPOMI/Sentinel-5 Precursor for the estimation of long-term exposure to surface NO2 over South Korea. Remote Sens. 2021, 13, 1877. [Google Scholar] [CrossRef]
  6. Hoek, G.; Beelen, R.; de Hoogh, K.; Vienneau, D.; Gulliver, J.; Fischer, P.; Briggs, D. A review of land-use regression models to assess spatial variation of outdoor air pollution. Atmos. Environ. 2008, 42, 7561–7578. [Google Scholar] [CrossRef]
  7. van Donkelaar, A.; Martin, R.V.; Brauer, M.; Kahn, R.; Levy, R.; Verduzco, C.; Villeneuve, P.J. Global estimates of ambient fine particulate matter concentrations from satellite-based aerosol optical depth: Development and application. Environ. Health Perspect. 2010, 118, 847–855. [Google Scholar] [CrossRef]
  8. Sayer, A.M.; Hsu, N.C.; Lee, J.; Bettenhausen, C.; Kim, W.V.; Smirnov, A. Satellite ocean aerosol retrieval (SOAR) algorithm extension to S-NPP VIIRS as part of the “Deep Blue” aerosol project. J. Geophys. Res. Atmos. 2018, 123, 380–400. [Google Scholar] [CrossRef]
  9. Hsu, N.C.; Lee, J.; Sayer, A.M.; Kim, W.; Bettenhausen, C.; Tsay, S.-C. VIIRS Deep Blue aerosol products over land: Extending the EOS long-term aerosol data records. J. Geophys. Res. Atmos. 2019, 124, 4026–4053. [Google Scholar] [CrossRef]
  10. Levy, R.C.; Mattoo, S.; Munchak, L.A.; Remer, L.A.; Sayer, A.M.; Patadia, F.; Hsu, N.C. The collection 6 MODIS aerosol products over land and ocean. Atmos. Meas. Tech. 2013, 6, 2989–3034. [Google Scholar] [CrossRef]
  11. Ahmad, Z.; Franz, B.A.; McClain, C.R.; Kwiatkowska, E.J.; Werdell, J.; Shettle, E.P.; Holben, B.N. New aerosol models for the retrieval of aerosol optical thickness and normalized water-leaving radiances from the SeaWiFS and MODIS sensors over coastal regions and open oceans. Appl. Opt. 2010, 49, 5545–5560. [Google Scholar] [CrossRef]
  12. Giles, D.M.; Sinyuk, A.; Sorokin, M.G.; Schafer, J.S.; Smirnov, A.; Slutsker, I.; Eck, T.F.; Holben, B.N.; Lewis, J.R.; Campbell, J.R.; et al. Advancements in the Aerosol Robotic Network (AERONET) Version 3 database—Automated near-real-time quality control algorithm with improved cloud screening for Sun photometer aerosol optical depth (AOD) measurements. Atmos. Meas. Tech. 2019, 12, 169–209. [Google Scholar] [CrossRef]
  13. Wang, J.; Christopher, S.A. Intercomparison between satellite-derived aerosol optical thickness and PM2.5 mass: Implications for air quality studies. Geophys. Res. Lett. 2003, 30, 2095. [Google Scholar] [CrossRef]
  14. Guo, J.-P.; Zhang, X.-Y.; Che, H.-Z.; Gong, S.-L.; An, X.; Cao, C.-X.; Guang, J.; Zhang, H.; Wang, Y.-Q.; Zhang, X.-C.; et al. Correlation between PM concentrations and aerosol optical depth in eastern China. Atmos. Environ. 2009, 43, 5876–5886. [Google Scholar] [CrossRef]
  15. Seo, S.; Kim, J.; Lee, H.; Jeong, U.; Kim, W.; Holben, B.N.; Kim, S.-W.; Song, C.H.; Lim, J.H. Estimation of PM10 concentrations over Seoul using multiple empirical models with AERONET and MODIS data collected during the DRAGON-Asia campaign. Atmos. Chem. Phys. 2015, 15, 319–334. [Google Scholar] [CrossRef]
  16. Kumar, N.; Chu, A.; Foster, A. An empirical relationship between PM2.5 and aerosol optical depth in Delhi Metropolitan. Atmos. Environ. 2007, 41, 4492–4503. [Google Scholar] [CrossRef]
  17. Yang, Q.; Yuan, Q.; Yue, L.; Li, T.; Shen, H.; Zhang, L. The relationships between PM2.5 and aerosol optical depth (AOD) in mainland China: About and behind the spatio-temporal variations. Environ. Pollut. 2019, 248, 526–535. [Google Scholar] [CrossRef]
  18. Zhai, S.; Jacob, D.J.; Brewer, J.F.; Li, K.; Moch, J.M.; Kim, J.; Lee, S.; Lim, H.; Lee, H.C.; Kuk, S.K.; et al. Relating geostationary satellite measurements of aerosol optical depth (AOD) over East Asia to fine particulate matter (PM2.5): Insights from the KORUS-AQ aircraft campaign and GEOS-Chem model simulations. Atmos. Chem. Phys. 2021, 21, 16775–16791. [Google Scholar] [CrossRef]
  19. Tian, Z.; Wei, J.; Li, Z. How important is satellite-retrieved aerosol optical depth in deriving surface PM2.5 using machine learning? Remote Sens. 2023, 15, 3780. [Google Scholar] [CrossRef]
  20. Stamnes, S.; Baize, R.; Bontempi, P.; Cairns, B.; Chemyakin, E.; Choi, Y.-J.; Chowdhary, J.; Hu, Y.; Jeong, M.; Kang, K.-I.; et al. Simultaneous aerosol and ocean properties from the PolCube CubeSat polarimeter. Front. Remote Sens. 2021, 2, 709040. [Google Scholar] [CrossRef]
  21. Sayer, A.M.; Hsu, N.C.; Bettenhausen, C.; Holz, R.E.; Lee, J.; Quinn, G.; Veglio, P. Cross-calibration of S-NPP VIIRS moderate-resolution reflective solar bands against MODIS Aqua over dark water scenes. Atmos. Meas. Tech. 2017, 10, 1425–1444. [Google Scholar] [CrossRef]
  22. Hsu, N.C.; Jeong, M.-J.; Bettenhausen, C.; Sayer, A.M.; Hansell, R.; Seftor, C.S.; Huang, J.; Tsay, S.-C. Enhanced Deep Blue aerosol retrieval algorithm: The second generation. J. Geophys. Res. Atmos. 2013, 118, 9296–9315. [Google Scholar] [CrossRef]
  23. Sayer, A.M.; Hsu, N.C.; Bettenhausen, C.; Jeong, M.-J. Validation and uncertainty estimates for MODIS Collection 6 “Deep Blue” aerosol data. J. Geophys. Res. Atmos. 2013, 118, 7864–7872. [Google Scholar] [CrossRef]
  24. NIER (National Institute of Environmental Research). 2023: Annual Report of Air Quality in Kore; Ministry of the Environment: Incheon, Republic of Korea, 2023. [Google Scholar]
  25. Wedding, J.B.; Weigand, M.A. An automatic Particle sampler with beta-gauging. J. Air Waste Manag. 1993, 43, 475–479. [Google Scholar] [CrossRef]
  26. Air Korea. Available online: https://www.airkorea.or.kr/eng/ (accessed on 25 May 2025).
  27. Cabello-Torres, R.J.; Carbo-Bustinza, N.; Romero-Cabello, E.A.; Ureta Tolentino, J.M.; Torres Armas, E.A.; Turpo-Chaparro, J.E.; Canas Rodrigues, P.; López-Gonzales, J.L. An exploratory analysis of PM2.5/PM10 ratio during spring 2016–2018 in Metropolitan Lima. Sci Rep. 2024, 14, 9285. [Google Scholar] [CrossRef]
  28. Jeong, U.; Kim, J.; Lee, H.; Jung, J.; Kim, Y.J.; Song, C.H.; Koo, J.H. Estimation of the contributions of long range transported aerosol in East Asia to carbonaceous aerosol and PM concentrations in Seoul, Korea using highly time resolved measurements: A PSCF model approach. J. Environ. Monit. 2011, 13, 1905–1918. [Google Scholar] [CrossRef] [PubMed]
  29. Hwang, K.; Kim, J.; Lee, J.Y.; Park, J.-S.; Park, S.; Lee, G.; Kim, C.H.; Kim, P.; Shin, S.H.; Lee, K.Y.; et al. Physicochemical characteristics and seasonal variations of PM2.5 in urban, industrial, and suburban areas in South Korea. Asian J. Atmos. Environ. 2023, 17, 19. [Google Scholar] [CrossRef]
  30. Williams, J.; de Reus, M.; Krejci, R.; Fischer, H.; Strom, J. Application of the variability-size relationship to atmospheric aerosol studies: Estimating aerosol lifetimes and ages. Atmos. Chem. Phys. 2002, 2, 133–145. [Google Scholar] [CrossRef]
  31. Xue, B.; Kuang, Y.; Xu, W.; Zhao, R. Joint increase of aerosol scattering efficiency and aerosol hygroscopicity aggravate visibility impairment in the North China Plain. Sci. Total Environ. 2022, 839, 156279. [Google Scholar] [CrossRef]
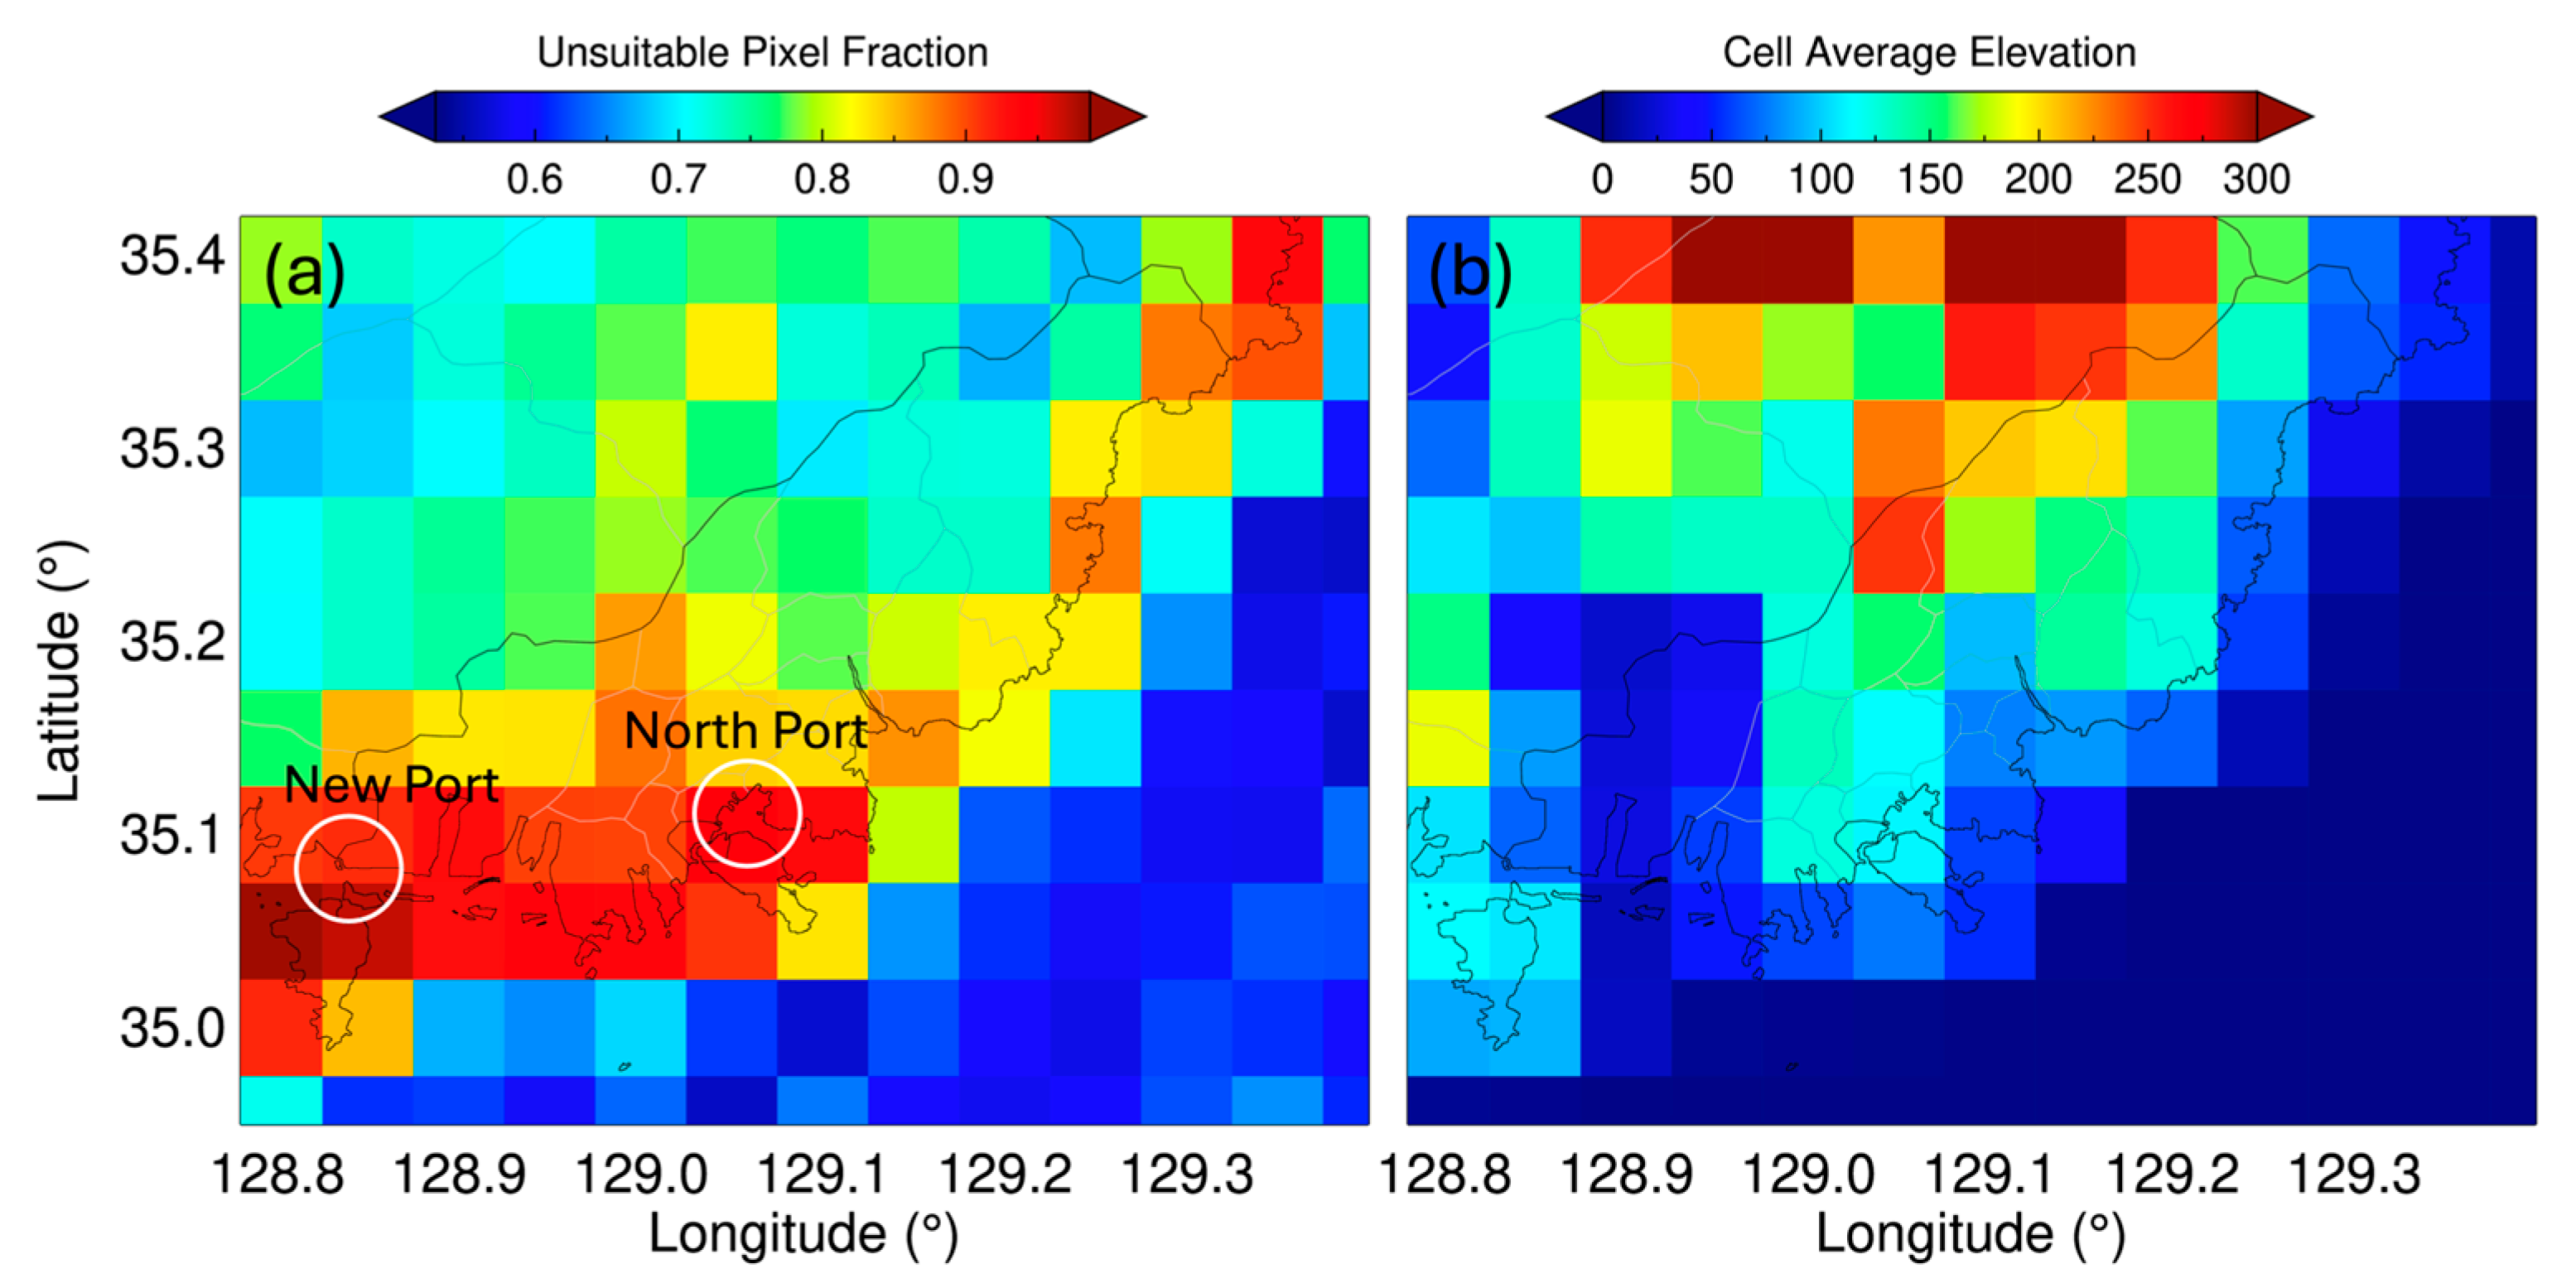
Figure 1. Annual mean values of (a) unsuitable pixel fraction and (b) cell average elevation (m) of the VIIRS/Deep Blue aerosol products over Busan, Republic of Korea, in 2023. The values are in 0.05° × 0.05° grids, similar to the spatial resolution of the original retrievals. The white circles in panel (a) indicate the major ports of Busan.
Atmosphere 16 01123 g001
Figure 2. Annual mean values of (a) PM2.5 and (b) PM10 recorded by the Korean Ministry of Environment (KME) monitoring stations for Busan, Korea, in 2023. Panel (c) illustrates the correlation coefficients between PM2.5 and PM10 at each site, and panel (d) presents the PM2.5 to PM10 ratio for the stations. The red open circles in panel (a) mark the major ports of Busan. The colors in the circles represent data from ambient monitoring stations, and the squares reflect data from roadside monitoring stations.
Atmosphere 16 01123 g002
Figure 3. Daily and monthly variations in (a) PM2.5, (b) PM10, and (c) aerosol optical depth (AOD) around Busan in 2023. The circles in faint colors in this figure show all samples. The PM2.5 and PM10 data are measured by the KME ground stations, and the AOD data are from AERONET (green) and VIIRS (red) products.
Atmosphere 16 01123 g003
Figure 4. Number of VIIRS Deep Blue AOD retrievals with different QA values that fall within a 0.05° grid resolution in 2023 around Busan, Korea. Panel (a) displays the number of samples with all QA values (1–3), while Panel (b) presents all QA values, excluding those with unsuitable pixel fractions higher than 0.9. Panel (c) displays those with QA values of 2 and 3, while panel (d) is reserved for samples with QA values of 3.
Atmosphere 16 01123 g004
Figure 5. Comparison of 550 nm aerosol optical depth (AOD) from AERONET (x-axis) and the VIIRS Deep Blue product (y-axis). In Panel (a), VIIRS data includes all QA values with UPF values lower than 0.9. Panel (b) focuses on samples with QA values of 2 and 3, while panel (c) features those with a QA value of 3. The AERONET data used are Version 3.0, Level 2.0, collected at Ulsan, South Korea (35.582° N latitude, 129.190° E longitude, and 106 m above sea level).
Atmosphere 16 01123 g005
Figure 6. Comparison of 550 nm aerosol optical depth (AOD) from VIIRS Deep Blue product and surface PM2.5 concentration from KME network in 2023 around Busan, Korea. Panel (a) used AOD with all quality flags and UPF values, whereas panel (b) restricted the UPF values to lower than 0.9. Panel (c) focuses on samples with QA values of 2 and 3, while panel (d) features those with a QA value of 3.
Atmosphere 16 01123 g006
Figure 7. Annual mean values of aerosol optical depth (AOD) at 550 nm from the VIIRS Deep Blue product alongside surface PM2.5 concentrations from the KME network for 2023 in Busan, Korea. In panel (a), AOD is displayed using all quality flags and UPF values, while panel (b) incorporates only UPF values of 0.9 and higher. Panel (c) highlights samples with QA values of 2 and 3, whereas panel (d) shows those with a QA value of 3. The colors in the circles represent data from ambient monitoring stations, and the squares reflect data from roadside monitoring stations.
Atmosphere 16 01123 g007
Figure 8. Panels (a,b) present the ratio of aerosol optical depth (AOD) at 550 nm, derived from the VIIRS Deep Blue product, to surface PM2.5 and PM10 concentrations from the KME network in Busan, Korea, for 2023. The lower panels display the correlation coefficients between AOD and PM concentrations—panel (c) for PM2.5 and panel (d) for PM10. The colors in the circles represent data from ambient monitoring stations, and the squares reflect data from roadside monitoring stations.
Atmosphere 16 01123 g008
Figure 9. Comparison of annual average VIIRS 550 nm AOD values with surface (a) PM2.5 and (b) PM10 concentrations from the KME network in Busan, Korea, for 2023. Colors in the circles and squares in the upper panels depict the cell average elevation provided by the VIIRS product. Circles and squares represent ambient and roadside monitoring stations, respectively. Panels (c,d) compare the cell average elevation to the AOD and PM2.5, respectively.
Atmosphere 16 01123 g009
Table 1. Summary of the comparison of 550 nm AOD between AERONET and VIIRS across various data quality levels, from QA levels 1 to 3, with UPF values ranging from 0 to 1. VIIRS AOD data are Deep Blue land products, and the AERONET data are Version 3.0, Level 2.0 data at Ulsan, Korea. UPF stands for unsuitable pixel fraction of the VIIRS AOD, RMSE is root-mean-squared-error, MBE is mean-bias-error, and N is the number of collocated samples.
QA ValuesUPF Criteria 1Correlation
Coefficient
RMSE 2MBE 3N 4
QA ≥ 10.00.960.036−0.0164
0.10.930.052−0.0197
0.20.930.052−0.01113
0.30.920.054−0.01135
0.40.920.053−0.01149
0.50.920.054−0.01156
0.60.900.0620.00162
0.70.900.0620.00172
0.80.890.0690.00182
0.90.890.0680.00187
1.00.890.0680.00187
QA ≥ 21.00.940.045−0.02140
QA = 31.00.940.048−0.01139
1 Criteria of the unsuitable pixel fraction for AOD sampling; 2 Root mean squared error; 3 Mean bias error; 4 Number of collocated samples for validation.
Disclaimer/Publisher’s Note: The statements, opinions and data contained in all publications are solely those of the individual author(s) and contributor(s) and not of MDPI and/or the editor(s). MDPI and/or the editor(s) disclaim responsibility for any injury to people or property resulting from any ideas, methods, instructions or products referred to in the content.