1. Introduction
Coffee is one of the most consumed beverages in the world with a global consumption of over 171 million 60 kg bags in 2023, according to the International Coffee Organization [
1]. Before it is enjoyed, coffee beans are roasted to enhance the aroma and flavor. However, the roasting process is also associated with the formation and release of undesired compounds, some of which are toxic, including acrylamide [
2], 5-hydroxymethylfurfural [
3], furan and its derivatives [
4], and polycyclic aromatic hydrocarbons (PAHs) [
5].
Coffee roasting is carried out at a temperature range of 180–250 °C, depending on the desired roast level, from light to extra dark roast. Some toxic organic compounds, including PAHs and polychlorinated dibenzo-
p-dioxins/dibenzofurans (PCDD/Fs), can form at this temperature range in the presence of oxygen and chlorine molecules [
6,
7]. In particular, PCDD/Fs are unintentionally produced compounds during heat treatment of carbon-containing substances [
7]. Regulatory bodies have established strict exposure limits to protect human health. The U.S. Environmental Protection Agency (EPA) has set a reference dose (RfD) of 0.7 pg per kilogram of body weight per day (0.7 pg
−1 kg
−1 day) for 2,3,7,8-TCDD, the most toxic dioxin, based on noncancer effects [
8]. The World Health Organization (WHO) advises a tolerable daily intake (TDI) of 1 to 4 pg
−1 kg
−1 day, emphasizing the harmful effects of long-term, low-level exposure [
9]. PCDD/Fs form via two main mechanisms: (a) de novo synthesis, which is a heterogeneous reaction whereby PCDD/Fs are formed from a series of oxidation and chlorination reactions of the amorphous carbon matrix, e.g., soot, and (b) the precursor pathway, which can either be a homogeneous or heterogeneous reaction, whereby PCDD/Fs are formed from precursor compounds such as phenols and polychlorinated biphenyls [
6]. Both de novo synthesis and the heterogeneous precursor pathway occur during low-temperature conditions, with the highest formation rate observed at around 200–400 °C, while the homogeneous precursor pathway occurs at high temperatures > 600 °C [
6].
PCDD/Fs, especially those with chlorines in the 2, 3, 7, and 8 positions, are one of the most toxic compounds known and have been reported to be endocrine disruptors, which are carcinogenic and immunotoxic [
10]. Research on PCDD/F formation and emission during coffee roasting holds particular significance for small-scale coffee roasting operations (≤3 kg per batch), where emissions can escape into the surrounding environment due to the inadequate height of stack chimneys. Independent coffee shops are quite prevalent, exemplified by China’s 91,000 establishments in 2016, a number dwarfing Starbucks’s count of 5000 stores in 2021 [
11]. Moreover, over 70% of customers of independent coffee shops choose to enjoy their coffee within the store premises [
12]. This highlights the importance of investigating the emissions of PCDD/Fs during coffee roasting. Notably, no research has yet been conducted on monitoring PCDD/F formation and emissions during coffee roasting. Additionally, new coffee formulations, including alcohol-, honey-, or maple-infused coffees, e.g., Don Pablo Canadian whisky and maple-infused coffee, are entering the market. Adding these additives might influence the formation and emission of these toxic compounds. For instance, honey contains several aromatic compounds, e.g., benzenes and phenolic compounds [
13], which could be precursors to PCDD/F formation [
6].
Therefore, the objectives of this pioneering study involve investigating the generation and emissions of PCDD/Fs in the flue gas and coffee beans during coffee roasting, examining the difference between fast and slow roasting methods, and the effect of different additives on PCDD/F generation and emissions. The results will provide a starting point for understanding the PCDD/F emissions during coffee roasting, assessing the potential health risks, and exploring mitigation strategies.
2. Materials and Methods
The green Arabica coffee beans were of single origin (Golden Malabar Indonesia). The wines (Brown Brothers Cienna red wine, Louis Jadot Beaujolais Villages red wine, and De Bortoli Deen Vat 5 Botrytis Semillon botrytized white wine), bourbon whiskeys (Jim Beam Kentucky Straight Bourbon and Basil Haden’s Bourbon), granulated sugar (Taiwan Sugar Corporation’s refined golden sugar), and honey (Taiwan Longan honey) were purchased in retail shops in Taiwan. The isotopically labeled PCDD/F, surrogate, recovery, alternate, matrix addition, and quantity calibration standard solutions were purchased from Wellington. Acetone and methanol were purchased from B&J, dichloromethane (DCM), hexane, and nonane from Merck/SK chemicals, ethyl acetate from DUKSAN, sulfuric acid from HONEYWELL, toluene from J.T. Baker/Merck, anhydrous sodium sulfate from HY BIOCARE CHEM, activated carbon and alumina from Merck, silver nitrate from UniRegion Bio-Tech, sodium hydroxide from Sigma-Aldrich, XAD-2® adsorbent from Supelco, and window defining solution from Wellington. Nitrogen and helium gases were purchased locally. All the reagents used in this study were of the highest purity analytical grade.
2.1. Preparation of Coffee Formulations
The moisture of the green coffee beans was reduced to ~12% by drying at 135 °C (
Table S1). The dried and cooled green beans were placed in a glass container, and the other ingredients (alcohol, sugar, and/or honey) were added according to the formulas shown in
Table 1. The glass container was then sealed and placed horizontally on an automated rotating mixer that rotated the container at a rate of 140 rpm for 36 h. Afterward, the coffee was dried at 40 °C and stored in a cool and dry place until roasting.
2.2. Coffee Roasting Procedure
A Rubasse
® automatic coffee roaster (MICRO PRO) with a 6000 W near-infrared heating source and a batch capacity of ≥200 g and ≤3 kg was used for roasting. For the experiment, 300 g samples were weighed, and the moisture was measured before roasting using a Kett
® PM-450 portable grain moisture meter. The roaster was first preheated before the roasting took place, and the exhaust was connected to an Apex
® isokinetic sampling train similar to the one recommended by the US EPA Modified Method 5 for PCDD/F sampling. The gaseous-phase PCDD/Fs in the exhaust gas were trapped in a column packed with 25 g of XAD-2. Before sampling, the XAD-2 was spiked with 10 µL of a pre-extraction standard solution containing isotopically labeled PCDD/F congeners. The sampling procedures followed the Taiwan EPA method NIEA A807.75C (based on the US EPA method 23), and the parameters, including the exhaust flow rate and sampling volume, are presented in
Tables S2 and S3.
Each batch of coffee, weighing 300 g, had its moisture content measured using a Kett
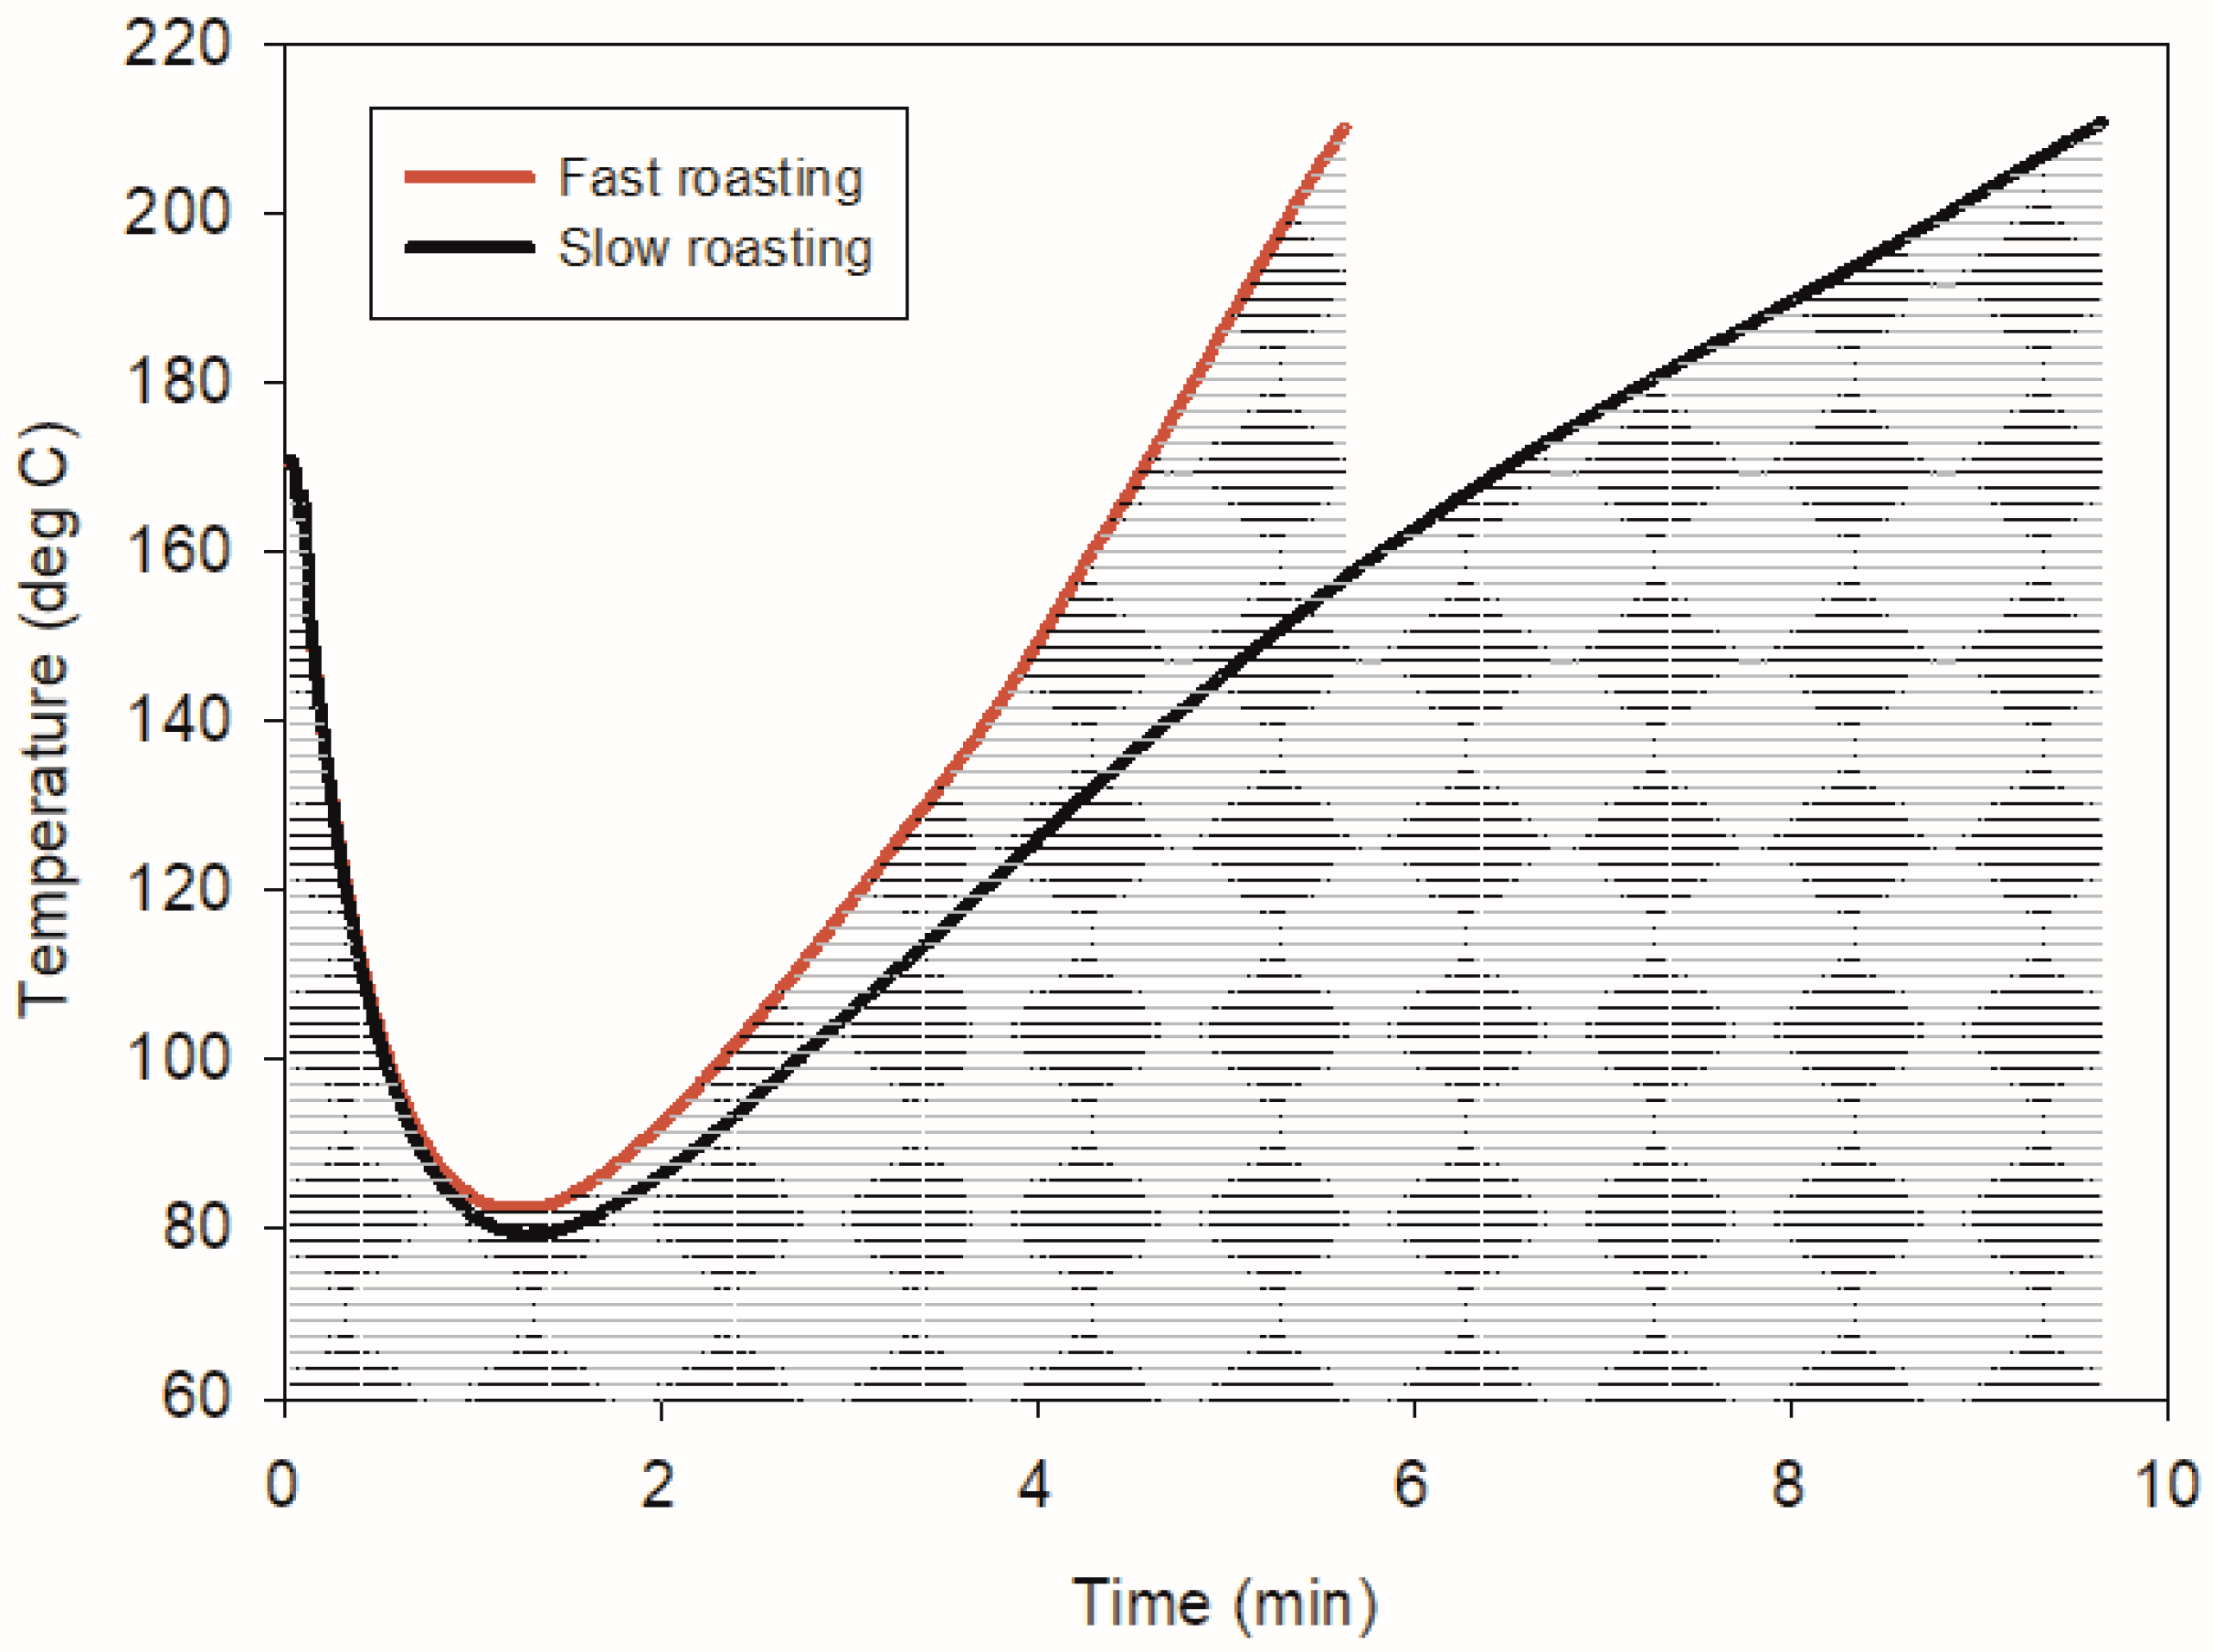
® PM-450 portable grain moisture meter before roasting. Two roasting conditions were applied, exposing the beans to temperatures between 170 °C and 210 °C for 5.62 min and 9.65 min, respectively, to achieve a light roast. These were designated as fast and slow roasting methods based on the time required to reach the desired roast level. The degree of roasting was measured using the Lighttells
® CM 100 portable coffee roast analyzer and determined using the Agtron color scale, with a light roast defined by an Agtron number of >70. The roasting machine was programmed in advance with specific temperature–time profiles, ensuring consistent replication of the roasting process, as illustrated in
Figure 1. Adjustments to heat power, exhaust, and drum rotation speed were made to follow the selected profile. After preheating, the coffee beans were automatically transferred from the loading hopper into the drum roaster, where roasting proceeded according to the programmed profile. Both light roasting methods had turning points at 1.4 min. Upon completion, the roasted beans were automatically discharged into the cooling tray, where they were stirred and released after cooling. The XAD-2 cartridge was removed, wrapped in aluminum foil, and stored before extraction and analysis. The extraction was completed within 30 days after sampling.
2.3. PCDD/F Extraction and Analysis
The extraction and analysis procedure for PCDD/Fs in the flue gas followed the US EPA method 23. Briefly, the XAD-2 was extracted via Soxhlet extraction with hexane for 24 h. The extract was cleaned by passing it through a silica gel column, eluted with dichloromethane and hexane, and then through a carbon column eluted with methanol, toluene, and hexane. The final clean-up stage involved a silica gel column and a carbon column in series. The concentrated extract was placed into the columns in series and eluted with hexane, a mixture of toluene, ethyl acetate, and hexane (1:1:8 v/v), then finally with toluene. The resulting solution was concentrated and injected into a high-resolution gas chromatography set-up and high-resolution mass spectrometer (HRGC/HRMS) for analysis. The analysis was completed within 45 days after extraction.
The extraction and analysis of PCDD/Fs in coffee beans followed the Chinese National Standard (CNS) test method for residual PCDD/Fs and PCDD/F-like polychlorinated biphenyls in food (CNS 14758). Briefly, 10 g of coffee was weighed and ground before being placed in a microwave tube. A mixture of acetone and n-hexane (1:1 v/v) was added before microwave-assisted extraction. The temperature program was as follows: The temperature was ramped up at a rate of 5 °C min−1 to 75 °C and held for 5 min. Then, the temperature was increased at 10 °C min−1 to 120 °C and held for 20 min. After the extraction was complete, the tube contents were filtered, and the tube was rinsed with acetone and dichloromethane. The extract was then cleaned up using a tandem column of acid silica gel and alumina, followed by a carbon column. Finally, the samples were concentrated before analysis by HRGC/HRMS.
The samples were analyzed for 17 PCDD/F congeners with chlorines in the 2, 3, 7, and 8 positions (
Table S4). The HRGC set-up (Hewlett–Packard 6970 Series gas, Palo Alto, CA, USA) was equipped with a silica capillary column (J&W Scientific, CA, USA) and a splitless injector, while the HRMS (Micromass Autospec Ultima, Manchester, UK) was equipped with a positive electron impact (EI+) source. A DB-5MS 60 m × 0.25 mm × 0.25 µm column was used for the separation of the seventeen congeners. Helium at a rate of 1.2 mL min
−1 was used as the carrier gas. The injection port temperature was 290 °C, and the source temperature was 250 °C. The selected ion monitoring (SIM) mode was used with a resolving power of 10,000. The oven temperature program was as follows: 140 °C for 1 min, a temperature ramp of 25 °C min
−1 to 190 °C, a temperature ramp of 1.5 °C min
−1 to 220 °C, and a temperature ramp of 4 °C min
−1 to 310 °C, and holding for 5 min. The recoveries of the precision and recovery (PAR), and the surrogate, internal, and recovery standards all met the relevant standards, as shown in
Table S5.
The PCDD/F results were reported as both mass concentrations and toxic equivalents. The toxic concentrations were calculated using the World Health Organization Toxic Equivalence (WHO-TEQ), which represents the sum of each dioxin and furan congener concentration multiplied by its corresponding WHO Toxic Equivalency Factor (TEF), providing an overall toxicity value expressed in 2,3,7,8-TCDD equivalents.
2.4. Statistical Analysis
IBM SPSS (Version 22) was used to analyze the statistical differences between fast and slow roasting methods and correlate between PCDD/F concentrations in the flue gas and coffee bean.
3. Results
3.1. Coffee Roasting Parameters
The temperature–time profiles for the fast and slow roasting methods are presented in
Figure 1. According to the figure, the temperature dropped after the coffee beans were funneled into the drum roaster. The turning points of the two roasting methods were both at 1.4 min. The maximum rate of rise for the fast roasting was higher than that for the slow roasting (25.5 vs. 21.2 °C min
−1). Near the end of the roasting process, cracking sounds, also known as “first cracking”, were heard, signaling the start of the pyrolytic reactions when the water and carbon dioxide in the coffee bean escape, causing the specific volume of coffee to increase [
2,
14]. The cracking sound was more pronounced in the slow roasting, which could explain the lower rate of rise observed after 6 min of roasting.
The moisture contents of the roasted coffee samples are presented in
Table S1. The moisture content of A (only coffee) was 4.07 ± 0.551% and 3.21 ± 0.404% for fast and slow roasting, respectively. These values are within the moisture content of light-roasted coffees reported in a recent study [
15]. However, some studies have reported much lower ranges of 1.81–2.82% [
16,
17,
18,
19]. The difference in moisture content could be affected by the initial moisture content of the coffee bean, coffee bean density, ambient humidity, cooling process, and roasting temperature and time [
16,
20,
21]. The moisture contents for the coffee formulations after fast roasting were generally higher than slow roasting, similar to A. The difference was more pronounced in D-2 and D-3 formulations, e.g., 3.00 ± 0.115% and 1.70 ± 0.115% for D-2 during fast and slow roasting, respectively. This observation supports the more pronounced “first cracks” heard during slow roasting.
The color of the roasted coffee is another parameter used to classify coffee. The Agtron color reference scale is the most common scale used in the classification [
22]. After roasting, we measured the color intensities of the whole coffee bean and ground coffee, as shown in
Tables S6 and S7. Based on the Agtron number of A (only coffee) of 86.6 ± 4.23 and 78.9 ± 1.48 for the fast and slow roasting, respectively, the roast was classified as a light roast (>70 Agtron numbers). Interestingly, the Agtron numbers of the other coffee formulations were lower than A, implying that the additional ingredients darkened the coffee. Sugar and honey would undergo nonenzymatic browning reactions, including Maillard reaction and caramelization, under the roasting temperature and time used in this study [
23,
24]. The added alcohol might also influence the color of the coffee. Therefore, the color classification is unsuitable for classifying coffee formulations with added ingredients.
3.2. PCDD/F Concentrations in the Flue Gas and Roasted Coffee Bean Samples
3.2.1. PCDD/F Concentrations in the Flue Gas Samples
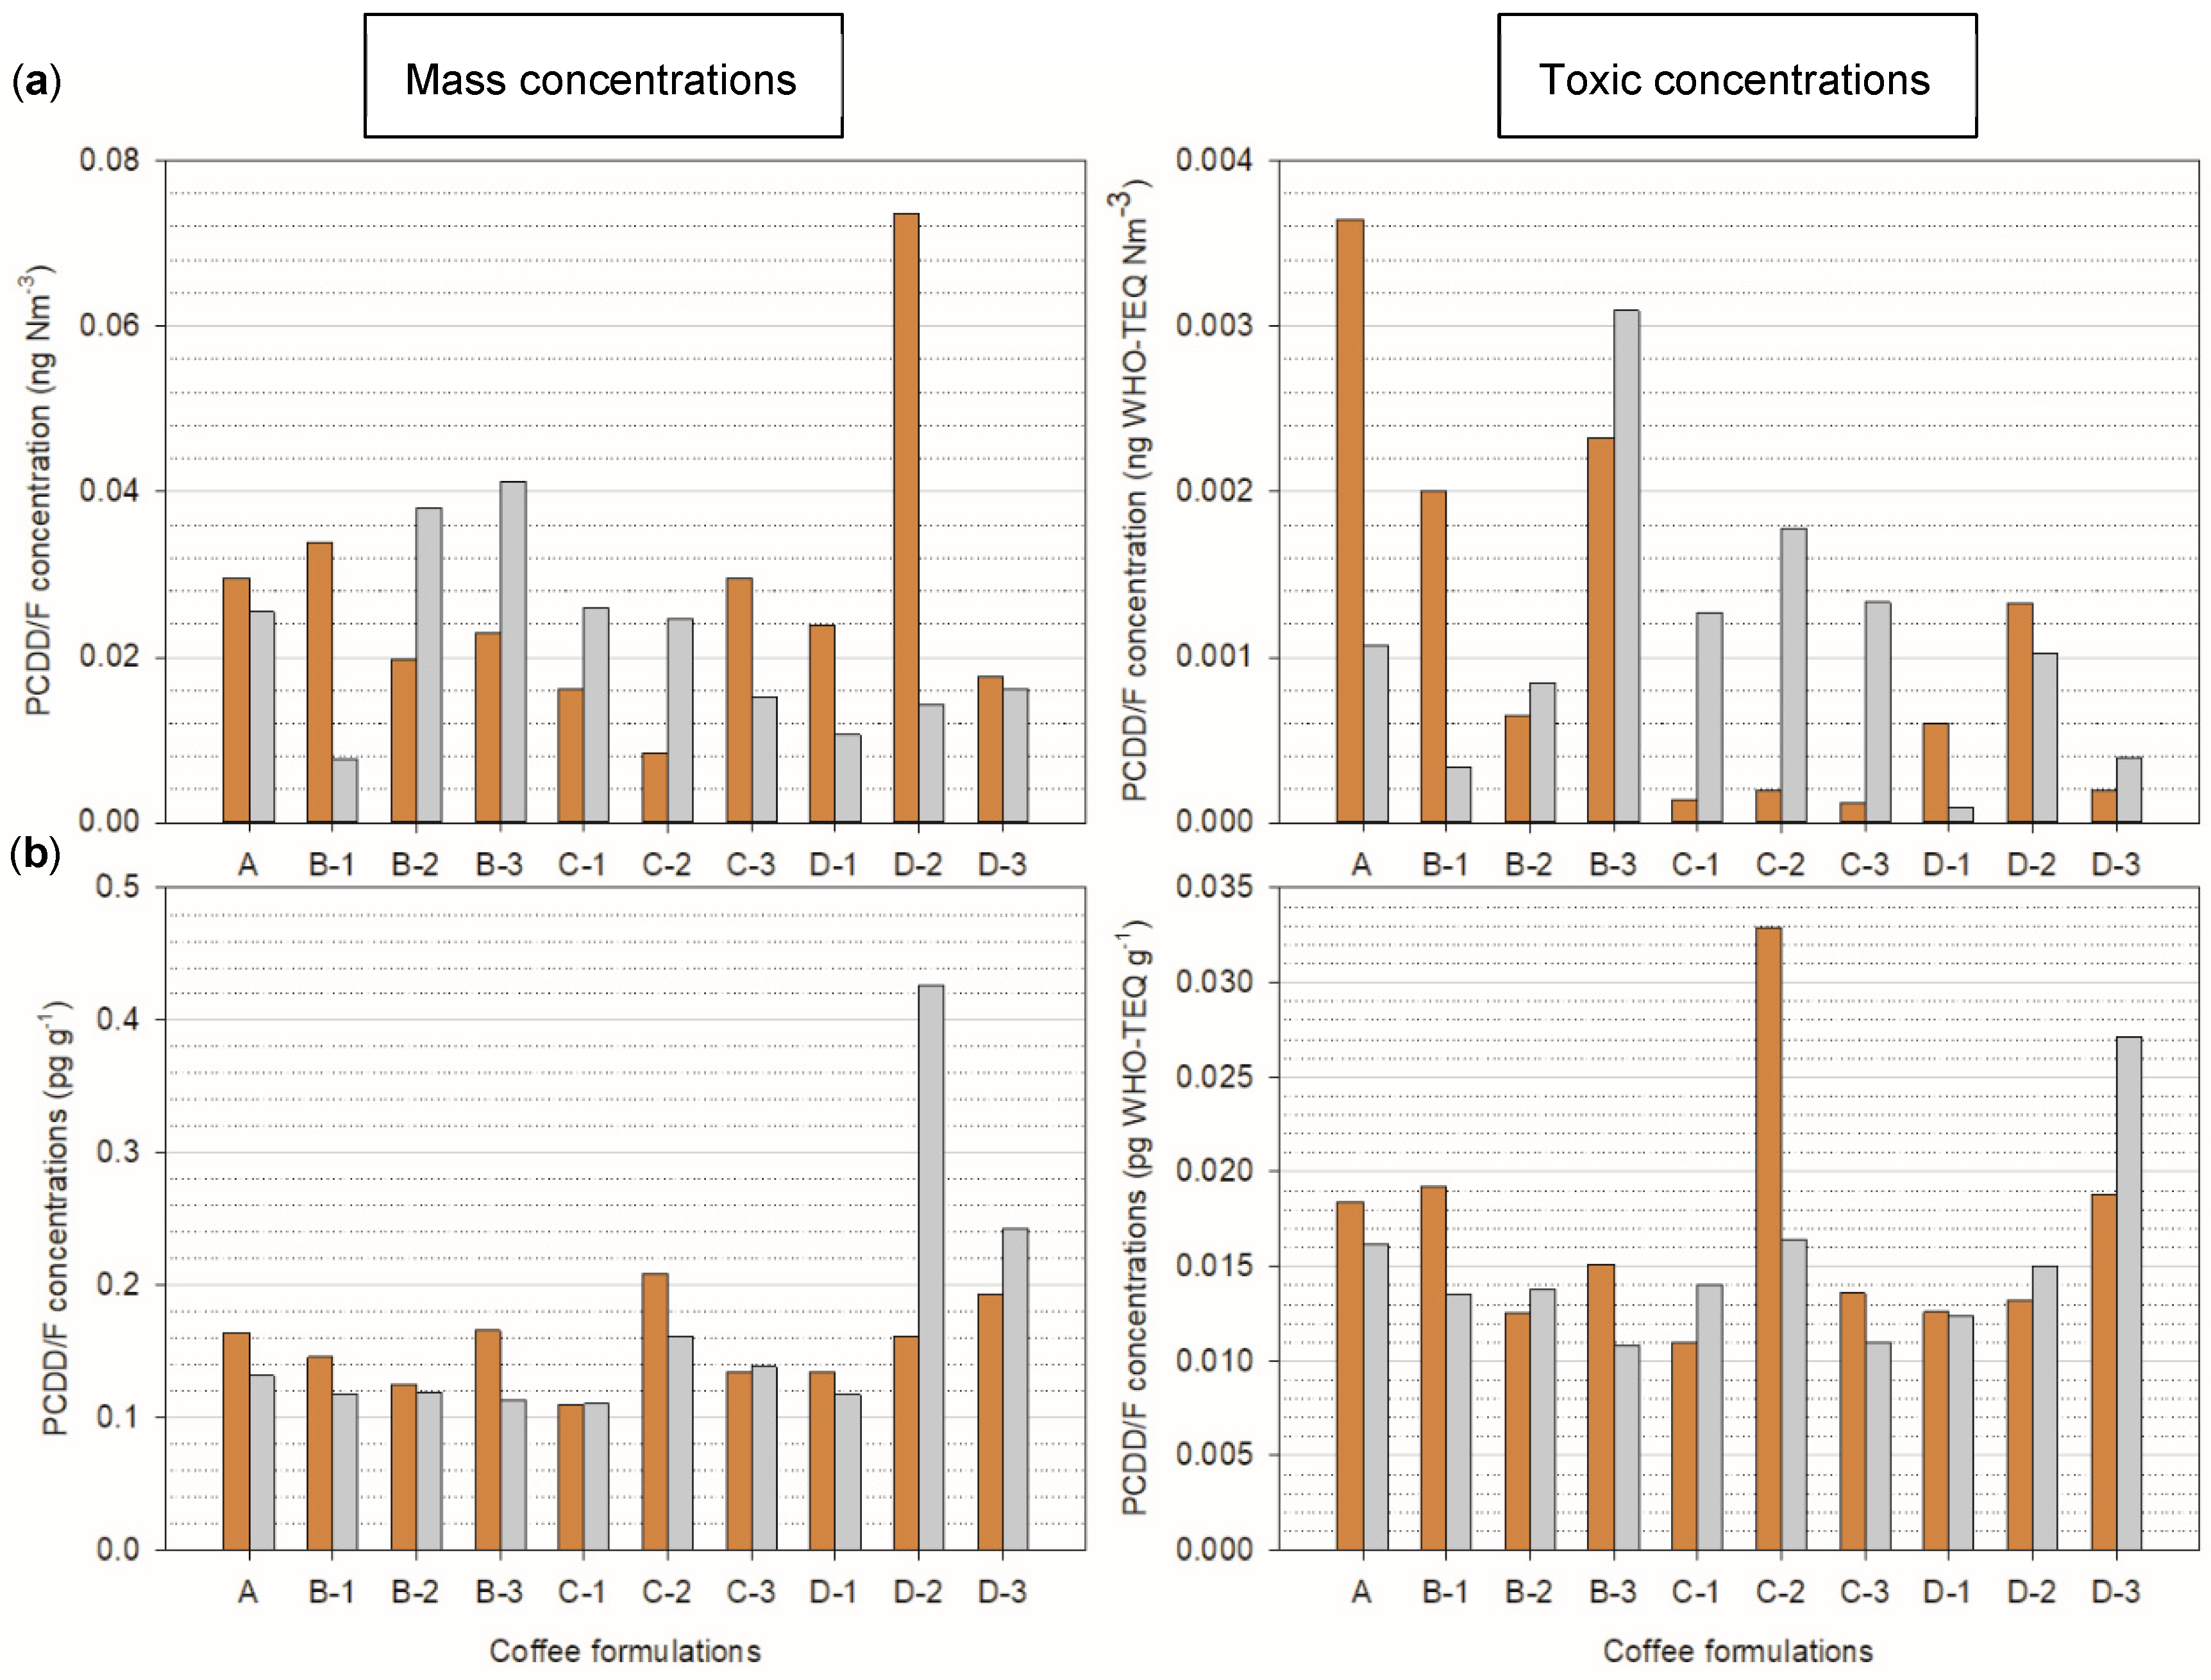
The mass and toxic concentrations in the flue gas are depicted in
Figure 2a, with the values tabulated in
Table S8. As shown in
Figure 2a, the concentrations were detected in all flue gas samples collected during the fast and slow roasting of green coffee (A) and the coffee formulations (B-1 to D-3). The mass and toxic concentrations in the flue gas during fast and slow roasting of sample A were 0.0296 ng Nm
−3 and 0.00364 ng WHO-TEQ Nm
−3, and 0.0255 ng Nm
−3 and 0.00107 ng WHO-TEQ Nm
−3, respectively. These concentrations are much lower than the emissions from most combustion sources and the lowest regulation limit (0.1 ng WHO-TEQ Nm
−3) [
25,
26]. However, given the lower stacks of coffee roasters and the possible escape of the flue gas to the surrounding environment, these concentrations can pose a risk to roaster operators and people within the vicinity [
27].
According to the figure, the mass and toxic PCDD/F concentrations in the flue gas during the fast roasting of A were 13.9% and 70.5% higher than the slow roasting, respectively. Based on these results, the slow roasting method would lead to lower PCDD/F emissions. However, this was not the case for all coffee formulations, for example, B-2, B-3, and C formulations, where the concentrations were much higher during the slow roasting method. For example, the mass and toxic concentrations in the slow roasting of C-2 were ~3 and 9 times higher than in the fast roasting. Therefore, the slow roasting method might not necessarily reduce PCDD/F formation and emission when there are additives to the coffee. This is supported by Student’s
t-test analysis which showed no significant differences (
p = 0.05) in both mass and toxic concentrations between the roasting methods (
Table S9).
3.2.2. PCDD/F Concentrations in the Roasted Coffee Bean Samples
The concentrations in the roasted coffee beans are presented in
Figure 2b and
Table S8. The concentration in the roasted coffee beans did not correlate with those in the flue gas (
Table S10), which could suggest a different formation pathway. There are no specific regulations on PCDD/F concentrations in roasted coffee. Therefore, we compared the concentrations to the EU regulation for food for infants and young children because of the convenience of the units. All the concentrations were lower than the regulation of 0.1 pg WHO-TEQ g
−1 [
28]. Furthermore, since the roasted coffee undergoes brewing before it is consumed, the concentrations are expected to be much lower, given the hydrophobicity of PCDD/Fs. Therefore, the roasted coffee formulations should be safe for consumption regarding PCDD/F concentrations.
The mass and toxic concentrations in the roasted coffee during fast and slow roasting of sample A were 0.0687 pg g
−1 and 0.0184 pg WHO-TEQ g
−1, and 0.0581 pg g
−1 and 0.0162 pg WHO-TEQ g
−1, respectively. Therefore, the mass and toxic concentrations during fast roasting of green coffee were 19.9% and 12.1% higher than slow roasting, respectively. However, this was not the case in some formulations, e.g., C-1, D-2, and D-3, whereby the concentrations were higher in the slow-roasted coffee samples. Therefore, similar to the flue gas concentration results, the roasting method did not uniformly influence the concentration in the coffee formulations. Statistical analysis showed no significant differences between the roasting methods (
p = 0.05), as shown in
Table S11.
In this study, we also analyzed the concentrations in the beans before roasting, as shown in
Figure S1. The differences in concentrations before and after roasting are presented in
Figures S2 and S3 for the slow and fast roasting methods, respectively. The difference was calculated using Equation (1), where
and
are the PCDD/F concentrations in pg g
−1 after and before roasting, respectively.
Before roasting, the mass and toxic concentrations in the coffee beans were within 0.118–0.187 pg g
−1 and 0.0105–0.0184 pg WHO-TEQ g
−1, respectively. An interesting observation was made when the concentrations were compared to those after roasting. All the mass concentrations were lower by 1.40–24.6% after slow roasting than before slow roasting, except D-2 and D-3. The decrease could result from volatilization during the roasting process, decomposition, or loss in the coffee chaff. Decomposition was ruled out because the temperature was too low. PCDD/Fs start decomposing at around 500 °C in an oxidative atmosphere [
29]. Low-chlorinated PCDD/Fs, which are more toxic, are more volatile than high-chlorinated congeners [
7]. Therefore, the low-chlorinated congeners are expected to reduce during roasting, reducing the TEQ concentrations. However, when it comes to the toxic concentrations, most of the after-roasting samples had higher concentrations than the before-roasting ones. The same trend was observed in the fast roasting scenario, whereby the differences in toxic concentrations increased in most samples (
Figure S3b), albeit the stark differences in mass concentrations to the slow roasting. Therefore, volatilization of PCDD/Fs was ruled out as an explanation for the difference before and after roasting. The loss of PCDD/F in the coffee chaff could explain the differences in concentrations before and after roasting. However, based on the toxic concentrations, the formation of low-chlorinated PCDD/Fs appears to have occurred. Further investigation would need to be carried out to verify these assertions.
3.3. The PCDD/F Congener Profiles of the Flue Gas and Coffee Bean Samples
3.3.1. PCDD/F Congener Profile of the Flue Gas Samples
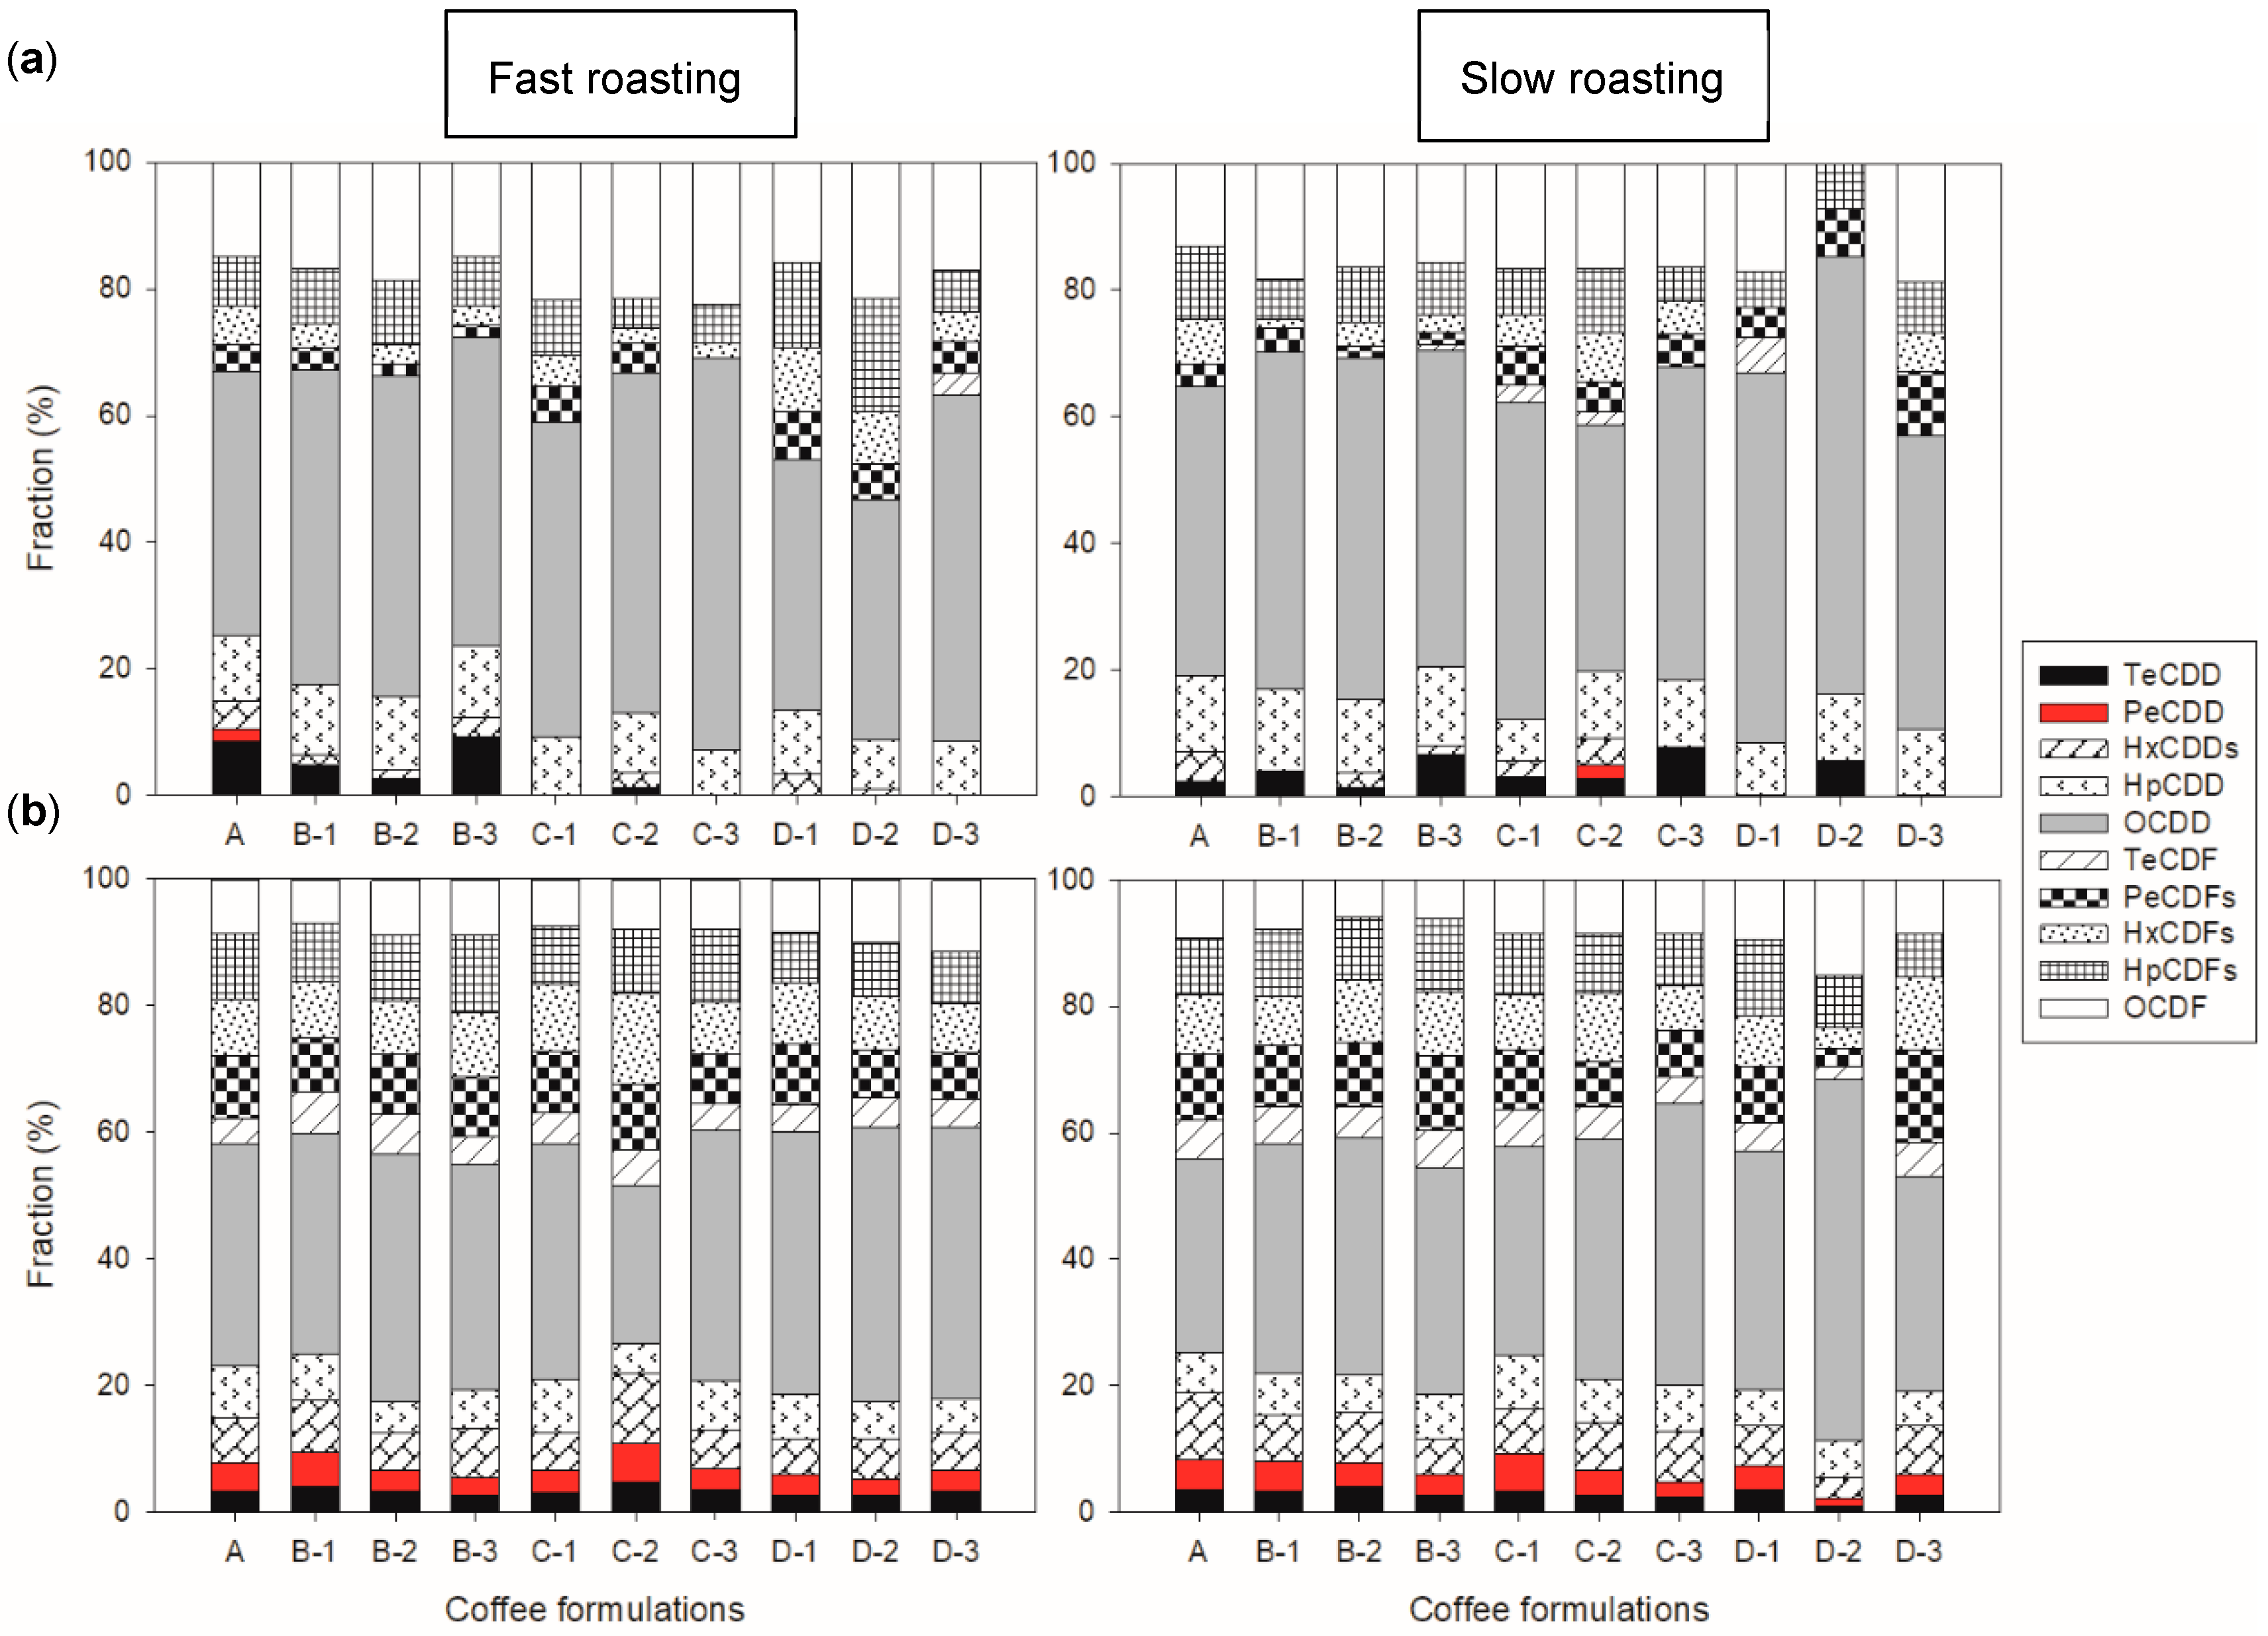
The congener profiles of the flue gas samples collected during fast and slow roasting are presented in
Figure 3a. According to the figure, Octa-CDD (OCDD) was the main congener in all the coffee formulations during both fast and slow roasting, accounting for 48.9 ± 7.35% and 51.5 ± 8.12% of the total congeners, respectively. Octa-CDF (OCDF) was the second most predominant congener (18.5 ± 3.01% and 14.8 ± 5.42%), followed by Hepta-CDD (HpCDD) and Hepta-CDF (HpCDF) with around 7–10%. This pattern is similar to emissions from industrial sources [
25,
30,
31], mobile sources [
32,
33], and environmental samples [
34,
35].
However, the fraction and presence of low-chlorinated congeners varied in the samples. For instance, Tetra-CDD (TeCDD) was one of the main congeners in samples A and B-3 but was not detected in samples C-1, C-3, and Ds during fast roasting. The fraction of low-chlorinated congeners also explains the disparity in concentrations between the two roasting methods. For example, the flue gas of sample A during fast roasting had much higher fractions of TeCDD (8.44%) and Penta-CDD/Fs (PeCDD/Fs) (total of 6.10%) than during slow roasting (2.35% and 3.52%, respectively), explaining the drastic difference in toxic concentrations between the two roasting methods. These differences in the congener profile imply that the PCDD/F emissions were influenced by the additives and the roasting conditions.
The PCDF/PCDD ratios were all <1 except for D-2 during fast roasting (
Figure S4a). The ratio has been used to determine which formation mechanism was predominant: a ratio less than 1 is characteristic of the precursor pathway, while >1 is characteristic of de novo synthesis [
36,
37]. PCDD/F formation was probably due to the precursor pathway, specifically the heterogeneous precursor pathway, because of the low-temperature conditions in the roasting process [
38]. This is because coffee could contain trace amounts of chlorinated compounds, e.g., chlorinated pesticides [
39], and known precursors, including phenolic compounds [
40] and polyaromatic hydrocarbons [
41,
42].
3.3.2. PCDD/F Congener Profile of the Roasted Coffee Bean Samples
The congener profiles of the roasted coffee beans during fast and slow roasting are depicted in
Figure 3b. Similar to the flue gas findings, OCDD was the main congener, accounting for 37.4 ± 5.36% and 38.4 ± 7.54% for the fast and slow roasting, respectively. In contrast to the flue gas samples, PeCDF and OCDF constituted the other significant congeners, contributing 8–9% each. In addition, all the congeners were present in all the profiles of the roasted coffee, unlike in the flue gas samples. Apart from D-2 during slow roasting, the proportion of the most toxic congeners (tetra- and penta-CDD/Fs) was higher in the coffee than in the flue gas samples. However, the PCDF/PCDD ratios were all below 1, similar to the flue gas samples (
Figure S4b). Further investigation would be needed to explain these differences. However, since the congener profiles in the coffee bean were similar to that before roasting (
Figure S5), it can be postulated that the congener profile was influenced more by the initial composition, while the flue gas was influenced by the roasting conditions and additives.
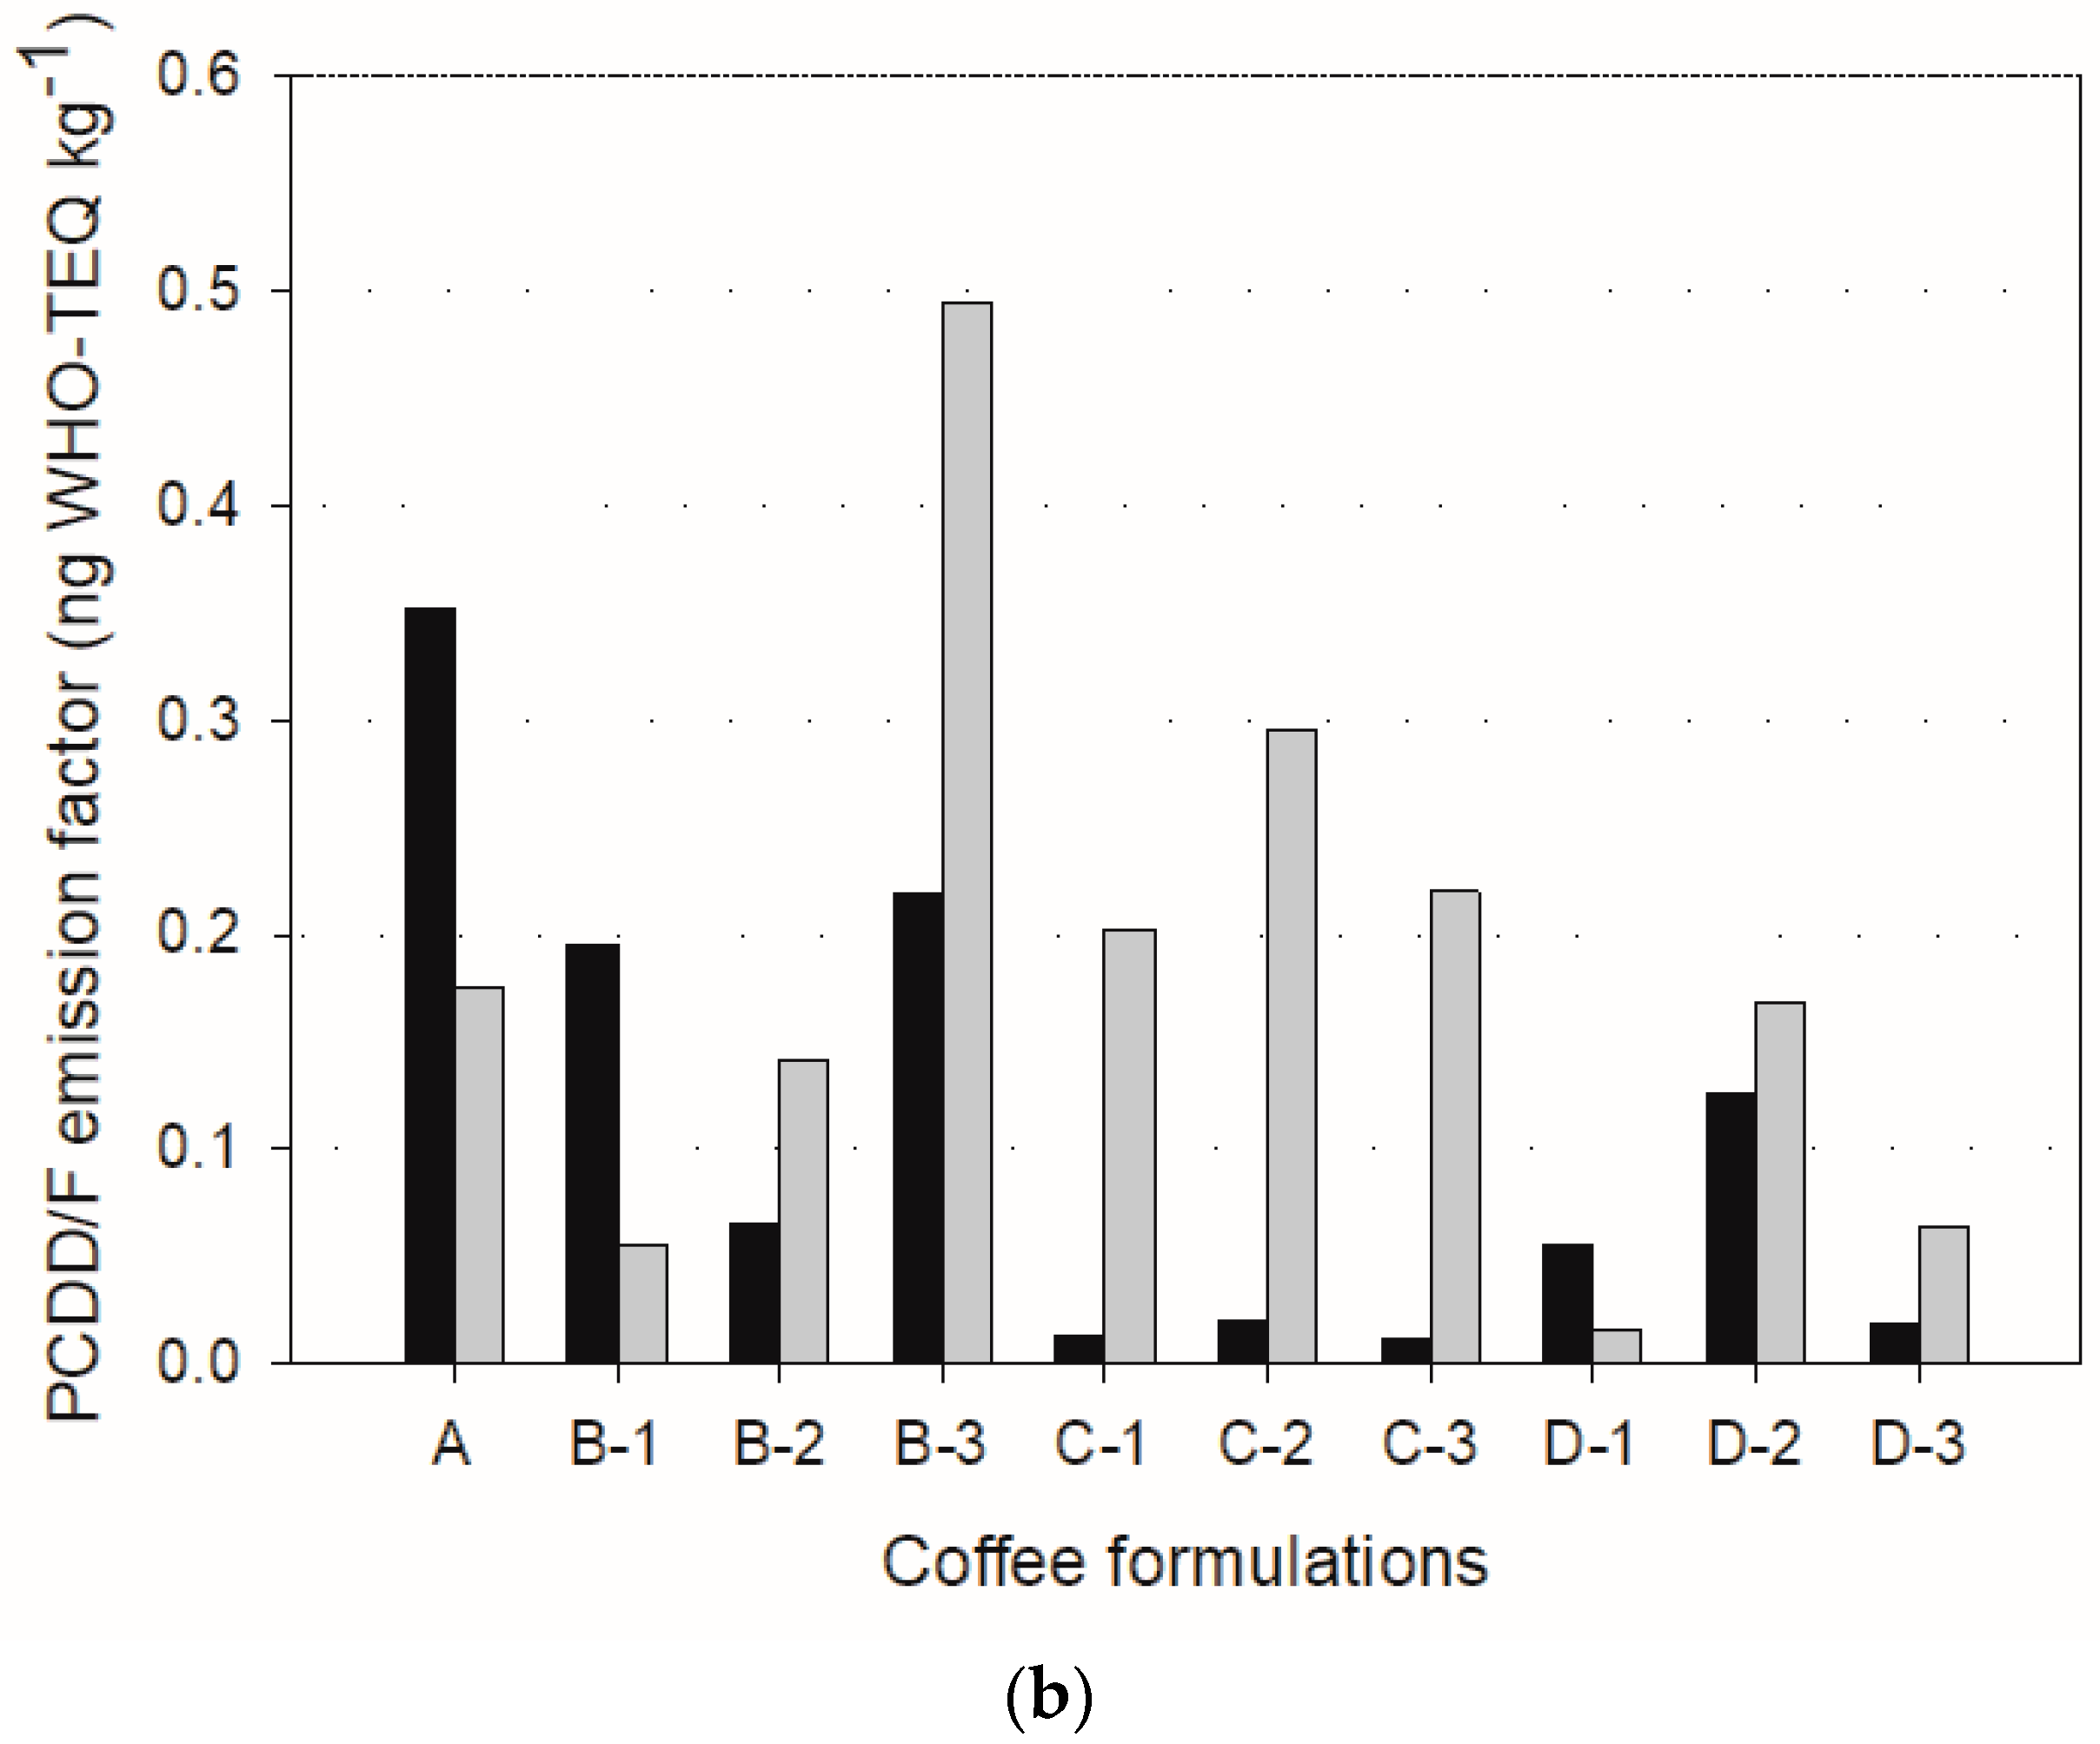
3.4. PCDD/F Emission Factors of Coffee Roasting
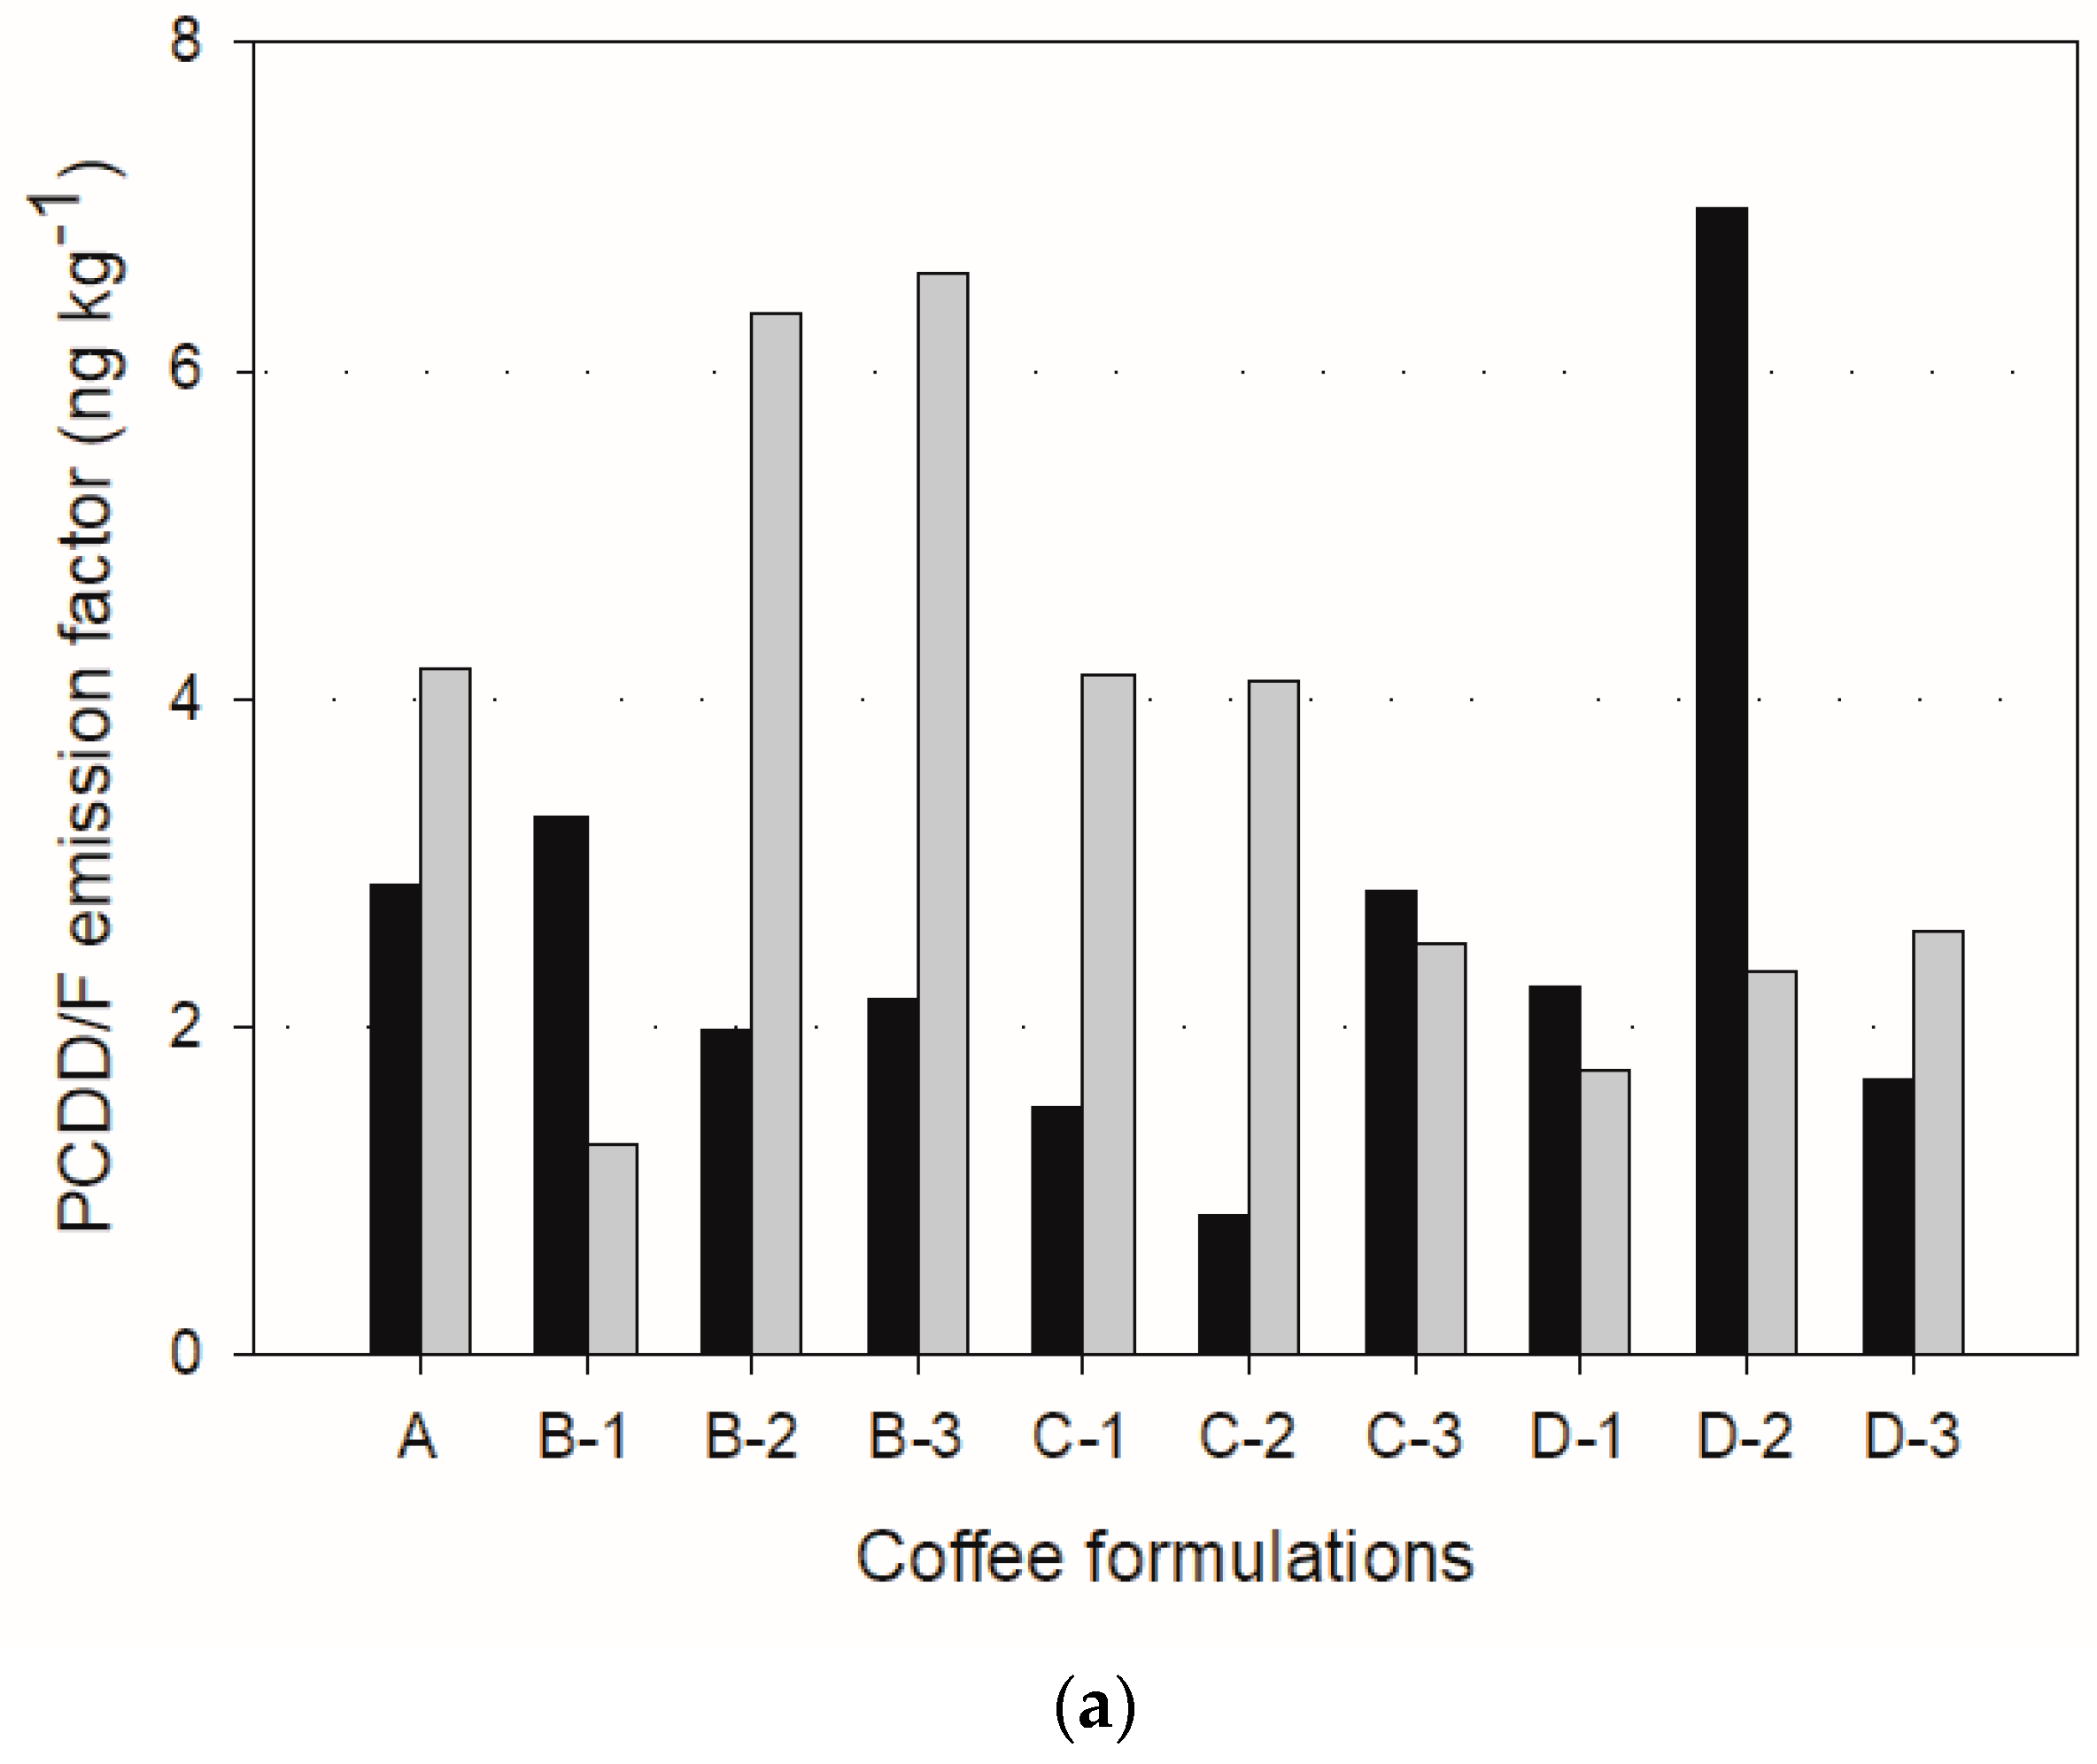
The emission factors based on mass and toxic concentrations are depicted in
Figure 4. The emission rates and factors were calculated using Equations (2) and (3) [
43], where
is the emission rate (ng h
−1 or ng WHO-TEQ h
−1);
is either the mass or toxic PCDD/F concentration in the flue gas;
is the volumetric emission flow rate from the stack (Nm
3 min
−1);
is the emission factor (ng kg
−1 or ng WHO-TEQ kg
−1 of coffee); and Feeding rate is the amount of coffee being roasted per hour (kg hr
−1). The feeding rates for the fast and slow roasting methods were 3.20 kg h
−1 and 1.87 kg h
−1, respectively.
The emission factors for sample A were 2.86 ng kg
−1 and 0.352 ng WHO-TEQ kg
−1, and 4.17 ng kg
−1 and 0.176 ng WHO-TEQ kg
−1 for the fast and slow roasting methods, respectively. Therefore, the slow roasting method would be recommended to reduce toxic emission factors. However, the same cannot be concluded about the other formulations because the was no consistent trend. For instance, the emission factors during slow roasting were much higher in B-2, B-3, Cs, D-2, and D-3 formulations, as shown in
Figure 4b.
Compared to other emission sources, the emission factors for sample A were higher than that from large-scale combustion sources, e.g., municipal solid waste incinerators [
43,
44]. For example, Zhu et al. [
44] estimated the emission factors from six municipal solid waste incinerators as 0.027–0.225 ng I-TEQ kg
−1 of waste, with a mean of 0.17 ng I-TEQ kg
−1 (units converted from µg I-TEQ tonne
−1 of waste). These large-scale combustion sources have stricter emission regulations and are therefore equipped with advanced air pollution control devices, and the operations are optimized to reduce PCDD/F emissions [
7]. Large-scale coffee producers also use air pollution control devices, e.g., electrostatic precipitators and catalytic afterburners, to control the emissions of traditional air pollutants such as particulate matter, carbon monoxide, and volatile organic carbons. This study shows that air pollution control strategies should be considered to protect the health of roaster operators and individuals nearby. Using adsorbers, like biochar, can be a good solution for trapping the pollutants [
45]. That said, the global consumption of coffee is far less than the amount of municipal waste incinerated. According to the International Coffee Organization, ~10 million tons of coffee were consumed globally in 2020/21. Using this value, the toxic PCDD/F emission quantities in that year were 3.52 g and 1.76 g WHO-TEQ for the fast and slow roasting process, respectively. The emission quantities are probably overestimated since most of the coffee beans are roasted by large-scale coffee roasters.
3.5. Limitations of the Study
Although this study offers valuable insights into the formation and emission of PCDD/Fs during coffee roasting, particularly with the addition of honey, sugar, and alcohol, several factors may account for the observed variability in emissions under different conditions. One key factor could be the complex chemical reactions involving the additives. These substances may introduce precursors such as phenols, furans, and other aromatic compounds that could facilitate PCDD/F formation through the precursor pathway. However, the specific interactions between the additives and the coffee matrix during roasting are not fully understood. Detailed chemical profiling of the additives would be necessary to identify the compounds contributing to the increase in PCDD/F emissions. Another possible explanation lies in the differing decomposition temperatures of the additives. Additives such as honey and sugar decompose at relatively low temperatures, undergoing processes like Maillard reactions and caramelization, which could release compounds that promote PCDD/F formation. The complexity of these reactions and their evolution at various roasting temperatures require further investigation.
Additionally, the study applied fixed amounts of additives without exploring the impact of different concentrations on PCDD/F emissions. Varying concentrations of additives might alter the emissions, either by providing more precursors for PCDD/F formation or by introducing competing reactions that could suppress their formation. This highlights the need for future studies to examine the role of additive concentration more closely.
Lastly, the inconsistency in trends between additives and roasting methods, where some additives led to higher PCDD/F emissions during slow roasting and others during fast roasting, could be due to the complex interplay of multiple variables. These include the thermal decomposition pathways of the additives and the coffee matrix itself. Further research is needed to elucidate the mechanisms driving these divergent results.
4. Conclusions
This study pioneers the investigation of PCDD/F emissions during light roasting of green coffee and various sugar-, honey-, and/or alcohol-infused coffee formulations. The results showed that PCDD/F is released during the roasting process. The results demonstrated that PCDD/Fs are released during the roasting process, with slower roasting methods producing lower concentrations compared to faster roasting. However, when additives were present, the emission trends were inconsistent and unpredictable. The concentrations of PCDD/Fs in roasted coffee beans were below the strictest food safety regulations, specifically the limit of 0.1 pg WHO-TEQ g−1. PCDD/Fs were also detected in the flue gas, which raises potential concerns about inhalation exposure for roasting operators, customers, and nearby individuals, warranting further investigation. PCDD/F emissions from large-scale roasters could also be investigated to determine the contribution of this industry to PCDD/F inventories. Furthermore, a comprehensive understanding can be achieved by examining the formation and emission during different roasting levels, ranging from light/medium to very dark and the transfer of the compounds in the brewed coffee.
