Article

Quantifying Future Annual Fluxes of Polychlorinated Dibenzo-P-Dioxin and Dibenzofuran Emissions from Sugarcane Burning in Indonesia via Grey Model

by
Lailatus Siami
1,2,
Yu-Chun Wang
1 and
Lin-Chi Wang
3,*
1
Department of Environmental Engineering, Chung Yuan Christian University, Taoyuan 32023, Taiwan
2
Department of Civil Engineering, Chung Yuan Christian University, Taoyuan 32023, Taiwan
3
Department of Marine Environmental Engineering, National Kaohsiung University of Science and Technology, Kaohsiung City 81157, Taiwan
*
Author to whom correspondence should be addressed.
Atmosphere 2024, 15(9), 1078; https://doi.org/10.3390/atmos15091078
Submission received: 31 July 2024 / Revised: 1 September 2024 / Accepted: 3 September 2024 / Published: 6 September 2024
(This article belongs to the Special Issue Toxicity of Persistent Organic Pollutants and Microplastics in Air)

Abstract

:
The open burning of sugarcane residue is commonly used as a low-cost and fast method during pre-harvest and post-harvest periods. However, this practice releases various pollutants, including dioxins. This study aims to predict polychlorinated dibenzo-p-dioxins and dibenzofurans (PCDD/Fs or dioxins) emissions using the grey model (GM (1,1)) and to map the annual flux spatial distribution at the provincial level from 2023 to 2028. An annual emission inventory at the provincial level was developed using the activity rate of dry crop residue from national agencies and literature, following the guidelines set by the United Nations Environment Programme (UNEP). Emission distributions from 2016 to 2022 were then mapped. The average PCDD/F emission values show significant variation among the provinces, averaging 309 pg TEQ/year. Spatially, regions with intensive sugarcane production, such as Lampung and East Java consistently show high emissions, often exceeding 400 pg/m2. Emissions calculated using the UNEP emission factor tend to be higher compared to other factors, due to its generic nature and lack of regional specificity. Emission predictions using GM (1,1) indicate that North Sumatra is expected to experience a steady increase in PCDD/Fs emissions, whereas South Sumatra and Lampung are projected are projected to see a slight decline. This forecast assumes no changes in regional intervention strategies. Most regions in Java Island show a gradual increase in emissions, except for East Java, which is predicted to have a slight decline from 416 pg/year in 2023 to 397 pg/year in 2028. Additionally, regions such as Gorontalo and parts of East Java are projected to remain ‘hotspots’ with consistently high emissions, highlighting the need for targeted interventions. To address emission hotspots, this study emphasizes the need for cleaner agricultural practices, enhanced enforcement of environmental regulations, and the integration of advanced monitoring technologies to mitigate the environmental and health impacts of PCDD/F emissions in Indonesia. Future studies should consider developing monthly emissions profiles to better account for local agricultural practices and seasonal conditions. The emission data generated in this study, which include both spatial and temporal distributions, are valuable for air quality modeling studies and can help assess the impact of current and future emissions on ambient air quality.

1. Introduction

Among all agriculture product in Indonesia, sugarcane ranks as the third largest production, with a year-on-year reaching up to 32.4 million tons in 2022 [1]. Inadequate post-harvest handling of sugarcane can contribute to environmental degradation due to the accumulation of cane trash. High-fiber portions of the sugarcane plant are left in the field, resulting in post-harvest waste that includes fresh and dry leaves, plant sticks, stalks, and roots [2]. The prolonged presence of this waste can reduce soil moisture [3], inhibit ratoon cane shoot growth, and disrupt soil processes during subsequent sugarcane planting [4]. In fact, in many regions, open burning of sugarcane crop residue is a common practice, as it is regarded as a quick and low-cost method for field clearance [5]. But, it is significantly affect the environmental dynamics of agricultural areas. This practice typically involves the burning off leaves, drying out cane tops, and removing agricultural debris from the soil. Such an approach facilitates efficient harvesting of stalks by minimizing unwanted biomass and reducing the risks posed by snakes and insects.
Studies have consistently demonstrated that sugarcane burning releases various pollutants including particulate matter, black carbon, sulfur dioxide, and greenhouse gases such as CO2, N2O, and CH4 [6,7,8]. Notably, highly toxic pollutants like PCDD/Fs releases from sugarcane burning [6,9,10] significantly to air pollution. A recent study [11] revealed that approximately 90% of dioxin in Indonesia originates from open burning, including agricultural practices. In Thailand, sugarcane open burning itself contributes approximately 26% to sectoral emissions [12]. Previous studies on dioxin emission inventories reveal intriguing insights. In the total U.S. inventory for the year 2000, dioxin emissions were estimated to be around 1500 g TEQ [13]. Within the agriculture sector, including sugarcane, emissions were 131 g TEQ per year in 2012, representing 4.52% of all sources [14]. Meanwhile, in Portugal, uncontrolled combustion, including open burning in agriculture was the second-highest contributor to dioxin emissions, constituting around 28.9% of all sources, or approximately 0.31 g TEQ per year [15]. Then, in China, the annual release of PCDD/PCDF from open burning reached 12 g TEQ in 2015 [16]. Notably, Zhang, et al. [17] emphasized that constructing a comprehensive dioxin emission inventory specifically for sugarcane biomass combustion remains challenging due to the diverse factors influencing dioxin emissions. In southeast Asia, limited studies have been conducted. However, astudy in Thailand using country-specific activity data highlighted the environmental impact of biomass combustion and revealed that open burning in sugarcane fields is a significant contributor to air pollution [18].
Previous studies mentioned have indicated that flaming and smoldering significantly impact dioxins emission during sugarcane burning [17]. Moreover, there is a significant correlation between exposure to high concentrations of PCDD/Fs and an increased relative risk of mortality from all causes [19]. PCDD/Fs are known to have detrimental effects on health, ranging from carcinogenic effects mediated by the aryl hydrocarbon receptor to non-cancerous effects such as atherosclerosis, hypertension, and diabetes [20,21]. On top of that, PCDD/Fs are a substantial environmental concern due to their persistence in ecosystems and their ability to bioaccumulate in the food chain. Notwithstanding low levels of exposure, dioxins may lead to long-term health effects.
The grey model (1,1) stands as a well-established and fundamental model in grey prediction theory, as highlighted in Xie [22]. Renowned for its linear properties [23], the GM (1,1) model has been widely applied across various fields due to its computational efficiency [24]. The advantages of using the grey prediction model include its ability to function effectively with limited data [25], particularly in situations where comprehensive datasets are unavailable or difficult to obtain. This makes suitable for early-stage research and preliminary assessments. Furthermore, the computational simplicity of the grey prediction model requires fewer resources and less time to implement compared to more complex predictive models. Despite its ease of calculation, the grey prediction model is renowned for its high simulation accuracy, making it a reliable tool for forecasting. Due to these advantages, the grey prediction model has found extensive application across various domains. Its versatility extends to fields such as environmental science, where it used to predict pollution levels and natural resource availability, and in healthcare, for predicting disease outbreaks and patient outcomes [26]. The model’s ability to produce accurate predictions with minimal data inputs and straightforward calculations [25] makes it a popular choice in both academic research and practical applications. Notably, it has been employed in diverse studies, including those on CO2 emission inventory-related energy consumption in Turkey [27], CO2 emissions in China [28], CO2 emissions in Vietnam [29], and SO2 emissions in China [30].
Despite the limited research on dioxin emissions from agriculture in Indonesia, specifically those related to sugarcane, we intend to estimate PCDD/Fs emissions resulting from the open burning of sugarcane crop residues between 2012 and 2022. Following UNEP guidelines to calculate the dioxin emission inventory, we also map the distribution of annual flux emissions at the provincial level. The primary objective of our study is lto utilize the grey model (1,1) to predict future emissions. We focus on time series forecasting of dioxin emissions for the period from 2023 to 2028, especially in the context of incomplete information and uncertain factors. Our approach involves converting the original annual emission inventory data of PCDD/Fs from 2016 to 2022 into a cumulative form using the accumulated generating operation (AGO) to reduce randomness and enhance trend visibility. We then calculate the first-order difference sequence, known as the discrete accumulated generating operation (DAGO), from the cumulative data and extrapolate the sequence so we can predict the dioxin prediction emission.

2. Material and Methods

2.1. General Introduction of Indonesia

Indonesia, spanning from 0°47′21.39″ S to 113°55′16.78″ E, is located in southeast Asia. It has a population of approximately 275.5 million and covers an area of 1.9 million square kilometers. The country comprises 33 provinces, many of which are separated by the sea. Indonesia has an agriculture-dependent economy, with sugarcane being one of the key crops, significantly influenced by local temperature, humidity, and rainfall patterns. The country has two distinct seasons: a dry season from March to September and a rainy season from October to February. Figure 1 illustrates the population density and sugarcane production for each province in 2022.

2.2. Emission Inventory

The emission inventory relies on the UNEP Toolkit (UNEP, 2012). Nonetheless, a limitation of this study is that it does not use local emission factors; instead, we a general emission factor from UNEP for the open burning of crop residue in sugarcane is applied. The emission factor for air emissions is 4 µg TEQ/t (toxic equivalent per ton) of material burned (UNEP, 2012). Sugarcane production is calculated on a dry weight basis in tons per year (Ps) combined with the sugarcane residue-to-cane production ratio (RPPs) to estimate the quantity of dry sugarcane residue (Qs), as shown in Equation (1). The RPPs is assumed to be 33%. Using the activity rate, which represent the quantity of dry sugarcane residue in tons per year within the harvested area in hectares (A), the biomass fuel load (BL) on a dry mass basis (kg/m2) is determined. This is calculated by dividing Qs by A and adjusting the scale by a factor of 10−1, as specified in Equation (2). The next step involves calculating the actual biomass consumed (Bb, in kg/m2) during combustion, which is obtained by multiplying the biomass fuel load (BL) by the combustion factor (Cf, set to 0.64) as outlined in Equation (3). Equation (4) computes the annual flux of PCDD/Fs (in kg/m2) for spatial emissions by multiplying the biomass consumed (Bb) by the emission factor (EF), which is determined by the UNEP guideline for the open burning of crop residue in sugarcane. Finally, PCDD/Fs emissions are calculated using Equation (5), where emissions are the product of the emission factor (EF) and the activity rate. To estimate uncertainty, the Monte Carlo method is employed, leveraging activity rate data. This approach involves generating many random samples to simulate the variability in the activity rate, thereby providing a probabilistic distribution of possible outcomes.
Q s = P s × R P P s
B L = Q s A × 10 1
B b = B L × C f
P C D D / F   A n u a l   F l u x   E m i s s i o n = B b × E F
P C D D / F   e m i s s i o n s = E m i s s i o n   f a c t o r   ( E F ) × A c t i v i t y   r a t e

2.3. Emission Factors

The UNEP Toolkit recommends an emission factor of 4 µg TEQ/t of material burned for estimating the release of PCDD/Fs and dioxin-like polychlorinated biphenyls (dl-PCBs) from sugarcane burning, as informed by the assessment conducted by Black, et al. [31]. The reason for choosing to use this emission factor is because it is supported by relatively consistent results published in the peer-reviewed literature, indicating reliability. Although there is a wide range of results within this sub-category, the UNEP Toolkit’s emission factor is derived from a comprehensive assessment which considers a variety of influencing factors such as combustion facilities, operating conditions, fuel composition, and accidental addition of contaminants [17]. This makes it a robust choice, especially given the limited geographic range of other studies that might not fully capture the diverse conditions present in sugarcane burning practices.
However, in Table 1, we observe variations among the published emission factors associated with sugarcane burning, comparing different countries and experimental methods. These factors exhibit a wide range, highlighting the impact of both geographical location and the experimental approach on the results. For instance, a burn facility in Hawaii, USA, reports the highest mean EF at 126 µg TEQ/t fuel, with a range of 98–148 µg TEQ/t fuel, suggesting high emission levels under controlled conditions. Conversely, a sugarcane pile burn facility in Florida, USA, exhibits the lowest mean EF at 0.34 µg TEQ/t fuel. Field experiments in Queensland, Australia, and Florida, USA, show mean EFs of 0.95 µg TEQ/t fuel and 1.39 µg TEQ/t fuel, respectively, with varying ranges and standard deviations, indicating differences in burning practices and environmental conditions. Laboratory burn tunnel experiments in Queensland, Australia, demonstrate a mean EF of 4.4 µg TEQ/t fuel, with a notable standard deviation of 3.7, reflecting high variability in emissions. These findings emphasize the importance of considering both location and method when assessing emission factors for sugarcane burning.

2.4. Activity Data

The national statistical agency [1,33,34,35,36] collects annual sugar cane production data for each province. This dataset includes information on the production area (in hectares) and the total production (in tons) from 2016 to 2022. Using this data, we calculated the ratio of harvested sugarcane to residue. Table S1 presents annual sugarcane production data for each Indonesian province. As seen in the table, only 9 out of 33 provinces engage in sugarcane production. In 2016, the annual production ranged from approximately 3000 tons, harvested from an area of around 7000 hectares. West Nusa Tenggara began sugarcane production in 2017, followed by East Nusa Tenggara in 2021. The decrease in the harvested area is not always concurrent with a decrease in production, as seen in several areas like West Java, which has experienced a decrease in harvested area (9889 hectares less in 2020 compared to 2019); however, production showed an opposite trend, increasing from 32,488 tons in 2019 to 39,492 tons in 2020. The production increase is attributed to the adoption of local sugarcane varieties that are more resistant to pests and diseases, require less water, and have higher sugar recovery rates at the mills [37]. This will certainly impact the ratio of residue to production across different provinces.

2.5. Grey Model

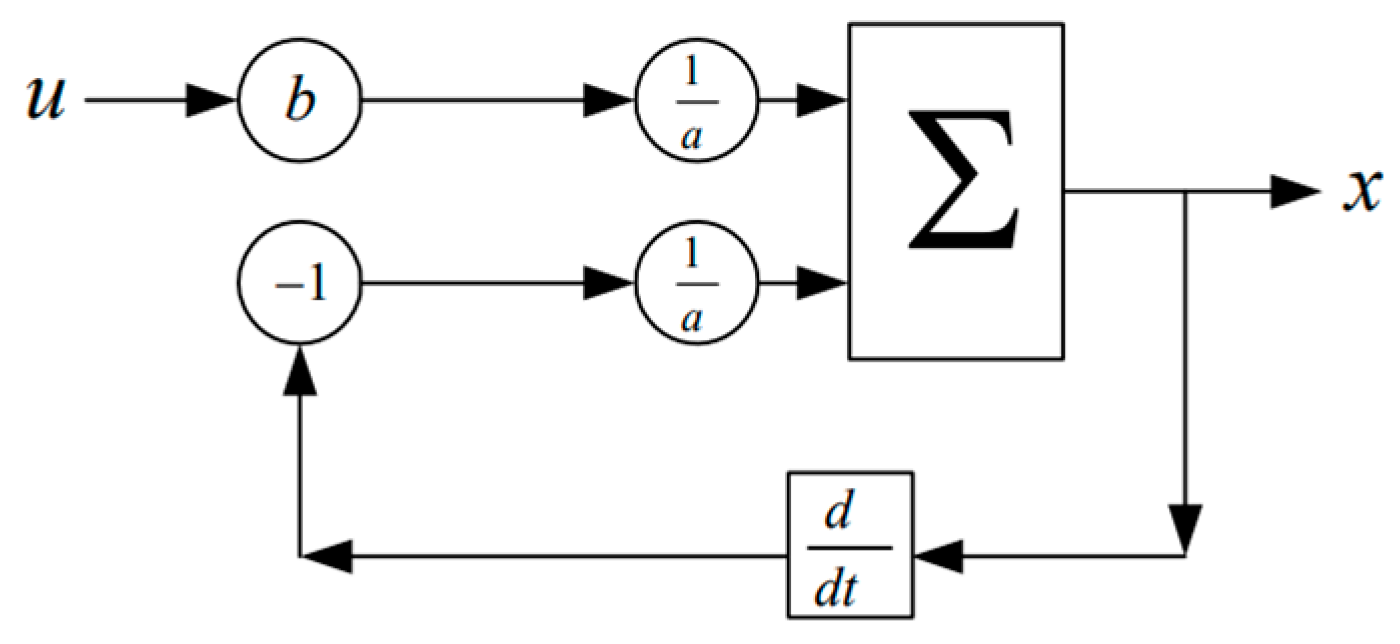
In this study, the prediction of PCDD/Fs emissions from 2023 to 2028 based on data from 2016 to 2022 employs the ‘grey model first order one variable’ (GM (1,1)). This model is particularly useful when dealing with limited and uncertain data. The (GM (1,1) model is advantageous due to its simplicity and with short time series data, whereas traditional statistical methods may not be as suitable [38]. This approach involves converting the original data into a cumulative form using the AGO. Despite its simplicity, the model achieves excellent prediction results [39]. In the concept shown in Figure 2 below, where input data are processed through predictive modeling to generate outputs. The model uses feedback mechanisms to adjust predictions based on input data, ensuring accurate and reliable emission forecasts. After gathering and ordering the input data sequentially to the years, we then initiate the model.
Firstly, the process begins by organizing the input data chronologically. The initial step involves converting the raw data into an accumulative sum to improve the data regularity, which is crucial for handling the exponential growth characteristics typical in grey models. This accumulation helps in smoothing out random fluctuations in the time series data. The first-order differential equation of the model is described in Equation (6). The next step involves calculating the DAGO from the cumulative data and extrapolating this sequence to predict dioxin emissions.
d x ( 1 ) d t + a x ( 1 ) = b
where a and b are parameters estimated using the least squares method applied to the cumulative data series. The model continues with the inverse-accumulation to predict the future PCDD/Fs emission.Here, x(0) (1) is the first value of original historical emissions data and k is the time step. This model is constructed to forecast future values. By inputting the values of k for the years 2023 to 2028, the model predicts the corresponding PCDD/Fs emissions (Equation (7)). The inverse accumulated generating operation (IAGO) is then used to convert the predicted accumulated values back to the original scale, providing the forecasted emissions for each year.
x ^ ( 1 )   k + 1 = x 0 1 b a   e a k + b a
The performance of the GM (1,1) model is evaluated using cross-validation of the mean absolute percentage error (MAPE) and the mean absolute error (MAE). In Equation (8), ei and Yi are the error and observation values (using 3rd-year prediction data) of the ith period. MAE as shown in Equation (9), is a measure used to quantify the accuracy of a forecasting model by averaging the absolute errors in the predictions.
M A P E = 1 n   i = 1 n e i Y i × 100
M A E = 1 n   i = 1 n e i

3. Results and Discussion

3.1. Annual Emissions and Geographical Distribution

The activity rate of sugarcane crop residue burning is influenced by biomass fuel load (BL), biomass sugarcane consumption (Bb), and the quantity of dry sugarcane residue (Qs). Table S2 provides a comprehensive overview of BL, Bb, and Qs in Indonesian provinces from 2016 to 2022. The data indicate substantial differences in sugarcane residue among the provinces. For instance, East Java shows consistently high values in both BL and Bb, with sugarcane residue quantities peaking at 367.92 tons/year in 2016 and 340.27 tons/year in 2022. Similarly, Central Java displays significant biomass fuel load and consumption, with a Bb of 0.14 kg/m2 and a Qs of 72.37 tons/year in 2022. Compared to Thailand, where the biomass fuel load was 10.15 million tons in 2012 [18], Indonesia’s biomass fuel load is significantly smaller, highlighting differences in agricultural practices between the two countries. However, other factors, such as moisture content, also influence the activity rate. A simulation study conducted by Spaunhorst, et al. [40] demonstrated that different biomass densities, ranging from 6.1 to 24.2 Mg/ha with 44% moisture content during lower wind speeds, resulted in a smoldering effect. This effect reduced weed emergence by 23% compared to burning post-harvest residue with 30% moisture during breezy conditions.
Table 2 summarizes the descriptive statistics of PCDD/Fs emissions across Indonesian provinces from 2016 to 2022. The average PCDD/Fs emission values exhibit significant variation among the provinces. North Sumatra has a mean emission of 232 pg/year, whereas East Nusa Tenggara has the lowest mean emission at 187 pg/year. Notably, East Java shows the highest mean emission at 435 pg/year, indicating substantial variability in emissions between provinces. The standard deviation values also vary considerably, with D.I. Yogyakarta showing the highest variability (std = 70), suggesting fluctuating emission levels over the years. In contrast, East Nusa Tenggara has a relatively high standard deviation of 153, but this is based on a limited sample size (n = 2), which may affect the reliability of the PCDD/Fs emission inventory. The range of minimum emission values spans from as low as 50 pg/year in West Nusa Tenggara to 407 pg/year in East Java. Conversely, the maximum values range from 293 pg/year in North Sumatra to 487 pg/year in Gorontalo, illustrating a wide dispersion in emission levels across the provinces. The 50th percentile (median) values align closely with the mean values in most provinces, indicating a symmetrical distribution of emission data. However, provinces like West Nusa Tenggara show a substantial difference between the median (276.5 pg/year) and the mean (242 pg/year), hinting at potential outliers or skewed data.
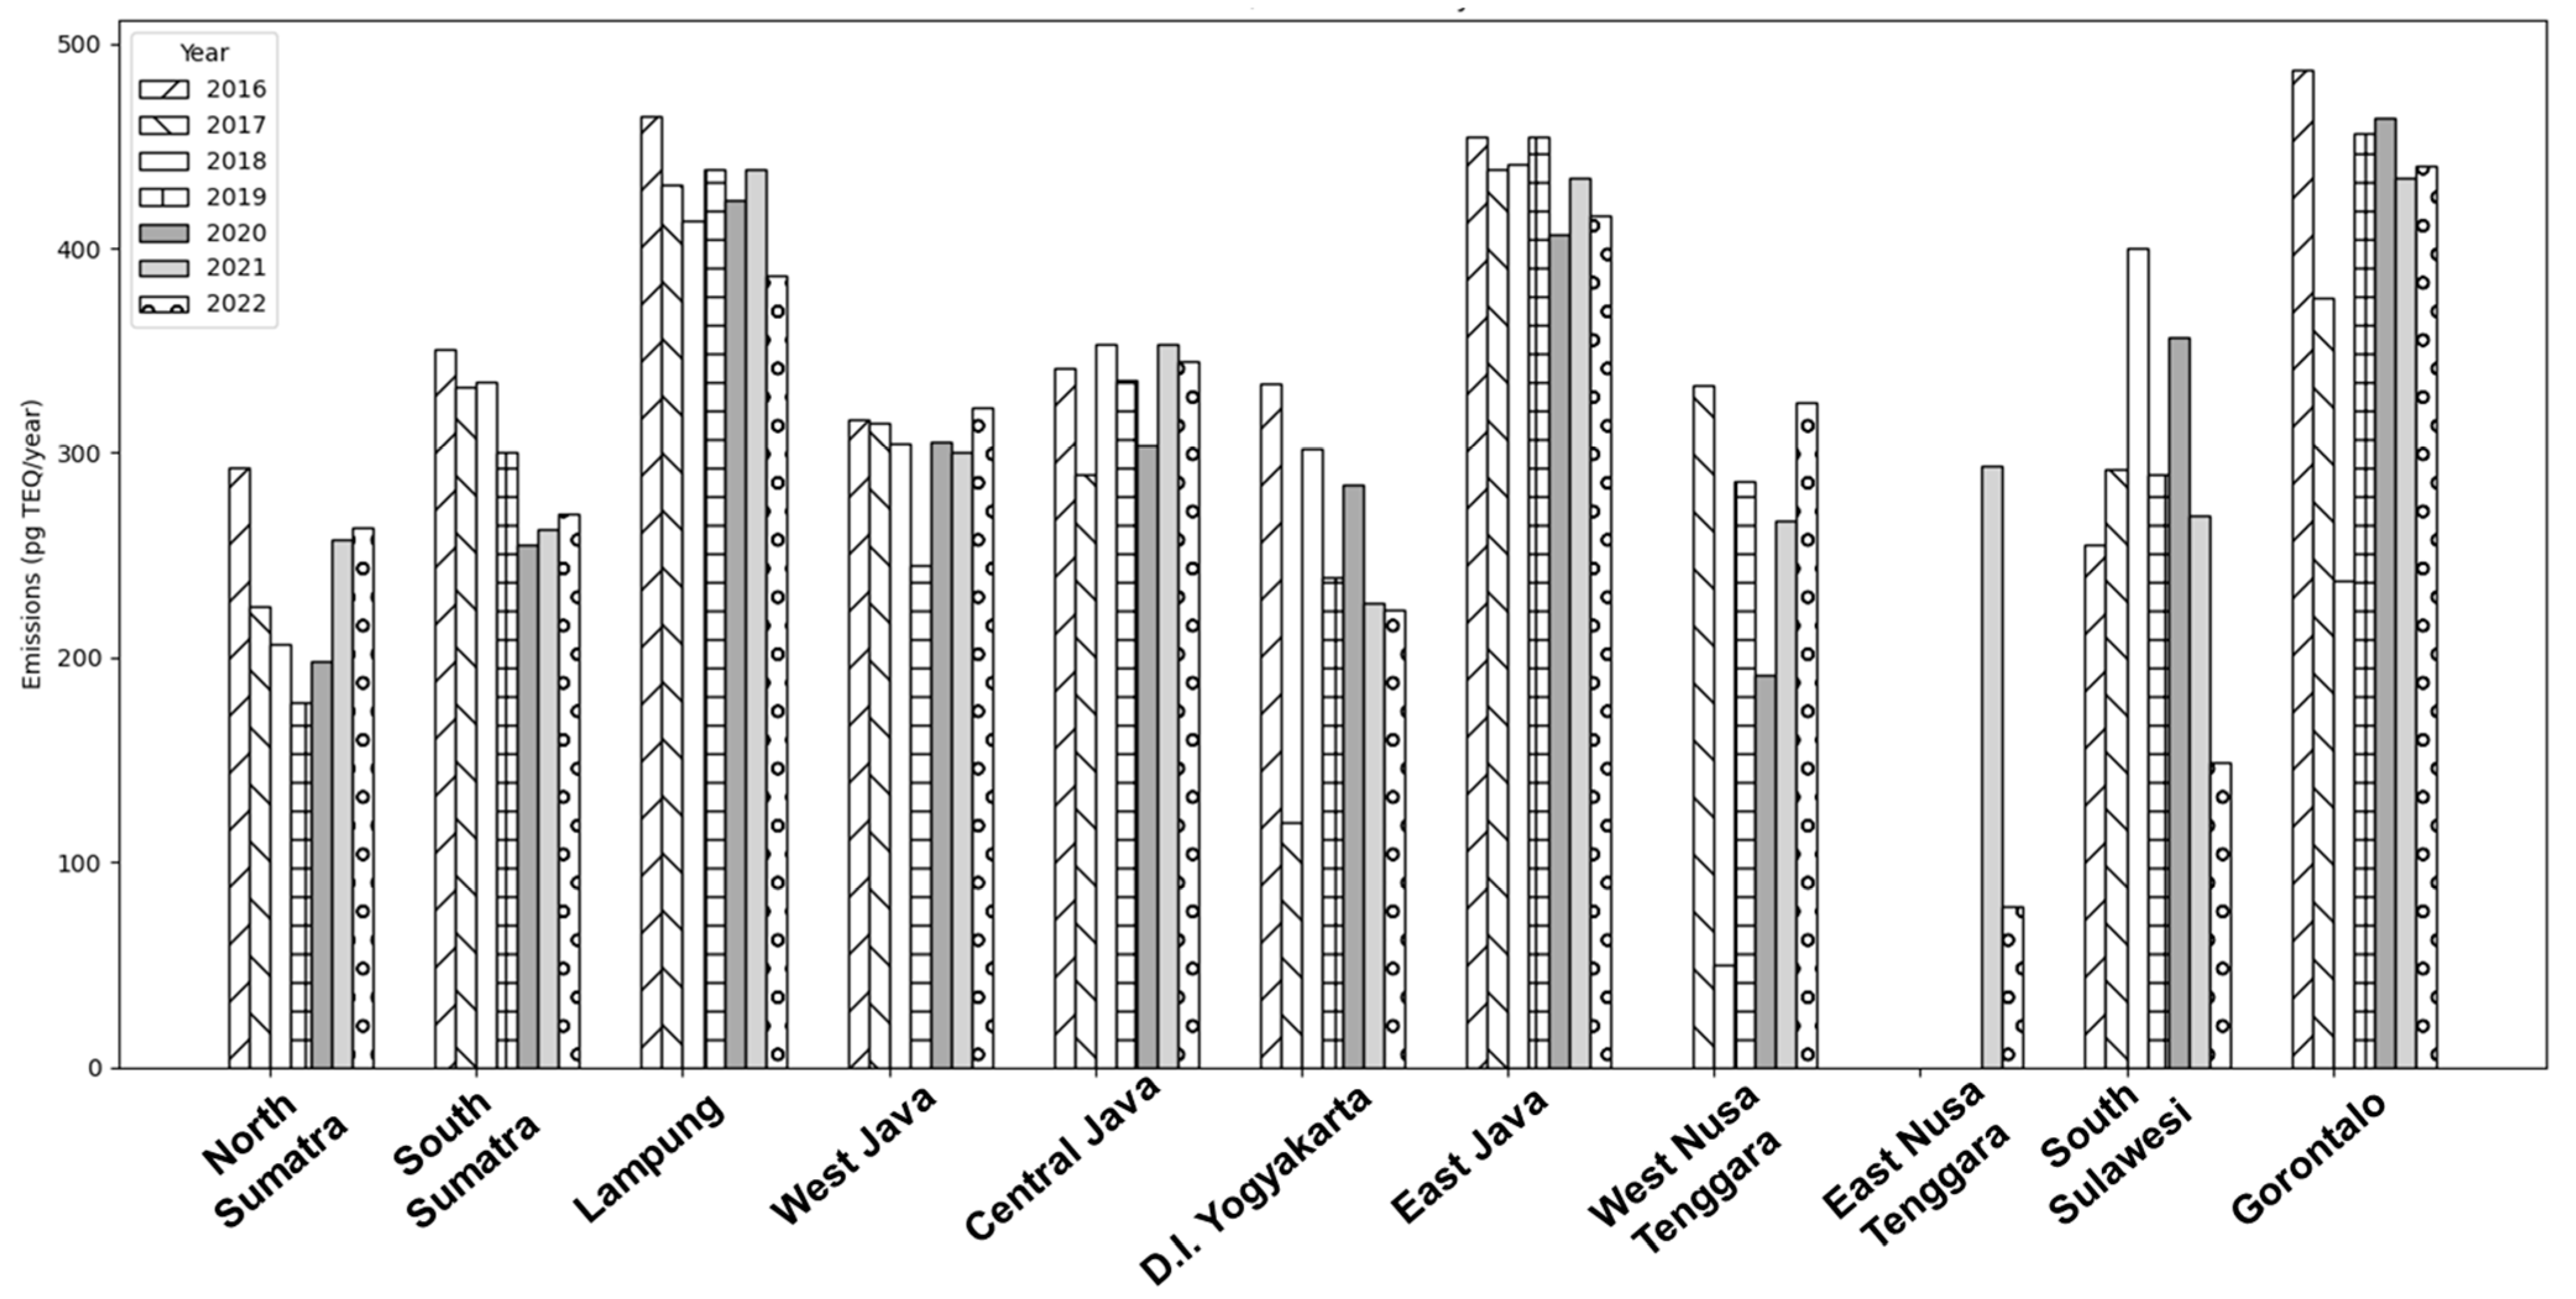
In Figure 3, the trend of PCDD/Fs emissions at provincial level from 2016–2022 indicates that the average dioxin from sugarcane residue burning in Indonesia, at approximately 309 pg TEQ/year, are notably lower compared to the emissions reported from the United States in 2001. In the U.S., states like Florida, Hawaii, Louisiana, and Texas, each reported emission by 37.5 g TEQ/year [9]. Despite the U.S. used smaller emission factors (ranging from 0.017 to 0.025 µg TEQ/kg), factors such as higher combustion efficiency (90%) and a larger proportion of the harvested area being burned (50%) contributed to the increased emissions. Nevertheless, from all sectors, Indonesia is still among the top five countries in terms of PCDD/Fs emissions, releasing between 1.17 and 2.04 kg TEQ across all sectors and media (atmosphere, soil, and water) [41].
In this emissions inventory, several factors may contribute uncertainty: the emission factor, activity rate, and prediction model. Unfortunately, studies on dioxin emission factors are limited in Indonesia and southeast Asia. To address this gap, we compared the emission results using factors from several field simulation studies conducted in the USA [31] and Australia [10]. Table 3 presents a comparison of PCDD/Fs emissions (in picograms per year) from sugarcane open burning in Indonesia, using emission factors derived from these field measurements. This approach allows us to use established and peer-reviewed emission factors to estimate emissions more accurately, despite the regional limitations of direct local studies.
From the table, it is evident that there are significant differences when using different emission factors. Markedly, emissions based on the UNEP factor tend to be higher compared to the other two factors. This is likely due to the more generic nature of the UNEP factor and lack of regional specificity. In contrast, the emission factors from the USA and Australia maybe more accurate for their respective contexts. Conditions during sugarcane burning—such as temperature, moisture content, and combustion efficiency—dioxin formation. Variations in field practices, such as pre-harvest burning versus post-harvest burning, also contribute to these differences. Additionally, sugarcane composition varies globally. Factors like sugarcane variety, soil nutrients, and growth conditions influence its chemical makeup, which in turn lead to differences in dioxin emissions. Concerning activity-related uncertainty, this may also arise from the ratio of produced sugarcane to burning residue. In this study, we assume a uniform residue ratio of 33% [42] across all provinces, which is higher than the ratio observed in India (20%) according to S. Bhuvaneshwari, et al. [43]. However, variations in this ratio are likely due to differences sugarcane varieties and harvest conditions.
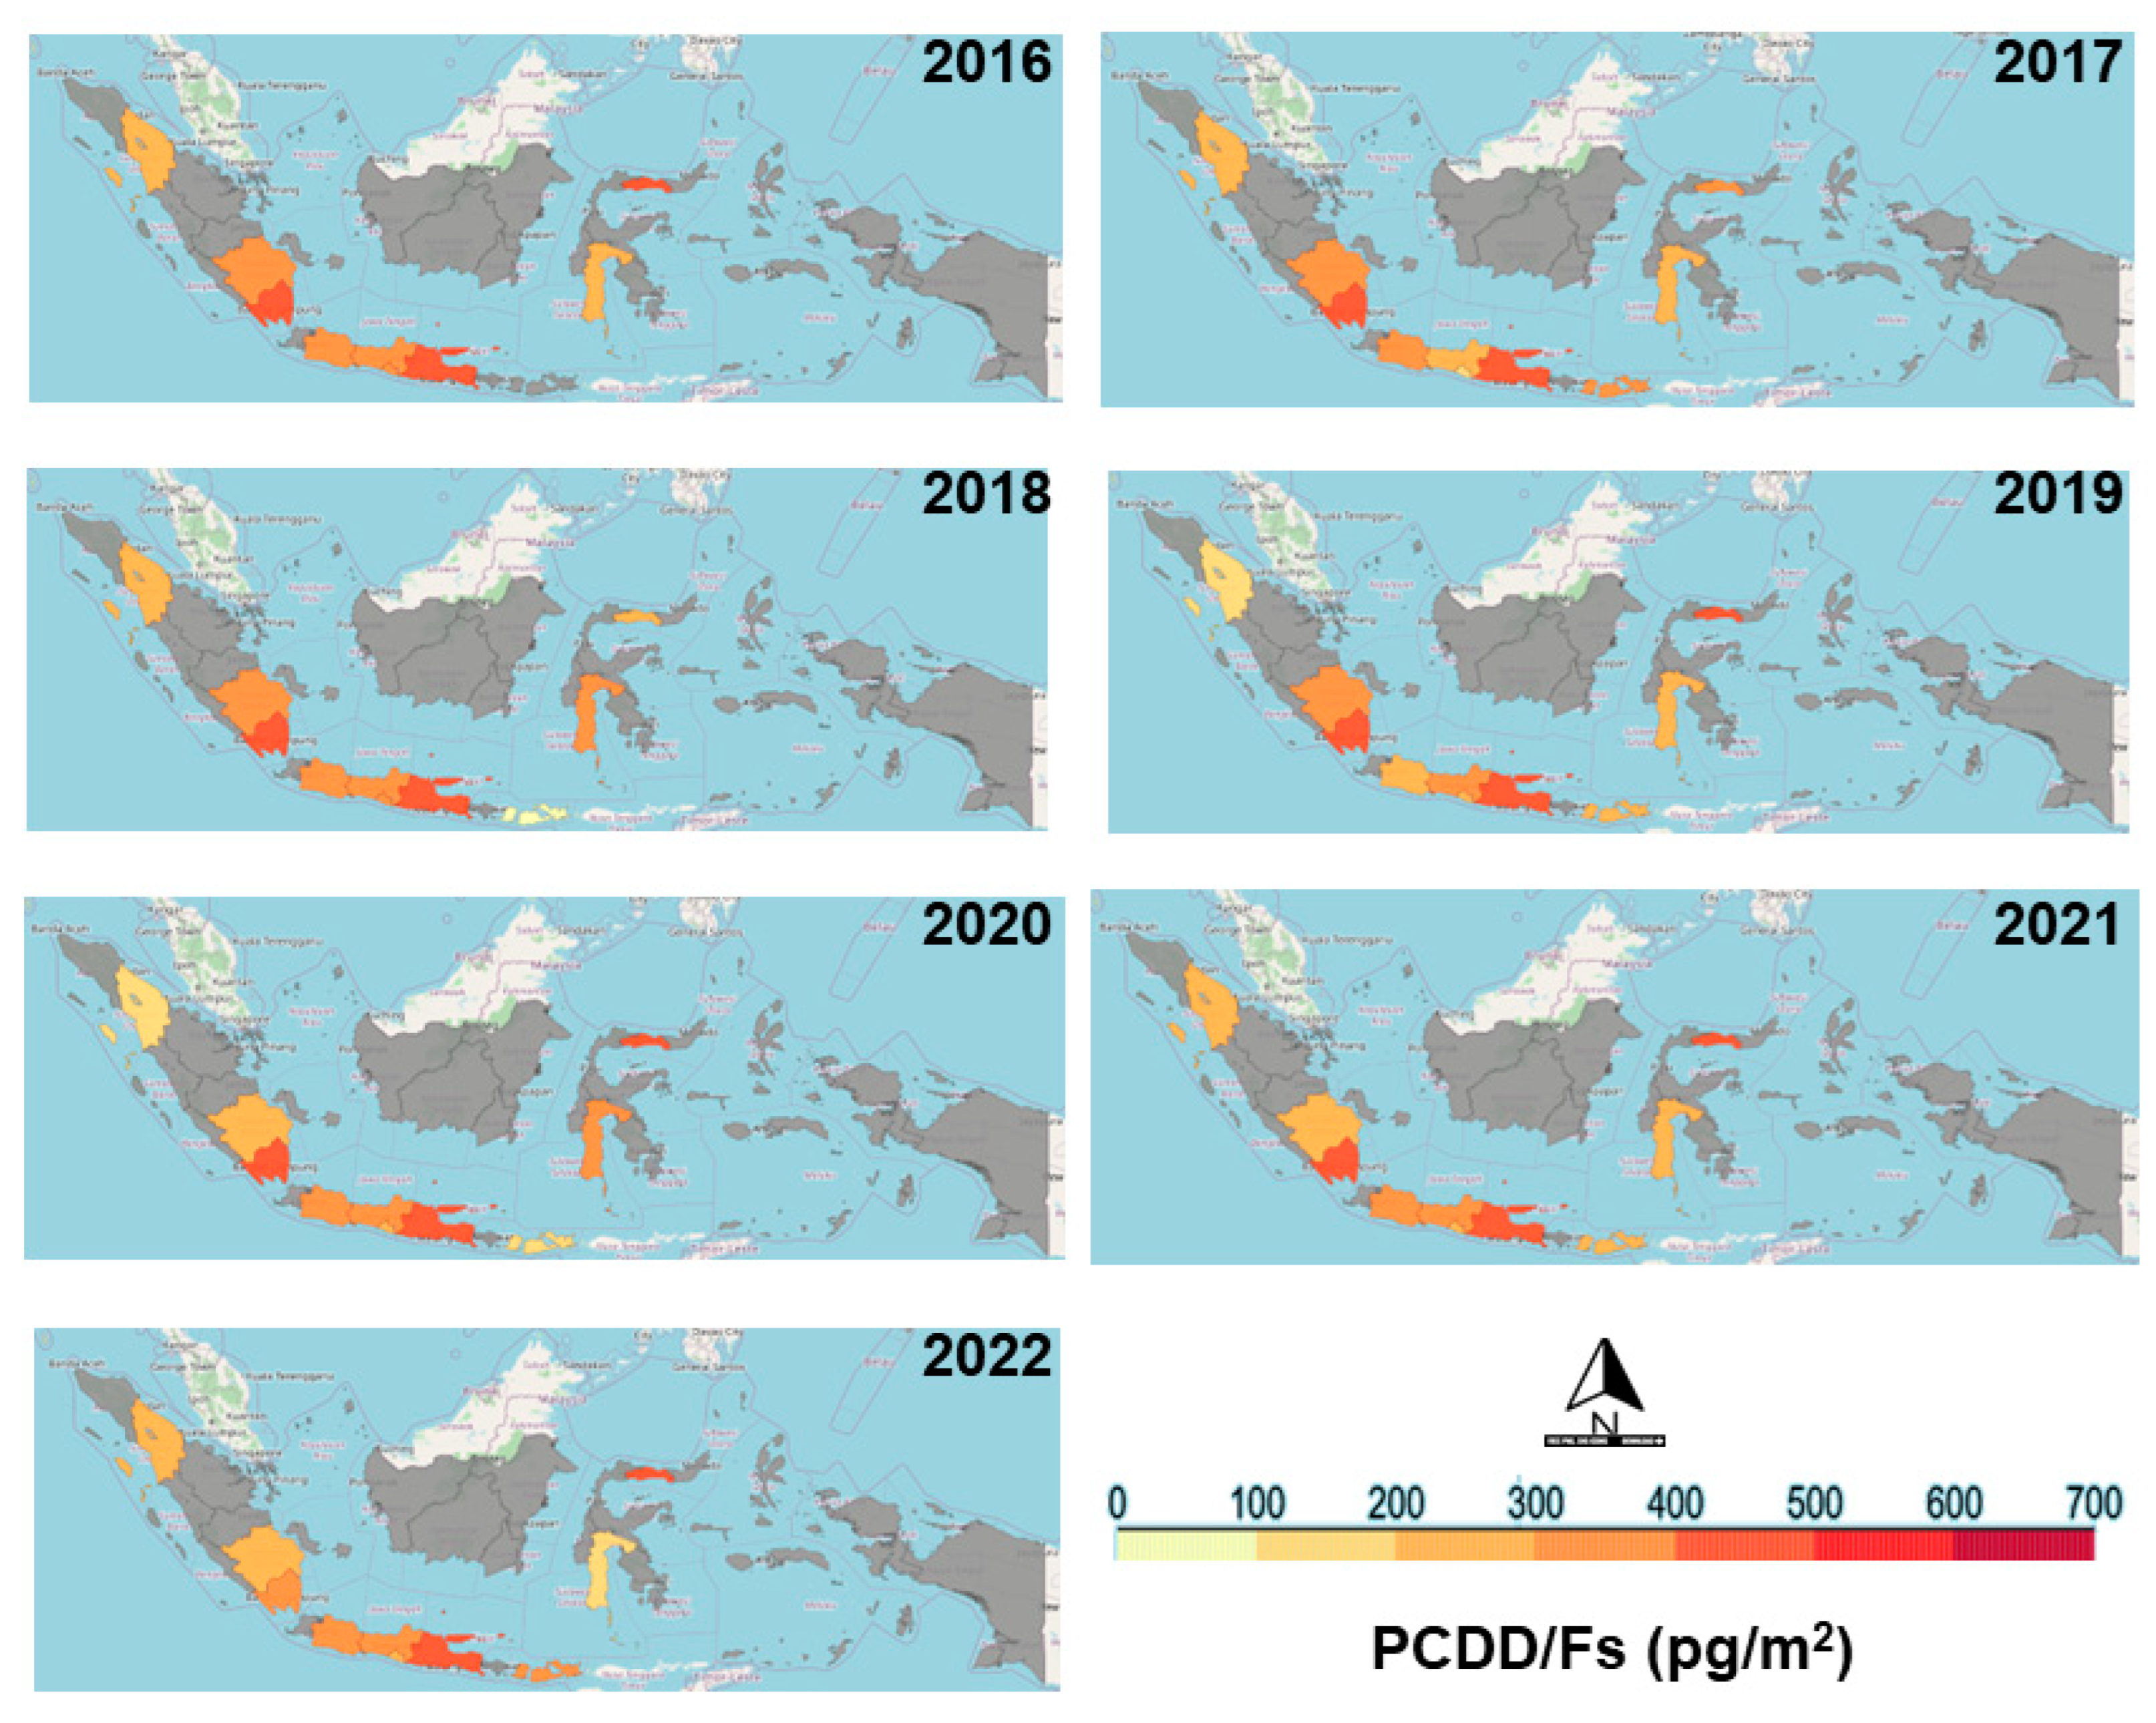
Spatially, certain regions in Indonesia consistently exhibit higher PCDD/Fs emissions. Provinces such as Lampung and South Sumatra, which are known for their extensive sugarcane agriculture, show persistently elevated levels of PCDD/Fs emissions as seen in Figure 4. This trend is likely driven by intensive agricultural activities and the widespread practice of burning crop residue, which releases significant quantities of dioxins. This finding suggests that common practice of burning crop residues is still viewed as a cost-effective method for preparing land for new planting. While such practices may be economically beneficial in the short term [44,45], they release significant amounts of dioxins, which are known for their persistence in the environment and potential to bioaccumulate. High PCDD/Fs emissions are predominantly observed in agricultural regions. For example, Lampung and East Java have consistently shown high emissions, often exceeding 400 pg/m2.
This pattern is influenced by the extensive cultivation and agricultural practices in these regions. In contrast, while East Java and Central Java also engage in substantial sugarcane cultivation, their emission profiles vary, with some regions showing spikes in certain periods followed by reductions. Other regions, like North Sumatra and West Java, consistently exhibit high emission levels, reflecting the spatial distribution of intensive agricultural activities. Meanwhile, emerging regions like Gorontalo, have begun to show increased emissions, reaching higher levels in recent years. This indicates a spatial expansion of high emission areas beyond the traditional agricultural hubs. The spatial distribution maps for 2020 and 2021 reveal continued high emissions in key areas, with some fluctuations. Notably, East Nusa Tenggara exhibited significant emission levels despite fewer data points, suggesting sporadic yet high-intensity emission events. By 2022, there was a noticeable decrease in emission levels across most provinces, except for Gorontalo and parts of East Java, which remained hotspots for PCDD/Fs emissions. However, higher emission intensity over the areas cultivated with sugarcane showed in spatial distributions of annual emissions (0.1° × 0.1°), specifically monthly emissions in the dry season [12]. Yearly trends on the maps also reveal sporadic peaks in emissions in certain years that could be linked to less stringent enforcement of environmental policies or temporary increases in agricultural production demands.
Given that Indonesia contributes 72.81% of the total PCDDs/PCDFs emissions to the air across all inventories in southeast Asia, trends analyse from 2003 to 2019 is crucial [12]. By examining changes over time from 2016 to 2022, we can identify patterns of increasing or decreasing emissions. Furthermore, regions with consistently high emissions emerge as ‘hotspots,’ which may require targeted interventions. Moreover, the broader environmental impact of these emissions cannot be overstated.

3.2. Uncertainty

The result of uncertainty using the Monte Carlo method in mean annual PCDD/F emissions from sugarcane residue burning was consistently low from 2016 to 2022, ranging from 3.636 pg TEQ to 4.485 pg TEQ. However, the standard deviations for these estimates, which varied from 0.972 pg TEQ to 1.230 pg TEQ, were notably high relative to the mean values of uncertainty, underscoring significant uncertainties in the emission inventory. This variability can be attributed to fluctuations in annual sugarcane yield and the extent of harvested areas, affecting the quantity of available biomass for burning. Additionally, variations in combustion efficiency and the specific emission factors, which determine how much PCDD/F is produced per ton of burned material, are critical drivers of the observed variability in the emission estimates. Such variability could be due to several factors. Differences in annual sugarcane yield can cause significant fluctuations in the quantity of available biomass for burning, directly affecting emissions.

3.3. Emission Prediction

Table 4 offers a compelling predicted emission trend from 2023–2028, presenting an upward trend in some areas, while others show fluctuating or stable patterns. The grey model (GM (1,1)) is particularly suited for this, as is often the case with environmental data collected from diverse geographical locations like Indonesia. North Sumatra, a region traditionally intensive in sugarcane cultivation, is predicted to experience a steady increase in PCDD/Fs emissions, unlike South Sumatra and Lampung, which exhibit a slight decline. This trend may be attributed to expanding agricultural activities and possibly stagnant technological advancements in crop residue management. The sustained increase underscores the urgent need for implementing more robust sustainable agricultural practices in these regions. Most regions in Java show a gradual increase in their emission projections, except for East Java, which has slight decline from 416 pg/year in 2023 to 397 pg/year in 2028. These variations could reflect intermittent enforcement of agricultural burning regulations or periodic shifts in agricultural practices. Such data suggest that policy interventions need to be adaptable and responsive to the changing dynamics of agricultural practices in these provinces. West Nusa Tengggara indicates a substantial increase from 296 pg/year in 2023 to 381 pg/year in 2028. East Nusa Tengggara, an area that started to plant sugarcane in 2021, has a gradual decrease. This might be indicating the lack of input data in the grey model that can also be seen from the higher MAPE and MAE. South Sulawesi experiences a significant decline in emissions in all projected years, while Gorontalo, with the highest emissions, is projected to have the highest increase in emissions. The grey model showed varying performance across regions (as shown in Table 4), with certain areas, particularly Java, demonstrating more accurate predictions than others. Factors such as data availability (including the lack of data in East Nusa Tenggara), model complexity, and local characteristics might influence these results.
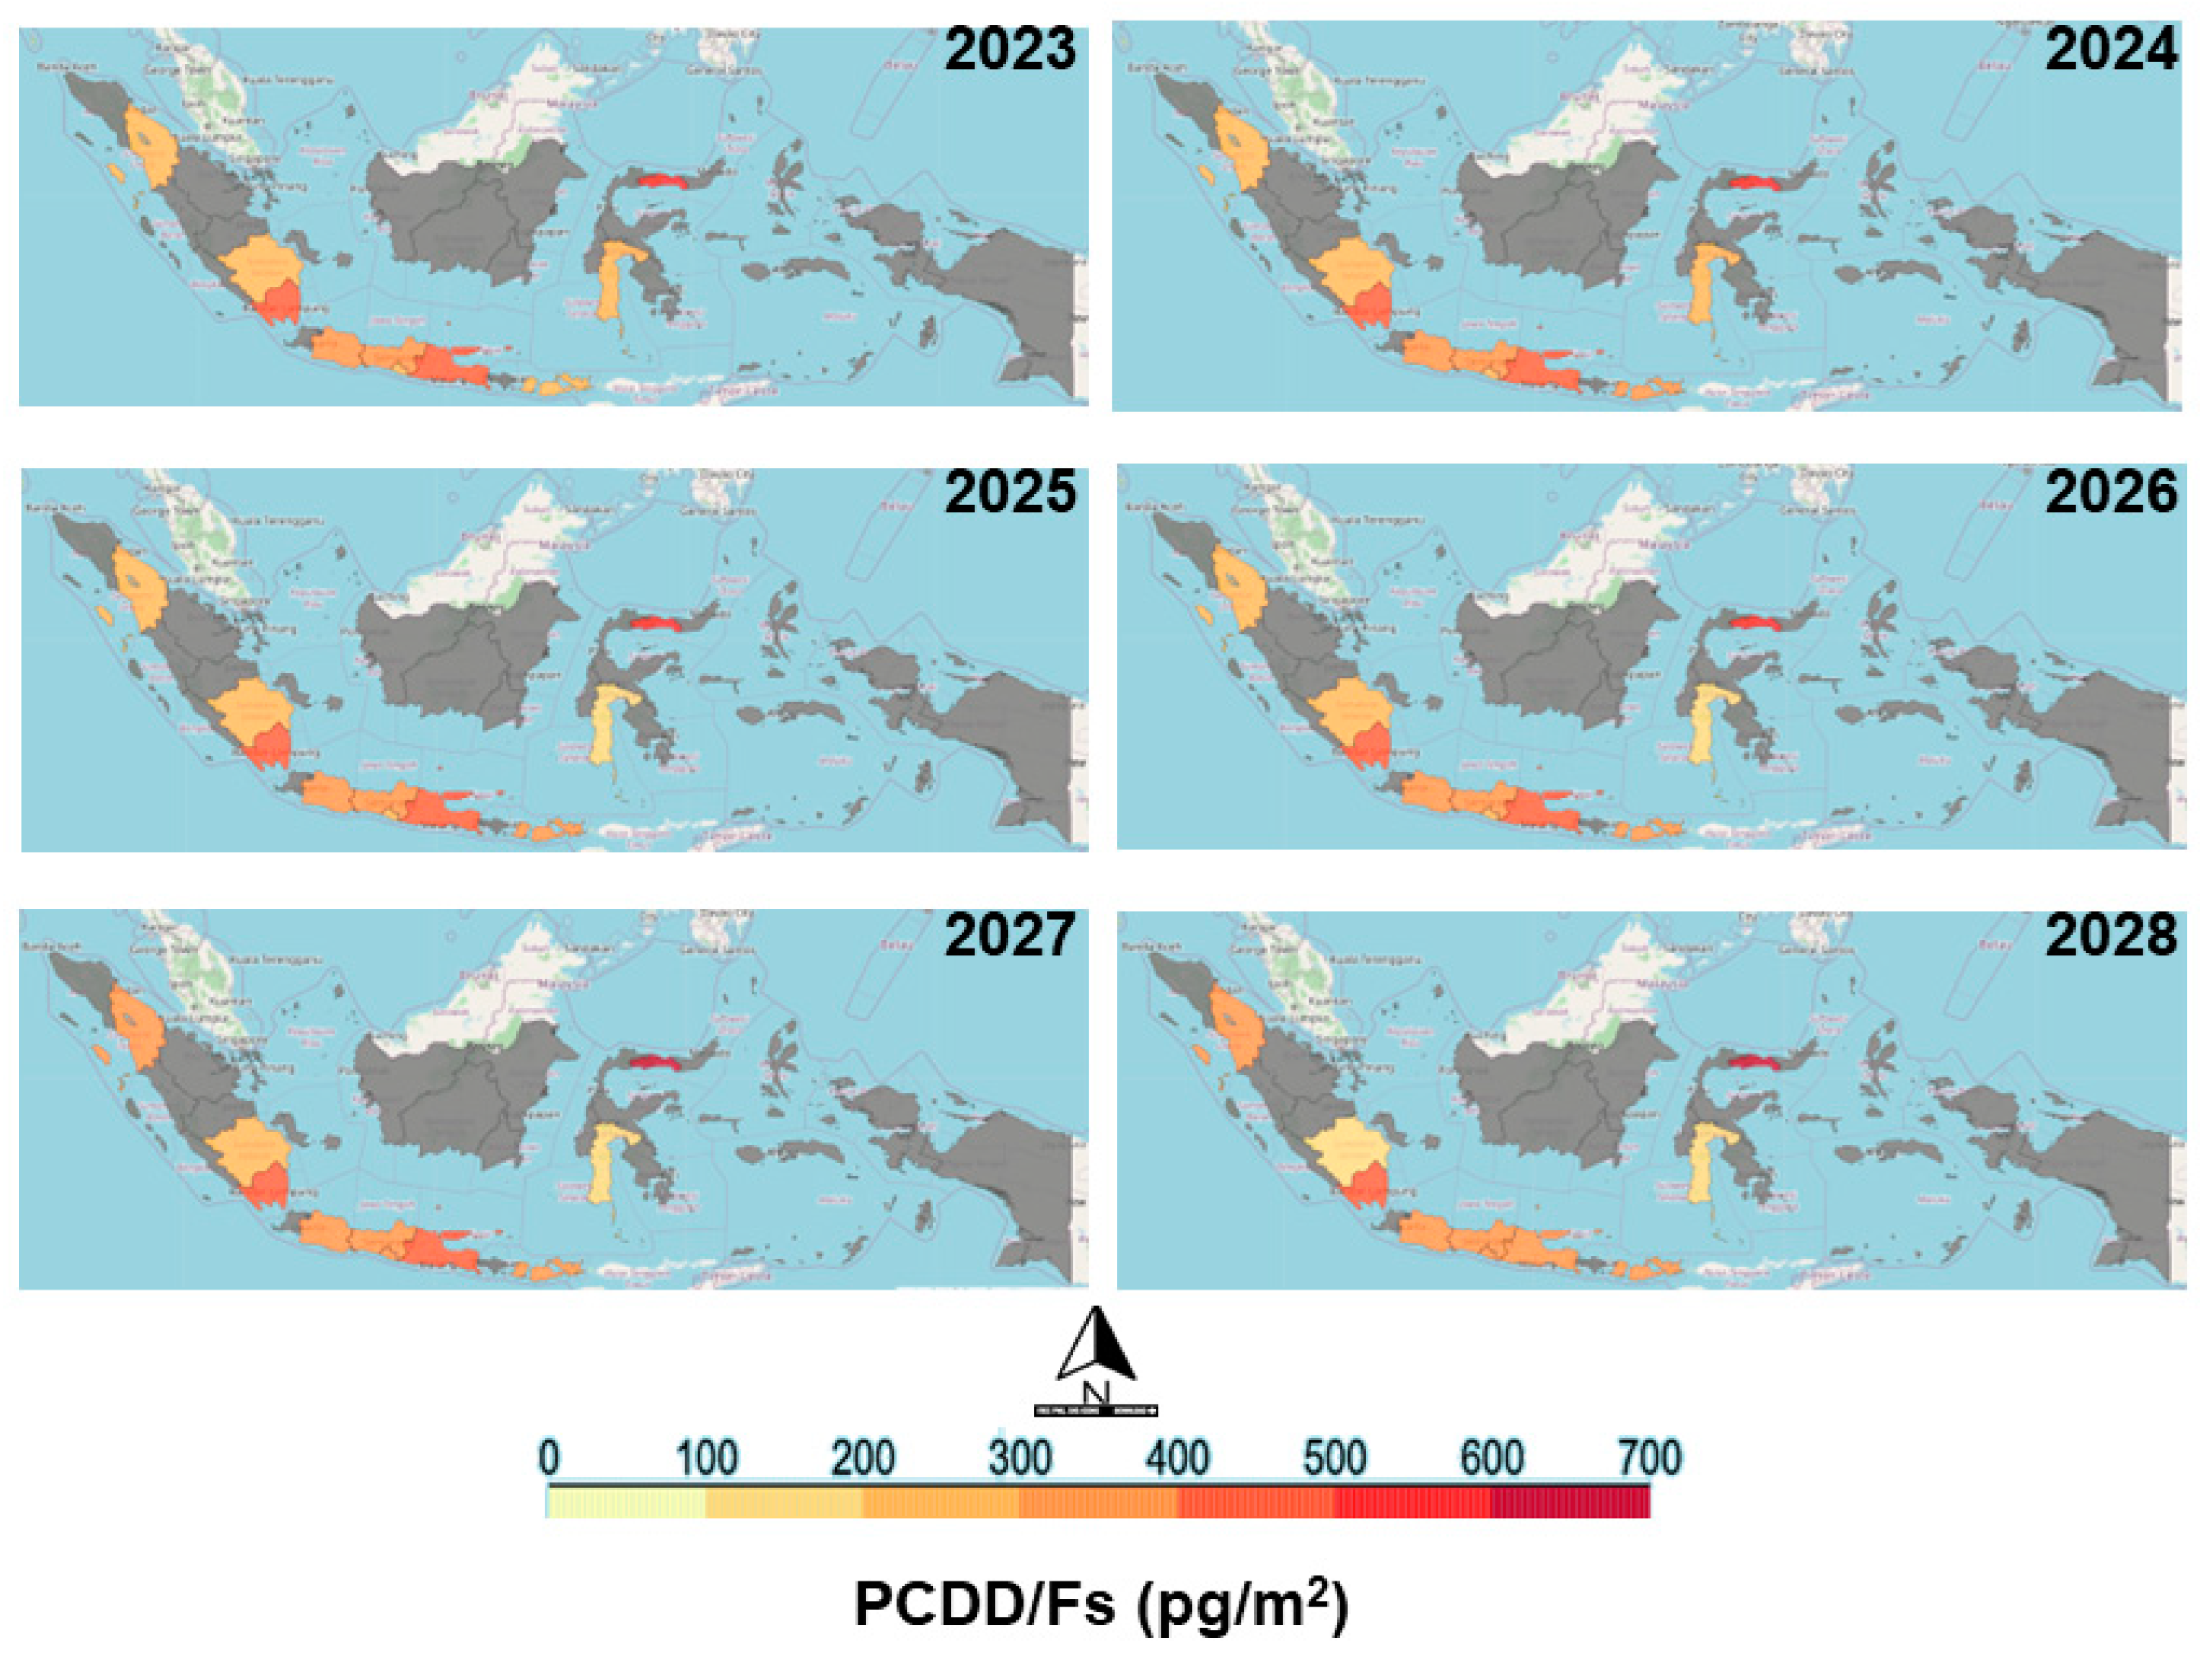
Figure 5 complements these insights by visualizing the spatial distribution of emissions across the provinces, emphasizing the diverse emission trajectories. For example, Gorontalo is predicted to maintain high emissions, marking it as a persistent hotspot. Conversely, regions like South Sulawesi and East Nusa Tenggara exhibit high-emission events despite an overall downward trend, indicating that localized interventions are necessary to effectively mitigate emissions. This variation across provinces highlights the necessity for targeted and adaptable policy interventions to support sustainable sugarcane agriculture and effectively manage PCDD/Fs emissions in Indonesia.
The forecast data provided by the grey model (GM (1,1)) serve as a valuable tool for policymakers and environmental managers in Indonesia. However, model improvements might be necessary. The results of the model’s performance (Table 5) highlight varying degrees of prediction reliability. Regions like East Java and Central Java, which demonstrate exceptional prediction accuracy, could serve as benchmarks for refining the model’s accuracy in other regions with less precise predictions. For example, East Java shows highly precise model predictions with the lowest MAPE of 1.4% and an MAE of 6. In contrast, East Nusa Tenggara, which has only two years of data, and South Sulawesi have the highest MAPE values, at 100% and 83%, respectively, along with substantial MAEs of 186 and 143.
In addition, the accuracy of grey model predictions is shaped by key factors such as data characteristics and environmental conditions. Data fluctuations significantly impact prediction accuracy, particularly in air quality modelling, where variations can lead to an accuracy of around 75% accuracy [46]. Grey models perform well with small datasets, simplifying complexity while maintaining reliability [47]. Additionally, in predicting air pollutant dispersion prediction, weather variables such as temperature, humidity, and wind speed are crucial determinants of pollutant concentrations and are integrated into predictive models to enhance their accuracy, as highlighted in research on semi-parametric autoregression models for air quality prediction [48]. Another study [49] accounts for periodic variations and has been shown to enhance the precision of predictions.
However, it is recommended to develop monthly emissions profiles that reflect local agricultural practices (such as varying harvesting times for different crop types) and seasonal conditions (dry or wet seasons). The emission data generated in this study, which is provided both spatially and temporally, holds significant potential for air quality modelling studies like several studies [50,51]. By leveraging this data, researchers can assess the impact of current and future emissions on ambient air quality.
Air pollution from sugarcane cultivation, especially through field burning, poses considerable health and environmental challenges. Various countries have adopted a range of policies and technical measures to mitigate these impacts, underscoring the importance of a comparative analysis to understand the effectiveness of various approaches. For instance, Brazil has enacted stricter regulations on pre-harvest burning; however economic benefits continue to sustain this practice. Studies show that burning significantly contributes to emissions of CO, PM2.5, and PAHs, highlighting the need for robust policy enforcement and enhanced public awareness campaigns [52]. On the technical front, research from Florida has quantified PM2.5 emissions from sugarcane fires, discovering that these emissions rival those from all state vehicles combined, supporting the argument for advanced monitoring systems and alternative harvesting techniques [53]. Similarly, Mexico has recognized the health hazards posed by PAH emissions from sugarcane burning, prompting calls for improved management practices and the adoption of pollution control technologies [54]. In Indonesia, suggested practices include promoting alternative, cleaner agricultural practices, enhancing the enforcement of environmental regulations, and increasing public awareness. For mitigation, remote sensing and continuous monitoring systems could also be utilized. Although these initiatives are promising, their success varies significantly across different regions, emphasizing the need for region-specific strategies to improve air quality management in sugarcane-producing areas.

4. Conclusions

From 2016 to 2022, the average PCDD/Fs emission values exhibit significant variability among the provinces, prominently. East Java has the highest mean emission value at 435 pg/year and displayed relatively stable emissions with less variability compared to other provinces. On average, emissions of dioxin from sugarcane residue burning in Indonesia amount to approximately 309 pg TEQ per year. Spatially, certain regions in Indonesia consistently exhibit higher PCDD/Fs emissions. Provinces such as Lampung, which has the second highest mean emission, and Gorontalo, remained hotspots for PCDD/Fs emissions. By 2022, there was a noticeable decrease in emission levels across most provinces; however, Gorontalo and parts of East Java remained hotspots for PCDD/Fs emissions. These regions with consistently high emissions emerge as ‘hotspots’, which may require targeted interventions. In terms of uncertainty, emissions based on the UNEP factor tend to be higher compared to the previous studies. The grey model (GM (1,1) forecasts an upward trend in future emissions for certain regions, while others display fluctuating or stable patterns. Notably, Gorontalo, which has the third-highest emissions, is also projected to see the most significant increase. However, local agricultural, including variations in harvest times and seasonal conditions, should be considered to develop more accurate monthly emission profiles. Further research and refinement are crucial to improving our understanding of dioxin emissions in this region. To enhance accuracy and reduce uncertainty in future research, it may be beneficial to use localized emission factors obtained by conducting field studies and collecting combustion conditions based on fuel types and sugarcane varieties. By identifying regions with increasing emission trends, resources can be strategically allocated to develop and implement effective control measures. In response to identified emission hotspots and rising trends in certain regions, this study also emphasizes the need for implementing effective pollution control strategies. Such measures may include promoting alternative, cleaner agricultural practices, enhancing enforcement of environmental regulations, and increasing public awareness about the health risks associated with open burning. Moreover, integrating advanced technologies such as remote sensing and continuous monitoring systems could significantly aid in managing and mitigating the impacts of these emissions. The adoption of these interventions is crucial to reducing the environmental and health burdens posed by PCDD/F emissions in Indonesia.

Supplementary Materials

The following supporting information can be downloaded at: https://www.mdpi.com/article/10.3390/atmos15091078/s1, Table S1: Sugarcane area and production 2016–2022; Table S2: Activity Rate in Sugarcane Crop Residue Burning in 2016–2022.

Author Contributions

Methodology, L.S.; Validation, Y.-C.W. and L.-C.W.; Formal analysis, L.-C.W.; Data curation, L.S.; Writing—original draft, L.S.; Visualization, L.S.; Supervision, Y.-C.W. and L.-C.W.; Funding acquisition, L.-C.W. All authors have read and agreed to the published version of the manuscript.

Funding

This research was funded by NSTC (National Science and Technology Council) Taiwan, R.O.C with grant number 111-2221-E-992-092-MY2.

Informed Consent Statement

Not applicable.

Data Availability Statement

Data is contained within the article or supplementary material.

Conflicts of Interest

The authors declare no conflict of interest.

References

  1. Directorate of Food Crops, Horticulture, and Estate Crops Statistics. Indonesia—Sugar Cane Production Quantity. Available online: https://knoema.com/atlas/Indonesia/topics/Agriculture/Crops-Production-Quantity-tonnes/Sugar-cane-production (accessed on 1 July 2024).
  2. Aquino, G.S.; Medina, C.C.; Cunha, A.C.B.; Kussaba, D.A.O.; Moreira, A. Vegetative Waste Management on Sugarcane Yield and Industrial Quality. Commun. Soil Sci. Plant Anal. 2019, 50, 132–140. [Google Scholar] [CrossRef]
  3. Souza, G.S.d.; Souza, Z.M.d.; Silva, R.B.d.; Barbosa, R.S.; Araújo, F.S. Effects of traffic control on the soil physical quality and the cultivation of sugarcane. Rev. Bras. Ciência Solo 2014, 38, 135–146. [Google Scholar] [CrossRef]
  4. Riajaya, P.D.; Djumali, D.; Heliyanto, B. Yields of Promising Sugarcane Clones under Three Different Planting Arrangements. AGRIVITA J. Agric. Sci. 2022, 44, 119–129. [Google Scholar] [CrossRef]
  5. Gupta, S.K.; Kohli, A.; Choudhury, S.R.; Dutta, S.K.; Pathak, S.K.; Sohane, R.K.; Sharma, R.P. Impact of Open Crop Residue Burning and Alternate Options for Mitigation: A Review. Curr. J. Appl. Sci. Technol. 2019, 37, 1–10. [Google Scholar] [CrossRef]
  6. Nowell, H.K.; Wirks, C.; Val Martin, M.; van Donkelaar, A.; Martin, R.V.; Uejio, C.K.; Holmes, C.D. Impacts of Sugarcane Fires on Air Quality and Public Health in South Florida. Environ. Health Perspect. 2022, 130, 087004. [Google Scholar] [CrossRef] [PubMed]
  7. Tavares, R.L.M.; Spokas, K.; Hall, K.; Colosky, E.; Souza, Z.M.D.; Scala, N.L. Sugarcane residue management impact soil greenhouse gas. Ciência Agrotecnologia 2018, 42, 195–203. [Google Scholar] [CrossRef]
  8. Shikwambana, L.; Ncipha, X.; Sangeetha, S.; Sivakumar, V.; Mhangara, P. Qualitative study on the observations of emissions, transport, and the influence of climatic factors from sugarcane burning: A south african perspective. Int. J. Environ. Res. Public Health 2021, 18, 7672. [Google Scholar] [CrossRef]
  9. Gullett, B.K.; Touati, A.; Huwe, J.; Hakk, H. PCDD and PCDF emissions from simulated sugarcane field burning. Environ. Sci. Technol. 2006, 40, 6228–6234. [Google Scholar] [CrossRef]
  10. Meyer, C.; Beer, T.; Müller, J.; Gillett, R.; Weeks, I.; Powell, J.; Tolhurst, K.; McCaw, L.; Cook, G.; Marney; et al. Dioxin Emissions from Bushfires in Australia; National Dioxins Program Technical Report No. 1; Australian Government: Canberra, Australia, 2004.
  11. Zain, S.M.S.M.; Latif, M.T.; Baharudin, N.H.; Anual, Z.F.; Hanif, N.M.; Khan, M.F. Atmospheric pcdds/pcdfs levels and occurrences in southeast asia: A review. Sci. Total Environ. 2021, 783, 146929. [Google Scholar] [CrossRef]
  12. Oanh, N.T.K.; Permadi, D.A.; Hopke, P.K.; Smith, K.R.; Dong, N.P.; Dang, A.N. Annual emissions of air toxics emitted from crop residue open burning in Southeast Asia over the period of 2010–2015. Atmos. Environ. 2018, 187, 163–173. [Google Scholar] [CrossRef]
  13. U.S. Environmental Protection Agency (EPA). Update to an Inventory of Sources and Environmental Releases of Dioxin-Like Compounds in the United States for the Years 1987, 1995, and 2000 (2013, External Review Draft); U.S. Environmental Protection Agency: Washington, DC, USA, 2013.
  14. Dwyer, H.; Themelis, N.J. Inventory of U.S. 2012 dioxin emissions to atmosphere. Waste Manag. 2015, 46, 242–246. [Google Scholar] [CrossRef] [PubMed]
  15. Relvas, H.; Lopes, M.; Coutinho, M. Portuguese inventory of dioxins and furans atmospheric emissions. Chemosphere 2015, 93, 1569–1577. [Google Scholar] [CrossRef] [PubMed]
  16. Chen, P.; Gong, W.; Yu, G.; Fiedler, H. Preliminary release inventories of unintentionally generated dl-PCB and HCB from sources in China: Base year 2015. Chemosphere 2019, 219, 875–881. [Google Scholar] [CrossRef] [PubMed]
  17. Zhang, M.; Buekens, A.; Li, X. Dioxins from Biomass Combustion: An Overview. Waste Biomass Valorization 2017, 8, 1–20. [Google Scholar] [CrossRef]
  18. Sornpoon, W.; Bonnet, S.; Kasemsap, P.; Prasertsak, P.; Garivait, S. Estimation of emissions from sugarcane field burning in thailand using bottom-up country-specific activity data. Atmosphere 2014, 5, 669–685. [Google Scholar] [CrossRef]
  19. Pan, S.Y.; Liou, Y.T.; Chang, M.B.; Chou, C.C.K.; Ngo, T.H.; Chi, K.H. Characteristics of PCDD/Fs in PM2.5 from emission stacks and the nearby ambient air in Taiwan. Sci. Rep. 2021, 11, 8093. [Google Scholar] [CrossRef]
  20. Marinković, N.; Pašalić, D.; Ferenčak, G.; Gršković, B.; Rukavina, A. Dioxins and Human Toxicity. Arch. Ind. Hyg. Toxicol. 2010, 61, 445–453. [Google Scholar] [CrossRef]
  21. Du, C.; Kulay, L.; Cavalett, O.; Dias, L.; Freire, F. Life cycle assessment addressing health effects of particulate matter of mechanical versus manual sugarcane harvesting in brazil. Int. J. Life Cycle Assess. 2017, 23, 787–799. [Google Scholar] [CrossRef]
  22. Xie, Q. Gray Prediction. In Application of Gray System Theory in Fishery Science; Springer: Singapore, 2023; pp. 115–163. [Google Scholar]
  23. Hsin, Y.-C.; Chen, Y.-L. Linear Properties and Applications of Grey Prediction Models. J. Grey Syst. 2016, 28, 53–65. [Google Scholar]
  24. Li, X.; Zhang, H. Improved GM(1,1) Model Based on Simpson Formula and Its Applications. J. Grey Syst. 2018, 31, 33–46. [Google Scholar]
  25. Zhao, Y.; Li, H. Research on Data Analysis Method Based on Multiple Linear Regression Model and Grey Model. In Proceedings of the 10th International Conference on Information Systems and Computing Technology (ISCTech), Guilin, China, 28–30 December 2022; pp. 324–327. [Google Scholar]
  26. Ming-Quan, L. Research on the Application of Grey Modeling Theory in the Prediction of Future Epidemic Trend of Infectious Diseases. Eur. J. Prev. Med. 2023, 11, 11–15. [Google Scholar] [CrossRef]
  27. Hamzaçebi, Ç.; Karakurt, İ. Forecasting the energy-related co2emissions of turkey using a grey prediction model. Energy Sources Part A Recovery Util. Environ. Eff. 2015, 37, 1023–1031. [Google Scholar] [CrossRef]
  28. Dai, S.; Niu, D.; Han, Y. Forecasting of energy-related CO2 emissions in china based on gm(1,1) and least squares support vector machine optimized by modified shuffled frog leaping algorithm for sustainability. Sustainability 2018, 10, 958. [Google Scholar] [CrossRef]
  29. Zhu, P.; Xie, W.; Shi, Y.; Pang, M.; Shi, Y. Forecasting CO2 Emissions Using A Novel Conformable Fractional Order Discrete Grey Model. Res. Sq. 2021. [Google Scholar] [CrossRef]
  30. Chang, C.J.; Li, G.; Zhang, S.Q.; Yu, K.P. Employing a fuzzy-based grey modeling procedure to forecast china’s sulfur dioxide emissions. Int. J. Environ. Res. Public Health 2019, 16, 2504. [Google Scholar] [CrossRef] [PubMed]
  31. Black, R.R.; Meyer, C.P.; Touati, A.; Gullett, B.K.; Fiedler, H.; Mueller, J.F. Emissions of PCDD and PCDF from combustion of forest fuels and sugarcane: A comparison between field measurements and simulations in a laboratory burn facility. Chemosphere 2011, 83, 1331–1338. [Google Scholar] [CrossRef]
  32. UNEP. UNEP: Toolkit for Identification and Quantification of Releases of Dioxins, Furans and Other Unintentional POPs under Article 5 of the Stockholm Convention; UNEP: Nairobi, Kenya, 2012. [Google Scholar]
  33. Directorate of Food Crops, Horticulture, and Estate Crops Statistics. Indonesian Sugar Cane Statistics 2016; Badan Pusat Statistik Indonesia: Jakarta, Indonesia, 2016.
  34. MoA. Tree Crop Estate Statistics of Indonesia 2018–2020; Secretariate of Directorate General of Estates: Jakarta, Indonesia, 2019.
  35. Directorate of Food Crops, Horticulture, and Estate Crops Statistics. Indonesian Sugar Cane Statistics 2017; Badan Pusat Statistik Indonesia: Jakarta, Indonesia, 2017.
  36. Directorate of Food Crops, Horticulture, and Estate Crops Statistics. Indonesian Sugar Cane Statistics 2021; Badan Pusat Statistik Indonesia: Jakarta, Indonesia, 2021.
  37. Sulaiman, A.A.; Sulaeman, Y.; Mustikasari, N.; Nursyamsi, D.; Syakir, A.M. Increasing sugar production in indonesia through land suitability analysis and sugar mill restructuring. Land 2019, 8, 61. [Google Scholar] [CrossRef]
  38. Milojković, J.; Litovski, V. ANN versus Grey theory based forecasting methods implemented on short time series. In Proceedings of the 10th Symposium on Neural Network Applications in Electrical Engineering, Belgrade, Serbia, 23–25 September 2010; pp. 117–122. [Google Scholar]
  39. Tan, X.; Xu, J.; Li, F.; Wu, M.; Chen, D.; Liang, Y. A new gm (1,1) model suitable for short-term prediction of satellite clock bias. IET Radar Sonar Navig. 2022, 16, 2040–2052. [Google Scholar] [CrossRef]
  40. Spaunhorst, D.J.; Orgeron, A.J.; White, P.M. Burning postharvest sugarcane residue for control of surface-deposited divine nightshade (Solanum nigrescens) and itchgrass (Rottboellia cochinchinensis) seed. Weed Technol. 2019, 33, 693–700. [Google Scholar] [CrossRef]
  41. Song, S.; Chen, K.; Huang, T.; Ma, J.; Wang, J.; Mao, X.; Gao, H.; Zhao, Y.; Zhou, Z. New emission inventory reveals termination of global dioxin declining trend. J. Hazard. Mater. 2023, 443, 130357. [Google Scholar] [CrossRef]
  42. Sugandi, W.K.; Suastawa, I.N.; Wiyono, J. The Sugar Cane Plantation Of Land Condition After Harvesting And Mechanics And Physical Characteristics. J. Agric. Eng. 2018, 3, 133–140. [Google Scholar] [CrossRef]
  43. Bhuvaneshwari, S.; Hettiarachchi, H.; Meegoda, J.N. Crop Residue Burning in India: Policy Challenges and Potential Solutions. Int. J. Environ. Res. Public Health 2019, 16, 832. [Google Scholar] [CrossRef] [PubMed]
  44. Haider, M.Z. Benefit of rice residue burning in the field. Int. J. Agric. Environ. Biotechnol. 2013, 6, 145–155. [Google Scholar]
  45. Yu, K.-B.; Lee, B.-T.; Han, K.-M.; Kim, H.-S.; Yim, H.-M.; Song, M.-K.; Bae, M.-S. Estimation of Fuel Loadings of Domestic Agricultural Crop Residues to Determine the Air Pollutants Emissions. J. Korean Soc. Atmos. Environ. 2022, 38, 451–469. [Google Scholar] [CrossRef]
  46. Wenting, L.; Xuedong, G.; Hao, L. Air Quality Prediction Model Based on Grey Interval. In Proceedings of the 2022 IEEE 25th International Conference on Computer Supported Cooperative Work in Design (CSCWD), Hangzhou, China, 4–6 May 2022; pp. 553–558. [Google Scholar]
  47. Lao, T.; Chen, X.; Zhu, J. The Optimized Multivariate Grey Prediction Model Based on Dynamic Background Value and Its Application. Complexity 2021, 2021, 1–13. [Google Scholar] [CrossRef]
  48. Wang, Z.; Wang, J. A Semi Parametric Autoregression Model for Predicting Air Quality. In Proceedings of the 2022 19th International Computer Conference on Wavelet Active Media Technology and Information Processing (ICCWAMTIP), Chengdu, China, 16–18 December 2022. [Google Scholar]
  49. Xiaoyue, Z.; Yaoguo, D.; Song, D. Forecasting air quality in China using novel self-adaptive seasonal grey forecasting models. Grey Syst. Theory Appl. 2021, 11, 596–618. [Google Scholar] [CrossRef]
  50. Matthias, V.; Arndt, J.; Aulinger, A.; Bieser, J.; Quante, M. Modelling the Temporal and Spatial Allocation of Emission Data; Springer: Cham, Switzerland, 2018; pp. 193–198. [Google Scholar]
  51. Plejdrup, M.S.; Nielsen, O.K.; Bruun, H.G. Influence of improved methodology and increased spatial resolution on gridded emissions. Int. J. Environ. Impacts 2019, 2, 161–173. [Google Scholar] [CrossRef]
  52. Rangel, M.G.L.; Henríquez, J.R.; Costa, J.A.; de Lira Junior, J.C. An assessment of dispersing pollutants from the pre-harvest burning of sugarcane in rural areas in the northeast of Brazil. Atmos. Environ. 2018, 178, 265–281. [Google Scholar] [CrossRef]
  53. Adegboye, O. Field Burning Fallout: Quantifying PM2.5 Emissions from Sugarcane Fires. Environ. Health Perspect. 2022, 130, 084003. [Google Scholar] [CrossRef]
  54. Mugica-Alvarez, V.; Santiago-de la Rosa, N.; Figueroa-Lara, J.; Flores-Rodríguez, J.; Torres-Rodríguez, M.; Magaña-Reyes, M. Emissions of PAHs derived from sugarcane burning and processing in Chiapas and Morelos México. Sci. Total Environ. 2015, 527, 474–482. [Google Scholar] [CrossRef]
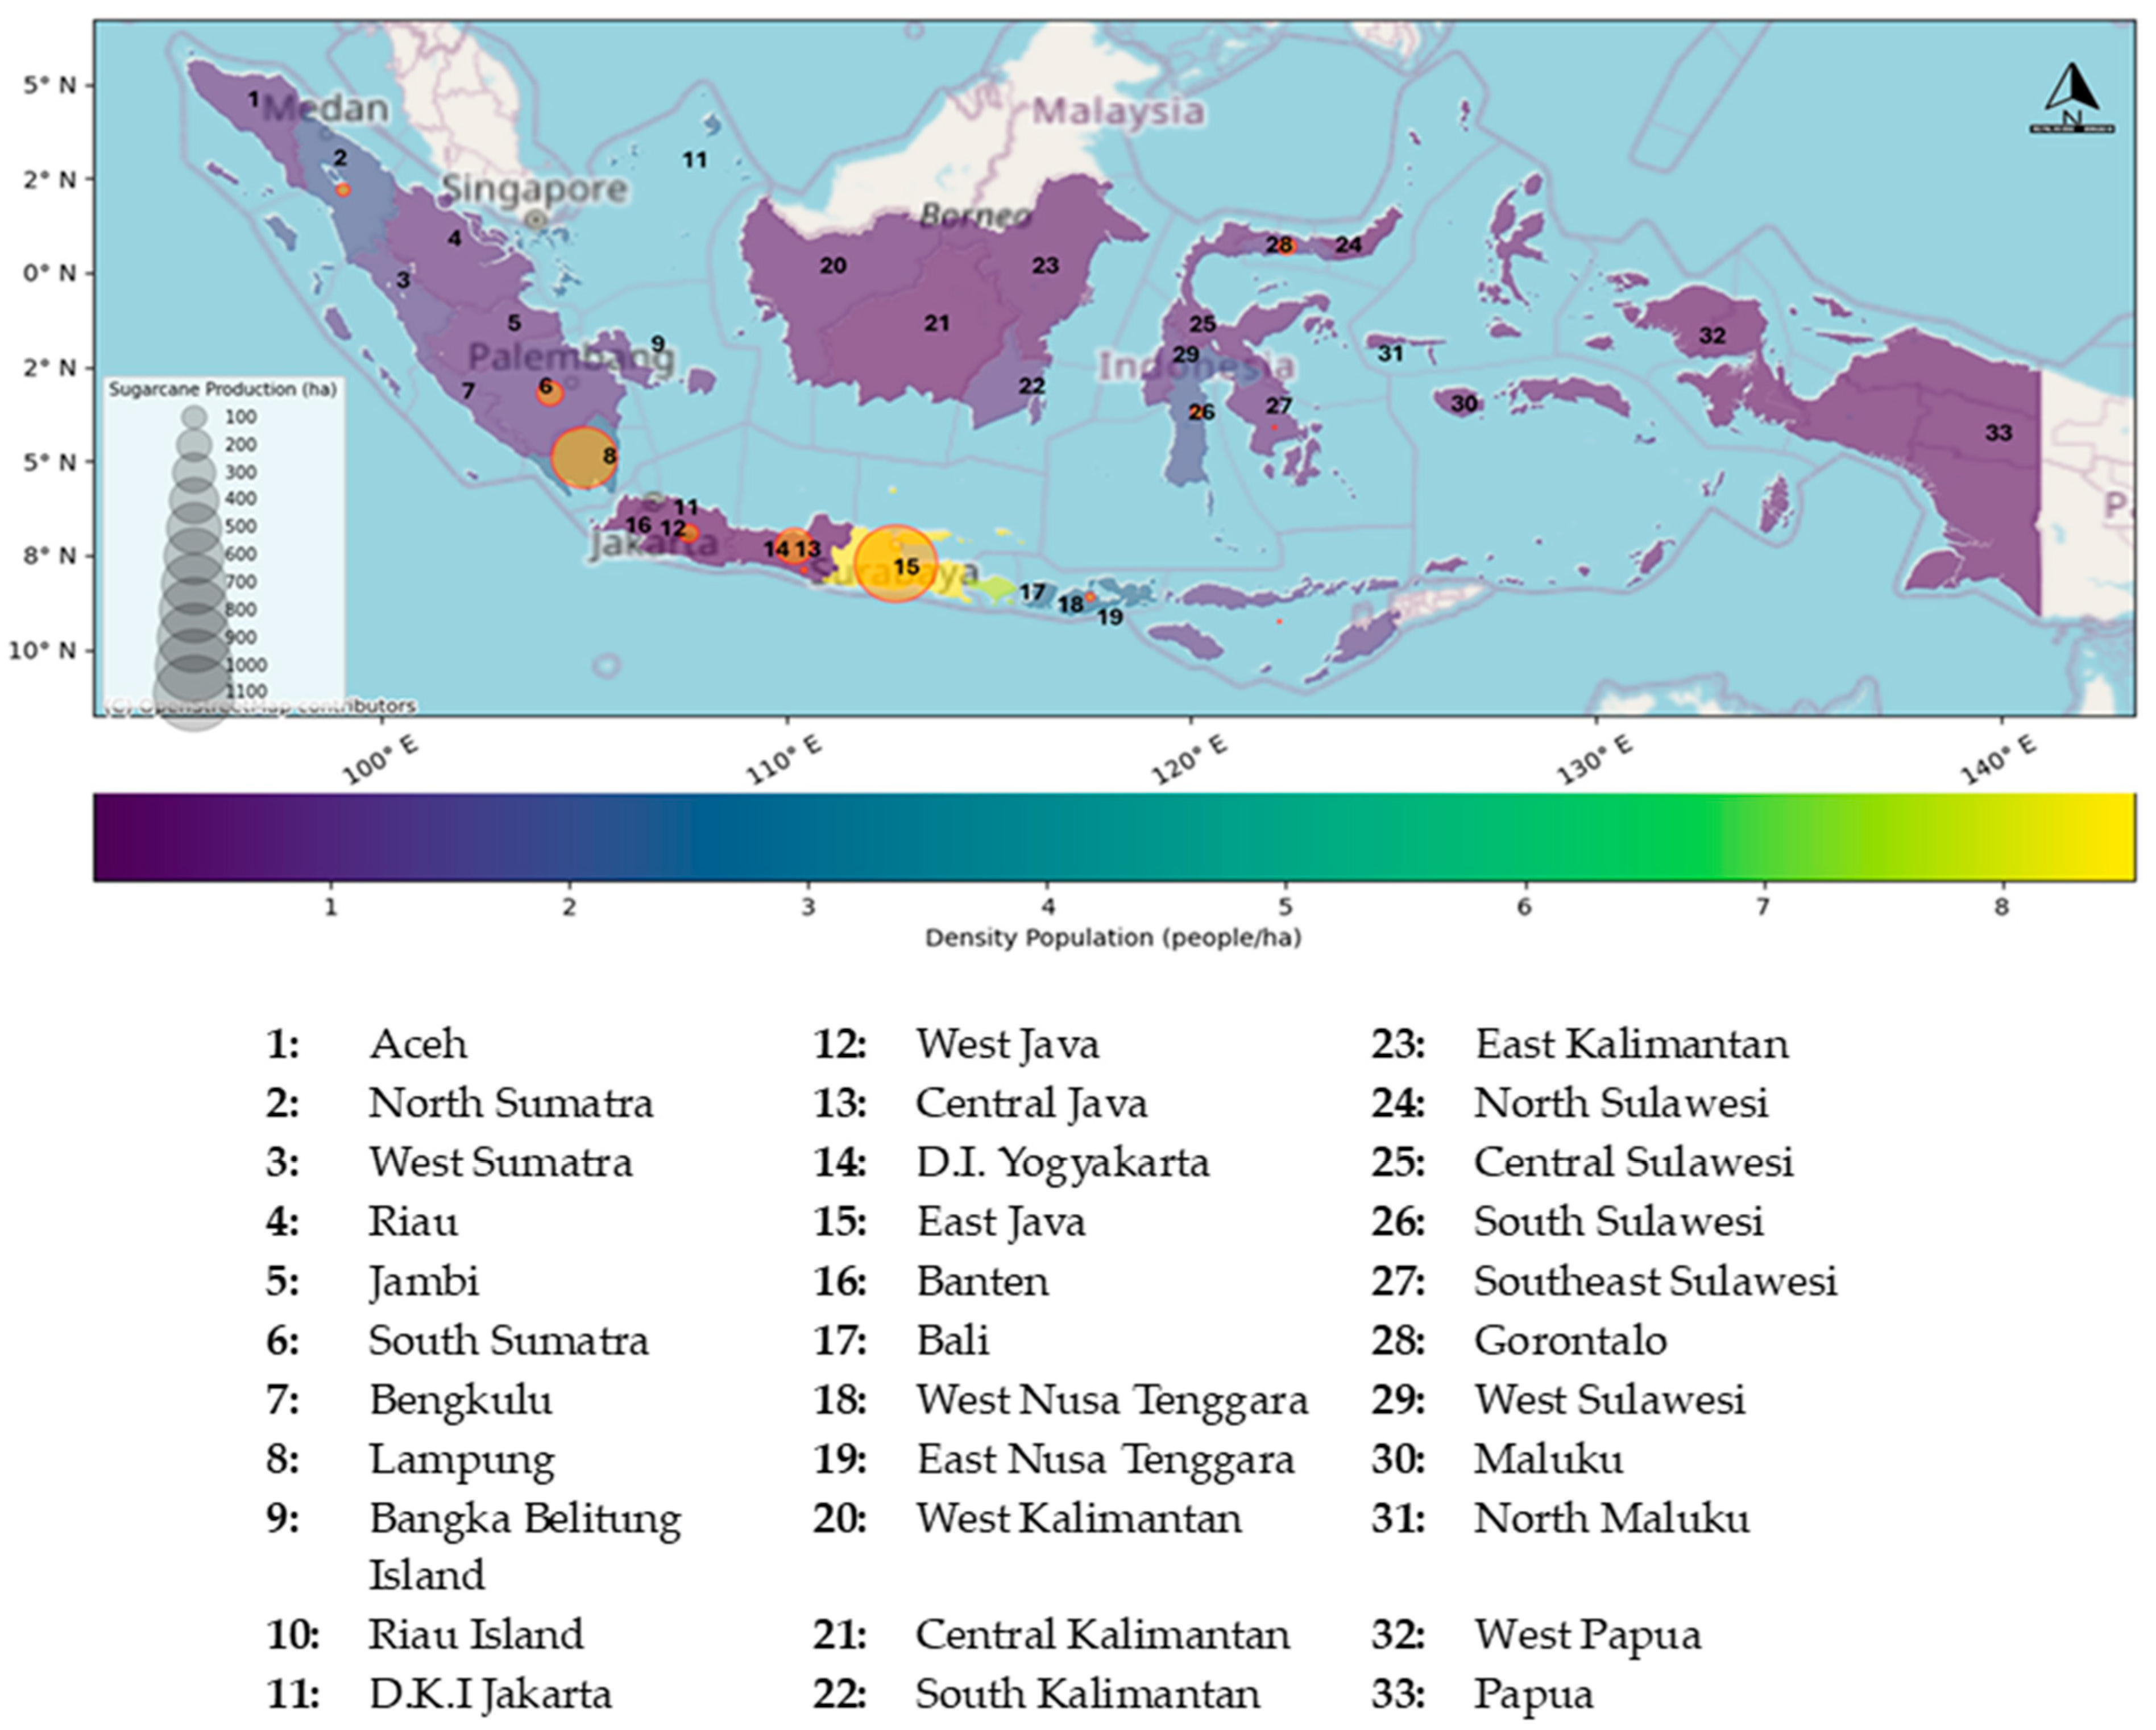
Figure 1. Population density and sugarcane production by province in 2022.
Atmosphere 15 01078 g001
Figure 2. The (GM (1,1) concept of feedback control system.
Atmosphere 15 01078 g002
Figure 3. Total annual dioxin emission in each province over the period of 2016–2022.
Atmosphere 15 01078 g003
Figure 4. Spatial distribution of dioxin emission in each province over the period of 2016–2022.
Atmosphere 15 01078 g004
Figure 5. Prediction of spatial distribution of dioxin emissions in each province over the period of 2023–2028.
Atmosphere 15 01078 g005
Table 1. Comparison of different emission factors of dioxin.
CountryExp ApproachMean EF µg TEQ/(t Fuel)RangeStdvRef.
UNEPField4--[32]
Queensland, AustraliaField0.950.52–1.4-[9]
Queensland, AustraliaLab burn tunnel4.41.6–9.63.7[10]
Hawaii, USABurn facility12698–148-
Florida, USABurn facility6.94–9.8-
Florida, USABurn facility2.31.6–4.4-[9]
Florida, USABurn facility0.34--
Florida, USAField1.390.85–2.30.57[9,10]
Florida, USAField1.90.96–2.8-[9]
Table 2. Annual dioxin emissions by province (2016–2022, pg/year).
North SumatraSouth SumatraLampungWest JavaCentral
Java
D.I YogyakartaEast JavaWest Nusa TenggaraEast Nusa TenggaraSouth SulawesiGorontalo
N (years)77777776277
mean232301428301331247435242187287414
stDev413924262570181071538085
min1782553872452901204075078149237
25%202266.5418302.5319.5225.5425210132262405
50%225301431305341239439276.5186289441
75%261333438316349294448315240325460
max293351464322353334455333294400487
Table 3. Comparison of PCDD/Fs emission (Pg/year) by different emission factors.
YearUNEPUSAAustralia
(4 µg TEQ/t Material Burned)(1.39 µg TEQ/t Fuel)(0.95 µg TEQ/t Fuel)
2016531118831644
201748361095749
201850101057723
2019495516861152
202050181108757
202149981229840
202248381119765
Table 4. Annual PCDD/Fs emission prediction in each province over the period of 2023–2028 (pg/year).
202320242025202620272028
North Sumatra260271282293305317
South Sumatra242232222213204195
Lampung413411409407405402
West Java306308310312314316
Central Java351356362367372378
D.I. Yogyakarta270279288298307318
East Java416412408405401397
West Nusa Tenggara296311327344362381
East Nusa Tenggara180178176174172170
South Sulawesi216201187173161150
Gorontalo505534564595629664
Table 5. Grey model performance evaluation of dioxin emission prediction.
MAPE (%)MAE
North Sumatra3695
South Sumatra927
Lampung626
West Java1858
Central Java312
D.I. Yogyakarta78177
East Java1.46
West Nusa Tenggara42140
East Nusa Tenggara100186
South Sulawesi83143
Gorontalo29129
Disclaimer/Publisher’s Note: The statements, opinions and data contained in all publications are solely those of the individual author(s) and contributor(s) and not of MDPI and/or the editor(s). MDPI and/or the editor(s) disclaim responsibility for any injury to people or property resulting from any ideas, methods, instructions or products referred to in the content.