Abstract
The ionosphere is one of the important error sources that affect the communication of radio signals. The international reference ionosphere (IRI) model is a commonly used model to describe ionospheric parameters. The driving parameter IG12 of the IRI-2016 model was optimally updated based on GNSS-TEC data from 2015 and 2019. The electron density profiles and NmF2 calculated by the IRI-2016 model (upda-IRI-2016) driven by the updated IG12 value (IG-up) were evaluated for their accuracy using ionosonde observations and COSMIC inversion data. The experiments show that both the electron density profiles and NmF2 calculated by upda-IRI-2016 driven by IG-up show significant optimization effects, compared to the IRI-2016 model driven by IG12. For electron density, the precision improvement (PI) for both MAE and RMSE at the Beijing station exceed 31.2% in January 2015 and 16.0% in January 2019. While the PI of MAE and RMSE at the Wuhan station, which is located at a lower latitude, both exceed 32.5% in January 2015, both exceed 42.1% in January 2019, which is significantly higher than that of the Beijing station. In 2015, the PI of MAE and RMSE compared with COSMIC are both higher than 20%. For NmF2, the PI is greater for low solar activity years and low latitude stations, with the Wuhan station showing a PI of more than 11.7% in January 2019 compared to January 2015. The PI compared to COSMIC was higher than 17.2% in 2015.
1. Introduction
The ionosphere is the Earth’s upper atmosphere, which extends from about 60 km above the ground to an altitude of about 2000 km, and contains a large number of free electrons and ions, which have a significant impact on radio systems, such as satellite navigation, communications, and radar detection [1,2,3]. Therefore, it is particularly important to obtain accurate information about the ionosphere [4,5]. The international reference ionosphere (IRI) is an empirical ionospheric model jointly developed by the committee on space research (COSPAR) and the international union of radio science (URSI) using global multi-source ionospheric observation data. Given the time and location, the IRI model can describe the ionosphere-related information, including total electron content (TEC), ionospheric electron density (IED), F2-layer peak electron density (NmF2), F2-layer peak electron density height (hmF2), and other ionospheric parameters, which are used to characterize the variations of the ionospheric state [6].
Due to the small amount of observational data in China used in the establishment of the IRI model, many scholars have evaluated and studied the applicability of the IRI model within the China region [7,8,9,10,11,12,13,14,15]. The IRI-2016 model is better able to predict the trend of the F2-layer critical frequency (foF2) with solar activity in the China region, but there is still a certain bias in predicting the fine structure of ionospheric anomalies [10,16]. With the continuous enrichment of ionospheric observations, IRI modeling has begun to shift from providing ionospheric climatological information to improving the accuracy of the model calculations and real-time weather descriptions. Based on this, many researchers are committed to improving the prediction accuracy of IRI models in order to enhance their application in scientific research and engineering practice. In particular, it is one of the more effective methods to improve the accuracy of the IRI models by adjusting the IRI driving parameters (IG12 index and RZ12 index) with high-precision GNSS-TEC data [17,18,19,20,21]. The driving parameters used within the standard IRI models are adjusted with the aim of minimizing the error differences between the IRI-TEC and GNSS-TEC.
The IG index is the Ionosonde Global monthly index based on noontime foF2 ionosonde measurements recorded at four reference stations: two from the Southern Hemisphere (Port Stanley/UK and Canberra/Canada) and two from the Northern Hemisphere (Kokubunji/Japan and Chilton/UK). The index takes into account both solar activity and ionospheric information, which can better reflect the variation of the ionosphere. And the IG12 is the 12 month running-mean of the ionospheric IG index [6,22,23]. Combined with GPS-TEC, Okoh et al. [24] verified the improved performance of the IRI model in the Nigerian region. Ssessanga et al. [25] characterized foF2 before and after the improvement. Zhang et al. [26] used GNSS-TEC to update the IG12 values, interpolated the IG12 values in response to the large differences in the updated IG12 values at different locations and times, and compared and analyzed different temporal and spatial interpolation schemes, ultimately determining the optimal scheme. That is, the temporal resolution was one hour, using linear interpolation to obtain the updated IG12 index for each time, and the spatial resolution was 5° × 2.5° (longitude × latitude), using bilinear interpolation to obtain the updated IG12 index for each position. The use of the updated IG12 values to drive IRI-2016 results in a great improvement in the accuracy of TEC calculated by IRI-2016. Meanwhile, the daily grid map of IG-up values and equivalent IG12 values in the mainland China region are also provided to ensure that the improved IRI-2016 model can be used to get the corresponding TEC in regions where there are no other more effective means (e.g., GNSS and ionosonde) to obtain high-precision ionospheric information.
Compared with TEC, the variation of IED with altitude is affected by photochemistry and electrodynamics, and the variation is more complicated, which makes it more important to discuss its optimization in depth. In this paper, based on the study of Zhang et al. [26], we adopt their finally derived optimal temporal and spatial interpolation schemes to compare and evaluate the accuracy of electron density and NmF2 output from IRI-2016 driven by IG12 and IG-up, respectively, using COSMIC data and ionosonde data. In addition, since the Shubin model performs better than AMTB for calculating hmF2 in the China region [27], the Shubin model is directly used to calculate the peak electron density heights. In this paper, a detailed accuracy assessment of the electron density and NmF2 output from the IRI-2016 model driven by IG12 and IG-up values is presented, respectively. It can provide a reference and insight for improving the accuracy of the IRI model’s IED in different regions, and, at the same time, it can provide a more accurate initial reference value for other modeling techniques, such as ionospheric tomography and data assimilation.
2. Data and Methodology
2.1. Experimental Data
2.1.1. The IRI-2016 Model
The Fortran version of the IRI-2016 source code used in this study was obtained from the official website of the IRI model: http://irimodel.org (accessed on 3 July 2024). The IG12 data used for updating were selected from GNSS-TEC, and were accurately extracted from observations of relatively uniformly distributed GNSS ground monitoring stations in the China region. The grid product of the IG-up values calculated with a temporal resolution of one hour and a spatial resolution of 5° × 2.5° (longitude × latitude) can be temporally and spatially interpolated to obtain the IG-up values for a specific time and location, upon which the parameters driving the IRI-2016 model are based.
2.1.2. Ionosonde Data
The ionosonde can measure the IED profile from the ground to the peak height of the F2 layer (hmF2) with high accuracy, but it must be at a specific station to obtain the observation data, the spatial coverage is limited, the observation time is short, and sometimes there are data missing. In order to investigate the performance differences of the IRI-2016 model before and after the improvement at different solar activity levels and at different latitudes, we selected two ionosonde stations at different latitudes, Beijing (BP440, 40.3° N/116.2° E) and Wuhan (WU430, 30.5° N/114.4° E), in 2015 (high solar activity) and 2019 (low solar activity), respectively. Since the temporal resolution of the ionosonde observations is different from that of the IRI-2016 model, i.e., the temporal resolution of the ionosonde observations is 15 min, we calculated the IRI-2016 model values for the time and location of these two stations by bilinear interpolation.
2.1.3. COSMIC Data
The FORMOSAT-3/COSMIC mission is a GNSS radio occultation remote sensing system jointly developed by United States and Taiwan, China. The global daily electron density profiles that can be provided in the pre-operational period of FORMOSAT-3/COSMIC can reach up to 2500 or so per day. FORMOSAT-7/COSMIC-2, launched in 2019, can provide up to 5000 electron density profiles per day, but its coverage is only within a latitude of 35° north and south. COSMIC data can be downloaded from CDAAC’s official website (https://cdaac-www.cosmic.ucar.edu, accessed on 3 July 2024). In this paper, we use the data of the COSMIC occultation inversion’s level 2 product (ionPrf), which contains information on the time of occurrence of the occultation event, its position, electron density profile, NmF2, and hmF2 necessary for the validation analysis. Despite the quality checking method adopted by CDAAC in inverting the electron density profiles, the final released electron density profile products still have some quality problems [28]. Therefore, we completed the necessary quality control with reference to the topside electron density profile slope and the mean deviation (MD) of the electron density fluctuations proposed by Yang et al. [29]. Electron density profiles with latitude and longitude offsets less than 10°, slopes less than −0.2 and greater than −9 in the 420 km–490 km range, MDs not exceeding 3, and hmF2 between 180 km and 420 km have been selected in this paper.
2.2. Experimental and Evaluation Methods
Zhang et al. [26] minimized the difference between the TEC output from the IRI model (the upper height for TEC integration is 2000 km and the topside-plasmasphere option is the Nequick model) and the high-precision TEC extracted from the GNSS data by adjusting the IG12 index to improve the accuracy of the TEC output from the IRI model and ultimately computed the IG-up value gridded maps for the users in the China region. It was verified that the accuracy of the TEC calculated by the IRI-2016 in the China region can be significantly improved by using the IG-up values provided by it. In this paper, we use the GNSS-TEC driver to update the IG12 values and carry out a detailed accuracy assessment of the IED output from the IRI model driven by the IG-up values. Firstly, we qualitatively and quantitatively evaluate the electron density and NmF2 outputs of IRI-2016 models driven by IG12 and IG-up values, respectively, using ionosonde data from the Beijing and Wuhan stations in January 2015 and January 2019 as reference values, and analyze their optimization under different solar activities, as well as different latitudes with the IG-up value-driven IRI-2016 model optimization. Secondly, the detailed assessment of the electron density and NmF2 of the IRI-2016 model output driven by the IG-up values in January 2015 and January 2019 in the China region is carried out using the IED from the COSMIC inversion as a reference. The validity of the reference data and assessment results are demonstrated by comparing the assessment results using ionosonde and COSMIC data as reference, respectively. Finally, the evaluation and analysis of the IED and NmF2 outputs from the IRI-2016 model driven by IG-up values for the whole year of 2015 (one day per week) is done using the COSMIC data as a reference and comparing the results using the whole year’s data with those using one month’s data. Since the amount of COSMIC data available in the China region for the whole year of 2019 is very small, the results of comparing the whole year of 2019 with COSMIC are out of the scope of this paper.
In order to quantitatively describe the performance of the IRI-2016 model before and after the improvement, root–mean–square error (RMSE), mean absolute error (MAE), and percent precision improvement (PI), are calculated as shown in Equations (1)–(3).
where, denotes the IED or NmF2 of ionosonde (or COSMIC) used for reference, denotes the IED or NmF2 output from IRI-2016 (or upda-IRI-2016), k denotes the number of the statistic, and , denote the RMSE or MAE obtained by calculating the IED or NmF2 output from the IRI-2016 model before and after the improvement, respectively. PI denotes the RMSE or MAE corresponding to the percentage improvement.
3. Results
3.1. Accuracy Analysis of Electron Density Profile
3.1.1. Comparison with Ionosonde Data
As an example, the electron density profiles of the two ionosonde data are shown for the two stations in Beijing and Wuhan from 00:00 to 07:30 UT (with a time interval of 90 min) on day 8 of 2015 and day 8 of 2019, compared with the electron density profiles output from the IRI-2016 model driven by IG12 and IG-up, respectively, as shown in Figure 1, Figure 2, Figure 3 and Figure 4. In particular, the black dotted line indicates the electron density profiles of the ionosonde observations, the green solid line indicates the electron density profiles output with the original IRI-2016 driven by IG12, and the red solid line indicates the electron density profiles output with the IRI-2016 driven by IG-up (upda-IRI-2016), and the figure name on each subfigure identifies the electron density profile generation and the time and place of generation. As can be seen in Figure 1, Figure 2, Figure 3 and Figure 4, the electron density profiles output from upda-IRI-2016 driven by IG12 differ less from those of ionosonde in the vast majority of cases at both stations compared to IRI-2016 driven by IG12, in both low solar activity and high solar activity years.
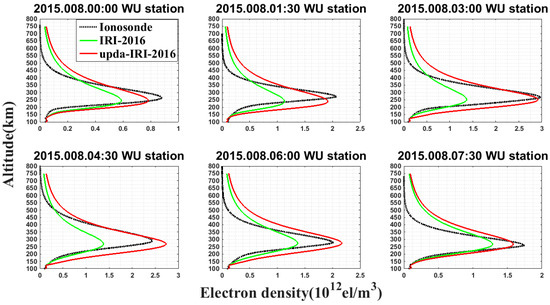
Figure 1.
Comparison of ionosonde electron density profiles at Wuhan station from 00:00 to 07:30 UTC on Day 8, 2015, with those output from IRI-2016 and upda-IRI-2016 driven by IG12 and IG-up, respectively.
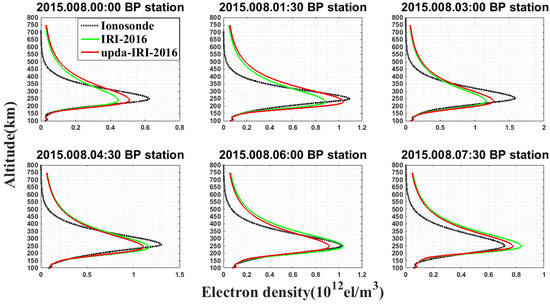
Figure 2.
Comparison of ionosonde electron density profiles at Beijing station from 00:00 to 07:30 UTC on Day 8, 2015, with those output from IRI-2016 and upda-IRI-2016 driven by IG12 and IG-up, respectively.

Figure 3.
Comparison of ionosonde electron density profiles at Wuhan station from 00:00 to 07:30 UTC on day 8, 2019, with those output from IRI-2016 and upda-IRI-2016 driven by IG12 and IG-up, respectively.
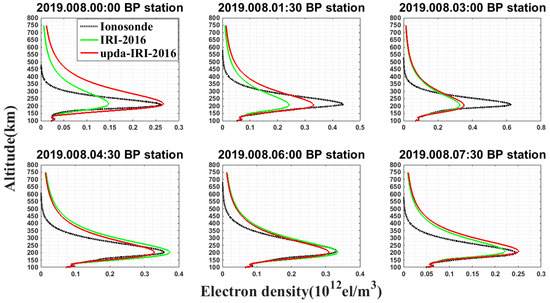
Figure 4.
Comparison of ionosonde electron density profiles at Beijing station from 00:00 to 07:30 UTC on day 8, 2019, with those output from IRI-2016 and upda-IRI-2016 driven by IG12 and IG-up, respectively.
It can be seen in Figure 1, Figure 2, Figure 3 and Figure 4 that the electron density in the year of high solar activity (2015) is higher than that in the year of low solar activity (2019). The electron density in 2015 is about 1 × 10¹² el/m3 to 2 × 10¹² el/m3 higher than that in 2019 at the same moment in terms of the ionosonde data from the Wuhan station, and both IRI-2016 driven by IG12 and upda-IRI-2016 driven by IG-up reflect that the activity of the ionosphere is affected by the solar activity. The variation of IED with height in the IRI-2016 model output is consistent with that of ionosonde in terms of the overall trend, showing an increase with height first, and then a gradual decrease after reaching the height of the peak density of the F2 layer, which is in line with the physical mechanism of the ionosphere. However, the IRI-2016 model has some differences with the ionosonde data in the electron density and NmF2 in the lower layers, and although this difference still exists in upda-IRI-2016 as well, the difference is significantly reduced compared with IRI-2016. It is therefore concluded that the upda-IRI-2016 model driven by IG-up improves the accuracy of the calculated electron density compared to IRI-2016 driven by IG12.
After completing the qualitative analysis of the electron density profiles, we proceeded to calculate the precision metrics of the bottomside electron densities using Equations (1)–(3) to analyze the precision variation of the bottomside electron densities. The precision metrics include the MAE, RMSE, and corresponding precision improvement of the difference between the electron density output from IRI-2016 and upda-IRI-2016 and the ionosonde electron density, and the specific precision metrics calculation results are shown in Table 1. The statistics include the whole year of 2015 and the first month of 2019 for both stations.

Table 1.
MAE, RMSE, and its precision improvement (PI) percentage for the difference between the bottomside electron density and ionosonde data for IRI-2016 and upda-IRI-2016 in January 2015 and January 2019.
Since ionosonde cannot detect data above hmF2 and the electron density information above hmF2 is calculated based on the Chapman theory, and since ionosonde data may be missing at night. Therefore, this paper only counts the bottomside (hmF2 below) electron density profiles during the daytime (00:00~09:00 UT) when counting the electron density accuracy. According to Table 1, it can be found that both in the low solar activity year and high solar activity year, with ionosonde data as a reference, the MAE and RMSE of the bottomside electron density of upda-IRI-2016 are smaller than those of IRI-2016 at both stations, and the precision of the bottomside electron density at both the Beijing and Wuhan stations has been significantly improved. In 2015, the MAE of the bottomside electron density output by IRI-2016 was 0.103 × 10¹² el/m3 and 0.1672 × 10¹² el/m3 at the Beijing and Wuhan stations, respectively, and correspondingly, the MAE of upda-IRI-2016 was 0.0709 × 10¹² el/m3 and 0.1128 × 10¹² el/m3. Compared with the IRI-2016, the precision improvement of MAE for bottomside electron density output by upda-IRI-2016 is 31.2% and 32.5% at Beijing and Wuhan stations, respectively. In 2019, the MAE of the bottomside electron density output by IRI-2016 is 0.0324 × 10¹² el/m3 and 0.0633 × 10¹² el/m3 at the Beijing and Wuhan stations, respectively, and correspondingly, the MAE of upda-IRI-2016 is 0.027 × 10¹² el/m3 and 0.0354 × 10¹² el/m3. Compared with to IRI-2016, the accuracy improvement of MAE for bottomside electron density output by upda-IRI-2016 is 16.5% and 44.1% at Beijing and Wuhan stations, respectively.
3.1.2. Comparison with COSMIC Data
The electron density of the upda-IRI-2016 output was evaluated in 2015 and 2019 using ionPrf product data from available COSMIC occultation observations within the China region. After performing the necessary quality control on the COSMIC data, the COSMIC electron density profiles within the China region were counted, and the IG-up values were interpolated according to the time and location of the COSMIC occultation event to drive the upda-IRI-2016 calculation of the electron density.
Figure 5 and Figure 6 present the available COSMIC electron density profiles for day 155 in 2015 and day 351 in 2019, respectively, compared to the electron density profiles output from IRI-2016 and upda-IRI-2016 driven by IG12 and IG-up, respectively. The black dotted, green solid, and red solid lines indicate the IEDs of COSMIC, IRI-2016, and upda-IRI-2016, respectively, and the headings show the time and geographic location (latitude and longitude, east and north, respectively) at which the occultation event occurred. Since an occultation event occurs with a drift in latitude and longitude, the latitude and longitude at the NmF2 tangent point are identified in this paper as the location where the occultation event occurred. As can be seen in Figure 5 and Figure 6, the electron density in 2015 is much larger than that in 2019 at the same local time, which is due to the fact that the strength of the solar activity has a direct effect on the degree of ionization of the ionosphere. In high solar activity years, IRI-2016 underestimates the IED to some extent relative to the COSMIC data, while in low solar activity years it shows a trend of overestimation. Both IRI-2016 and upda-IRI-2016 output electron densities and the trend of the variations with altitude are in agreement with the COSMIC observations. However, the difference between the upda-IRI-2016 output electron density profiles and the COSMIC electron density profiles is smaller in both 2015 and 2019.
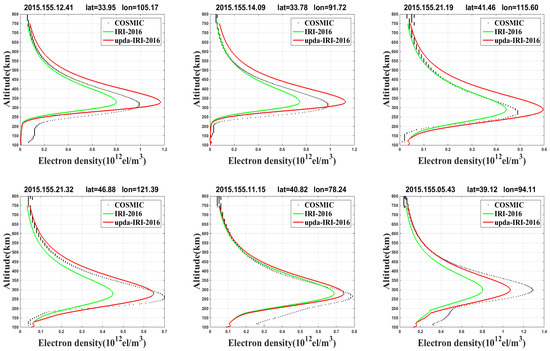
Figure 5.
Comparison of COSMIC electron density profiles with IRI-2016 and upda-IRI-2016 outputs driven by IG12 and IG-up, respectively, on day 155 of 2015.
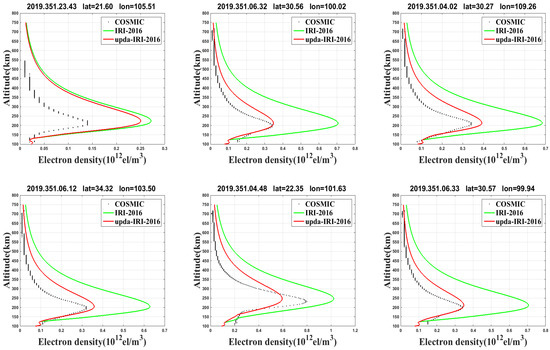
Figure 6.
Comparison of COSMIC electron density profiles with IRI-2016 and upda-IRI-2016 outputs driven by IG12 and IG-up, respectively, on day 351 of 2019.
In order to quantitatively analyze the information reflected in the above electron density contour plots, we counted the bottomside electron densities output by the model. Firstly, the precision of the electron density in 2015 and January 2019 (every day) is counted so that it can be compared and analyzed with the statistical results using ionosonde data as a reference. The COSMIC electron density profiles available in China for the whole year of 2015 (one day per week) are then counted and statistically analyzed for comparison with the bottomside electron density profiles output from IRI-2016 and upda-IRI-2016 driven by IG12 and IG-up, respectively. Although the number is limited, the distribution of dates is more balanced throughout the year.
The statistical results of the bottomside electron density accuracy for 2015 and the first month of 2019 are shown in Table 2, from which it can be seen that the results are similar to those using ionosonde data as a reference. The errors of the bottomside electron density profiles output by upda-IRI-2016 are smaller than the errors of the bottomside electron density profiles output by IRI-2016 for both low and high solar activity years. The error of the bottomside electron density in the high solar activity years is larger than that in the low solar activity years.

Table 2.
MAE, RMSE, and its precision improvement (PI) percentage for the difference between the bottomside electron density and COSMIC data for IRI-2016 and upda-IRI-2016 in January 2015 and January 2019.
The bottomside electron density accuracy statistics for the whole year of 2015 are shown in Table 3, and the results for the whole year of 2015 are similar to those of the first month. Compared to IRI-2016, the precision improvement of MAE and RMSE for the upda-IRI-2016 output bottomside electron density profiles amount to 21.3% and 20.8%, respectively.

Table 3.
MAE, RMSE, and its precision improvement (PI) percentage for the difference between the bottomside electron density and ionosonde data for IRI-2016 and upda-IRI-2016 in 2015.
3.2. Accuracy Analysis of NmF2
3.2.1. Comparison with Ionosonde Data
Due to the missing nighttime data of ionosonde, only daily 00:00 to 09:00 UT is used for comparison in this paper. Figure 7 and Figure 8 show the comparison of NmF2 observed by ionosonde and the output from IRI-2016 and upda-IRI-2016 driven by IG12 and IG-up, respectively, at the Wuhan and Beijing stations from 00:00 to 09:00 UT in 2015 and January 2019, respectively. The black dots indicate the NmF2 observed by ionosonde and the green asterisks and red plus signs indicate the NmF2 output from IRI-2016 and upda-IRI-2016 driven by IG12 and IG-up, respectively. As can be seen from Figure 7, the difference between NmF2 output by upda-IRI-2016 and NmF2 observed by ionosonde at the Wuhan station is significantly smaller in 2015 compared to IRI-2016. According to Figure 8, the performance of upda-IRI-2016 is better than that of IRI-2016 in both the Wuhan and Beijing stations in 2019. Compared with IRI-2016, the NmF2 output by upda-IRI-2016 is obviously closer to that observed by ionosonde, and this advantage is more obvious in the Wuhan station than in the Beijing station. Combining Figure 7 and Figure 8, it can be observed that the performance of upda-IRI-2016 in calculating NmF2 is better than that of IRI-2016 using the ionosonde data as a reference, and this advantage is more significant in the low solar activity year (2019) and low-latitude stations (Wuhan station).
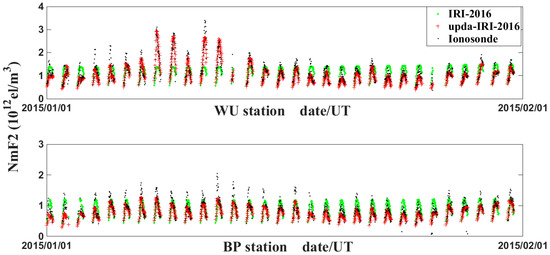
Figure 7.
NmF2 output from ionosonde NmF2 versus IRI-2016 and upda-IRI-2016 driven by IG12 and IG-up, respectively, at Wuhan and Beijing stations from 00:00 to 09:00 UT in January 2015.
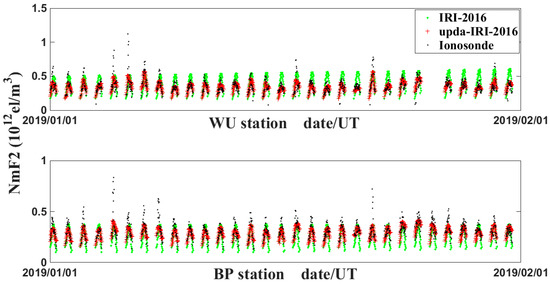
Figure 8.
NmF2 output from ionosonde NmF2 versus IRI-2016 and upda-IRI-2016 driven by IG12 and IG-up, respectively, at Wuhan and Beijing stations from 00:00 to 09:00 UT in January 2019.
To verify the phenomena reflected in Figure 7 and Figure 8, the MAEs and RMSEs and the corresponding PIs between the NmF2 output from IRI-2016 and upda-IRI-2016 and the peak electron densities observed by ionosonde observations at the Wuhan and Beijing stations, respectively, in the first months of 2015 and 2019 are calculated in this paper. The specific statistical results are shown in Table 4. The statistics in Table 4 show that the MAE of NmF2 output by IRI-2016 at the Beijing and Wuhan stations in 2015 were 0.1605 × 10¹² el/m3 and 0.2974 × 10¹² el/m3, respectively, and correspondingly, the MAE of upda-IRI-2016 were 0.1350 × 10¹² el/m3 and 0.1626 × 10¹² el/m3. Compared with IRI-2016, the precision improvement of the MAE of NmF2 output from upda-IRI-2016 is 15.8% and 45.3% at the Beijing and Wuhan stations, respectively. In 2019, the MAE of NmF2 output from IRI-2016 was 0.0617 × 10¹² el/m3 and 0.097 × 10¹² el/m3 at the Beijing and Wuhan stations, respectively, which corresponded to 0.438 × 10¹² el/m3 and 0.0487 × 10¹² el/m3 for upda-IRI-2016. Compared with IRI-2016, the precision improvement of the MAE of NmF2 output from upda-IRI-2016 is 29.0% and 49.0% at the Beijing and Wuhan stations, respectively.

Table 4.
MAE, RMSE, and its precision improvement (PI) percentage for the difference between the NmF2 and ionosonde data for IRI-2016 and upda-IRI-2016 in January 2015 and January 2019.
In Figure 7 and Figure 8, especially for the Beijing station, there are some upda-IRI-2016 performances that are poorer compared to the ionosonde observation NmF2 used as a reference, and a small number of these occur in Figure 2 and Figure 3, which this paper conjectures may be due to some discrepancies between the GNSS-TEC used to update IG12 and the reference data used to evaluate the electron density. Although this situation exists, the overall upda-IRI-2016 performs better than IRI-2016 in terms of accuracy statistics.
3.2.2. Comparison with COSMIC Data
The MAE and RMSE of NmF2 output from IRI-2016 and upda-IRI-2016 compared to COSMIC were calculated for January 2015 and 2019, respectively, using the data from the COSMIC inversion, and the statistical results are shown in Table 5. Similar to the results of the evaluation using ionosonde data, in terms of the MAE and RMSE of NmF2, the MAE and RMSE between NmF2 output from upda-IRI-2016 and NmF2 observed by ionosonde in the high and low solar activity years are higher than the MAE and RMSE between NmF2 output from IRI-2016 and NmF2 observed by ionosonde in the high and low solar activity years. The MAE and RMSE between NmF2 and ionosonde-observed NmF2 are smaller. The MAE of NmF2 output from upda-IRI-2016 in 2015 is 0.0235 × 10¹² el/m3 less than that from IRI-2016, and the corresponding RMSE is 0.0223 × 10¹² el/m3 less. The 2019 upda-IRI-2016 output of NmF2 MAE is reduced by 0.255 × 10¹² el/m3 and the corresponding RMSE is reduced by 0.275 × 10¹² el/m3 compared to IRI-2016. The MAE PI of NmF2 output from IRI-2016 is 15.6% and 29.9%, and the RMSE PI of NmF2 is 13.5% and 29.5% in 2015 and 2019, respectively, after adjusting the IG12 parameters. From these statistical results, it can be seen that the optimization of NmF2 with the output of upda-IRI-2016 driven by IG-up is more significant in low solar activity years than in high solar activity years.

Table 5.
MAE, RMSE, and its precision improvement (PI) percentage for the difference between the NmF2 and COSMIC data for IRI-2016 and upda-IRI-2016 in January 2015 and January 2019.
The MAE and RMSE of NmF2 for IRI-2016 and upda-IRI-2016 were statistically analyzed using COSMIC data covering one day per week for the whole year of 2015, and the statistical results are shown in Table 6. Comparison of Table 5 shows that the accuracy statistics results for every day of January 2015 and for using COSMIC data one day per week for the entire year of 2015 converge.

Table 6.
MAE, RMSE, and its precision improvement (PI) percentage for the difference between the NmF2 and COSMIC data for IRI-2016 and upda-IRI-2016 in 2015.
4. Discussion and Conclusions
The accuracy of the electron density of IRI-2016 and upda-IRI-2016 outputs driven by IG12 and IG-up was evaluated using ionosonde data and COSMIC data for 2015 and the first month of 2019, as well as all eligible COSMIC data for the whole year of 2015 (one day per week), respectively, in terms of the bottomside electron density and NmF2 are discussed and the following conclusions are drawn:
- (1)
- It can be seen from both ionosonde data and COSMIC inversion electron density profiles that ionospheric electron densities, especially the peak electron density in the F2 layer, are larger in the years of high solar activity than in the years of low solar activity, which is in accordance with the law of the influence of solar activity on electron density. The trends in the variation of electron density with altitude of the IRI-2016 and upda-IRI-2016 outputs driven by IG12 and IG-up, respectively, are both consistent with the COSMIC electron density profiles from the COSMIC inversion.
- (2)
- The results of using ionosonde data as a reference and COSMIC data as a reference show that both the electron density and NmF2 output of upda-IRI-2016 driven by IG-up compared to IRI-2016 model driven by IG12 are greatly improved in both high and low solar activity years.
- (3)
- In terms of electron density, compared with IRI-2016 driven by IG12, the optimization effect of upda-IRI-2016 is more significant at low-latitude stations than at high-latitude stations. Compared to ionosonde, in January 2015, the PIs of MAE and RMSE are 32.5% and 32.6% for the Wuhan stations, respectively. The PIs are 31.2% and 31.4% for the Beijing stations, respectively. In January 2019, the PIs are 44.1% and 42.1% for the Wuhan stations and 16.5% and 16.0% for the Beijing stations, respectively. Compared to COSMIC, the PI for both MAE and RMSE exceeded 20.8% in 2015.
- (4)
- In terms of NmF2, the optimization effects of both low solar activity years and low-latitude stations are more significant than those of high solar activity years and high-latitude stations. Compared to ionosonde, in January 2015, the PIs of MAE and RMSE are 45.3% and 41.2% for the Wuhan stations, respectively. The PIs are 15.8% and 11.8% for the Beijing stations, respectively. In January 2019, the PIs are 49.0% and 45.6% for the Wuhan stations and 29.0% and 22.0% for the Beijing stations, respectively. Compared to COSMIC, the PI was over 17.2% for the whole year of 2015 and over 29.5% for January 2019.
The use of IG-up to drive the IRI-2016 model has not only led to a significant improvement in the accuracy of the TEC calculated by IRI-2016, but has also led to the optimization of the accuracy of its calculated electron density contours and peak electron densities. Therefore, based on the experimental results, the grid map of IG-up values in the area of mainland China is provided every day for the relevant engineering practice users to extract the equivalent IG12 values at a specific location and time by using the interpolation method mentioned in the paper, in order to ensure that in the absence of other more effective means (e.g., GNSS, ionosonde) to obtain high-precision ionospheric information, such as the TEC, electron density, peak electron density, and so on, in the region, the IG-up driven IRI-2016 model can be used to achieve the corresponding accuracy requirements.
It should be noted that the improvement of the IRI-2016 model in this paper mainly focuses on the mid-latitude region of the Northern Hemisphere, but the ionospheric state varies greatly in different spatial and temporal conditions, especially under severe space weather conditions (e.g., solar radio burst and geomagnetic storms) where the ionospheric variations are exceptionally severe. Although the data of 2015 selected in this paper contains some geomagnetic storm events and achieves better average correction results for the whole year, with the approach of the peak year of the 25th solar activity week, focusing on the performance of the improved GNSS-based IRI-2016 model (updata-IRI-2016) under this condition has important application value for GNSS navigation and positioning services.
In addition, the version of the IRI model used in this paper is IRI-2016, which has been updated to IRI-2020, mainly updating the D-region electron density model, ion temperature model, and the equatorial vertical ion drift model [23]. In this paper, we mainly consider the electron density in the F-region and the corrected model in the Chinese mainland region, so the use of the IRI-2016 model is sufficient to fulfill the purpose of the experiment. However, the IRI model is constantly improving and developing, and we will also apply the future version of IRI to start the model correction work in next work.
Author Contributions
Conceptualization, writing—original draft, writing—review and editing, J.P., Y.Y., Y.L., H.Z., T.Z., Y.W. and Z.D.; methodology, T.Z., Y.L. and Y.Y.; validation, J.P., H.Z., Y.W. and Z.D.; data curation, J.P., Y.L., Y.W. and Z.D.; formal analysis, J.P., Y.Y., H.Z. and T.Z.; funding acquisition, J.P., Y.W. and Z.D. All authors have read and agreed to the published version of the manuscript.
Funding
This research was funded by the Science and Technology Project of the China Southern Power Grid Yunnan Power Grid Company Ltd., grant number. YNKJXM20220033.
Institutional Review Board Statement
Not applicable.
Informed Consent Statement
Not applicable.
Data Availability Statement
Fortran version of the IRI-2016 source code from the IRI model official website (http://irimodel.org/, accessed on 3 July 2024). COSMIC occultation data are available from CDAAC (https://data.cosmic.ucar.edu/gnss-ro/, accessed on 3 July 2024).
Acknowledgments
We acknowledge the data from the Chinese Meridian Project. We would also like to thank the anonymous reviewers for their helpful suggestions.
Conflicts of Interest
Jing Peng, Yifan Wang, and Zelin Dai were employed by the Yunnan Power Grid Company Ltd. The remaining authors declare that the research was conducted in the absence of any commercial or financial relationships that could be construed as potential conflicts of interest.
References
- Georgiadou, Y.; Kleusberg, A. On the Effect of Ionospheric Delay on Geodetic Relative GPS Positioning. Manuscripta Geod. 1988, 13, 1–8. [Google Scholar]
- Yuan, Y. Study on Theories and Methods of Correcting Ionospheric Delay and Monitoring Ionosphere Based on GPS. Ph.D. Dissertation, Institute of Geodesy and Geophysics, Chinese Academy of Sciences, Wuhan, China, 2002. (In Chinese). [Google Scholar]
- Yuan, Y.; Wang, N.; Li, Z.; Huo, X. The BeiDou global broadcast ionospheric delay correction model (BDGIM) and its preliminary performance evaluation results. Navigation 2019, 66, 55–69. [Google Scholar] [CrossRef]
- Xu, H.; Chen, X.; Ou, J.; Yuan, Y. Crowdsourcing RTK: A new GNSS positioning framework for building spatial high-resolution atmospheric maps based on massive vehicle GNSS data. Satell. Navig. 2024, 5, 13. [Google Scholar] [CrossRef]
- Gu, S.; Gan, C.; He, C.; Lyu, H.; Hernandez-Pajares, M.; Lou, Y.; Geng, J.; Zhao, Q. Quasi-4-dimension ionospheric modeling and its application in PPP. Satell. Navig. 2022, 3, 24. [Google Scholar] [CrossRef]
- Bilitza, D.; Altadill, D.; Truhlik, V.; Shubin, V.; Galkin, I.; Reinisch, B.; Huang, X. International Reference Ionosphere 2016: From ionospheric climate to real-time weather predictions. Space Weather 2017, 15, 418–429. [Google Scholar] [CrossRef]
- He, R.; Li, M.; Zhang, Q.; Zhao, Q. A Comparison of a GNSS-GIM and the IRI-2020 Model over China Under Different Ionospheric Conditions. Space Weather 2023, 21, e2023SW003646. [Google Scholar] [CrossRef]
- Wang, C. Comparison of ionospheric characteristic parameters obtained by GPS and ionosonde with IRI model over China. J. Earth Syst. Sci. 2016, 125, 745–759. [Google Scholar] [CrossRef]
- Li, S.; Li, L.; Peng, J. Variability of Ionospheric TEC and the Performance of the IRI-2012 Model at the BJFS Station, China. Acta Geophys. 2016, 64, 1970–1987. [Google Scholar] [CrossRef][Green Version]
- Wan, Q.; Ma, G.; Li, J.; Wang, X.; Lu, W.; Maruyama, T.; Fan, J.; Zhang, J. Performance evaluation of IRI-2016 with GPS-derived TEC at the meridian of 110oE in China of 2014. J. Atmos. Sol.-Terr. Phys. 2020, 201, 105206. [Google Scholar] [CrossRef]
- Zhang, B.; Wang, Z.; Shen, Y.; Li, W.; Xu, F.; Li, X. Evaluation of foF2 and hmF2 Parameters of IRI-2016 Model in Different Latitudes over China under High and Low Solar Activity Years. Remote Sens. 2022, 14, 860. [Google Scholar] [CrossRef]
- Luo, W.; Liu, Z.; Li, M. A preliminary evaluation of the performance of multiple ionospheric models in low- and mid-latitude regions of China in 2010–2011. GPS Solut. 2014, 18, 297–308. [Google Scholar] [CrossRef]
- Wan, Q.; Ma, G.; Li, J.; Wang, X.; Fan, J.; Li, Q.; Lu, W. A comparison of GPS-TEC with IRI-TEC at low latitudes in China in 2006. Adv. Space Res. 2017, 60, 250–256. [Google Scholar] [CrossRef]
- Xiang, Y.; Yuan, Y.; Wang, N. Comparison of IRI-2012 and Rapid GIMs with GNSS-Derived TEC over China. In Proceedings of the China Satellite Navigation Conference (CSNC) 2014 Proceedings: Volume II, Nanjing, China, 21–23 May 2014; Springer: Berlin/Heidelberg, Germany, 2014; pp. 465–476. [Google Scholar]
- Wang, J.; Yu, Q.; Shi, Y. Comparison of observed hmF2 and the IRI-2020 model for six stations in East Asia during the declining phase of the solar cycle 24. Adv. Space Res. 2024, 73, 2418–2432. [Google Scholar] [CrossRef]
- Zhu, P.; Xie, C.; Jiang, C.; Yang, G.; Liu, J.; Li, Z.; Zhao, Z. Ionospheric Behavior of foF2 over Chinese EIA Region and Its Comparison with IRI-2016. Universe 2020, 6, 122. [Google Scholar] [CrossRef]
- Chen, M.; Liu, L.; Xu, C.; Wang, Y. Improved IRI-2016 model based on BeiDou GEO TEC ingestion across China. GPS Solut. 2019, 24, 20. [Google Scholar] [CrossRef]
- Komjathy, A.; Langley, R.B.; Bilitza, D. Ingesting GPS-derived TEC data into the International Reference Ionosphere for single frequency radar altimeter ionospheric delay corrections. Adv. Space Res. 1998, 22, 793–801. [Google Scholar] [CrossRef]
- Habarulema, J.B.; Ssessanga, N. Adapting a climatology model to improve estimation of ionosphere parameters and subsequent validation with radio occultation and ionosonde data. Space Weather 2017, 15, 84–98. [Google Scholar] [CrossRef]
- Liu, L.; Yao, Y.; Zou, S.; Kong, J.; Shan, L.; Zhai, C.; Zhao, C.; Wang, Y. Ingestion of GIM-derived TEC data for updating IRI-2016 driven by effective IG indices over the European region. J. Geod. 2019, 93, 1911–1930. [Google Scholar] [CrossRef]
- Yao, Y.; Chen, X.; Kong, J.; Zhou, C.; Liu, L.; Shan, L.; Guo, Z. An Updated Experimental Model of IG12 Indices over the Antarctic Region via the Assimilation of IRI2016 with GNSS TEC. IEEE Trans. Geosci. Remote Sens. 2021, 59, 1700–1717. [Google Scholar] [CrossRef]
- Liu, R.Y.; Smith, P.A.; King, J.W. A new solar index which leads to improved foF2 predictions using the CCIR Atlas. ITU Telecommun. J. 1983, 50, 408–414. [Google Scholar]
- Bilitza, D.; Pezzopane, M.; Truhlik, V.; Altadill, D.; Reinisch, B.W.; Pignalberi, A. The International Reference Ionosphere Model: A Review and Description of an Ionospheric Benchmark. Rev. Geophys. 2022, 60, e2022RG000792. [Google Scholar] [CrossRef]
- Okoh, D.; Mckinnell, L.; Cilliers, P.; Okeke, P. Using GPS-TEC data to calibrate VTEC computed with the IRI model over Nigeria. Adv. Space Res. 2013, 52, 1791–1797. [Google Scholar] [CrossRef]
- Ssessanga, N.; Kim, Y.; Kim, E.; Kim, J. Regional optimization of the IRI-2012 output (TEC, foF2) by using derived GPS-TEC. J. Korean Phys. Soc. 2015, 66, 1599–1610. [Google Scholar] [CrossRef]
- Zhang, W.; Huo, X.; Yuan, Y.; Li, Z.; Wang, N. Algorithm Research Using GNSS-TEC Data to Calibrate TEC Calculated by the IRI-2016 Model over China. Remote Sens. 2021, 13, 4002. [Google Scholar] [CrossRef]
- Zhao, X.; Ning, B.; Zhang, M.-L.; Hu, L. Comparison of the ionospheric F2 peak height between ionosonde measurements and IRI2016 predictions over China. Adv. Space Res. 2017, 60, 1524–1531. [Google Scholar] [CrossRef]
- Potula, B.S.; Chu, Y.-H.; Uma, G.; Hsia, H.-P.; Wu, K.-H. A global comparative study on the ionospheric measurements between COSMIC radio occultation technique and IRI model. J. Geophys. Res. Space Phys. 2011, 116. [Google Scholar] [CrossRef]
- Yang, K.F.; Chu, Y.H.; Su, C.L.; Ko, H.T.; Wang, C.Y. An Examination of FORMOSAT-3/COSMIC Ionospheric Electron Density Profile: Data Quality Criteria and Comparisons with the IRI Model. Terr. Atmos. Ocean. Sci. 2009, 20, 193–206. [Google Scholar] [CrossRef]
Disclaimer/Publisher’s Note: The statements, opinions and data contained in all publications are solely those of the individual author(s) and contributor(s) and not of MDPI and/or the editor(s). MDPI and/or the editor(s) disclaim responsibility for any injury to people or property resulting from any ideas, methods, instructions or products referred to in the content. |
© 2024 by the authors. Licensee MDPI, Basel, Switzerland. This article is an open access article distributed under the terms and conditions of the Creative Commons Attribution (CC BY) license (https://creativecommons.org/licenses/by/4.0/).