Article

The Comprehensive Vertical Ozone Observation Experiment and Result Analysis of Ozone Lidars in China

by
Haiyang Cai
1,2,3,
Junli Jin
1,*,
Shanshan Lv
1,
Xiaorui Song
4,
Ningzhang Wang
5,
Guicai Long
6,
Wen Shi
5,
Zhengxin Qin
7 and
Kui Wu
8
1
CMA Meteorological Observation Center, Beijing 100081, China
2
Akedala Regional Atmospheric Background Station, Altay 836500, China
3
Akedala Atmospheric Background Field Science Experiment Base China Meteorological Administration, Urumqi 830002, China
4
Shangri-La National Atmospheric Background Station, Diqing 674400, China
5
China Atmospheric Background Benchmark Observatory, Xining 810001, China
6
Wuzhou Meteorological Bureau, Wuzhou 543002, China
7
Jinsha National Atmospheric Background Station, Wuhan 430074, China
8
Xilin Gol League Meteorological Bureau, Xilinhot 026000, China
*
Author to whom correspondence should be addressed.
Atmosphere 2024, 15(6), 690; https://doi.org/10.3390/atmos15060690
Submission received: 9 May 2024 / Revised: 27 May 2024 / Accepted: 30 May 2024 / Published: 6 June 2024
(This article belongs to the Special Issue Ozone Pollution and Effects in China)

Abstract

:
To evaluate the detection performance of ozone lidars, the first comprehensive vertical ozone observation experiment in China was conducted at the Xilinhot National Climate Observatory in Inner Mongolia from August to December 2023. The ozone profiles and concentrations of four ozone lidars were systematically compared and assessed with ozone radiosonde measurements and ozone analyzer observations both at ground-based stations and on an Unmanned Aerial Vehicle. The results show that the relative deviations of four ozone lidars are less than 20% compared with ozone radiosonde measurements at a height between 150 and 400 m. Ozone lidars have better behavior between 400 m and 2000 m than the lower altitude, with the deviation within 10% and the correlation coefficient around 0.8. However, relative deviations of lidars increased with altitude above 2000 m. The surface ozone concentrations observed using ozone lidars agreed well with the ground-based ozone analyzer, especially during periods with ozone concentrations higher than 40 µg·m−3. The correlation coefficients for most models of ozone lidar are higher than 0.53. A further investigation of the influence of precipitation events on ozone lidar measurement has been conducted, which revealed that thick cloud layers, low cloud base, and an intensive precipitation event with large raindrop particles can result in high anomalies and reduce the inversion accuracy of the ozone lidar. During the experiment, four ozone lidars were assessed quantitatively according to the comprehensive performance, which could help to improve inversion algorithms and the system design of this promising technique.

1. Introduction

Ozone is one of the important trace constituents of the Earth’s atmosphere. Although its concentrations vary greatly along with altitude, it plays a significant role in atmospheric chemistry [1]. The formation and variations in near-surface ozone concentration have become a cutting-edge topic in atmospheric environmental research. On one hand, studies have shown that high concentrations of near-surface ozone can pose serious threats to human health, plant growth, and the ecological environment [2,3,4]. On the other hand, the decrease in ozone concentration in the stratosphere brings severe consequences to the ecology on Earth. Conducting observations of the vertical concentration of ozone is of great importance for studying the evolution of tropospheric ozone concentrations, pollution processes, and their origins [5].
In China, the current ground-level ozone monitoring network consists of traditional monitoring equipment such as ozone analyzers, which can accurately measure the concentration of ozone in the air. However, it is limited to obtaining ozone concentration changes within a local and small geographical area. In recent years, with the rapid development of analytical instruments combined with satellite remote sensing, radiosonde balloons, and meteorological gradient towers, the vertical distribution characteristics of some aerosols and ozone can also be observed. However, due to temporal and spatial factors, these devices still have shortcomings [6]. Satellite remote sensing directly acquires a total column of atmospheric pollution, and there are certain errors in the inversion of near-surface pollution [7]. Ozone radiosondes are widely used to obtain atmospheric ozone distribution profiles from the ground to the upper troposphere [8,9,10], but they are limited by factors such as the quality of the radiosonde releases, background current, and the efficiency of the air pump. This can lead to measurement precision, accuracy, and response issues at different altitudes or under different ozone concentration conditions [11,12], not to mention the high cost and low temporal resolution of ozone sounding. Meteorological gradient towers can be equipped with the continuous time-based observations of an ozone analyzer at observational platforms of different heights. High ozone concentration precision can be offered, but is restricted to only a limited number of vertical height layers [13,14].
Ozone lidar uses the differential absorption of laser wavelengths by ozone to determine the concentration of ozone along the common path of a pulsed laser. It can obtain vertical profiles of ozone concentration with high temporal and spatial resolution, and has become one of the effective methods for measuring ozone profiles. The technique has been widely applied in environmental monitoring and satellite validation in different regions worldwide [15,16]. It not only enables the effective monitoring of polluted areas, determining their sources and transport, but it also aids in making decisions to effectively prevent impending significant pollution events. However, more and more brands and models of ozone lidar have appeared with different technical approaches and retrieval algorithms. Researchers have found a various range of differences, even in ozone vertical profiles, acquired using co-located ozone lidars [17,18,19,20,21]. Therefore, there is an urgent need to conduct comparative observation experiments on the detection capabilities and precision of ozone lidar, to comprehensively evaluate the performance of ozone lidar detection, and to provide a basis and support for the development of related technical standards and norms.
Here, we report on the first comprehensive vertical ozone observation experiment in China, organized by CMA Meteorological Observation Center and conducted from August to December 2023 at the Xilinhot National Climate Observatory in Inner Mongolia. The paper is organized as follows: in Section 2, the experimental site, the instrument and methods are elaborated. In Section 3, the comparative studies of four models of ozone lidar, as well as comparisons with ozone radiosondes, a near-surface ozone analyzer, and ozone observations on an unmanned aerial vehicle (UAV for short) are presented, assessing the detection performance of ozone lidar multi-dimensionally. Finally, conclusions and discussions on the further improvement of the detection accuracy of ozone lidar are given.

2. Experiment and Data

2.1. Experimental Site

The geographic location of the site and the experimental field are shown in Figure 1. The Xilinhot National Climate Observatory (43°57′00″ N, 116°07′11″ E, 1003.5 m asl.) is located 25 km northeast of Xilinhot City in the Inner Mongolia Autonomous Region in China, situated within the mid-latitude westerlies zone and characterized by a temperate semi-arid continental monsoon climate. The station covers an area of 10 hectares, with no tall obstructions within a 2000 m radius around it. The terrain is flat, open, and far from urban regions. There are relatively few pollution sources around, indicated by the ozone column distribution analysis based on satellite detector Atmospheric Infrared Sounder (AIRS for short) from Aqua, NASA, averaged from 2021 to 2023 (Figure 1b).

2.2. Instruments and Methods

2.2.1. Ozone Lidar

Ozone lidar measures the spatiotemporal distribution of ozone concentration through utilizing the differences in absorption characteristics of ozone at two or more wavelengths. It emits two pulsed lasers along the same optical path into the atmosphere, where one laser wavelength is on the absorption line of ozone, undergoing strong absorption by it, while the wavelength of the other laser is on the edge of the absorption line or outside it, where absorption by ozone is small or non-existent. For these two wavelengths, the extinction by other gas molecules and aerosols as well as the backscattering effect on the two lasers are essentially the same. The photoelectric receiving system’s parameters for receiving these two beams of light are also basically identical, and the emission energy of the two lasers is constant. Therefore, the difference in echo intensity between the two lasers is mainly caused by the absorption of ozone molecules. The ozone mass concentration is then retrieved based on the difference in echo intensity at the two wavelengths, combined with the differential absorption lidar equation [22].
Four different brands and models of ozone lidar participated in the comparative observation experiment, labeled as L1, L2, L3, and L4 (not corresponding to location of ozone lidars). Detailed parameters are presented in Table 1.

2.2.2. Ozone Radiosonde

Ozone radiosonde involves the use of a satellite navigation radiosonde equipped with the CYT-1 type ozone radiosonde sensor (ECC dual-cell type) produced by Aerospace New Meteorological Science and Technology Co., Ltd. in Wuxi, China [23]. The sensor is carried into the sky using a radiosonde balloon, which collects real-time meteorological data such as atmospheric pressure, temperature, humidity, partial pressure of ozone, and positional information from near the ground to the burst height of balloon. The data collected are transmitted back to ground receiving equipment, where they are received and demodulated using the radiosonde receiver.
The Xilinhot National Climate Observatory conducts ozone radiosonde observations punctually at 13:15 Beijing Time every Wednesday. If the launch cannot be performed due to unforeseen reasons, it is postponed to the same time on Thursday.

2.2.3. Other Observations

The Xilinhot Municipal Environmental Protection Monitoring Station (EPS for short), located approximately 2.3 km southwest of the Xilinhot National Climate Observatory, and the Xilinhot Municipal Government Monitoring Station (MGS for short), about 3.8 km southwest, are both equipped with a near-surface ozone analyzer based on the ultraviolet absorption method.
For UAV platforms, a quadrotor DJI M300 model has been selected in this study. This UAV has an operational payload capacity of 2.7 kg, a maximum ascent speed of 5–6 m/s, a maximum descent speed of 4–5 m/s, a maximum flight altitude of 5000 m, and a payload hover time of 30 min. The UAV platform is equipped with the POM pocket-size ultraviolet ozone analyzer (based on the 254 nm absorption band), developed by 2B Technologies.
It is recommended that UAV observations are conducted under clear weather conditions, with high visibility, low wind speeds and no cloud coverage. The observation period was from 13:00 to 15:00 Beijing Time on 1 November 2023, during which ozone mass concentration data along the processes of vertical ascent, descent, as well as hovering at different altitudes (300, 450, and 500 m), were obtained. Specifically, the UAV hovered at 300 m from 13:43:34 to 13:53:34. The vertical ascent from ground to 500 m took place from 14:05:04 to 14:11:44 with uniform velocity, then it hovered at 500 m height for 10 min. The UAV went down to hover at 450 m height from 14:22:24 to 14:32:24. The descent from 450 m to the ground occurred from 14:32:25 to 14:37:54 with uniform velocity.
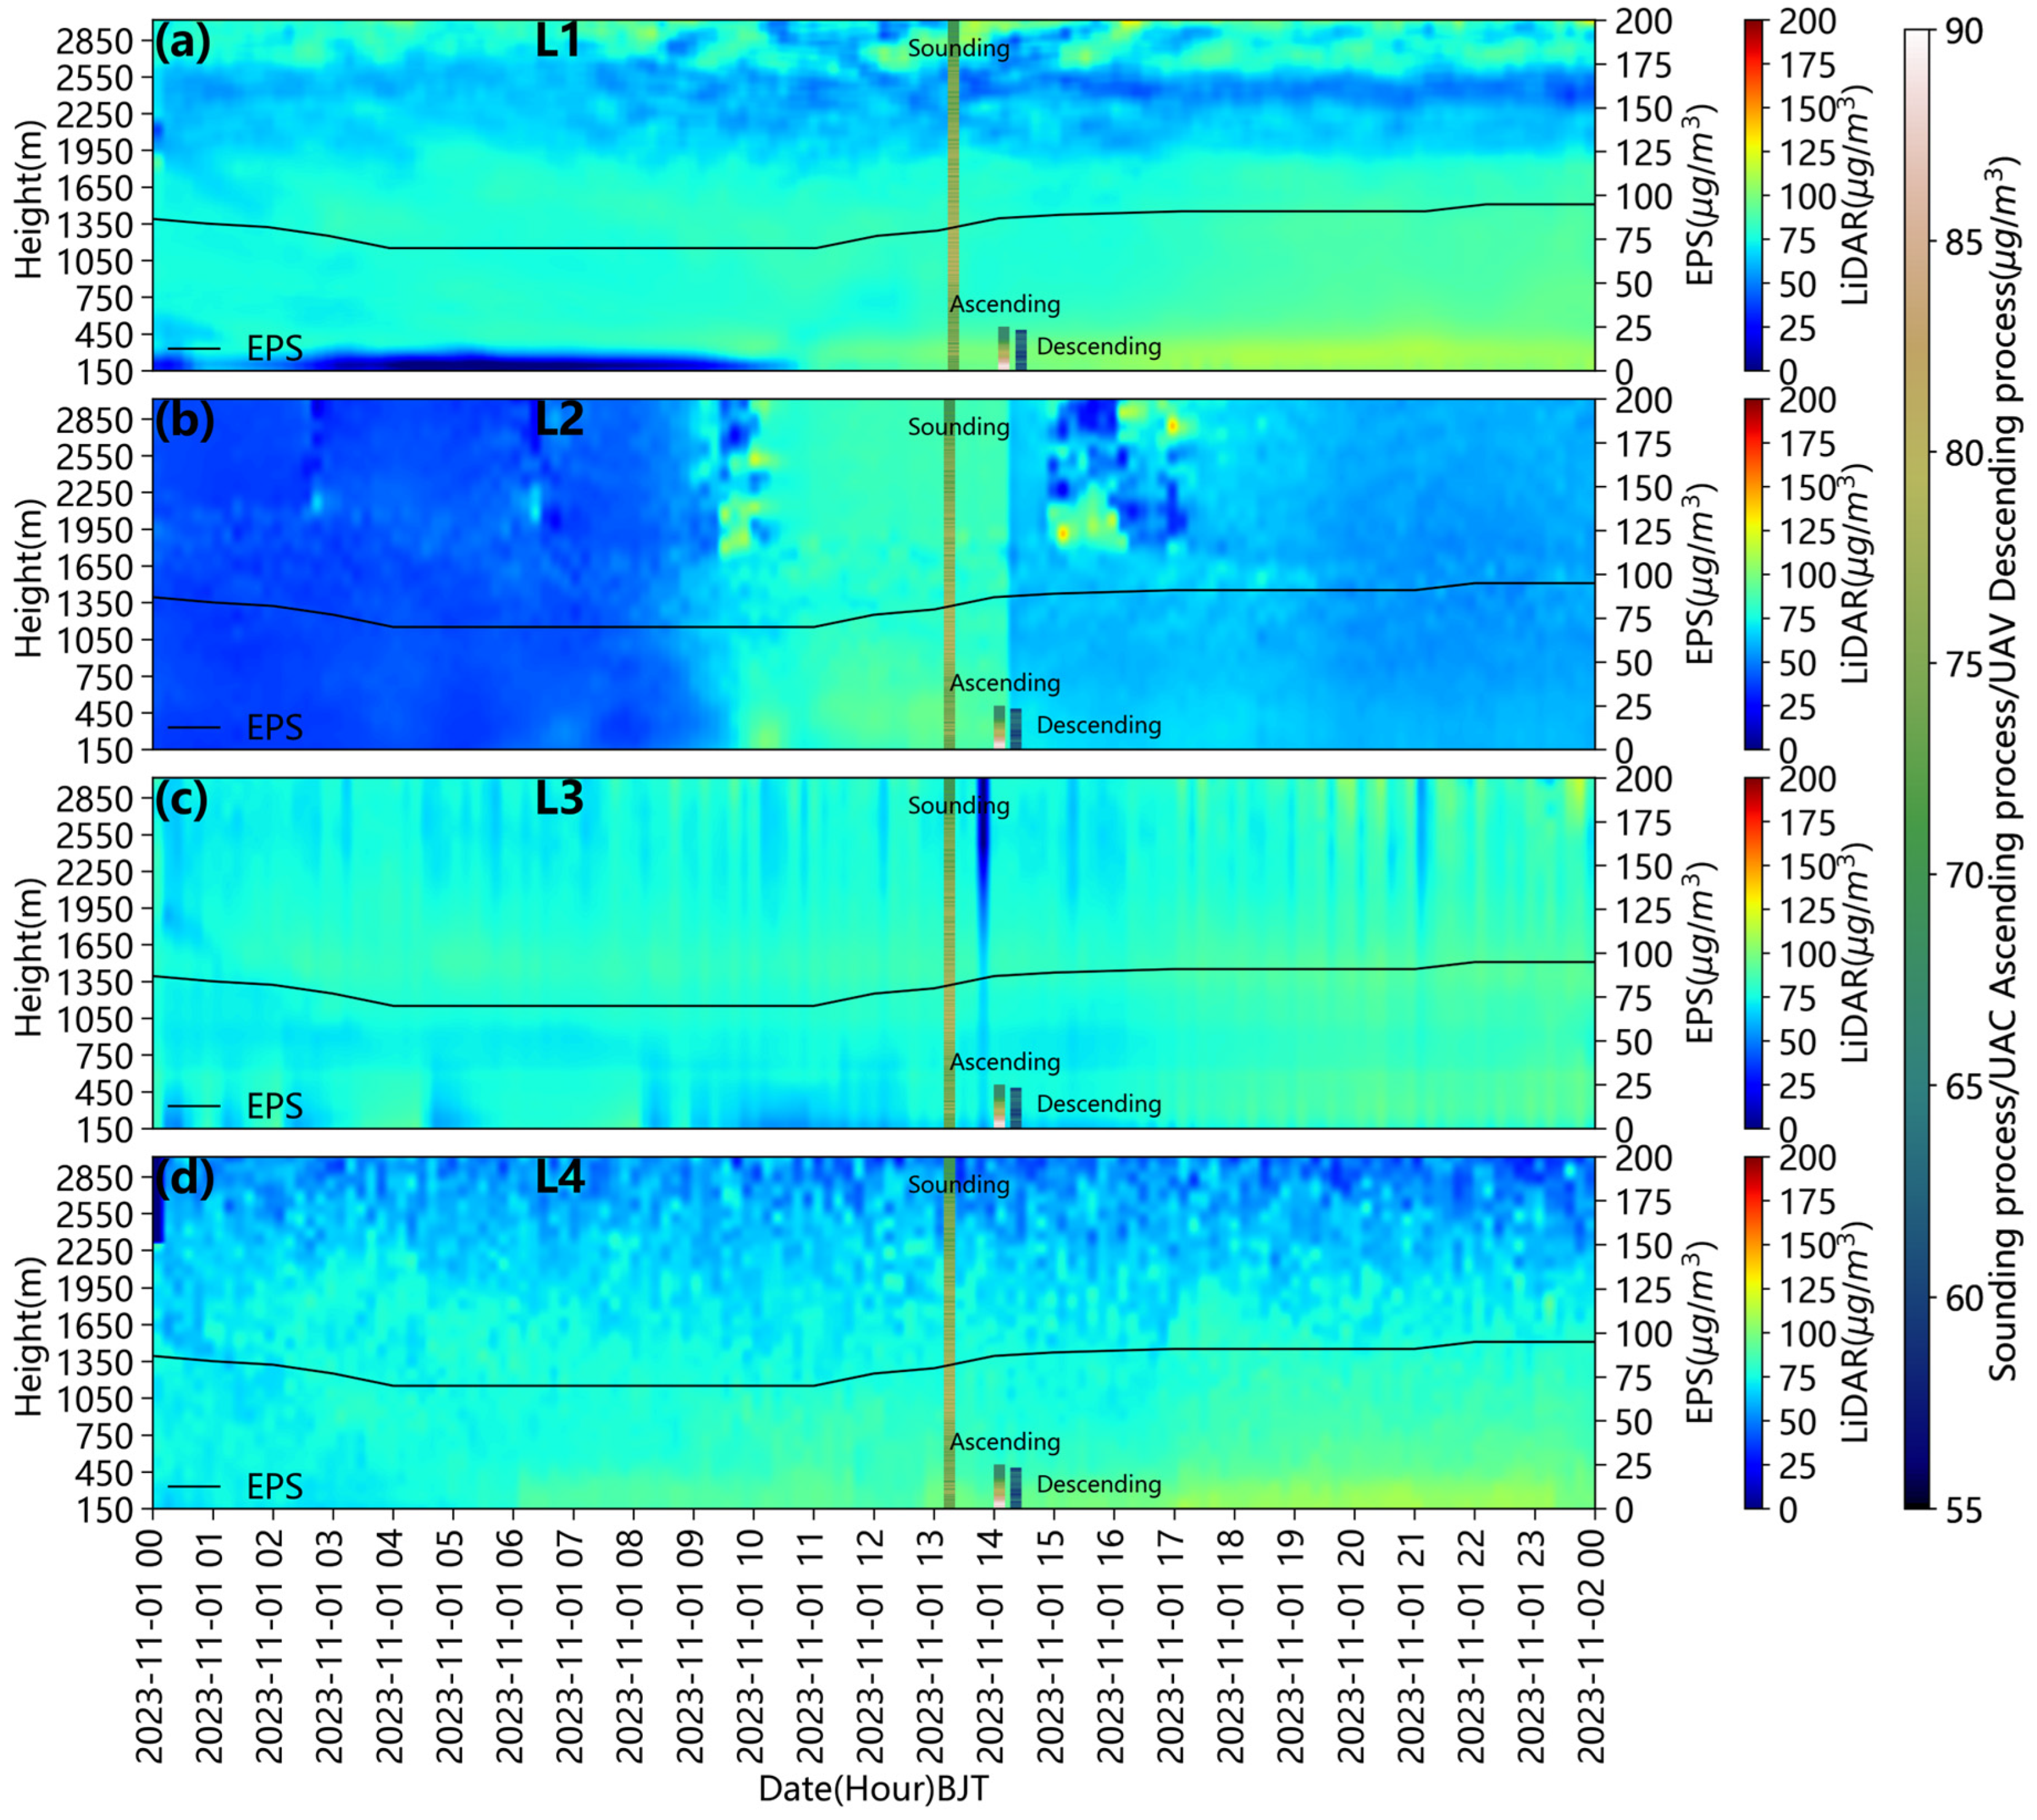
Figure 2 shows the co-current ozone profile time series observed via four models of ozone lidar, ozone radiosonde and ozone analyzer loaded on UAV platform, and surface ozone time series at EPS on 1st November 2023. The color bars of ozone concentrations measured via ozone lidar, radiosonde and analyzer on UAV are set to be different to distinguish their results. The surface ozone variation at EPS was the most consistent with that of model L1, while the profile observed using ozone radiosonde was the closest to that of model L3.

2.3. Data and Methods

Data from four ozone lidar detectors were collected continuously from 18 August 2023 to 31 December 2023, at the Xilinhot National Climate Observatory. During this period, several equipment malfunctions occurred and the respective data have been excluded, including the L1 hard drive failure from 8 October to 11 October, the L2 laser problem from 1 to 12 September, and the L3 power module failure from 27 to 30 August. Due to the different blind zone and detection altitudes of the 4 models of ozone lidars, lidar data from the altitude range of 150–3000 m were selected for comparative analysis in this study. Prior to comparison, the lidar data underwent quality control, including removing any data collected during the equipment malfunctions and going through checks for outliers and continuity. Data outside the range of 0–400 µg·m−3 were discarded. Data with absolute differences between neighboring heights and observation times exceeding 20 µg·m−3 were also removed. This quality control process yielded a more continuous and smoother spatio-temporal distribution of ozone mass concentration data.
A total of 17 successful ozone radiosonde profile measurements at the Xilinhot National Climate Observatory between 24 August 2023 and 31 December 2023 have been taken into account in this study. These ozone profiles underwent quality control checks for outliers and continuity. The partial pressure data of ozone from the altitude range of 0–3000 m were used in the comparison.
The ozone partial pressure data from the ozone radiosonde observations can be converted to ozone mass concentration using the following two equations, which then allows for comparison with the lidar observations:
N = P i P × 10 4
where N represents the ozone volume mixing ratio in parts per billion (ppb); P i stands for the partial pressure of ozone in millipascals (mPa); and P signifies the atmospheric pressure at the altitude of the ozone radiosonde instrument in hectopascals (hPa).
C = N × P × 10 2 × 48 × 273.15 T × 22.4 × 101325
where C denotes the ozone mass concentration in µg·m−3; P again represents the atmospheric pressure at the radiosonde instrument’s altitude in hPa; and T indicates the absolute temperature at that altitude in Kelvin (K).

3. Results

3.1. Comparison between Ozone Lidar and Radiosonde

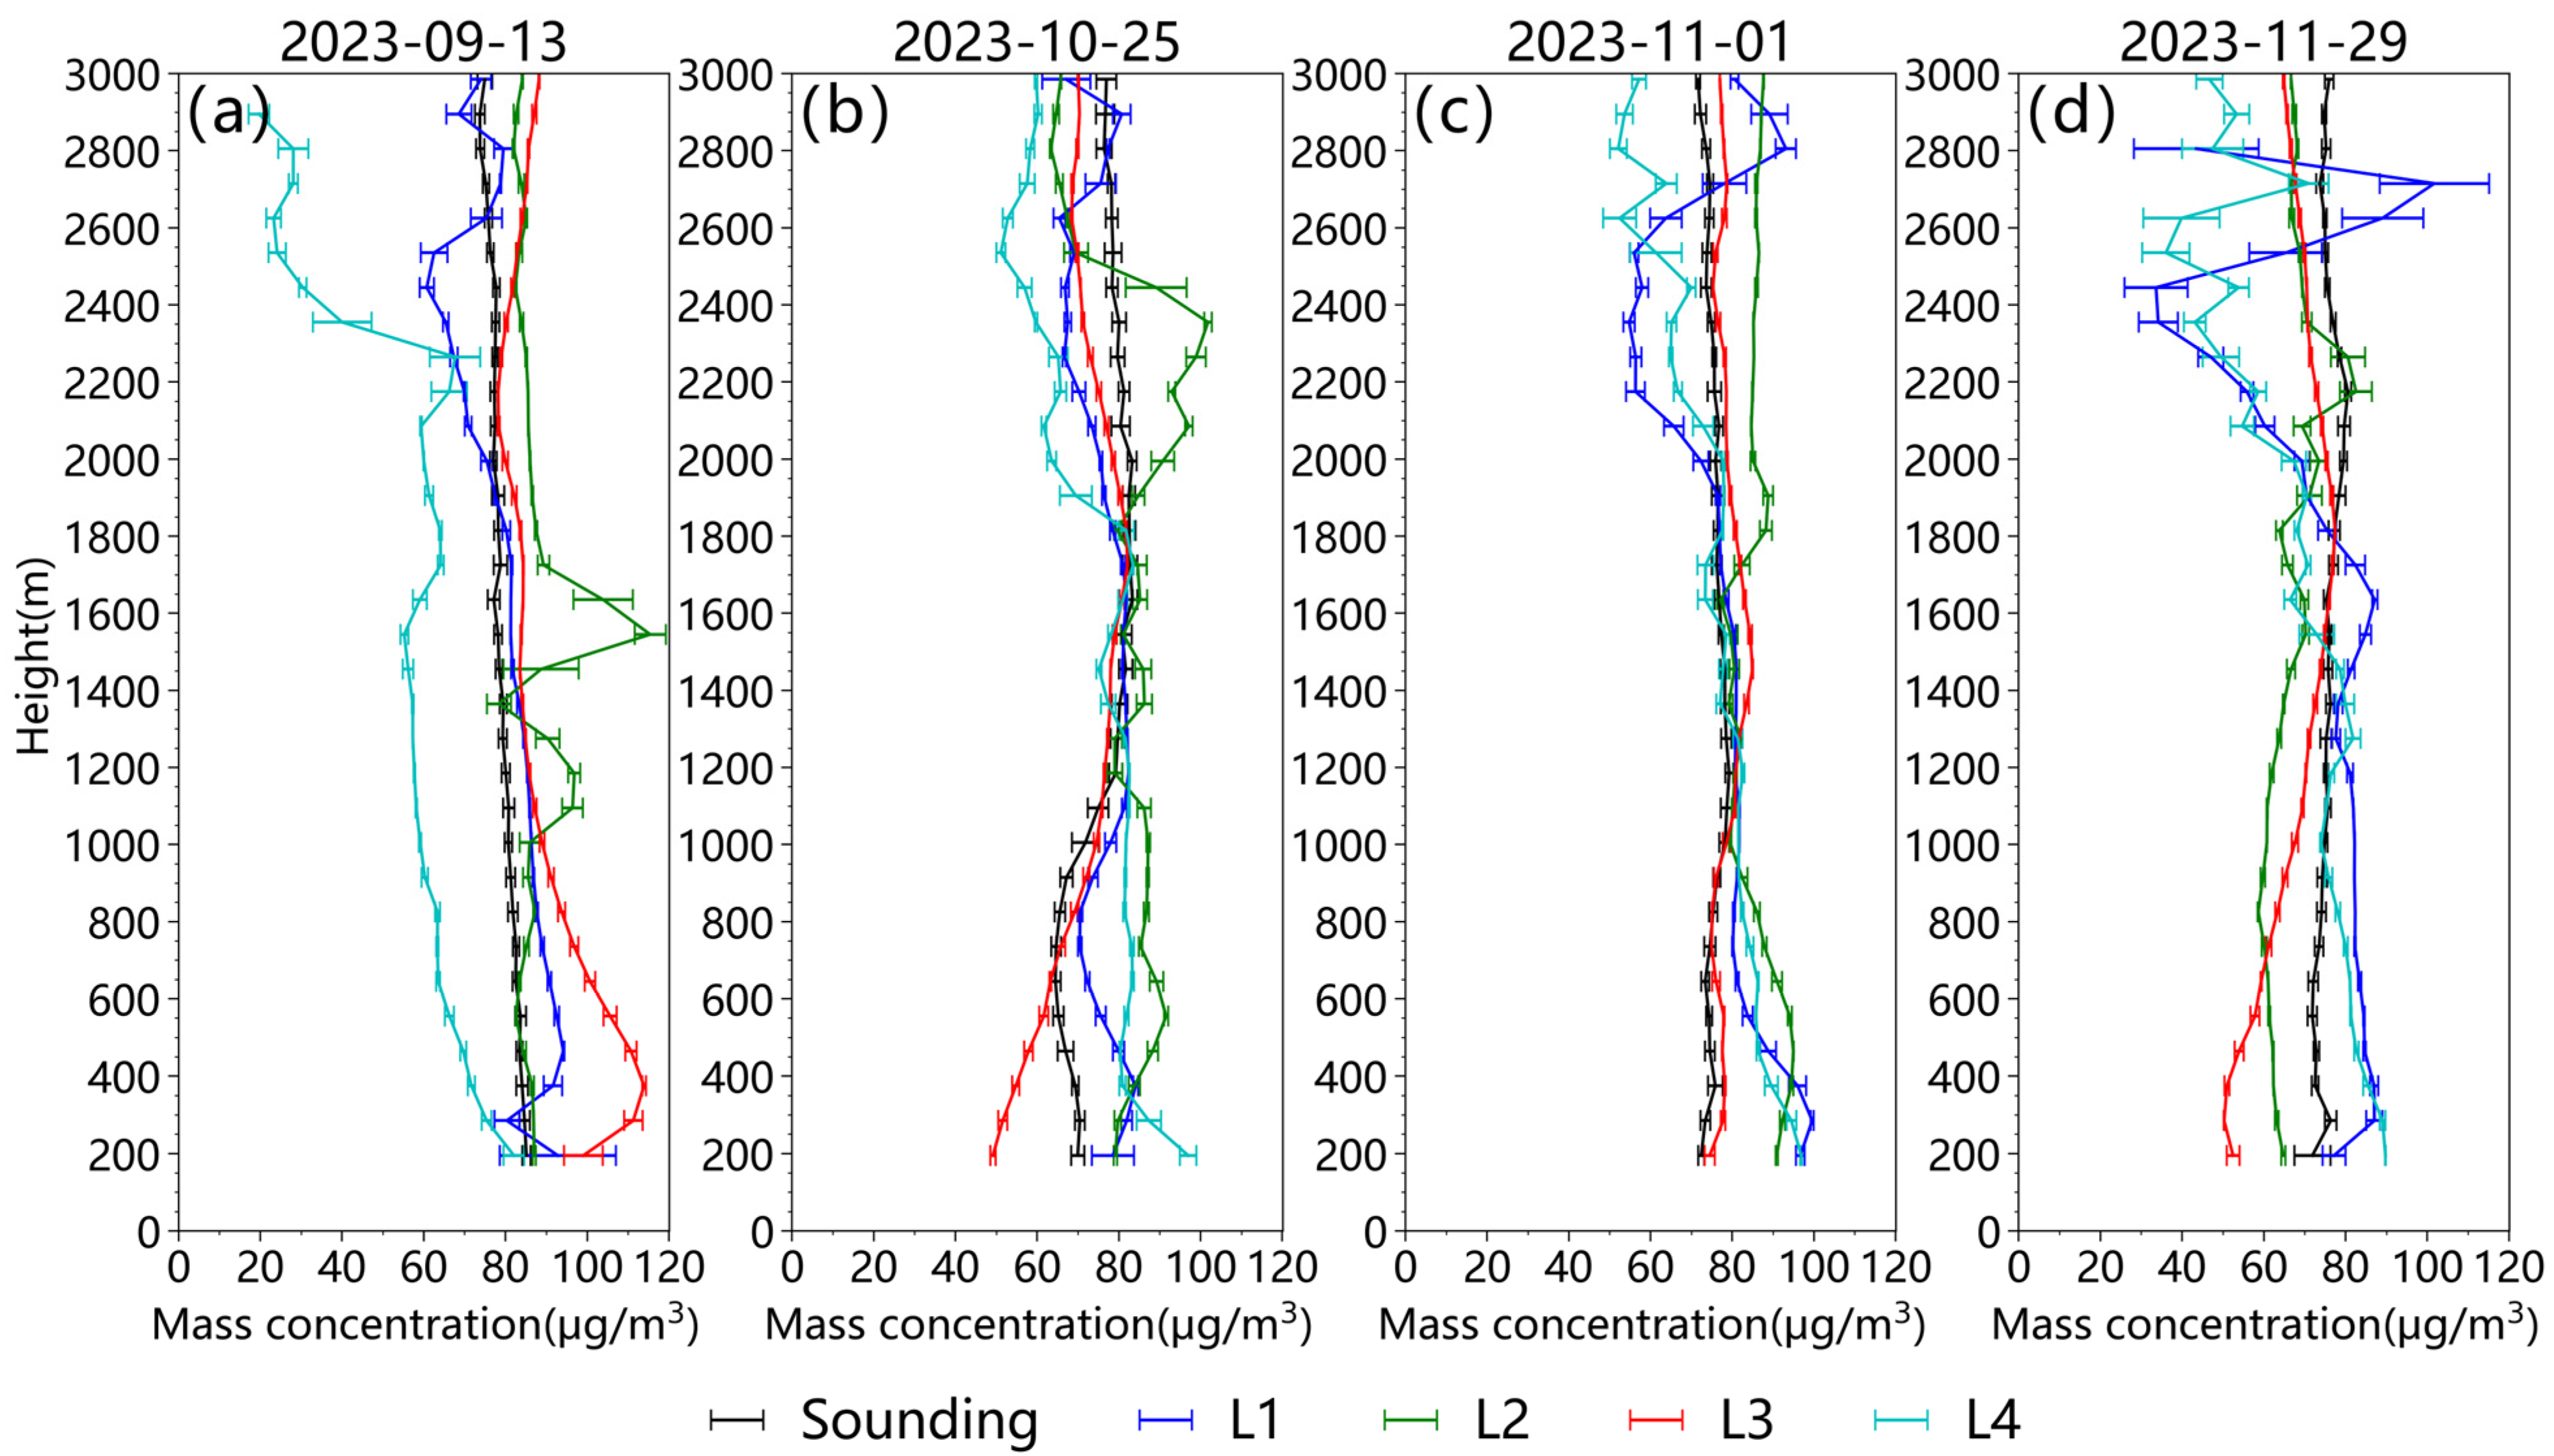
Four clear days (13 September, 25 October, 1 November and 29 November, respectively) were selected to compare ozone lidar data with ozone radiosonde profiles. The comparison focused on the period from the time when the radiosonde balloons were released until they reached an altitude of 3000 m, matching the corresponding time frame of the lidar observations. As shown in Figure 3, the ozone profiles observed using lidar and ozone radiosonde exhibited a good consistency between the altitudes of approximately 400 and 2000 m. The ozone concentration deviation between the ozone lidar and radiosonde data gradually became larger as the detection altitude increased, especially above 2000 m.
A more systematic analysis was also conducted by comparing the ozone lidar data with 17 ozone radiosonde observations (excluding the precipitation event on 24 August 2023). The ozone concentration profiles of both measurements were stratified at vertical intervals of 50 m, setting the ozone radiosonde observations as the reference. Then, the relative deviation and Pearson correlation coefficient were calculated at each height layer and for the four different models of ozone lidar. As can be seen in Figure 4, near the detection blind zone from 150 to 400 m, the average relative deviation of ozone concentration between the ozone lidar and radiosonde data is not significant, mostly within 20%. As altitude increases, the average relative deviation gradually decreases. The deviation is generally within 10% for most models of ozone lidar between the height of 400 and 2000 m, indicating good consistency. Above the height of 2000 m, the average relative deviation and errors increase with altitude. Simultaneously, a Pearson correlation analysis was conducted for the ozone lidar and radiosonde detection results at different altitude layers (Figure 5). Between the height of 150 and 1500 m, the correlation coefficient of ozone lidar with ozone radiosonde data is generally around 0.6~0.9 for most of the models of lidar, excluding model L4. While above the height of 1500 m, the correlation between the two types of observational data gradually decreases as the altitude increases, and the fluctuation amplitude increases as well. Above the height of 2300 m, the correlation coefficients for most models of lidar drop below 0.5, indicating that the detection accuracy of most ozone lidars decreases significantly. In spite of the different settings of the telescope, laser pulses and single laser energy, the four models of ozone lidar apply different signal processing and inversion algorithms. These differences, both in the hardware and software of model L4, have resulted in its outlying performance.
The profile differences between ozone lidars and ozone radiosonde lie in several aspects. On one hand, the ozone lidar is based on a differential absorption principle while the ozone radiosonde applies an electrochemical principle based on the oxidation reaction between ozone and a potassium iodide solution, bringing in different accuracy and response time, etc. On the other hand, the detection range of the ozone lidar is relatively fixed. While the ozone radiosonde system rises freely, the measurement unit will drift to a certain extent from the release point according to the wind speed. The difference in real-time observation orientation between the two techniques results in a deviation of observed concentration values. It is also worth noting that the two techniques are affected by aerosols at a lower altitude, resulting in the inconsistent accuracy of ozone data. Along with the increase in the height, the measurement accuracy of lidar is greatly affected by the signal-to-noise ratio, leading to more observation errors in lidar.

3.2. Comparison of Near-Surface Ozone Concentrations between Ozone Lidar and Ozone Analyzer

Surface ozone measurements were used to verify the accuracy of near-surface ozone detection via the ozone lidar. The surface ozone data observed at EPS, which is the nearest to the Xilinhot National Climate Observatory, were used as the baseline value, while the data from a slightly more distant station, named as MGS, served as the reference value. The time variation in the ozone mass concentration data of the two surface ozone stations and the retrieved ozone concentration at an altitude of 300 m from the ozone lidars were compared from 18 August to 31 November (Figure 6). Since precipitation significantly affects the inversion of ozone lidar data and cannot objectively reflect the actual ozone mass concentration, precipitation periods were excluded based on ground meteorological observations, as the dashed lines and gray shaded areas show in Figure 6.
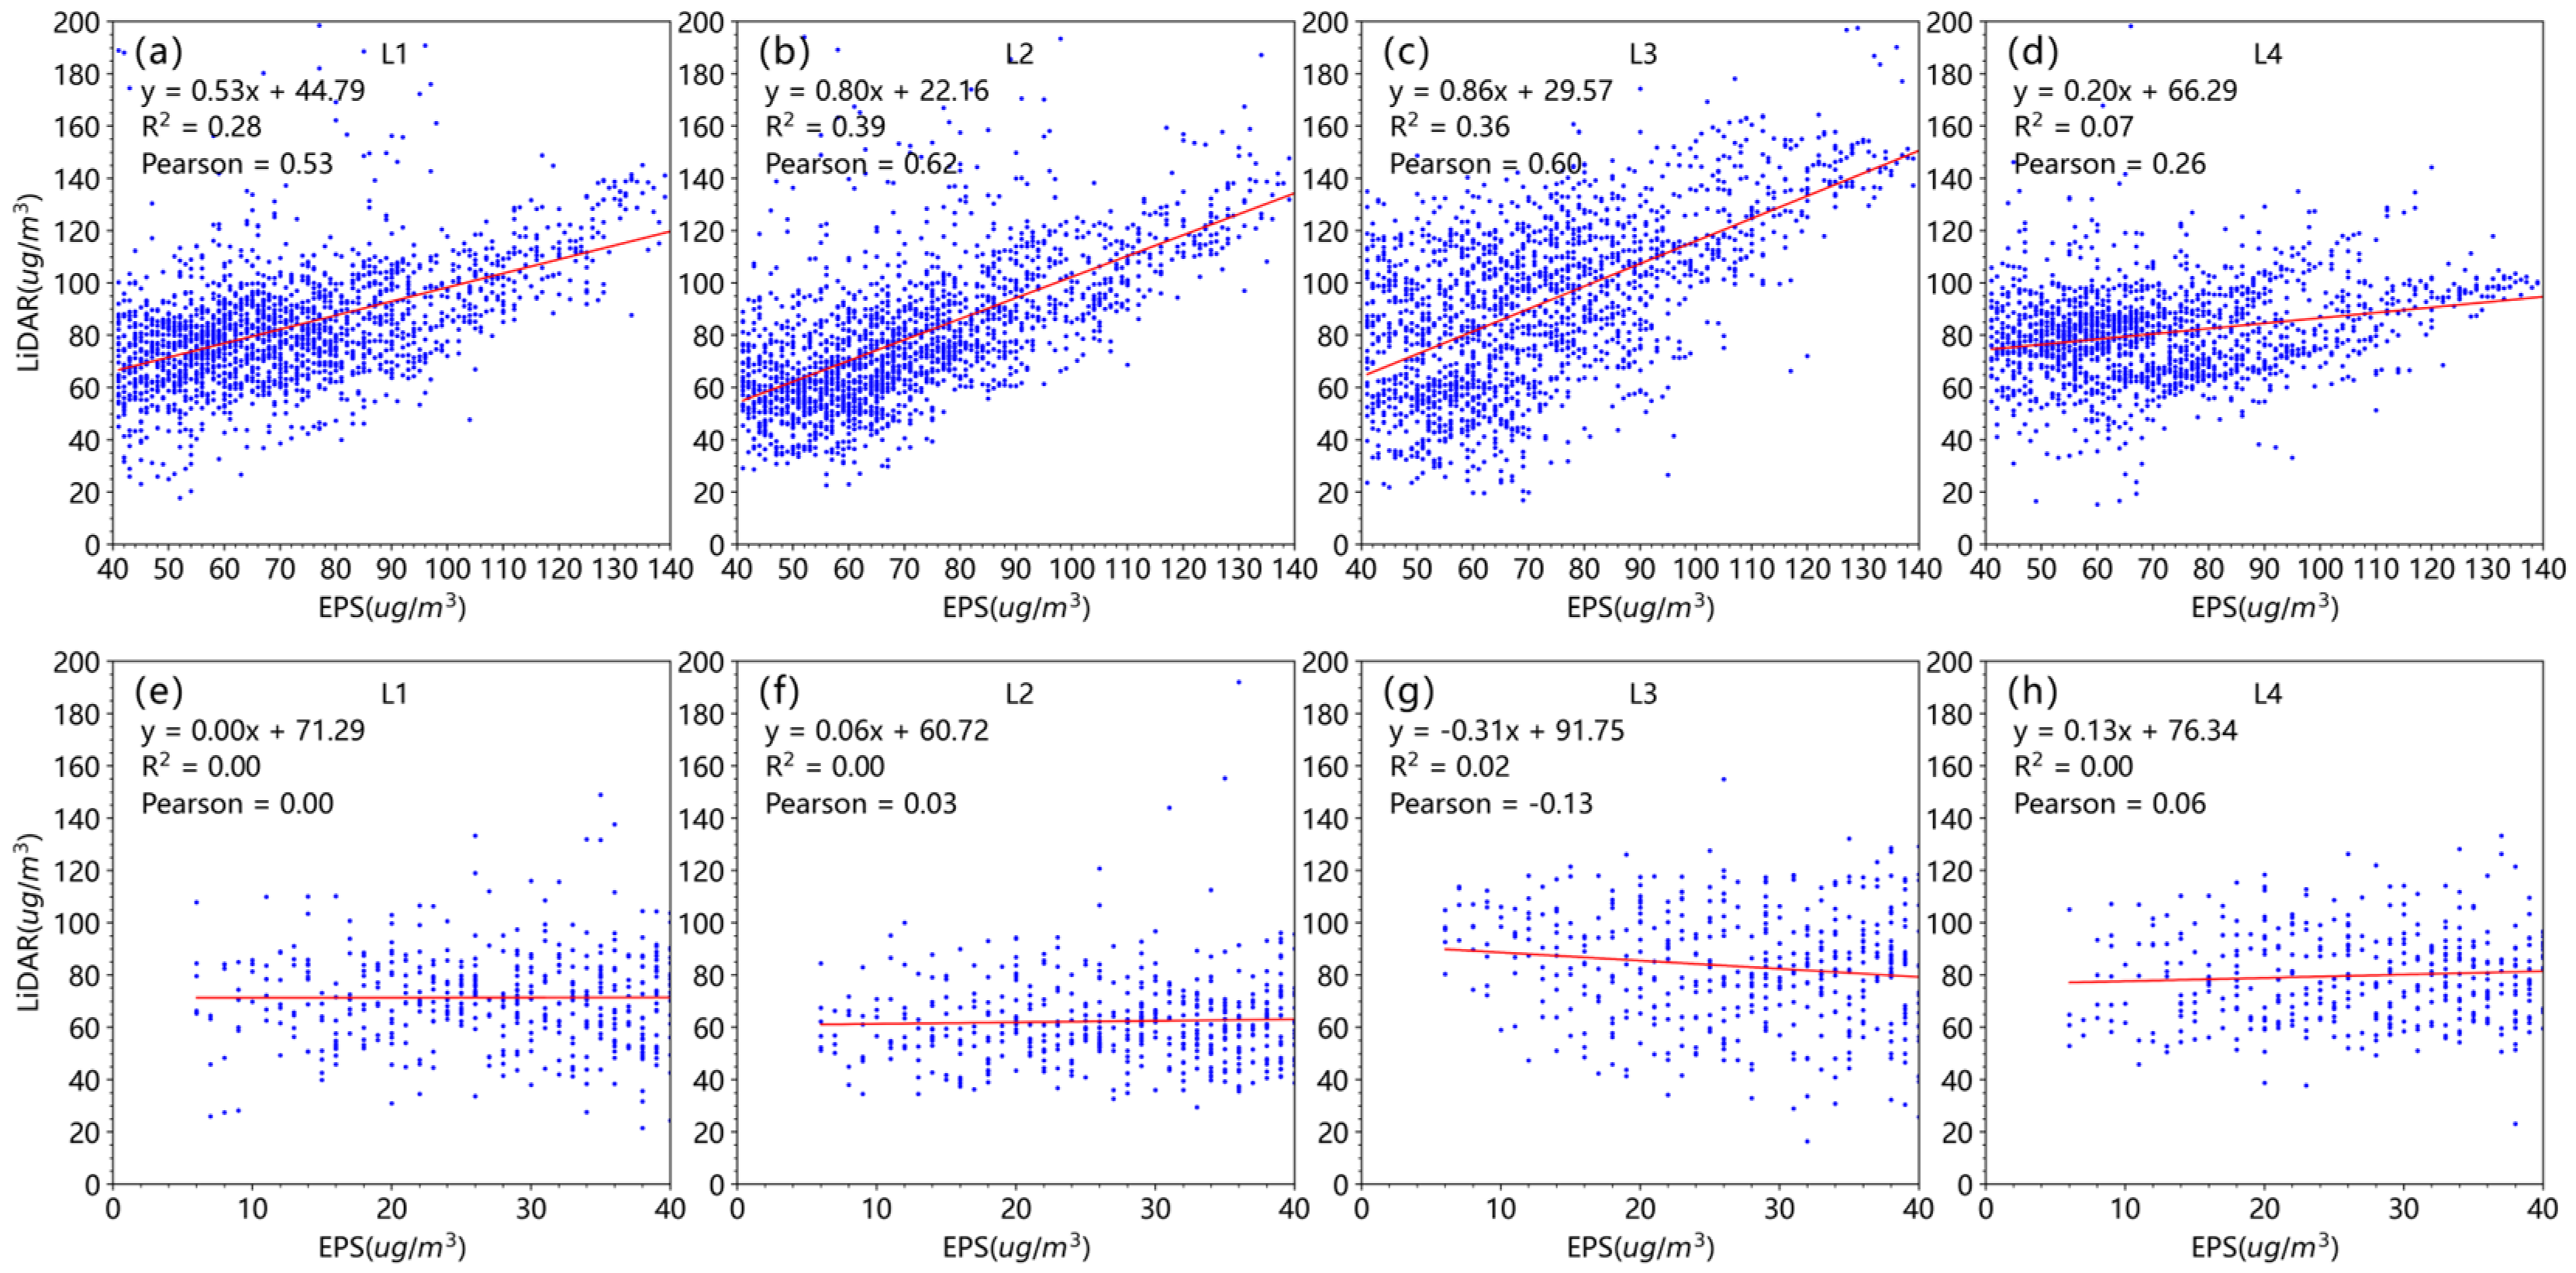
The analysis in Figure 6 indicates generally consistent trends in both sets of data. Specifically, the degree of agreement is the best when the ozone mass concentration is above 40 µg·m−3. It is worth noting that the ozone lidar tends to show higher concentration values shortly before and after precipitation events, due to the influence of lower cloud bases and thicker cloud layers on the accuracy of the inversion. A Pearson correlation analysis of the ozone lidar observations at a height of 300 m and the concurrent ozone mass concentration data observed at EPS (Figure 7a–c) revealed that the correlation coefficients for the ozone lidar model L1, L2 and L3 were 0.53, 0.62 and 0.60, respectively, with ozone concentrations above 40 µg·m−3. Generally speaking, the near-surface ozone variations observed by lidars agreed well with ground-based ozone measurements, especially during periods with concentrations higher than 40 µg·m−3. Two factors have decreased the correlations of these two observations. First of all, lidars tend to overestimate ozone concentrations beneath the boundary layer especially when the actual ozone concentration is below 40 µg·m−3 (Figure 7e–h). This overestimation can be contributed to the interference of background signal noise and aerosol scattering. Secondly, most lidars tend to produce outliers before and after precipitation events, indicated by grey boxes in Figure 6, worsening the observation consistency with surface ozone measurements. The impact analysis of precipitation events on ozone lidar inversion has been further discussed in Section 3.4.

3.3. Comparison of Ozone Lidar with UAV Measurements

A UAV flight with an ozone analyzer was conducted at the same location as the comparative experiment site of the Xilinhot National Climate Observatory on 1st November 2023, from 13:00 to 14:32 Beijing time. The co-current observations of the four models of ozone lidars were quantitatively compared with the ozone observations of the UAV during periods of ascending, descending and hovering at three altitudes.
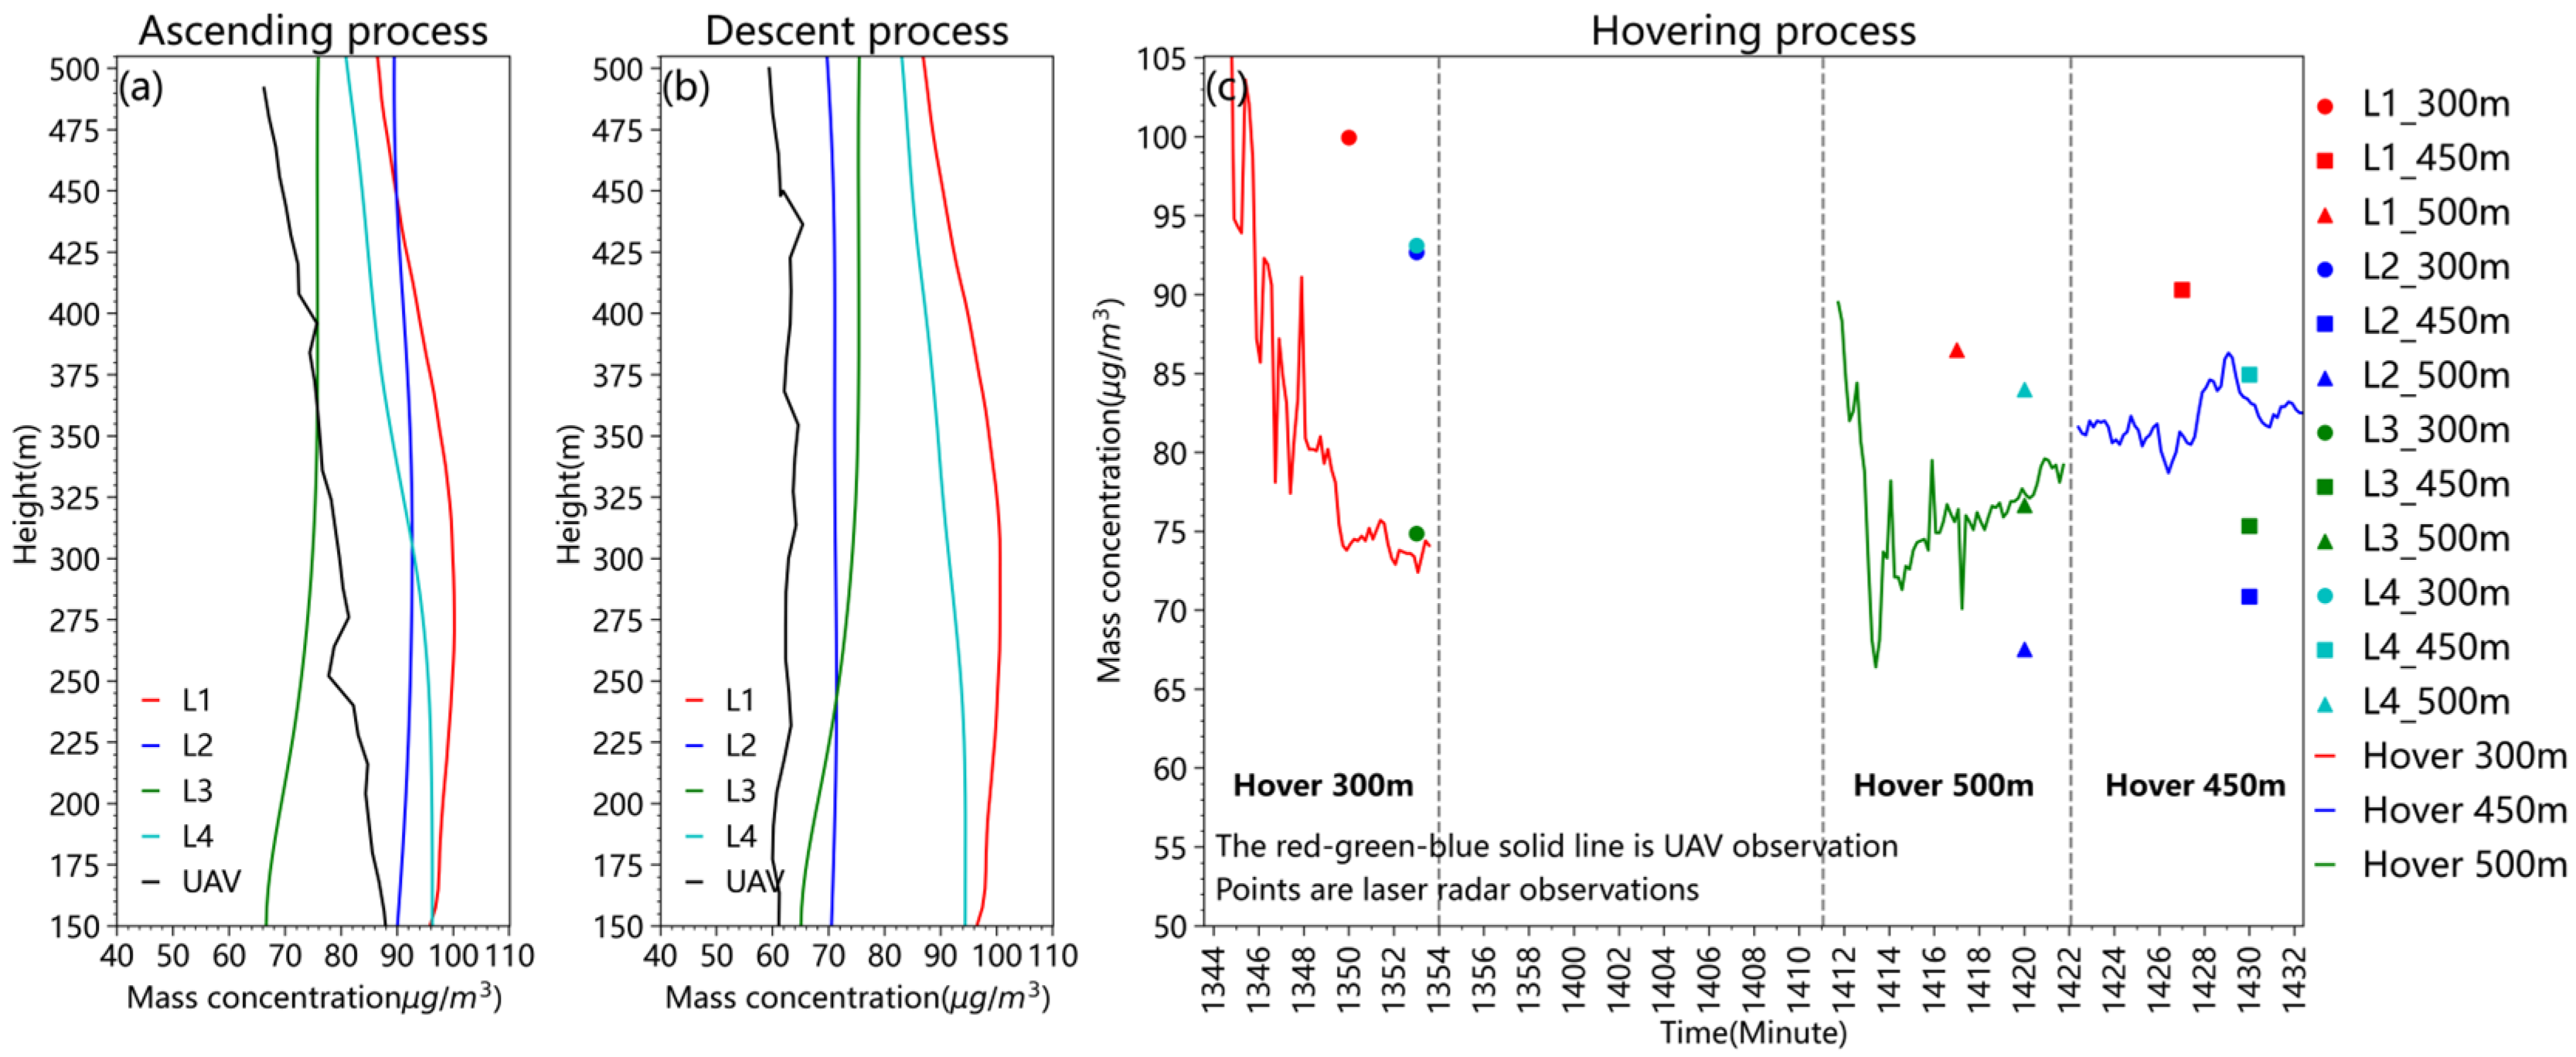
In Table 2 and Figure 8, the ozone profiles and concentrations observed using the ozone lidars and the ozone analyzer on the UAV were generally consistent, especially during the ascending and hovering periods. Specifically, the ozone profiles observed by the analyzer on the UAV were interpolated to a vertical resolution of 7.5 m, the same as that of the ozone lidars. The average relative deviations between the lidar and the UAV measurements were between 0 and 35.1% during the ascending period. During the descending period, the average relative deviations ranged from 6.4% to 61.7%. When hovering at a height of 300 m, the average relative deviations between the ozone lidars and the UAV measurements were between 2.7% and 35.0%. At a height of 450 m, the relative deviations ranged from 2.0% to 14.9%. The consistency increased at 500 m height, and the average relative deviations were between 1.1% and 13.6%. To summarize, the average relative deviations of the ozone profiles observed using lidars and UAV measurements were comparable to that of the ozone sounding beneath the height of 500 m, as suggested in Figure 4.

3.4. Influence Analysis of Precipitation Events on Ozone Lidar Inversion

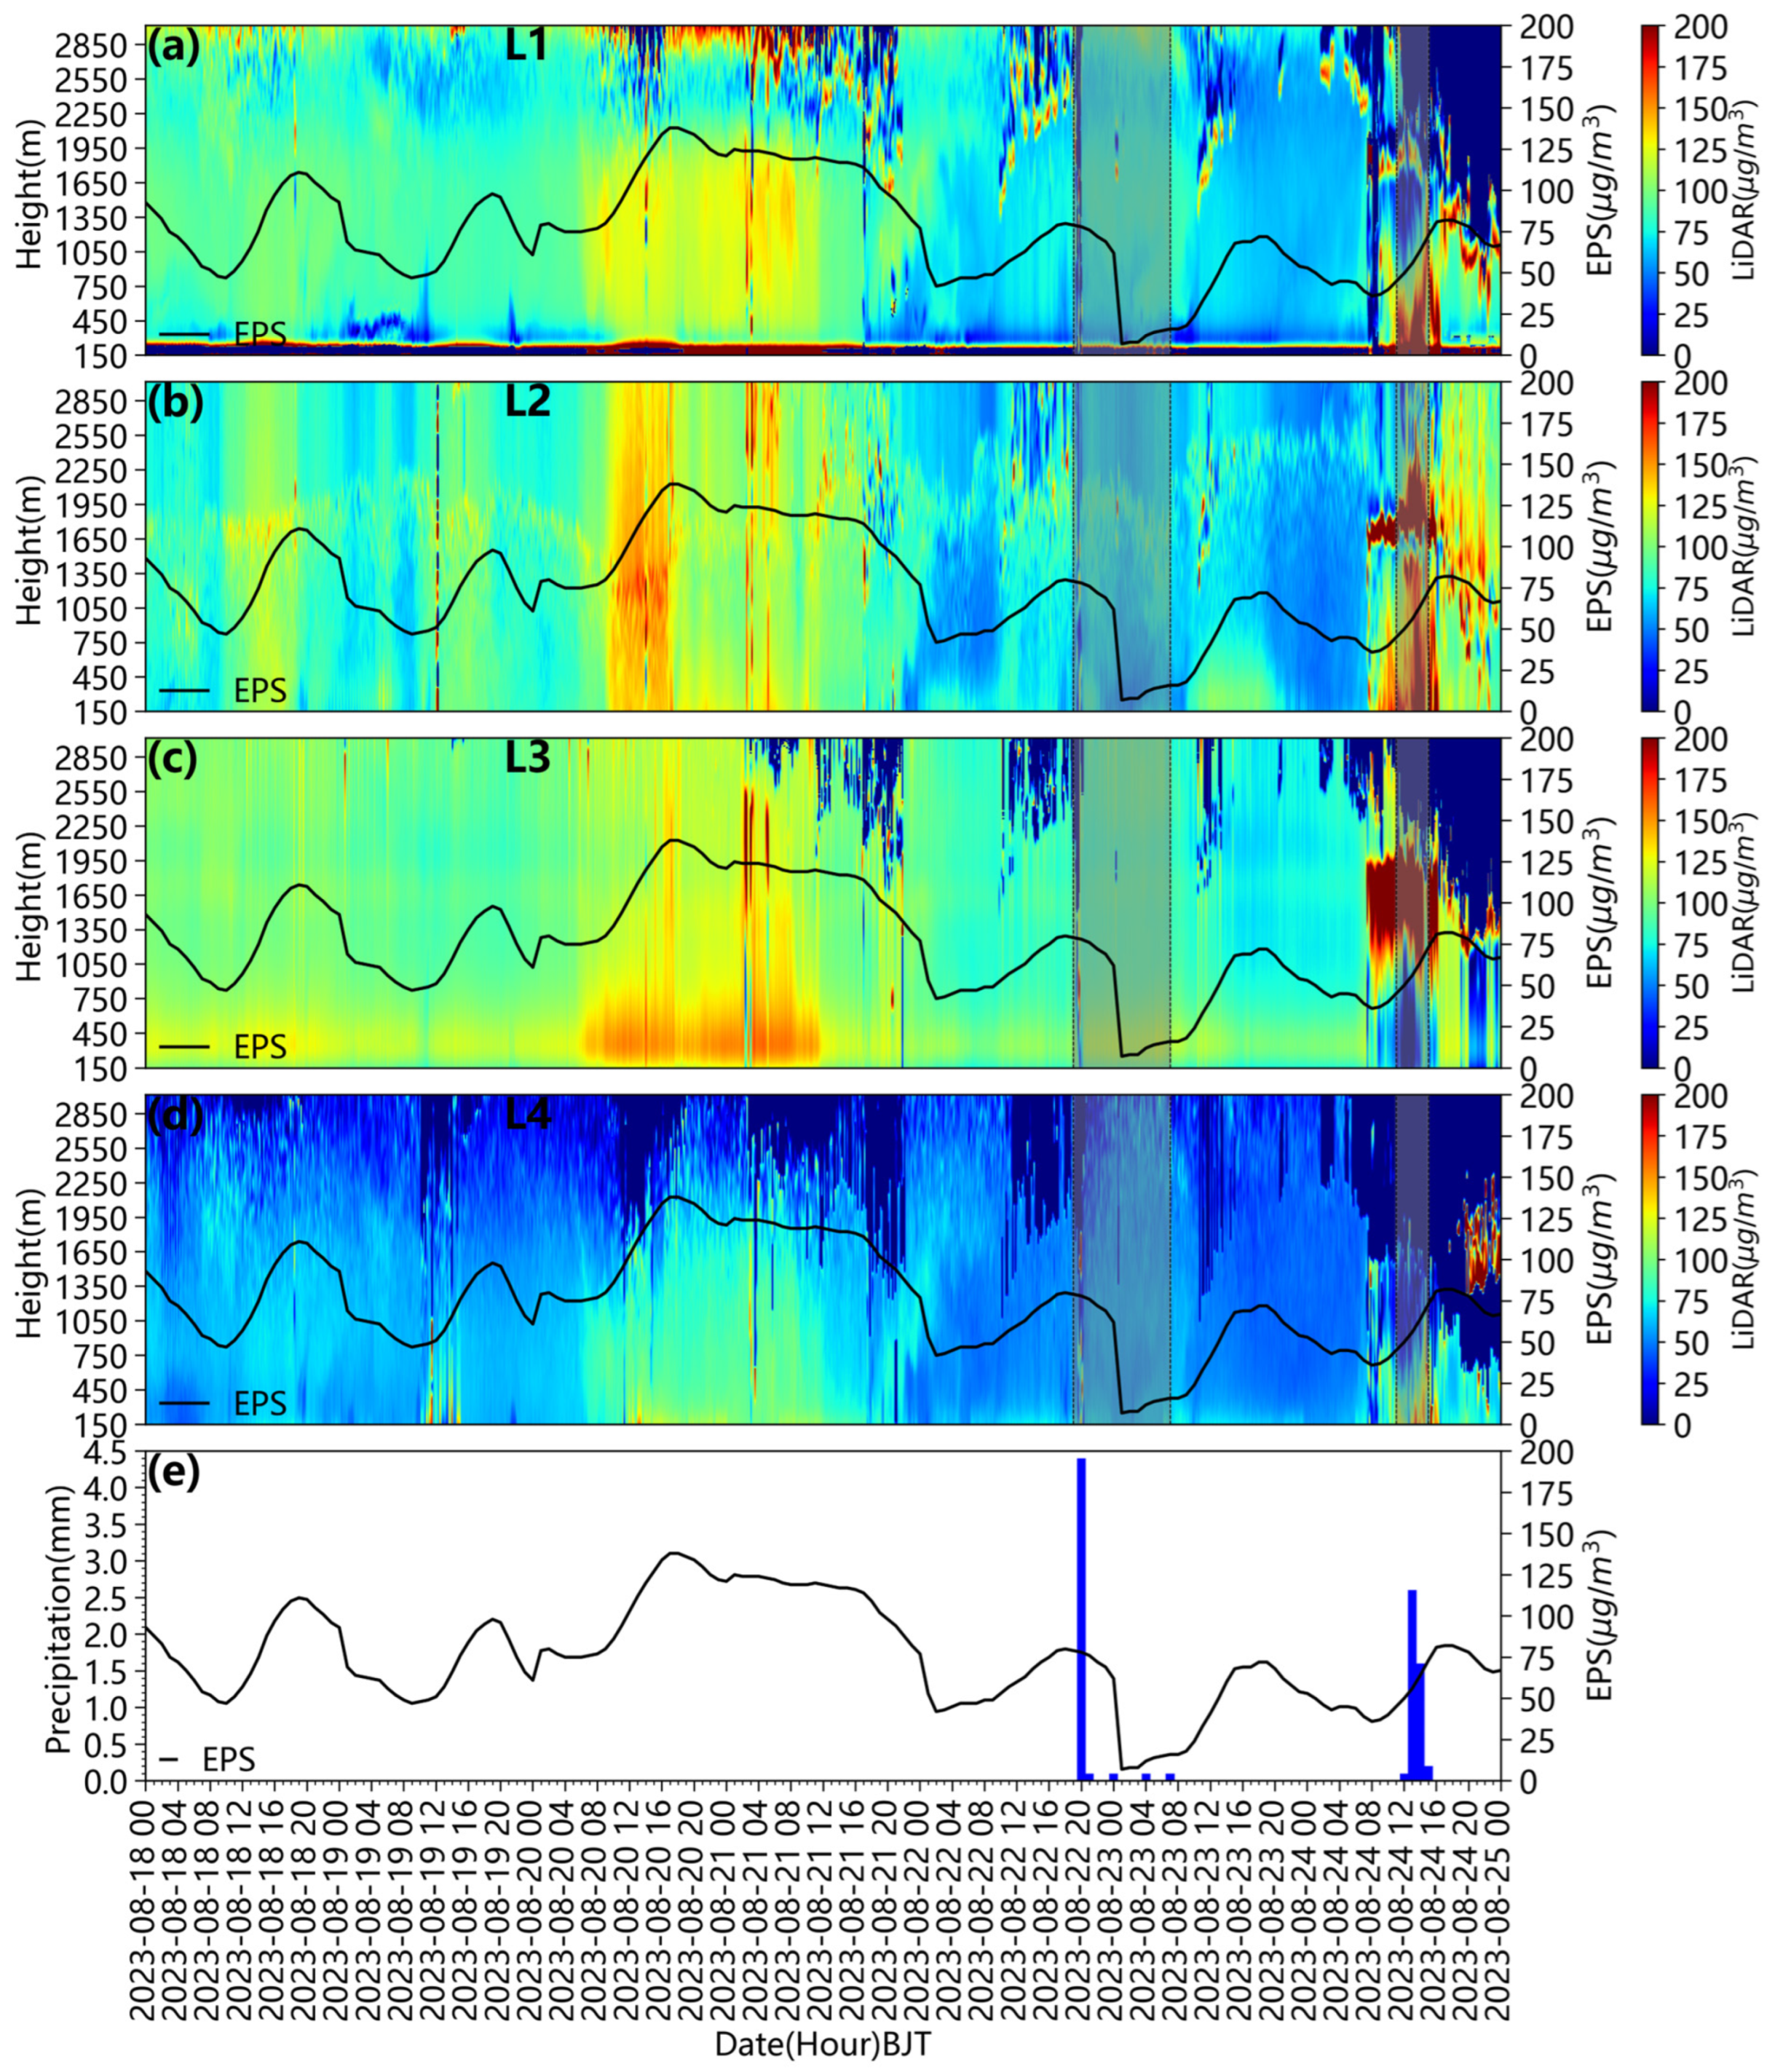
The temporal variation in ozone profiles inverted by the four models of ozone lidars is investigated to obtain insight on the influence of precipitation events in Figure 9, from 18th to 24th August. The two gray shaded areas correspond to precipitation events, and the black lines in each of the sub-figures indicate surface ozone variations measured at the Environmental Protection station. During the precipitation-free period from the 18th to the 21st, the diurnal variation in ozone mass concentration detected using the lidar was closely aligned with the near-surface ozone concentration patterns, characterized with higher concentrations in the afternoon and lower concentrations at night. The primary reason is that, as solar radiation intensifies and temperatures rise around noon in the day, photochemical reactions are exacerbated. Ozone precursors such as NOX, CO, and VOCS undergo photochemical reactions with the help of UV light to produce ozone [24,25], gradually forming a thick layer of ozone within the atmospheric boundary layer, with peak concentrations reaching over 100 µg·m−3. At night, under the influence of the “titration effect”, the near-surface ozone concentration continues to decrease. Vertical transportation also contributes to ozone variations. From 15:00 on the 21st to 03:00 on the 22nd, the near-surface ozone concentration gradually decreased while the concentration at higher altitudes increased, primarily due to dynamic transport (upward airflows).
The first precipitation event started at 19:00 on the 22nd. The convective cloud had developed for more than 10 h before the precipitation event and the top of the mixing layer had risen from approximately 1350 m to 2250 m. After a short-term rainfall, with an hourly precipitation of 4 mm at 20:00, scattered and weak rainfalls occurred every 4 or 5 h approximately until 08:00 on 23rd. Along with the removal of ozone precursors by the rain [26], the decrease in temperature, and near-surface solar radiation, the rate of ozone formation was significantly reduced [27], leading to a sharp decrease in ozone concentration after the precipitation event from 80 µg·m−3 to 7 µg·m−3. The second precipitation event occurred from 11:00 to 15:00 on the 24th, characterized by thick cloud layers, extremely low cloud base heights, and more intensive and continuous rainfall with large raindrop particles. As shown in Figure 9, anomalous high-concentration bright signals appeared before, during, and after the rainfall. The raindrop particles were unstable and had a large scattering coefficient, which brought significant fluctuations to the differential signals of ozone lidar at all wavelengths, resulting in the high value anomalies of ozone concentration.
The investigation of the influence of different types of precipitation events on ozone lidar measurement further indicates that the intensive precipitation event with large raindrop particles can result in high value anomalies. Radar manufacturers need to enhance the identification and marking of anomalous data in their inversion algorithms. It is worth noting that the remaining water or raindrops on the lidar’s optical window after a precipitation event can severely affect the emission and reception of the lidar laser signals, leading to abnormal inversion results as well. This highlights the importance of equipping radars with automatic intelligent window cleaning devices.

4. Conclusions and Discussion

The first comprehensive vertical ozone observation experiment in China was conducted at the Xilinhot National Climate Observatory in Inner Mongolia from August to December 2023, comparing the ozone profiles of four models of ozone lidars with ozone radiosonde and near-surface ozone observations, etc. The detection performance of ozone lidars was systematically assessed. The influence of different types of precipitation events on ozone lidars were investigated. The conclusions and discussions are as follows:
(1)
The ozone profiles of four models of ozone lidar were systematically compared with 17 ozone radiosonde observations. Ozone lidars have a better behavior between 400 m and 2000 m, with the deviation within 10% and the correlation coefficient mainly around 0.6~0.9 for most models of ozone lidars. The detection performances of most ozone lidars gradually decreased as the altitude increased above 2000 m. The correlation coefficients for most models of lidar dropped below 0.5.
(2)
The ozone lidar demonstrates trustworthy accuracy in surface ozone detection. The ozone mass concentrations observed using ozone lidars at a height of 300 m agreed well with ground-based ozone analyzer measurements at nearby environmental protection stations, especially during periods with ozone concentrations higher than 40 µg·m−3. The correlation coefficients for most models of ozone lidar were higher than 0.53. Lidars tend to overestimate ozone concentrations beneath the boundary layer, especially when the actual ozone concentration is below 40 µg·m−3, due to the interference of background signal noise and aerosol scattering.
(3)
The ozone lidar exhibits good vertical detection performance under clear weather. However, the investigations of the influence of different types of precipitation events on ozone lidar measurement further indicate that thick cloud layers, low cloud base, and an intensive precipitation event with large raindrop particles can result in high value anomalies and reduce the inversion accuracy of ozone lidar. Additionally, most ozone lidars have not been equipped with automatic cleaning devices for their optical windows, and the remaining water or raindrops on the optical window after a precipitation event can severely affect the emission and reception of the lidar laser signals, affecting the accuracy of the retrievals as well.
(4)
The differences between ozone lidars, ozone radiosonde, surface ozone measurement and UAV lie in several aspects. First, the ozone lidar is based on a differential absorption principle, the ozone radiosonde applies an electrochemical principle, and the surface measurement and that loaded on the UAV make use of UV absorption spectrophotometry, resulting in different accuracies and response times, etc. Second, the ozone lidars’ detection location is fixed, while the ozone radiosonde drifts to a certain extent from the release point according to the wind speed. The difference in real-time observation orientation among the different techniques results in the deviation of observed concentration values. Third, along with the increase in the height, the measurement accuracy of lidar is greatly affected by the signal-to-noise ratio, leading to more observation errors.
(5)
To address these affecting factors, it is recommended that ozone lidar manufacturers should put more emphasis on improving retrieval algorithms to eliminate the overestimation of near-surface ozone concentrations, to reduce the influence of clouds and precipitation, and to equip the lidar with automatic intelligent cleaning or drying devices for the equipment’s optics windows, etc. It is also worth trying to develop comprehensive quality control algorithms, combining other ground-based meteorological observations, millimeter-wave cloud radars and All-sky Imagers for weather phenomenon identification.

Author Contributions

Experiment design and methodology, J.J.; software, H.C.; validation, S.L., X.S. and Z.Q.; formal analysis, H.C.; investigation, H.C. and J.J.; resources, J.J. and K.W.; visualization, H.C. and G.L.; writing—original draft preparation, H.C.; writing—review and editing, supervision, J.J.; project administration, N.W. and W.S.; funding acquisition, J.J. All authors have read and agreed to the published version of the manuscript.

Funding

This research was funded by the National Natural Science Foundation of China (Nos. 41805027), the National Key Research and Development Program of China (Nos. 2017YFC1501802) and China Desert Meteorological Science Research Fund (Nos. Sqj2023006).

Institutional Review Board Statement

Not applicable.

Informed Consent Statement

Not applicable.

Data Availability Statement

Data available on request due to restrictions of data policy, please contact the corresponding author.

Acknowledgments

We thank the participation and assistance of Hefei CAS GBo-Qua, Technology Co., Ltd., AnHui Technovo Lidar High-tech Co., Ltd., AnHui Lanke Information Technology Co., Ltd., Wuxi CAS Photonics Co., Ltd., Hefei Science of Light Technology Co., Ltd., and Aerospace New Sky Technology Co., Ltd. (listed in no particular order). We would like to express our gratitude to the staff at the Xilinhot National Climate Observatory in Inner Mongolia, China, for the operation of ozone lidars. We gratefully acknowledge Yapeng Wang from NSMC (National Satellite Meteorological Centre) for ozone column distribution analysis based on satellite detector Atmospheric Infrared Sounder (AIRS for short) from Aqua, NASA in this manuscript. We also thank the three anonymous reviewers for their constructive comments on the manuscript.

Conflicts of Interest

The authors declare that there are no conflicts of interest; we do not have any possible conflicts of interest.

References

  1. Archibald, A.T.; Neu, J.L.; Elshorbany, Y.F.; Cooper, O.R.; Young, P.J.; Akiyoshi, H.; Cox, R.A.; Coyle, M.; Derwent, R.G. Tropospheric Ozone Assessment Report: A critical review of changes in the tropospheric ozone burden and budget from 1850 to 2100. Elem. Sci. Anth. 2020, 8, 34. [Google Scholar] [CrossRef]
  2. Kong, Q.; Liu, G.; Li, G. Surface Ozone Concentration Variation andPossible Influences on Human Health. Clim. Environ. Res. 1999, 1, 61–66. (In Chinese) [Google Scholar]
  3. Ye, S.; Deng, R.; Ling, X. Advances on impacts of increasing ozone concentration in atmosphere near ground on yields of crops. J. Agro-Environ. Sci. 2006, S2, 772–776. (In Chinese) [Google Scholar]
  4. Chen, C.; Hong, Y.; Liu, L.; Tan, H.; Wu, M.; Situ, S.; Bu, Q.; Cheng, Y.; Zhou, Y. Analysis of two typical ozone pollution processes in Foshan in spring. Acta Sci. Circumstantiae 2022, 42, 304–314. (In Chinese) [Google Scholar]
  5. Yang, Y.; Hao, J.; Yang, L.; Wang, S.; Zhang, J. Analysis of meteorological conditions of a continuous ozone pollution process in Xingtai of Hebei province. J. Arid. Meteorol. 2020, 38, 448–456. (In Chinese) [Google Scholar]
  6. Wild, O.; Prather, M.J.; Akimoto, H.; Sundet, J.K.; Isaksen, I.S.; Crawford, J.H.; Davis, D.D.; Avery, M.A.; Kondo, Y.; Sachse, G.W.; et al. Chemical transport model ozone simulations for spring 2001 over the western Pacific: Regional ozone production and its global impacts. J. Geophys. Res. Atmos. 2003, 108, D21. [Google Scholar] [CrossRef]
  7. Wang, H.J.R.; Damadeo, R.; Flittner, D.; Kramarova, N.; Taha, G.; Davis, S.; Thompson, A.M.; Strahan, S.; Wang, Y.; Froidevaux, L.; et al. Validation of SAGE III/ISS Solar Ozone Data with Correlative Satellite and Ground Based Measurements. J. Geophys. Res. Atmos. 2022, 125, e2020JD032430. [Google Scholar] [CrossRef]
  8. Shi, G.; Xu, L.; Guo, J.; Zhang, B.; Sun, B. Balloon Observation of Atmospheric Ozone and Aerosols. Sci. Atmos. Sin. 1996, 4, 401–407. (In Chinese) [Google Scholar]
  9. McPeters, R.D.; Labow, G.J.; Johnson, B.J. A satellite-derived ozone climatology for balloonsonde estimation of total column ozone. J. Geophys. Res. Atmos. 1997, 102, 8875–8885. [Google Scholar] [CrossRef]
  10. Naja, M.; Akimoto, H. Contribution of regional pollution and long-range transport to the Asia-Pacific region: Analysis of long-term ozonesonde data over Japan. J. Geophys. Res. Atmos. 2004, 109, D21. [Google Scholar] [CrossRef]
  11. Zhang, J.; Xuan, Y.; Liu, M.; Wan, X.; Bai, Z. Atmospheric Ozonesonde: Technical Specifi cations and Comparisons. Adv. Meteorol. Sci. Technol. 2015, 5, 35–44. (In Chinese) [Google Scholar]
  12. Schnadt Poberaj, C.; Staehelin, J.; Brunner, D.; Thouret, V.; De Backer, H.; Stübi, R. Long-term changes in UT/LS ozone between the late 1970s and the 1990s deduced from the GASP and MOZAIC aircraft programs and from ozonesondes. Atmos. Chem. Phys. 2009, 9, 5343–5369. [Google Scholar] [CrossRef]
  13. Sheng, Z.; Che, H.; Chen, Q.; Liu, D.; Wang, Z.; Zhao, H.; Gui, K.; Zheng, Y.; Sun, T.; Li, X.; et al. Aerosol vertical distribution and optical properties of different pollution events in Beijing in autumn 2017. Atmos. Res. 2019, 215, 193–207. [Google Scholar] [CrossRef]
  14. Fan, G.; Liu, J.; Chen, Z.; Liu, W.; Lu, Y.; Zhang, T.; Dong, Y. A differential absorption lidar system for tropospheric ozone monitoring. Chin. J. Lasers 2012, 39, 1113001. [Google Scholar]
  15. Cao, K.; Huang, J.; Hu, S. Boundary layer ozone differential-absorption lidar. Infrared Laser Eng. 2015, 44, 2912–2917. (In Chinese) [Google Scholar]
  16. Keppens, A.; Di Pede, S.; Hubert, D.; Lambert, J.-C.; Veefkind, P.; Sneep, M.; De Haan, J.; Linden, M.T.; Leblanc, T.; Compernolle, S.; et al. Five years of Sentinel-5p TROPOMI operational ozone profiling and geophysical validation using ozonesonde and lidar ground-based networks. Atmos. Meas. Tech. Discuss. 2024, 1–43. [Google Scholar] [CrossRef]
  17. Wing, R.; Godin-Beekmann, S.; Steinbrecht, W.; McGee, T.J.; Sullivan, J.T.; Khaykin, S.; Sumnicht, G.; Twigg, L. Evaluation of the new DWD ozone and temperature lidar during the Hohenpeißenberg Ozone Profiling Study (HOPS) and comparison of results with previous NDACC campaigns. Atmos. Meas. Tech. 2021, 14, 3773–3794. [Google Scholar] [CrossRef]
  18. Hu, S.; Hu, H.; Zhou, J.; Wu, Y. DIAL lidar measurement for tropospheric ozone. Laser Technol. 2001, 25, 406–409. (In Chinese) [Google Scholar]
  19. Di, H.; Li, X.; Hua, D.; Li, S. Research status and progress of lidar for atmosphere in China. Microw. Opt. Technol. Lett. 2021, 63, 2129–2134. [Google Scholar]
  20. Dolgii, S.I.; Nevzorov, A.A.; Nevzorov, A.V.; Romanovskii, O.A.; Kharchenko, O.V. Comparison of ozone vertical profiles in the upper troposphere-stratosphere measured over Tomsk, Russia (56.5° N, 85.0° E) with DIAL, MLS, and IASI. Int. J. Remote Sens. 2020, 41, 8590–8609. [Google Scholar] [CrossRef]
  21. Huang, Z.; Pei, C.; Wang, Y.; Chen, Y.; Liang, Y.; Zhang, T.; Fan, G.; Wan, X.; Hu, T.; Li, Z.; et al. The Networking Observation and Analysis of Atmospheric Ozone Lidars in Guangzhou in 2017. Environ. Sci. Technol. 2018, 41, 159–164. (In Chinese) [Google Scholar]
  22. Leblanc, T.; Brewer, M.A.; Wang, P.S.; Granados-Muñoz, M.J.; Strawbridge, K.B.; Travis, M.; Firanski, B.; Sullivan, J.T.; McGee, T.J.; Sumnicht, G.K.; et al. Validation of the TOLNet lidars: The southern California ozone observation project (scoop). Atmos. Meas. Tech. 2018, 11, 6137–6162. [Google Scholar] [CrossRef]
  23. Ancellet, G.; Godin-Beekmann, S.; Smit, H.G.J.; Stauffer, R.M.; Van Malderen, R.; Bodichon, R.; Pazmiño, A. Homogenization of the Observatoire de Haute Provence electrochemical concentration cell (ECC) ozonesonde data record: Comparison with lidar and satellite observations. Atmos. Meas. Tech. 2022, 15, 3105–3120. [Google Scholar] [CrossRef]
  24. Geng, F.; Tie, X.; Xu, J.; Zhou, G.; Peng, L.; Gao, W.; Tang, X.; Zhao, C. Characterizations of ozone, NOx, and VOCs measured in Shanghai, China. Atmos. Environ. 2008, 42, 6873–6883. [Google Scholar] [CrossRef]
  25. Fu, Y.; Hong, L. Simulation of the interannual variations of biogenic emissions of volatile organic compounds in China: Impacts on tropospheric ozone and secondary organic aerosol. Atmos. Environ. 2012, 59, 170–185. [Google Scholar] [CrossRef]
  26. Zhao, W.; Gao, B.; Liu, M.; Lu, Q.; Ma, S.; Sun, J.; Chen, L.; Fan, S. Impact of Meteorological Factors on the Ozone Pollution in Hong Kong. Environ. Sci. 2019, 40, 55–66. (In Chinese) [Google Scholar]
  27. Yan, X.; Gou, X.; Yang, J.; Zhao, W.; Xu, Q.; Liu, Y. The Variety of Ozone and its Relationship with Meteorological Conditions in Typical Cities in China. Plateau Meteorol. 2020, 39, 416–430. (In Chinese) [Google Scholar]
Figure 1. Schematic of the geographic location of the Xilinhot National Climate Observatory (a), the ozone total column distribution at the experiment location and surrounding regions derived from satellite observation (b) and four ozone lidars in the experimental field (c).
Atmosphere 15 00690 g001
Figure 2. Co-current observations on 1st November 2023. Sub-figures (ad) indicate ozone lidar model L1, L2, L3 and L4, the black line within figures are time series of surface ozone observation at EPS. The profiles observed using ozone radiosonde and UAV ozone analyzer are shown at around 13 and 14 BJT.
Atmosphere 15 00690 g002
Figure 3. Ozone profiles and corresponding error analysis comparisons between ozone lidar and ozone radiosonde on (a) 13 September, (b) 25 October, (c) 1 November and (d) 29 November, 2023. Error bar refers to standard error of the average.
Atmosphere 15 00690 g003
Figure 4. Relative deviation and error analysis of ozone profiles between 4 models of ozone lidar and ozone radiosonde at grided height interval. Error bar refers to standard error of the average.
Atmosphere 15 00690 g004
Figure 5. Ozone concentration correlation analysis between 4 models of ozone lidar and ozone radiosonde at grided height interval.
Atmosphere 15 00690 g005
Figure 6. Comparisons between ozone mass concentration retrieved at height of 300 m from ozone lidars and two stations of surface ozone measurements for (a) model L1, (b) model L2, (c) model L3, and (d) model L4.
Atmosphere 15 00690 g006
Figure 7. Fitting analysis between ozone concentrations retrieved at height of 300 m from ozone lidars and surface ozone measurement at EPS. Sub-figures (ad) indicate the fitting analysis for model L1, L2, L3 and L4 when ozone concentrations are above 40 µg·m−3, while sub-figures (eh) are similar analysis when ozone concentrations are above 40 µg·m−3.
Atmosphere 15 00690 g007
Figure 8. Comparison of ozone profiles and concentrations observed using the ozone lidars and the ozone analyzer on UAV during (a) ascending, (b) descending and (c) hovering periods.
Atmosphere 15 00690 g008
Figure 9. Vertical monitoring and inversion results of 4 models of ozone lidar from August 18th to 24th, 2023. Sub-figures (ad) indicate model L1, L2, L3 and L4, the black line within figures are time series of surface ozone observation at Environmental Protection station. Sub-figure (e) shows time series of precipitation (mm).
Atmosphere 15 00690 g009
Table 1. Technical parameters of the four ozone lidar models.
Ozone
Lidar Number
Telescope (mm)LaserDetection Blind Zone (m)Detection Height (km)Spatial Resolution (m)Temporal Resolution (min)
Laser Pulse (nm)Single Pulse Energy (mJ)Frequency (Hz)Divergence Angle (urad)
L1200280/295≥0.025000<300≤45≥37.510
L2300266/289/316≥10010<300≤7557.510
L3300289/316/532≥100≥10<500≤100≥37.510
L4200280/295/560/590≥0.2100<1000<75≥37.510
Table 2. Relative deviation between ozone lidar and UAV flight.
Ozone Lidar ModelRelative Deviation (%)
Ascending ProcessDescending ProcessHovering 300 mHovering 450 mHovering 500 m
L19.0~28.6%39.6~61.7%35.0%11.3%13.6%
L20~35.1%8.4~18.1%27.3%14.9%12.9%
L30~24.3%6.4~27.1%2.7%9.5%1.1%
L49.5~22.7%30.5~56.8%27.8%2.0%8.4%
Disclaimer/Publisher’s Note: The statements, opinions and data contained in all publications are solely those of the individual author(s) and contributor(s) and not of MDPI and/or the editor(s). MDPI and/or the editor(s) disclaim responsibility for any injury to people or property resulting from any ideas, methods, instructions or products referred to in the content.