Article

Characterization of Microbials in the Lung Induced by Allergenic Platanus Pollen Protein (Pla a3) and Ambient Fine Particulate Matter

1
School of Environmental and Chemical Engineering, Shanghai University, Shanghai 200444, China
2
School of Life Sciences, Shanghai University, Shanghai 200444, China
3
Institute of Desert Meteorology, China Meteorological Administration, Urumqi 830002, China
4
School of Science and Engineering, Saitama University, Saitama 338-8570, Japan
*
Author to whom correspondence should be addressed.
Atmosphere 2024, 15(4), 503; https://doi.org/10.3390/atmos15040503
Submission received: 28 March 2024 / Revised: 13 April 2024 / Accepted: 14 April 2024 / Published: 19 April 2024

Abstract

:
Ambient pollen proteins play key roles in the incidence of allergenic respiratory health, and numerous reports have focused on respiratory diseases caused by air pollutants. However, there is still a lack of understanding of the specific mechanisms underlying the involvement of microbiota in the respiratory tracts and effects induced by air pollutants. Therefore, an allergenic animal model was established to investigate the characterization of microbials in the lung induced by allergenic Platanus pollen protein (Pla a3) and ambient fine particulate matter. Our data showed that the mice exhibited strong immune and inflammatory responses after being exposed to PMs and Pla a3 protein. This included increased levels of immunoglobulins IgG and IgE, as well as elevated levels of cytokines TNF-α, IFN-γ, IL-4, and IL-13. Furthermore, the amounts of pathogenic bacteria, such as Desulfobacterota, Enterococcus, Ferruginibacter, and Pseudoxanthomonas, in the lung microbiota of the Pla a3 exposure group increased significantly. Correlation analysis revealed a strong association between specific lung bacteria and alterations in cytokines from the lung samples. Probiotic bacteria, Deferribacterota and Bifidobacterium, was associated with changes in the level of IgG and IgE. However, pathogenic bacteria, like Prevotella and Fusobacterium, were linked with the cytokines IL-4 and TNF-α.

1. Introduction

With global climate change and rapid urbanization, the prevalence of allergic diseases caused by pollen is rising dramatically [1]. Studies showed that pollen imposes a considerable burden on public health, especially for high-risk atopic individuals. With the increase in the extensive planting of trees and flowers, pollen has become the most abundant biological aerosol particle in the atmosphere [2]. Statistics show that pollen could cause allergic rhinitis in approximately 20% to 30% of the world’s population [3]. In recent years, there has been a significant increase in the incidence of allergic diseases among the Chinese population, and even though air quality has been improved greatly, allergenic pollen is the most important outdoor allergen, accounting for 30–58% of patients with allergic rhinitis [4]. Research has also demonstrated that air pollutants could lead to changes in the diversity of the airway microbiota, accompanied by inflammation and oxidative stress [5]. Hosgood et al. [6] reported that exposure to household air pollutants could increase the abundance of pathogenic bacterial operational taxonomic units (OTUs) in the lower airways, specifically in sputum samples. Pollen grains could lead to a decrease in beneficial gut bacteria such as Ruminococcaceae, Lachnospiraceae, and Clostridiales, as well as an increase in pathogenic bacteria, such as Akkermansia and Helicobacter [7]. It has been shown that the gut microbiota may have an impact on the microbial composition in the lungs and have a positive effect on lung protection [8]. Even if there are numerous studies on the effects of air pollution on the respiratory system, there is still a lack of understanding of the specific mechanisms underlying involvement of microbiota in pollutant-induced respiratory effects. Therefore, we focused on the variety of microbiota after the mice were exposed to allergenic pollen protein and PMs, and tried to provide scientific data that helped to elucidate the role of the microbiota in the development of allergic diseases.

2. Materials and Methods

2.1. Preparation of Particulate Matter Samples

The urban aerosol standard particulate matter (PM) was purchased from the National Institute for Environmental Sciences (Japan). The physical and chemical characteristics of the PMs are listed in the Supplementary Materials (Table S1). The PMs were mixed with sterilized phosphate-buffered solution (PBS) to a concentration of 1500 μg/mL for intraperitoneal injection and 3000 μg/mL for nasal drops. The mixture solution was sonicated for 30 min, centrifuged at 5000 rpm to obtain the supernatant, and then a water-soluble PM solution was obtained. The solution was then kept at −20 °C in the dark until used.

2.2. Preparation and Purification of Pla a3 Protein

Due to the numerous types of proteins in pollen and Pla a3 not being the dominant protein, it is difficult to isolate sufficient amounts of highly pure Pla a3 allergen directly from the natural extract of pollens. Therefore, a recombinant Pla a3 (rPla a3), referred to as A3, was expressed in a prokaryotic system, purified by affinity chromatography, and was used in this study. A detailed protocol was described by Zhou et al. [9]. Briefly, the Rosetta strain transformed with pET30a-Pla-His was induced with IPTG to promote bacterial growth, followed by ultrasonic treatment to disrupt the bacteria. The supernatant was collected after centrifugation at 13,000× g for 15 min at 4 °C and stored for future use.

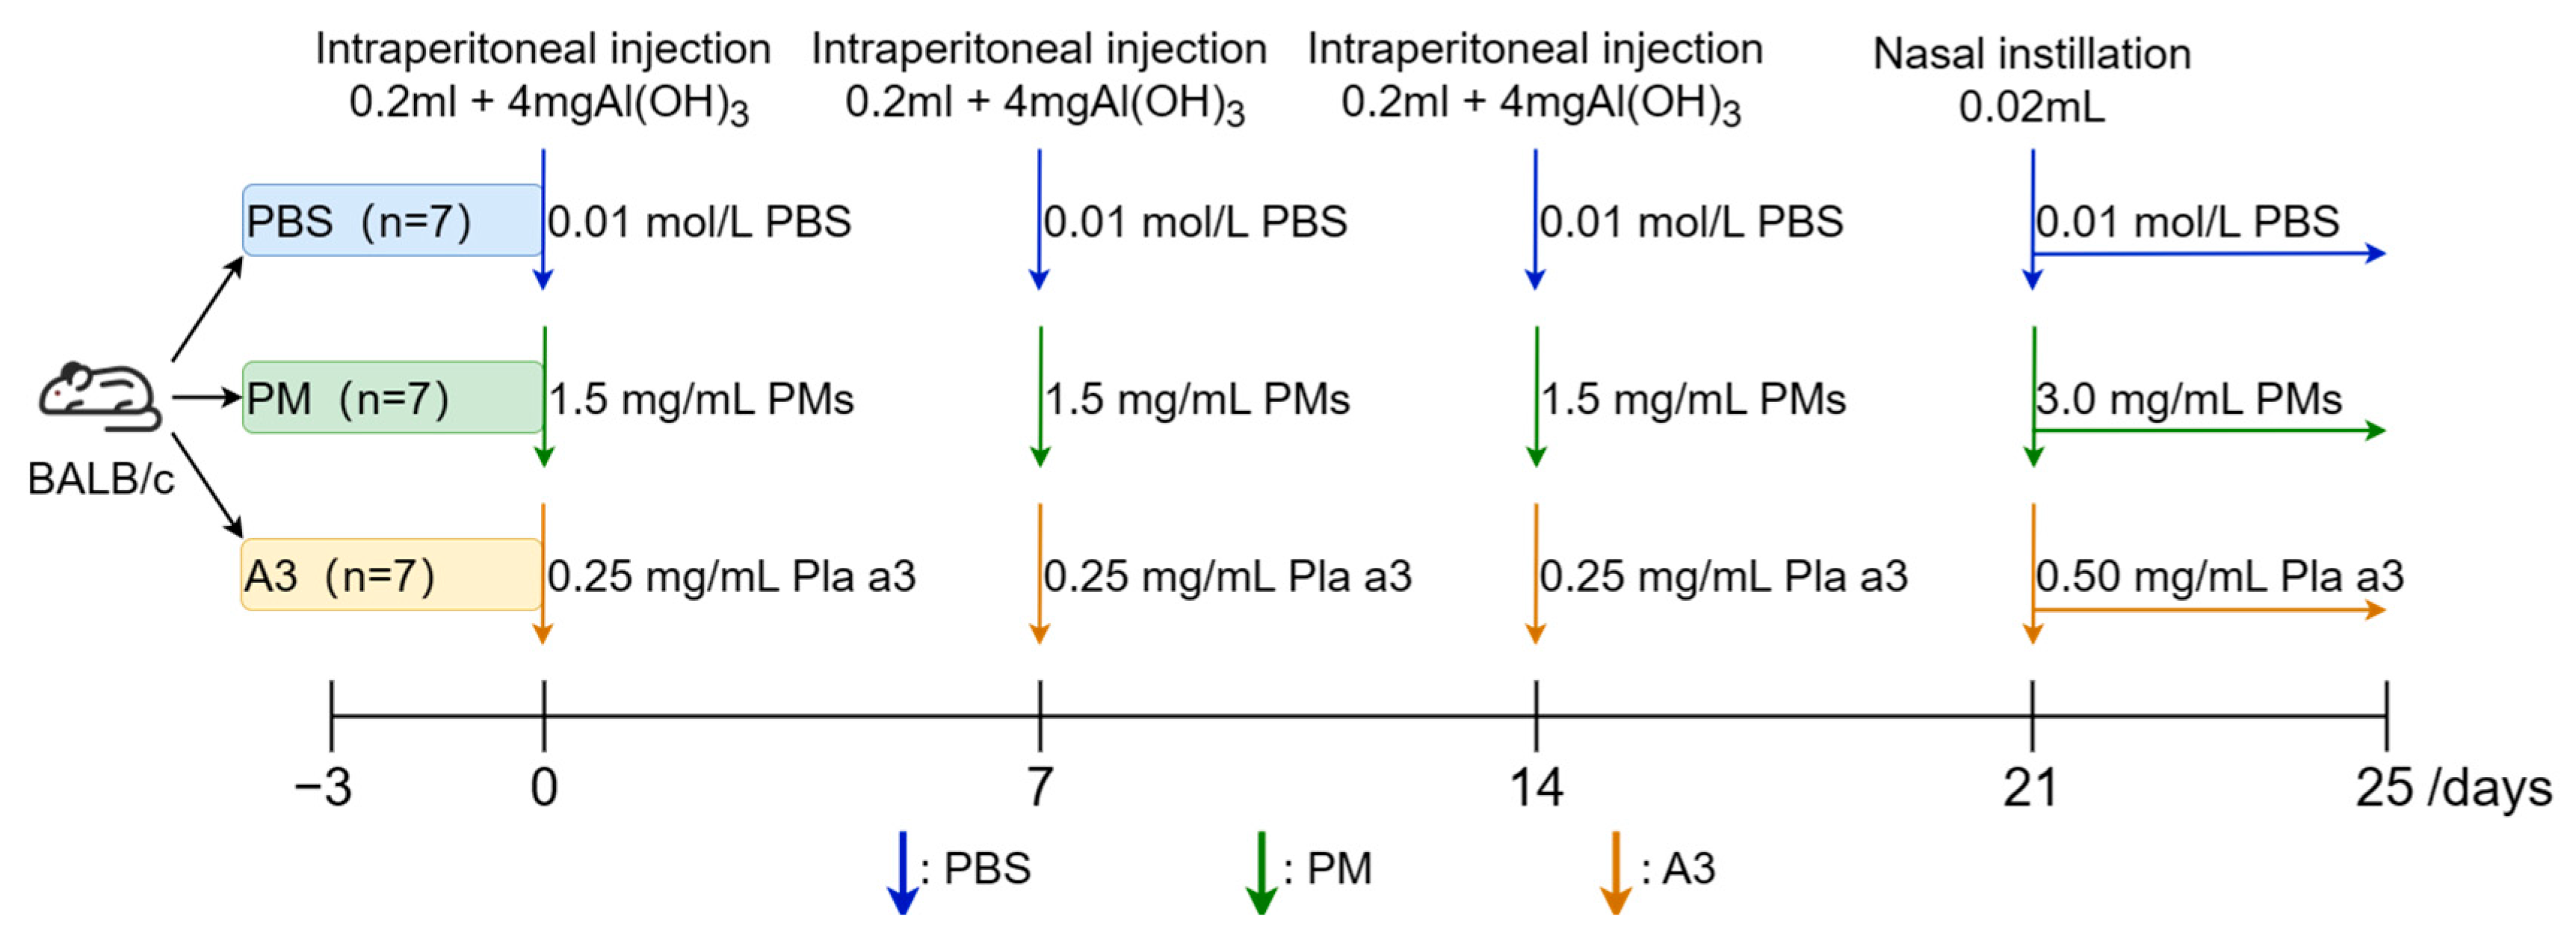
2.3. Establishment of Allergenic Animal Model

Twenty-one 6-week-old female BALB/C mice, weighing 18–24 g (SLAC, Shanghai, China) were housed in a sterile animal facility at Shanghai University. The animal experiments were approved by the Animal Experimental Committee of the College of Life Sciences at Shanghai University. The mice were randomly divided into three groups (n = 7): the control group, the PM exposure group, and the Pla a3 protein exposure group. After a three-day acclimatization period, the mice were intraperitoneally injected on days 0, 7, and 14 to induce immunization, followed by intranasal instillation from day 21 to 25 to further stimulate the immune response. The dosages for intraperitoneal injection and nasal instillation were determined based on previous studies [10]. Detailed information regarding the drugs used for injection, injection concentrations, and other pertinent details are provided in Figure 1.

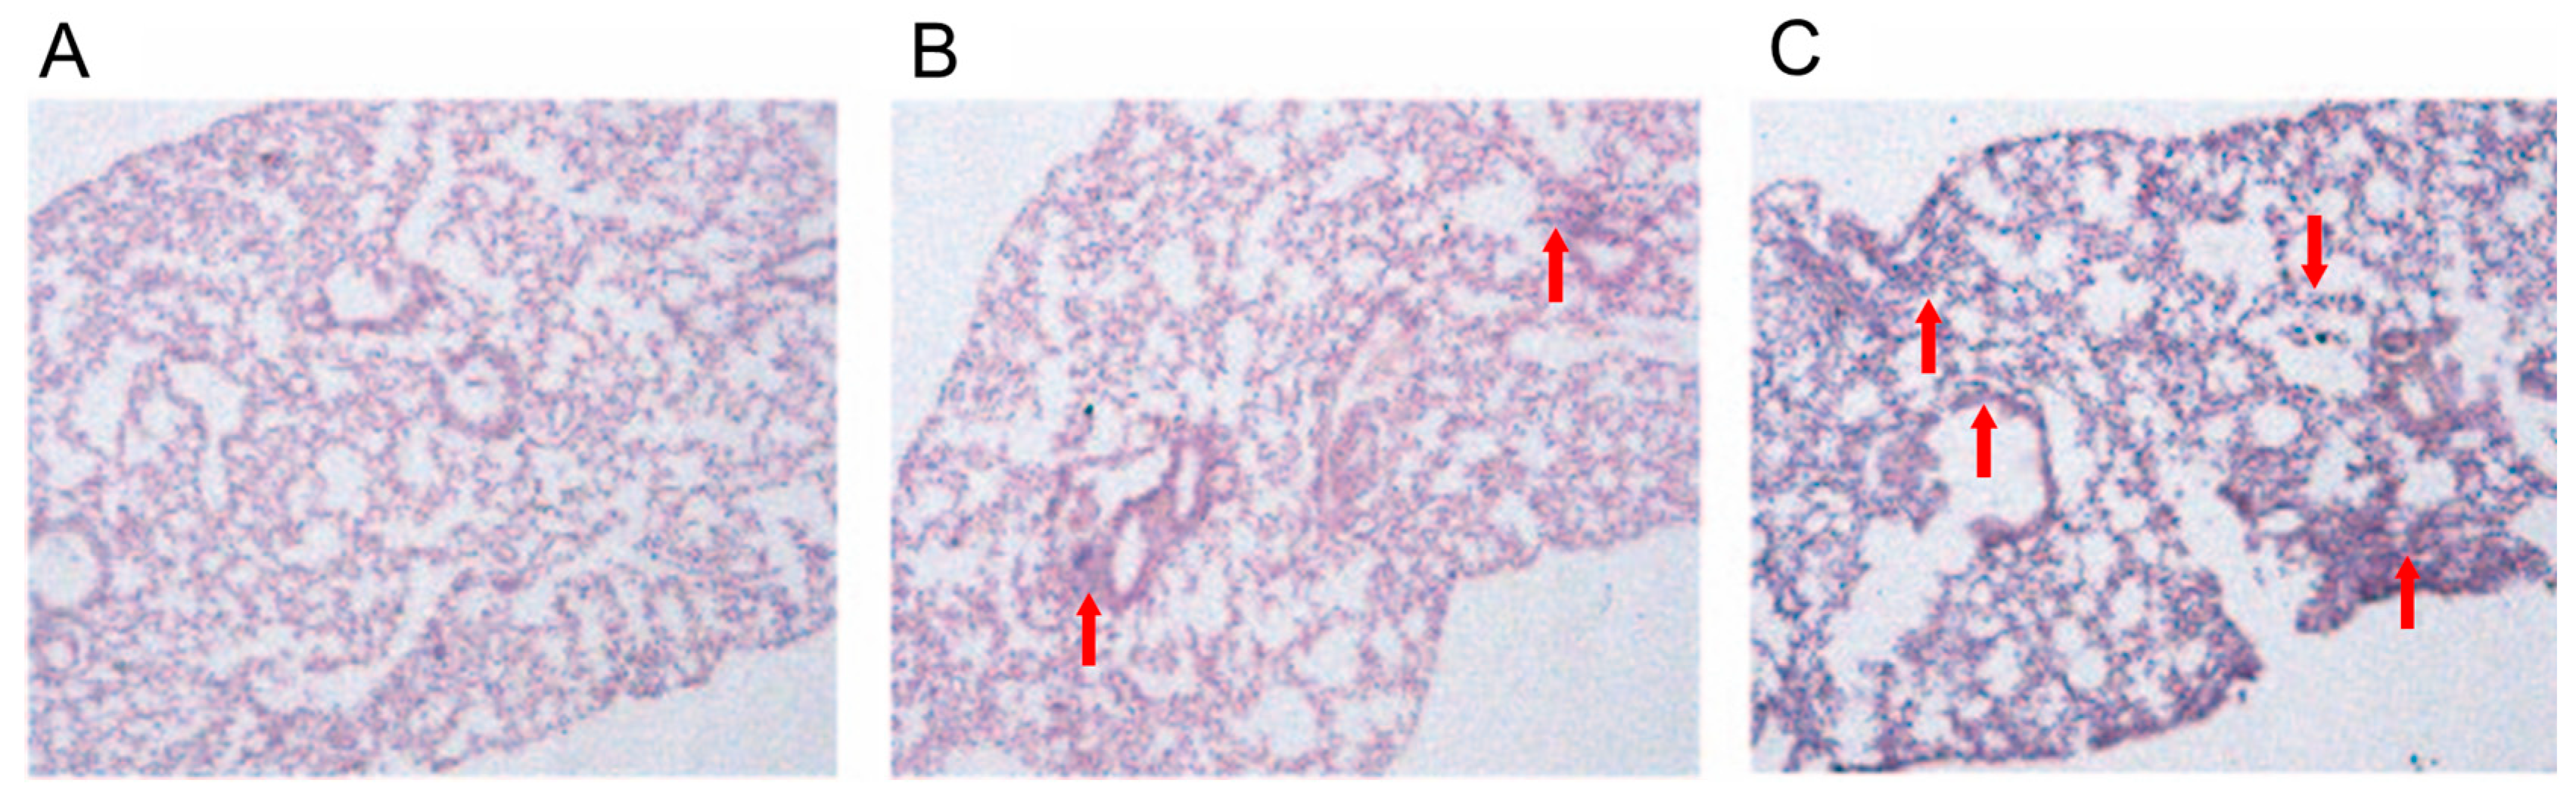
2.4. Histopathological Analysis

The lung apex tissues of mice were fixed in 4% paraformaldehyde (0.1 M PBS, pH 7.4) at 25 °C for 24 h after being immersed under vacuum for 15 min to allow the paraformaldehyde to penetrate the lung tissues. After rinsing three times with 0.1 M PBS (pH 7.4), the samples were dehydrated, replaced, and embedded in paraffin, following a previously described method [11]. The paraffin-embedded tissues were sectioned into 10-μm slices using a Leica RM2235 microtome. The slices were then stained with hematoxylin and eosin (H&E) (C0105S, Biotech, Shanghai, China) and mounted using a neutral resin (CAS number: 96949-21-2, Shanghai Pharma, Hong Kong, China). The sections were observed using a Leica DM2500 microscope.

2.5. Immunoglobulin Assays

The measurement of allergic reactions in mice was performed according to the method previously described [12]. After administering anesthesia and euthanizing the mice, blood was collected into 1.5 mL EP tubes. The tubes were then centrifuged at 13,000× g for 15 min at 4 °C to collect the serum. Then, the IgG and IgE in the serum were detected using antibody assays, and all procedures were performed according to the manufacturer’s instructions. Finally, the protein content was measured using a microplate reader (iMark, Bio-Rad, Hercules, CA, USA).

2.6. Detection of Inflammatory Factors from the Pulmonary Tissues

The levels of inflammatory cytokines in mouse lung tissue were measured following a previously described method [12]. The lung tissue was homogenized in PBS at a ratio of 1:10 (g/mL), and the homogenate was centrifuged at 12,000× g for 20 min to collect the supernatant for analysis. The supernatant was used to detect the cytokines’ Tumor Necrosis Factor-α (TNF-α), Interferon-γ (IFN-γ), Interleukin-4 (IL-4), and Interleukin-13 (IL-13) using ELISA kits (Elabscience Biotechnology Co., Ltd., Wuhan, China) according to the manufacturer’s instructions.

2.7. 16SrRNA Gene Sequence Analysis

Microbial flora analysis was performed on lung tissue samples from the control group, PM group, and Pla a3 protein group using 16S rRNA sequencing. Specific primers with barcodes targeting the V3V4 region (343F: TACGGRAGGCAGCAG and 798R: AGGGTATCTAATCCT) were used for PCR amplification with Takara’s Tks Gflex DNA polymerase. Sequencing was performed using the MiSeq platform (Illumina, San Diego, CA, USA). More information is listed in the Supplementary Materials.

2.8. Bioinformatic Analysis

The 16S/18S/ITS amplicon sequencing and analysis were conducted by OE Biotech Co., Ltd. (Shanghai, China). The raw data were processed using QIIME 2 (2020.11) software.

2.9. Statistical Analysis

Statistical analysis was conducted using SPSS 25.0 and GraphPad Prism 8.4.3 software. The data were obtained from three independent experiments and presented as mean ± standard error of the mean (SEM). There were 7 samples in the control group, and 6 samples in the PM exposure group and in the Pla a3 protein exposure group. Differences among the three groups were compared using a one-way analysis of variance (ANOVA) followed by Tukey’s post hoc test. Data that did not follow a normal distribution were analyzed using the Kruskal–Wallis test. A p value < 0.05 was considered statistically significant, and each experiment was repeated three times.

3. Results

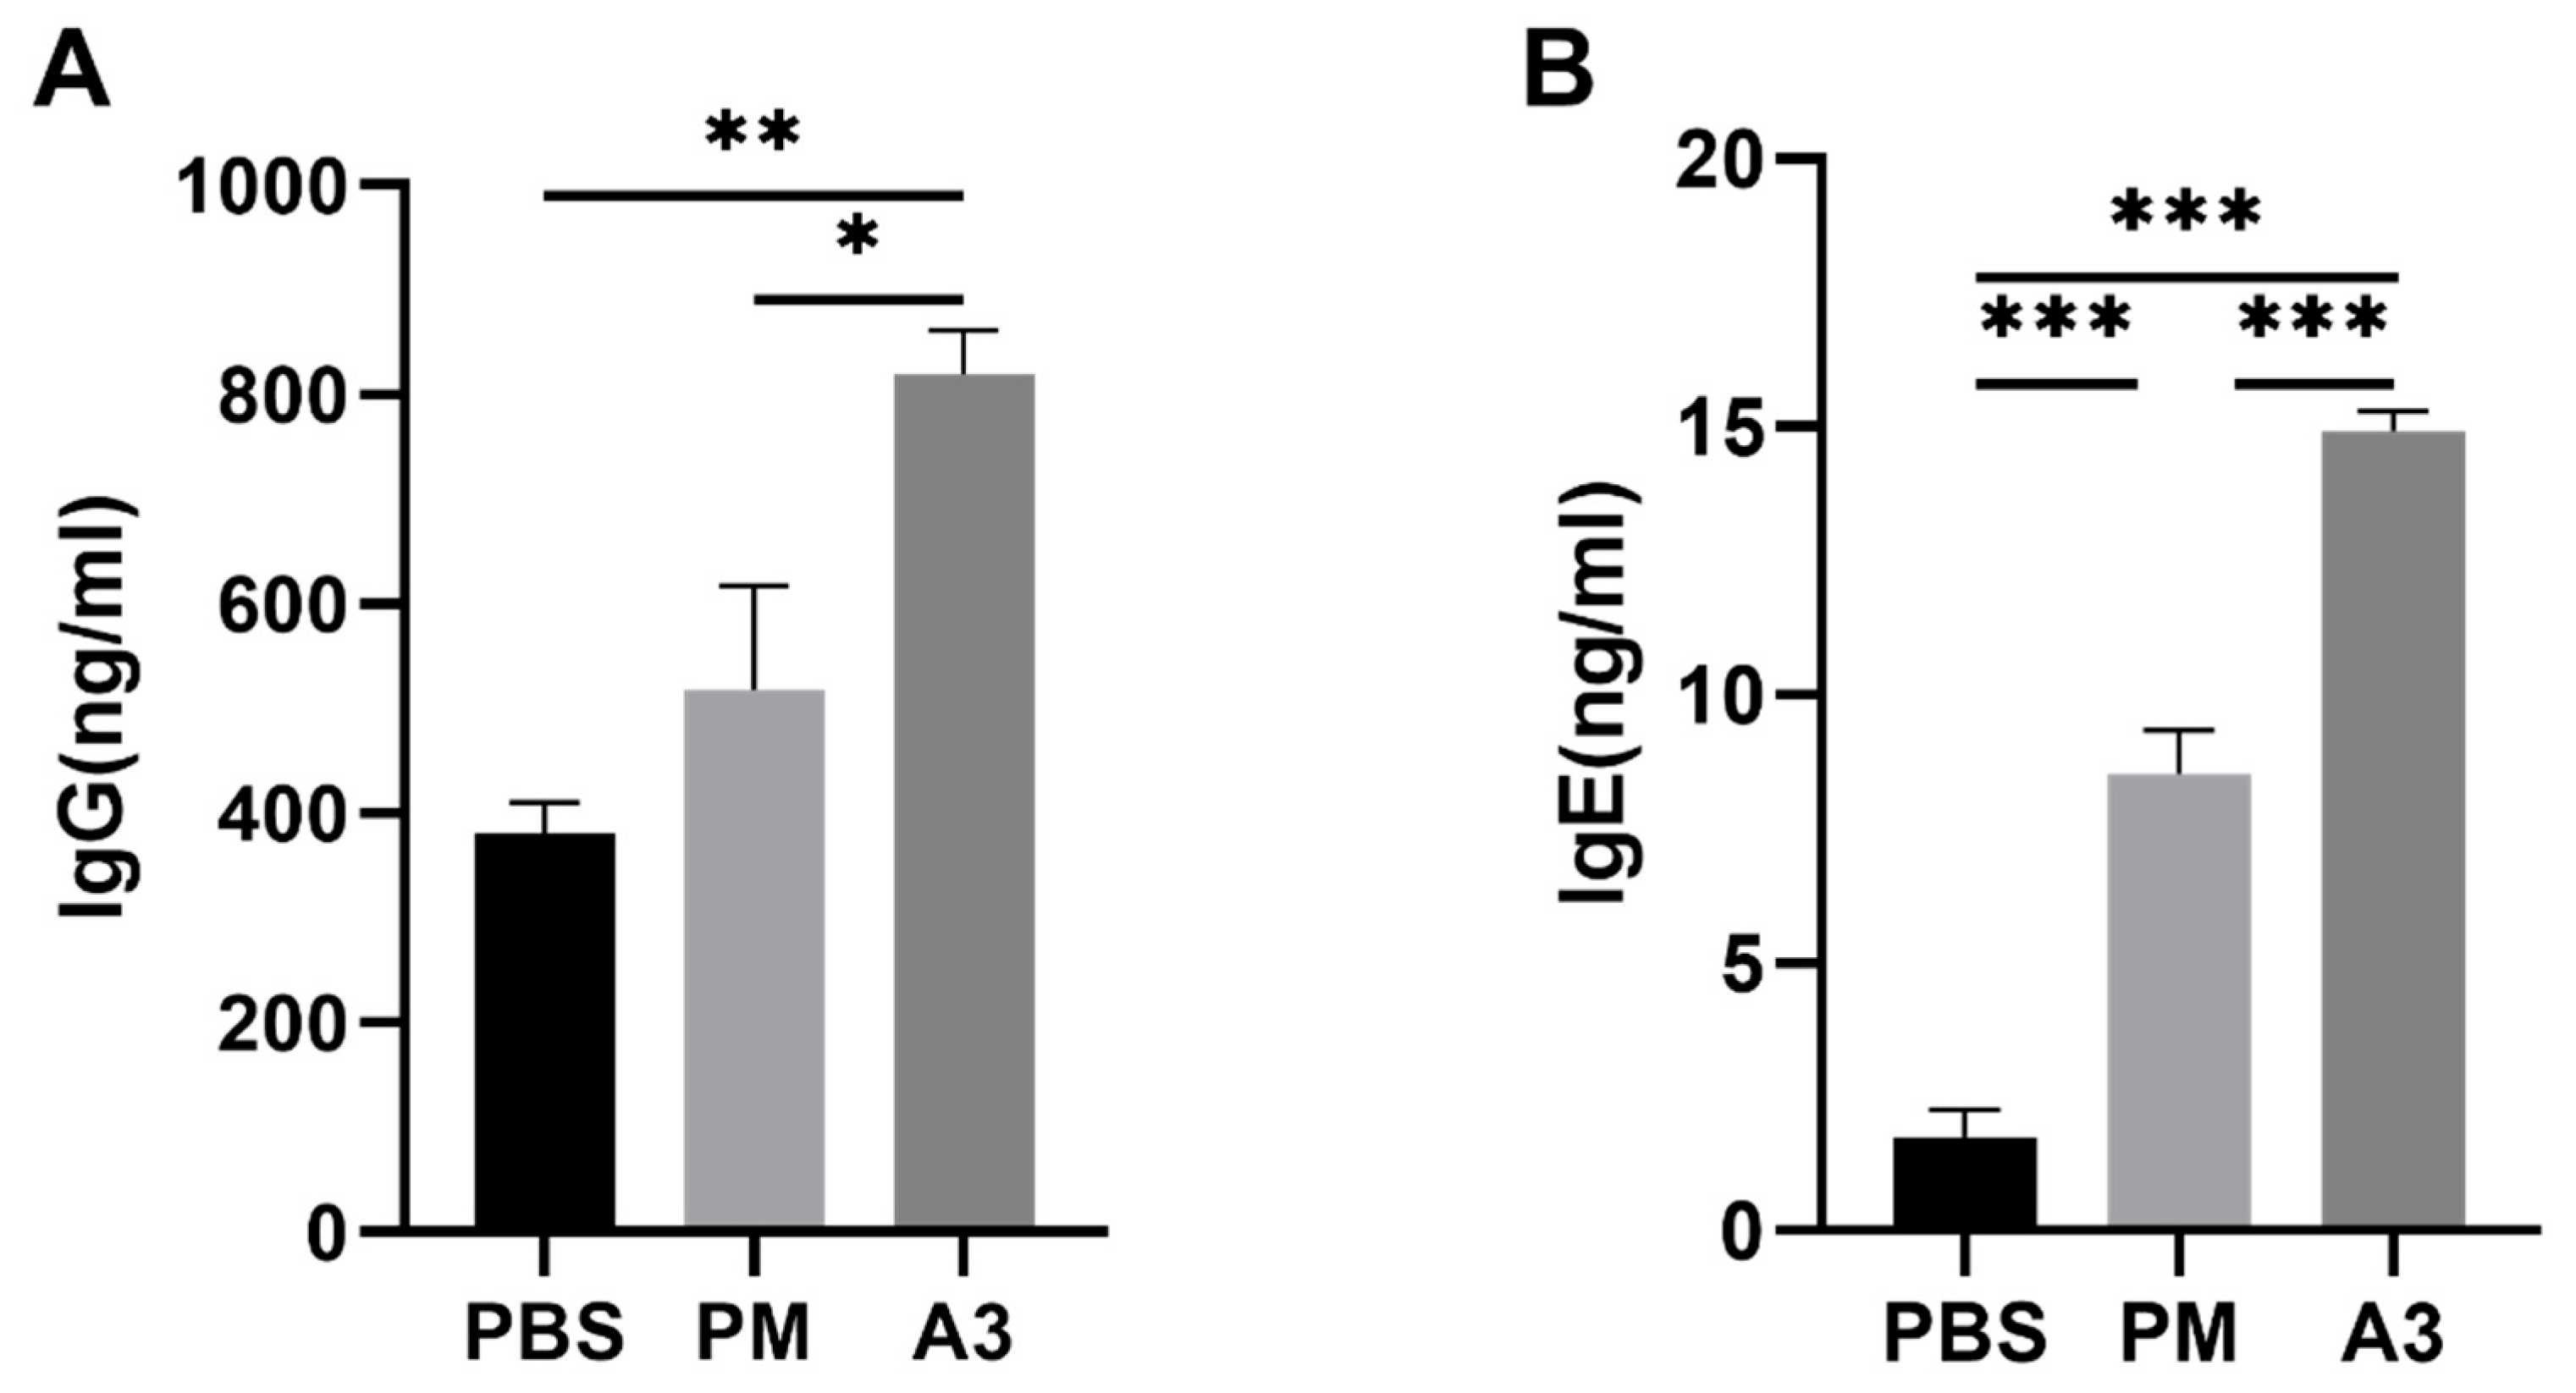
3.1. Expression Level of IgE and IgG Induced by Pla a3 Protein and PMs

Compared to the control group, the expression of both IgG (p < 0.01) and IgE (p < 0.001) significantly increased after exposure to the A3 protein (Figure 2A) and PMs (Figure 2B). These findings suggested that the mouse sensitization model was successfully established.

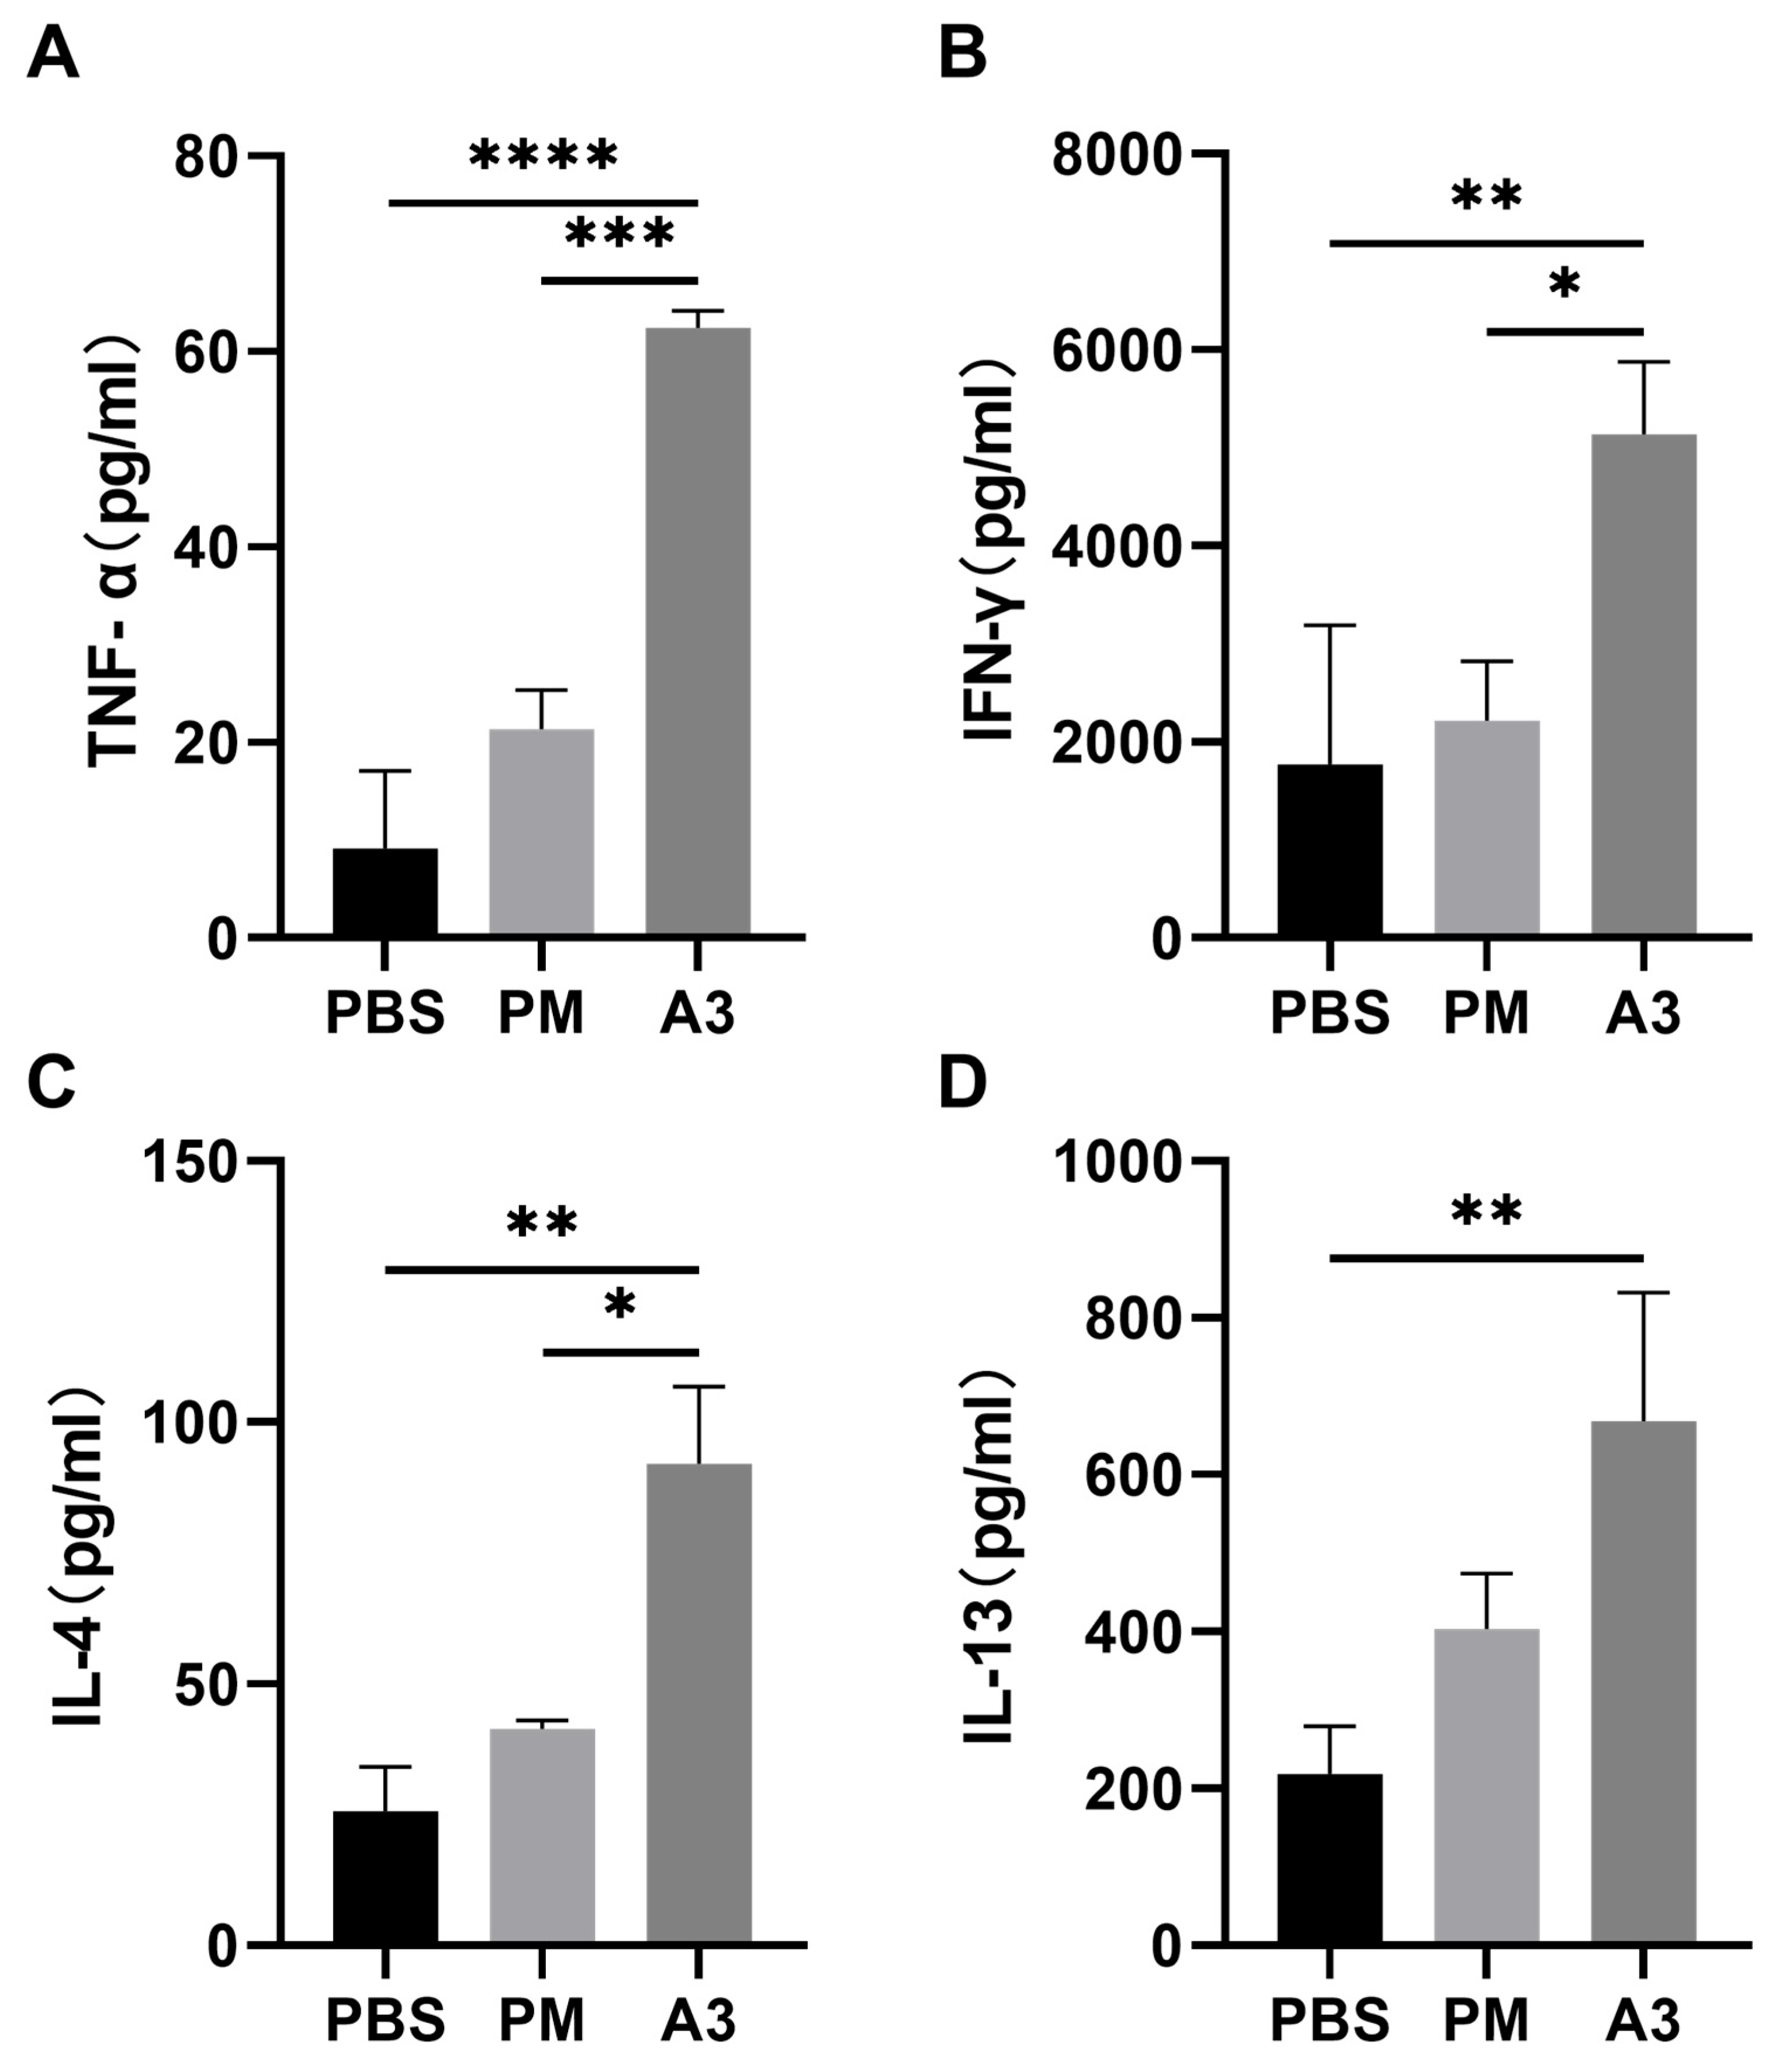
3.2. Inflammatory Cytokines in the Lung

Inflammatory cytokines, including TNF-α, IFN-γ, IL-4 and IL-13, in the lung tissue of mice increased after the mice were exposed to the A3 protein and PMs (Figure 3). However, only the mass level of the inflammatory cytokines in the A3 protein exposure group showed significant differences compared to that of the control group, while the PMs exposure group did not exhibit any significant differences compared to the control group.
Pathological sections and hematoxylin–eosin (HE) staining images were shown in Figure 4. Compared to the control group, the lung tissue of mice exposed to PMs showed inflammation, cell infiltration, enlarged airway epithelial cells, and a loose arrangement (Figure 4B). In the A3 protein exposure group, there was a significant enhancement in the inflammatory response, characterized by multiple inflammatory cell infiltrations and a significant increase in alveolar ratio (Figure 4C).

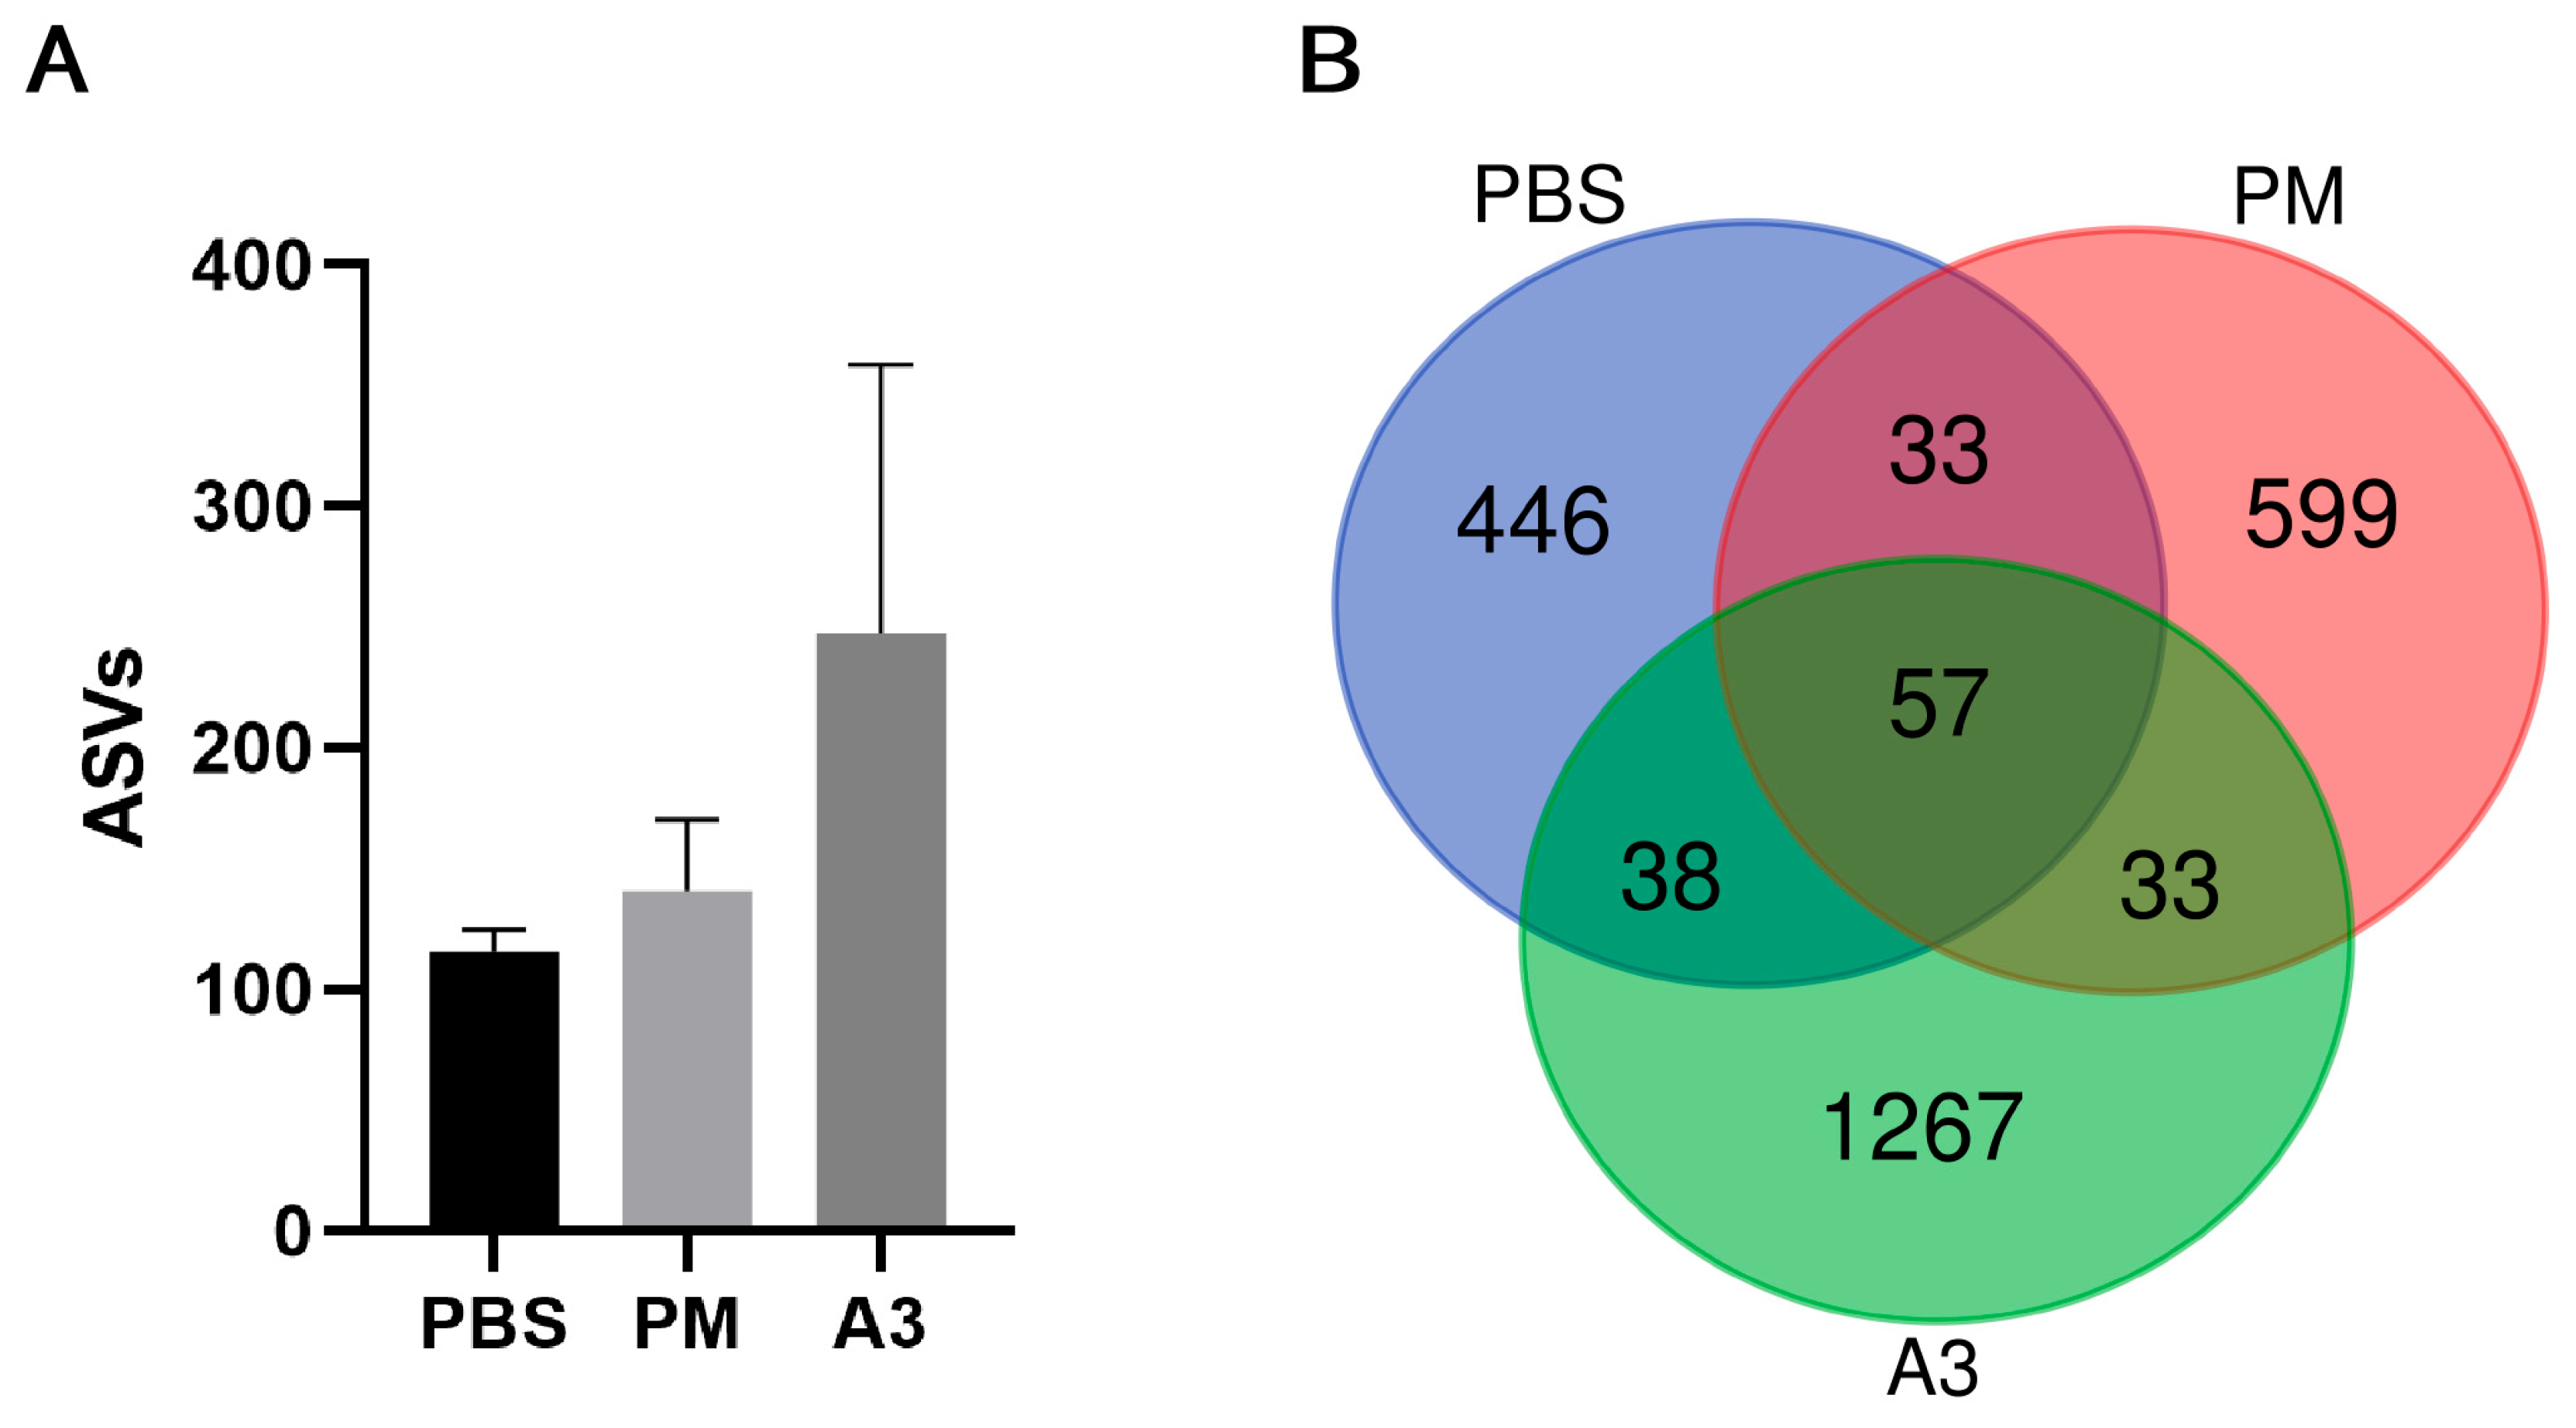
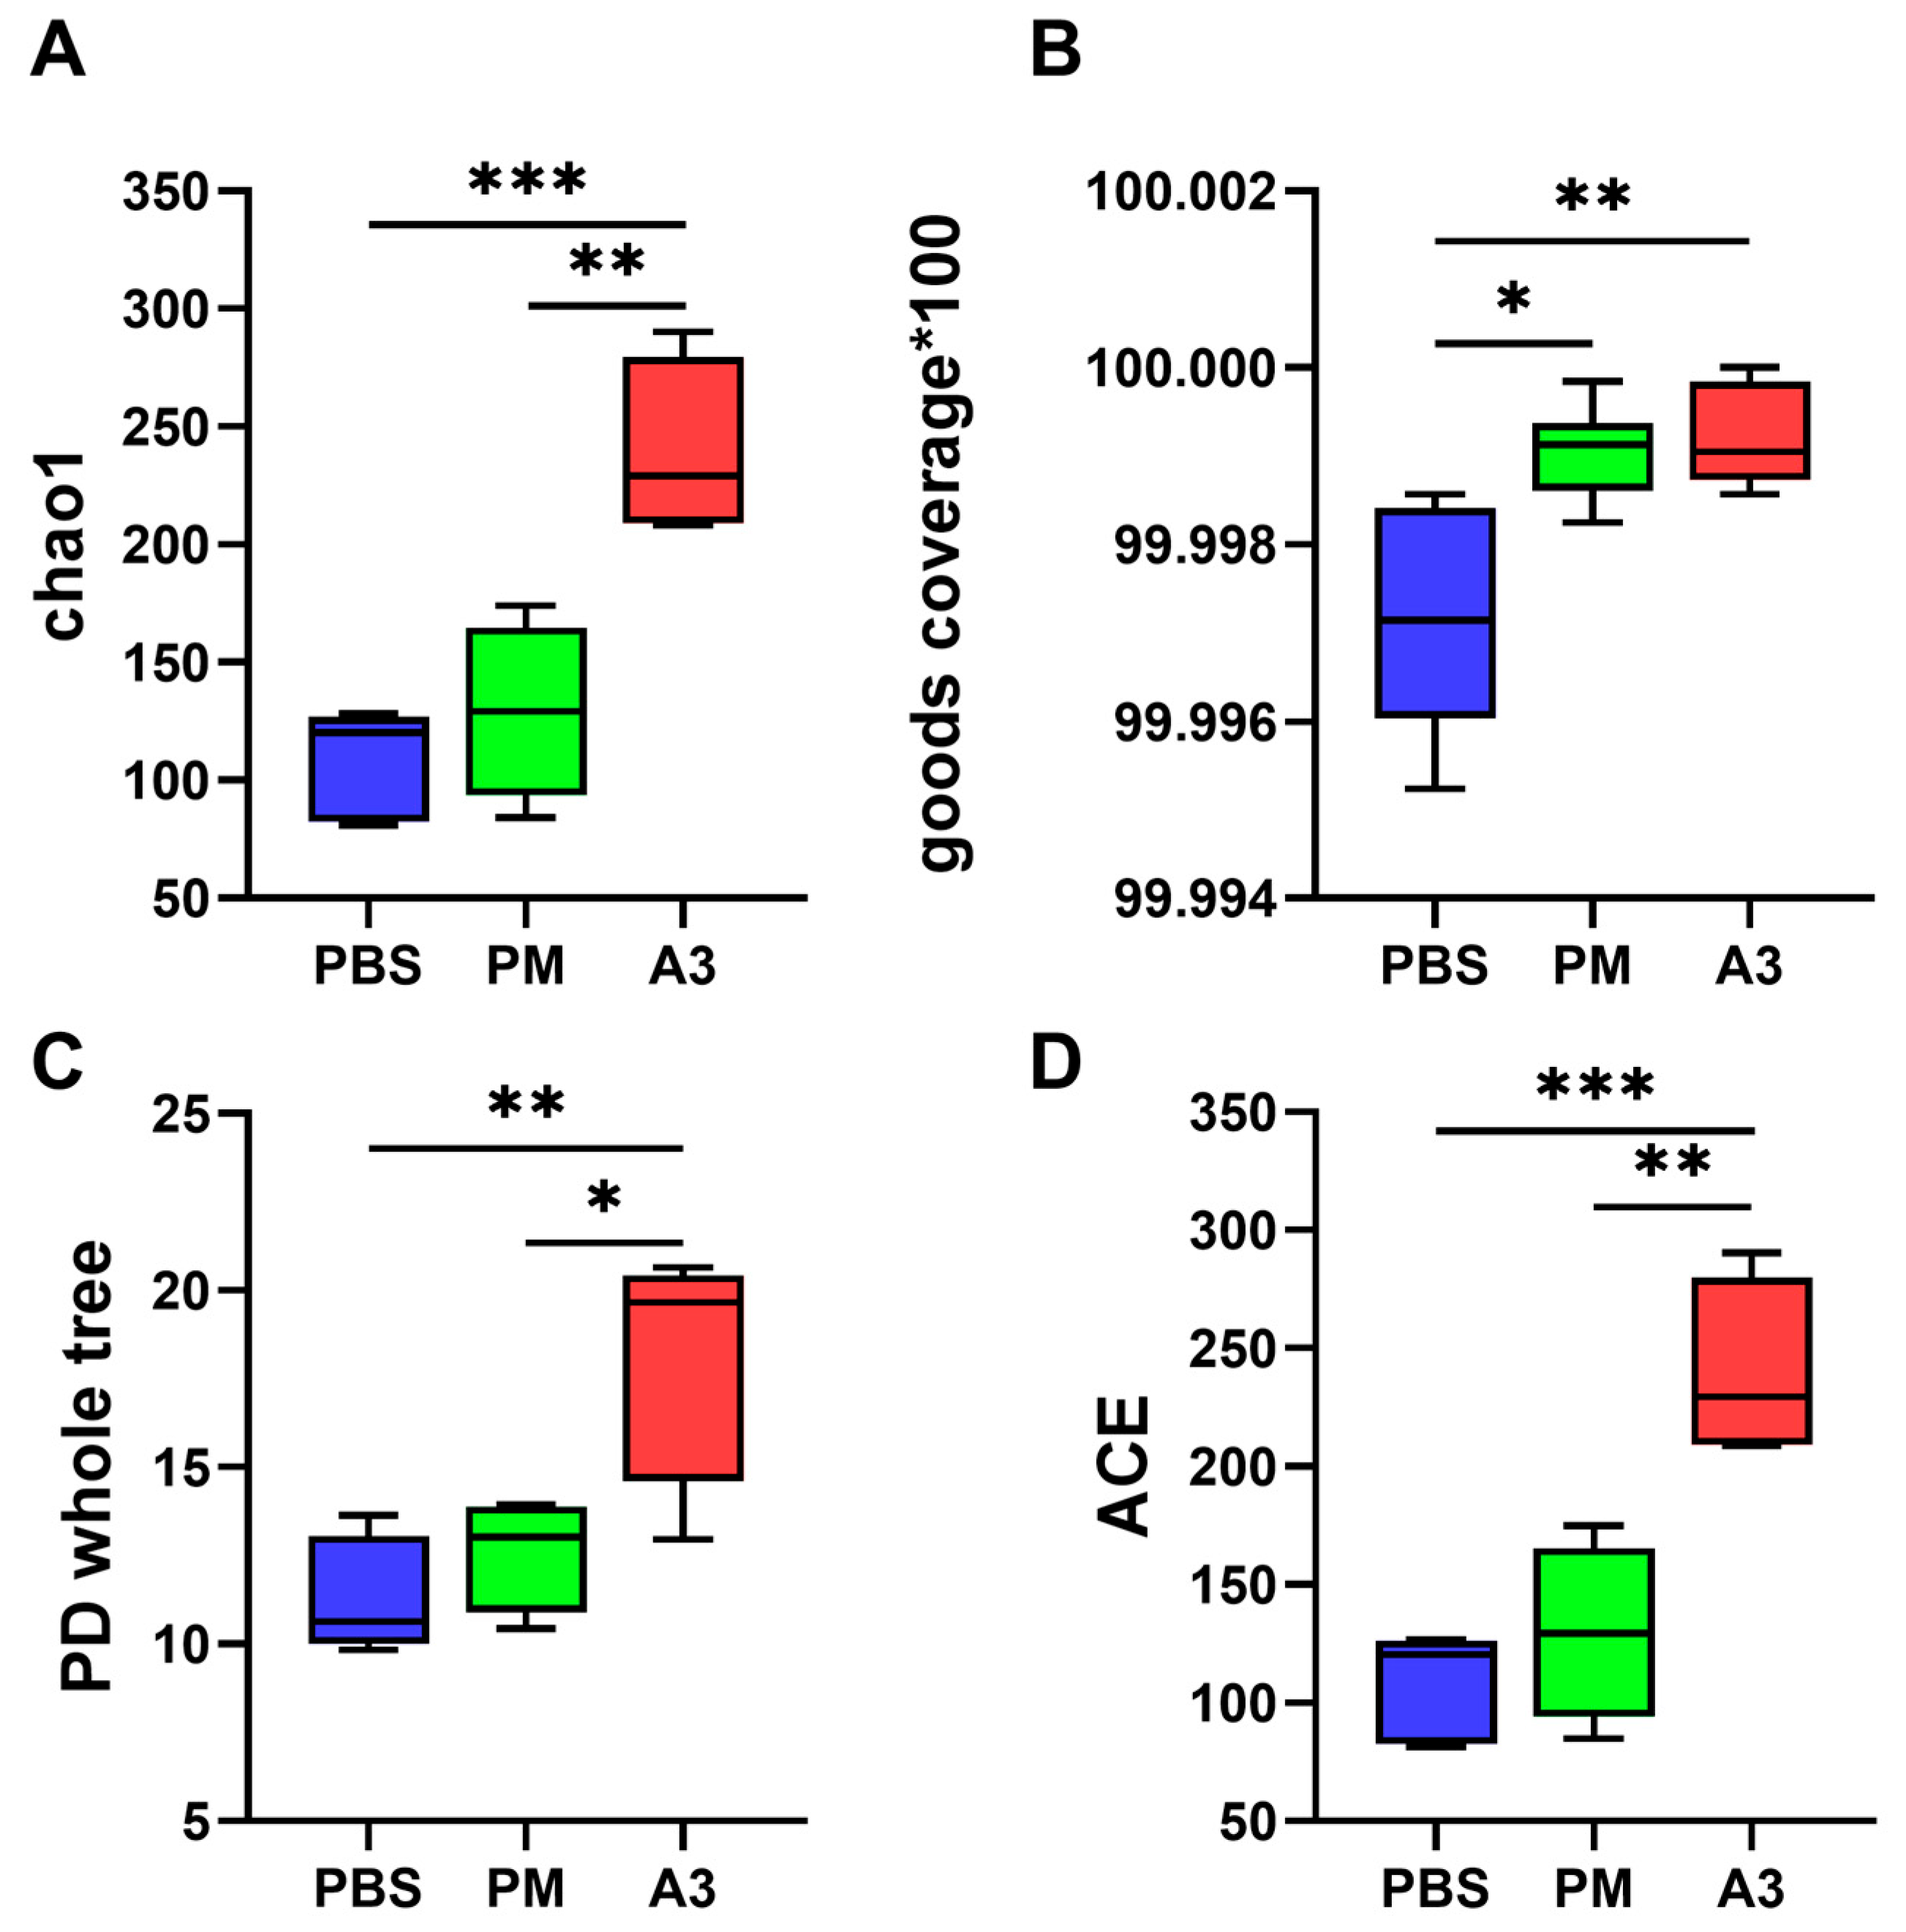
3.3. Microbial Diversity in Lung Tissue

A total of 19 samples (including seven samples from the PBS group, six samples from the A3 group, and six samples from the PM group) were analyzed using 16S rRNA gene sequencing. The average Amplicon Sequence Variant (ASV) values of both the PMs exposure group and the A3 protein exposure group increased, but there was no significant difference (Figure 5A). In total, 57 shared ASVs could be found among the three groups, 90 (33 + 57) between the control group and the PMs exposure group, 95 (38 + 57) between the control group and the A3 protein treatment group, and 90 (33 + 57) between the PMs exposure group and the A3 protein exposure group, respectively (Figure 5B).
Alpha diversity, which reflects the evenness of individual distribution among the community, was associated with two factors, i.e., species richness and diversity [13,14]. The alpha diversity indices of the study were shown in Figure 6, including Chao1 index (Figure 6A), Good’s coverage (Figure 6B), Phylogenetic Diversity (PD) whole tree index (Figure 6C), and ACE index (Figure 6D). Chao1 is an estimator based on the distribution of species abundance used to estimate the number of unobserved species. ACE (Abundance-based Coverage Estimator) also estimates the number of unobserved species based on abundance information. Both indices can take into account the contribution of low-abundance species, providing a representation of community richness. Good’s coverage estimates the proportion of observed species in the overall population. PD whole tree is a metric based on the length of the phylogenetic tree, representing the overall length of the phylogenetic relationships among all species in a sample. It places a greater emphasis on the phylogenetic relationships among species in a community. The alpha diversity indices (Chao1 index, Good’s coverage, Phylogenetic Diversity (PD) whole tree index, ACE index) of the microbial in the A3 protein exposure group had higher high value compared with that in the control group. Additionally, differences were observed in some alpha diversity indices between the group exposed to PMs and the group exposed to A3 protein.
Beta diversity was assessed using principal component analysis (PCA), and nonmetric multidimensional scaling analysis (NMDS). The parameters were used to determine the diversity of microbial communities across different groups. The PCA plot displayed differences in the composition of the lung tissue microbiome among different groups (Figure 7A). Unweighted Unifrac calculations were performed, followed by Anosim test (p = 0.002, R > 0); p < 0.05 indicated that the analysis was statistically significant, and R > 0 indicated that the difference between the groups was greater than that in individual groups. The NMDS plot (Figure 7B) showed that differences in the lung microbiome between the groups (i.e., the control group, PMs group and A3 group) were greater than that in individual groups. These results suggested that the lung tissue microbiome of mice exposed to PMs and A3 protein differed from that of the control group.

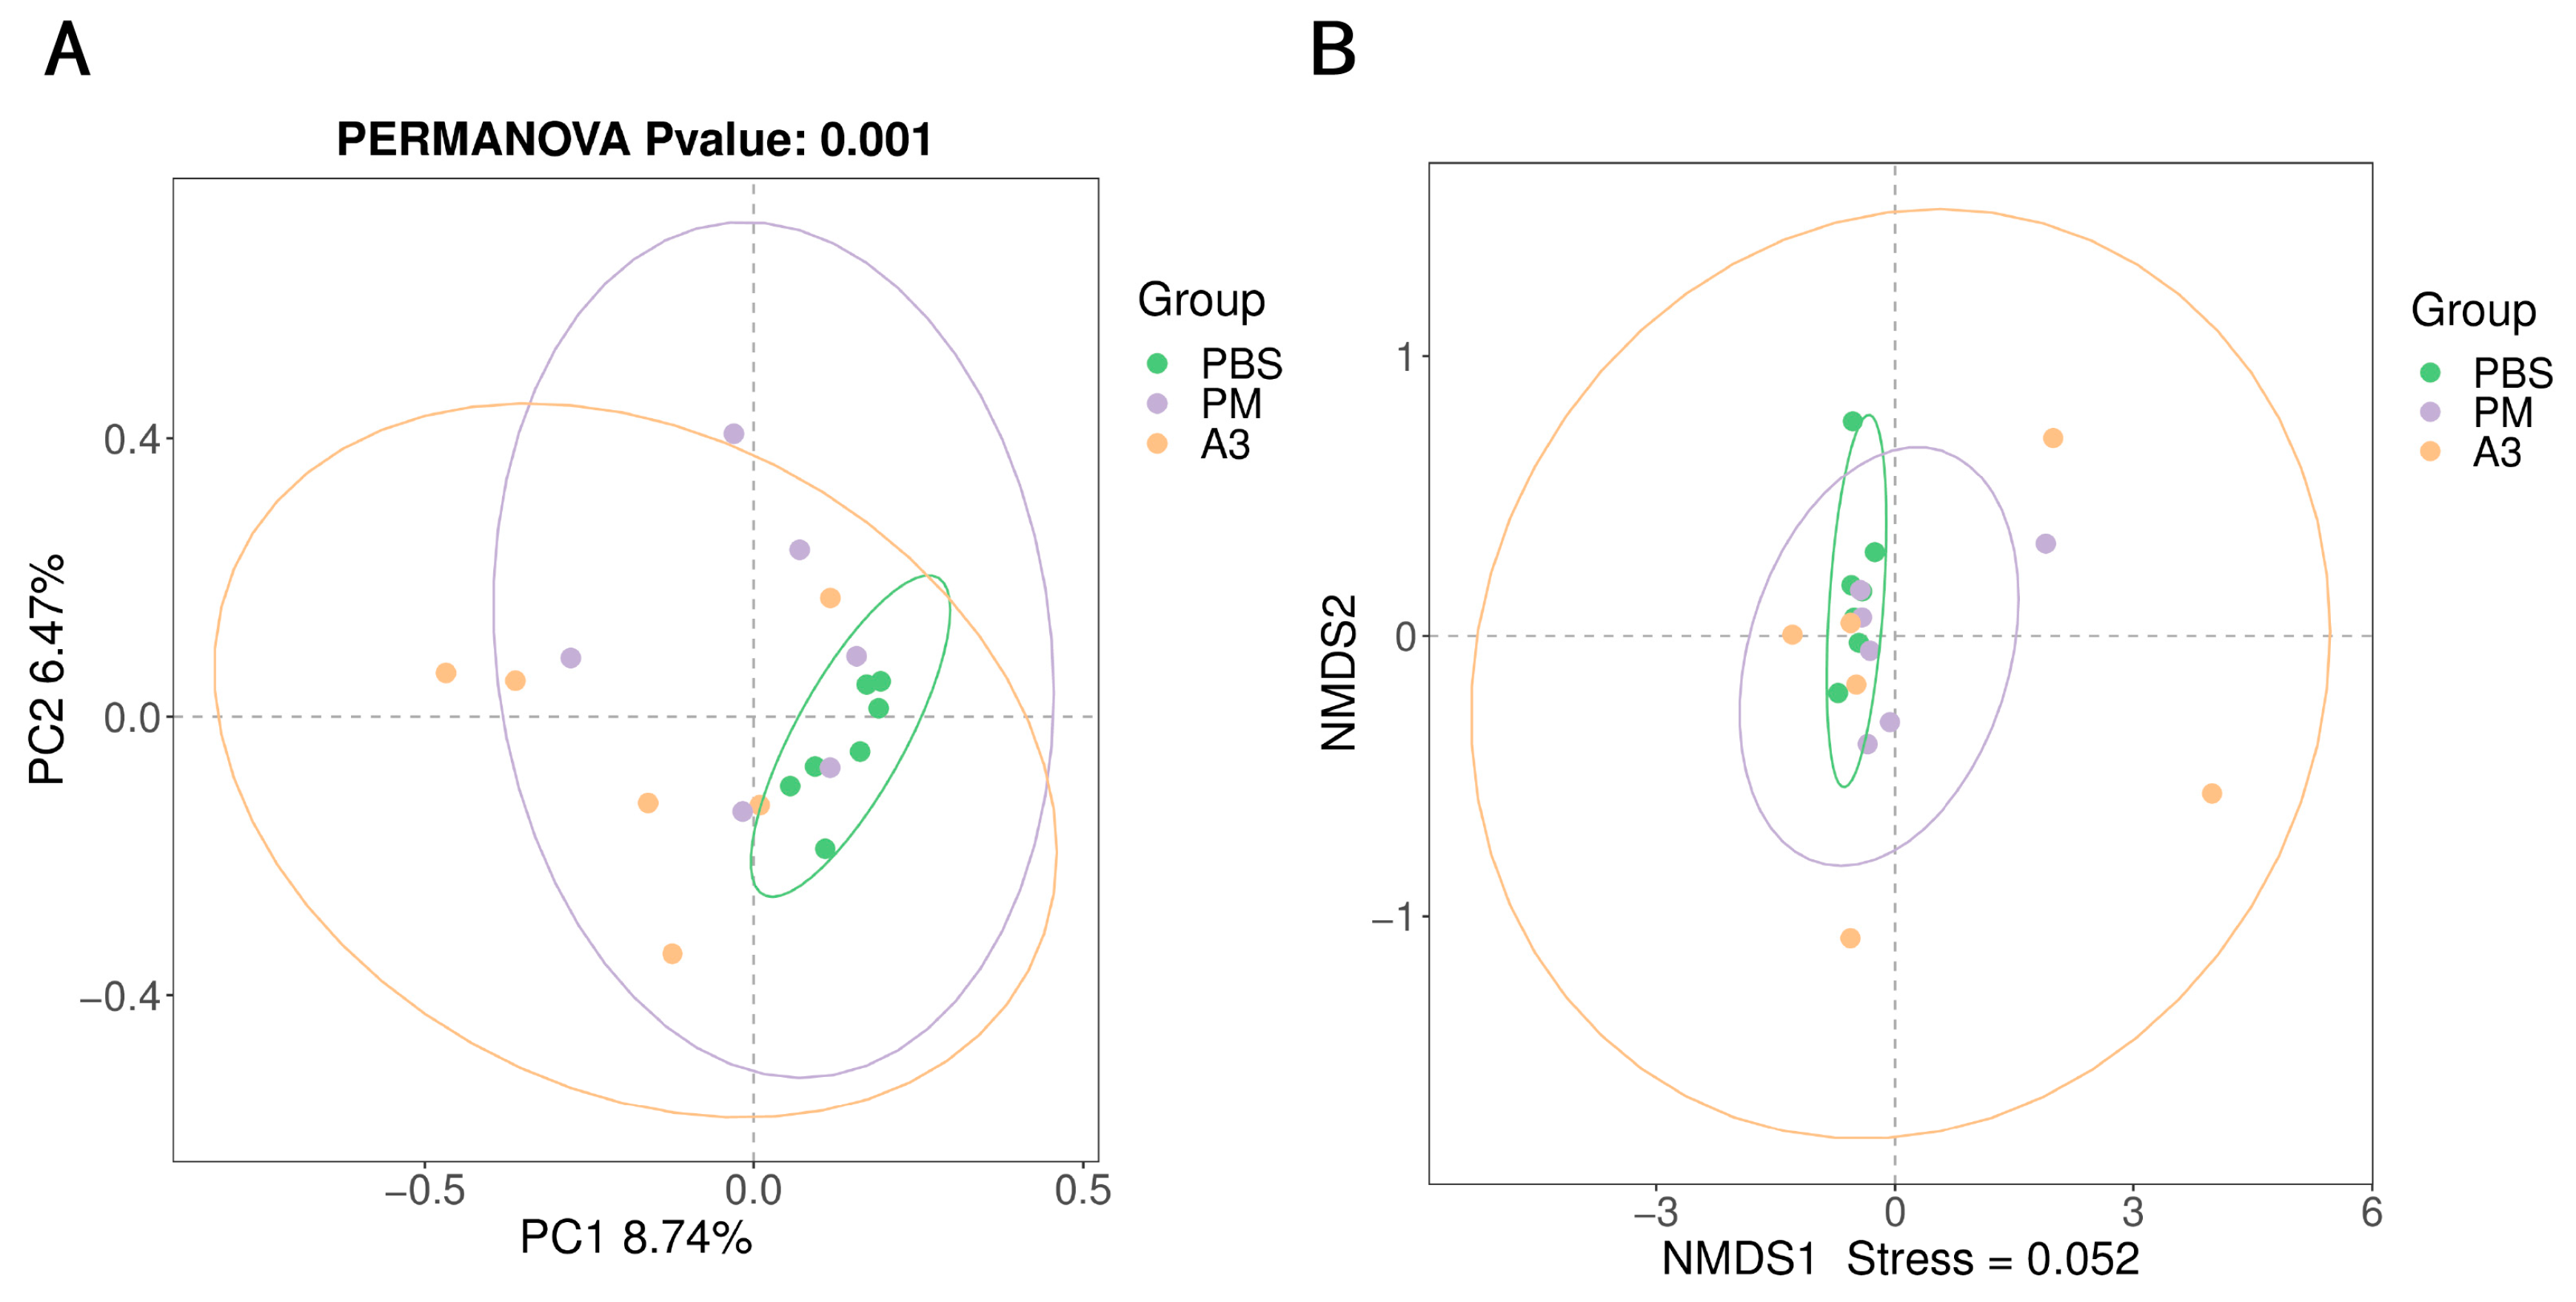
3.4. Microbial Community in the Lung Tissue

At the phylum level, the five bacterial phyla most predominant in the measured samples (PBS, PMs and A3 group) were Firmicutes (its percentage among the microbial community was 33.96%, 46.11%, 43.98% in the PBS, PMs and A3 samples, respectively); Proteobacteria (23.39%, 26.90%, 22.95%); Bacteroidota (15.81%, 12.55%, 16.09%); Spirochaetota (13.26%, 5.67%, 3.41%); and Actinobacteriota (2.34%, 2.83%, 2.95%). The first four bacterial phyla accounted for over 85% of the total bacteria (Figure 8A), and the abundance of the bacterial phyla was different in the three exposure groups (Figure 8B).
At the phylum level, the five bacterial phyla most predominant in the three samples were Mycoplasmatales (15.13%, 36.31%, 21.92%), Bacteroidales (11.36%, 9.38%, 10.24%), Brevinematales (13.26%, 5.67%, 2.67%), Lactobacillales (3.50%, 5.41%, 12.44%), and Lachnospirales (8.59%, 2.13%, 4.38%) (Figure 8C,D). Among them, Lactobacillales showed significant differences between the control group and the A3 protein exposure group (p < 0.01). In the lung tissue of mice exposed to the A3 protein, the abundance of Mycoplasmatales and Lactobacillales increased; however, that of Brevinematales and Lachnospirales decreased.
At the genus level, the top five most abundant microbiota in all groups included Mycoplasma (its percentage in the PBS, PMs and A3 samples was 15.13%, 36.26%, 21.90%, respectively), Brevinema (13.26%, 5.67%, 2.67%), Muribaculaceae (3.47%, 5.33%, 7.45%), Lactobacillus (3.07%, 2.71%, 4.98%), and Clade Ia (6.03%, 3.91%, 0.40%) (Figure 8E,F). Significant differences (p < 0.01) of the abundance of the Lactobacillus could be found between the control group and the A3 protein exposure group. The data also showed that the abundance of the Mycoplasma, Muribaculaceae, and Lactobacillus increased, and that of Brevinema and Clade Ia decreased after the mice were exposed to the A3 protein.
The LEfSe (linear discriminant analysis (LDA) coupled with effect size measurements) analysis method was used to analyze the genera of bacteria that were relatively enriched among different groups; our data revealed that the control group of mice had the following biological markers: Coriobacterialesd (belonging to Coriobacteriiae), Vibrionaceaej (belonging to Vibrionales), Methyloversatilis (belonging to Rhodocyclaceae), Azospirillum (belonging to Azospirillaceaeg and Azospirillalesh), and Diaphorobacter. The biological marker in the PMs treatment group was Pseudoxanthomonas. The biological markers in the A3 protein treatment group were Acidobacteriales (belonging to Acidobacteriae), Enterococcus (belonging to Enterococcaceae), Desulfovibrio (belonging to Desulfobacterota), and Ferruginibacter (Figure S3). All of these markers increased in abundance after exposure to the protein.

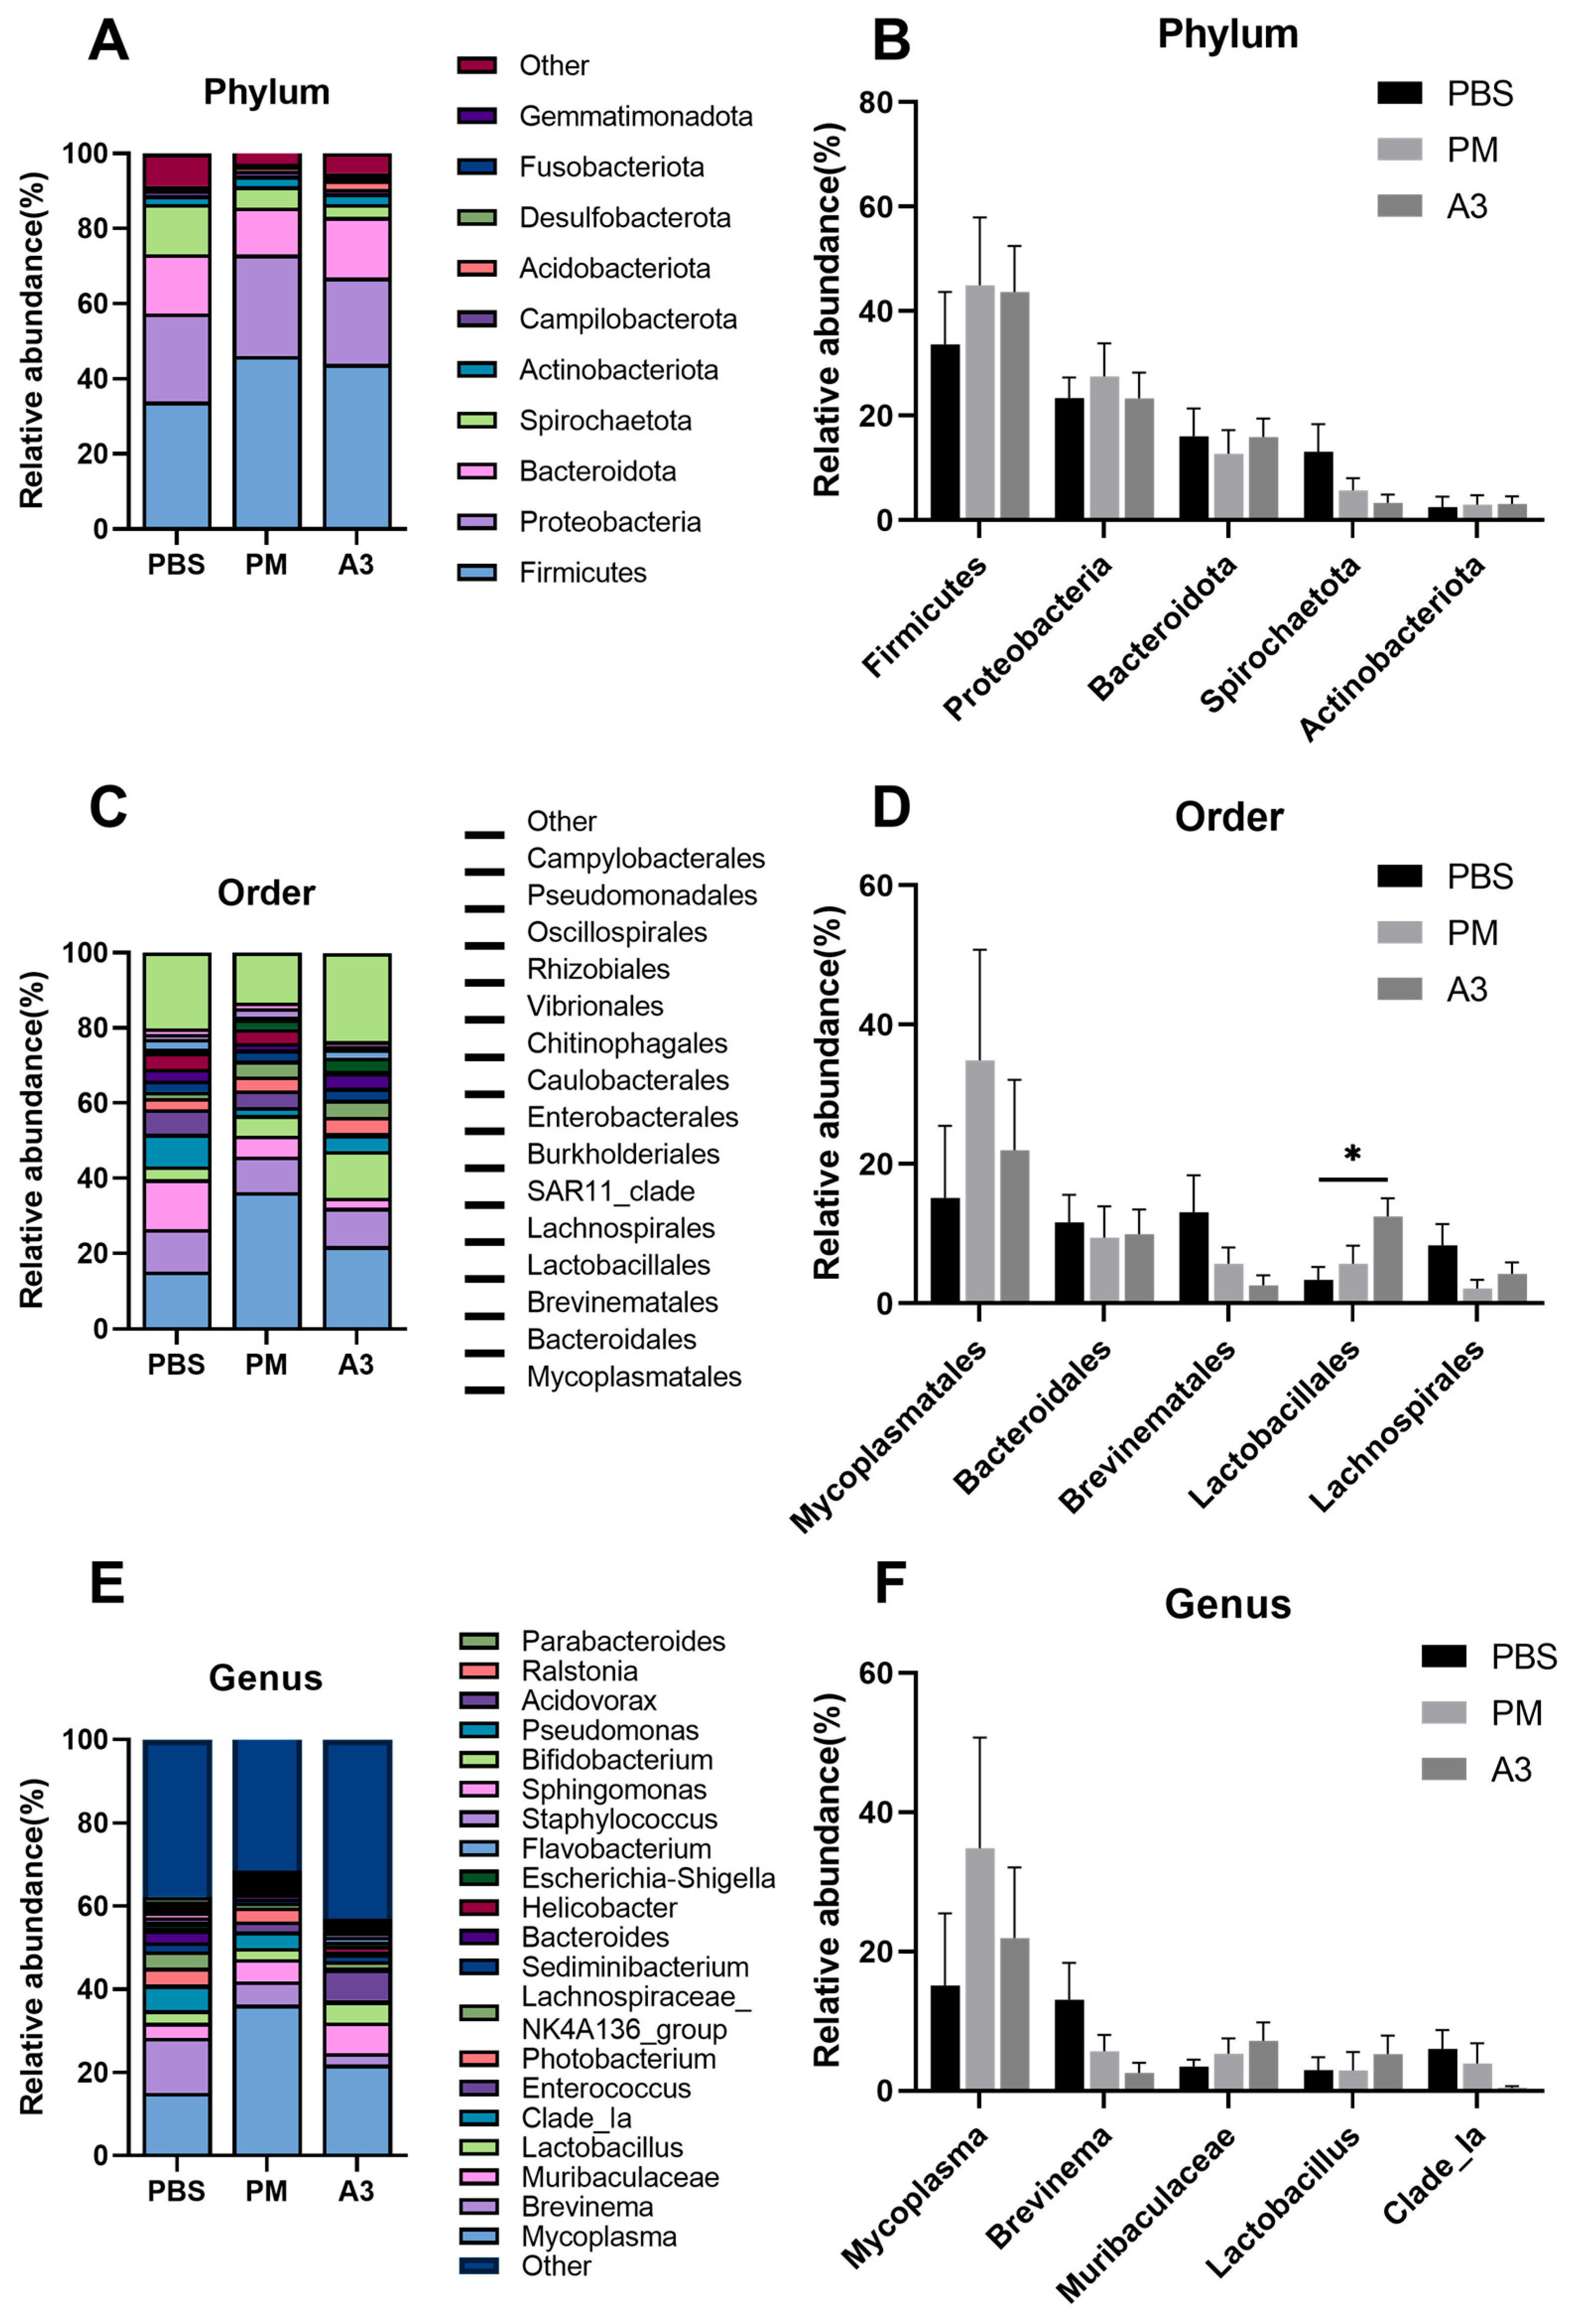
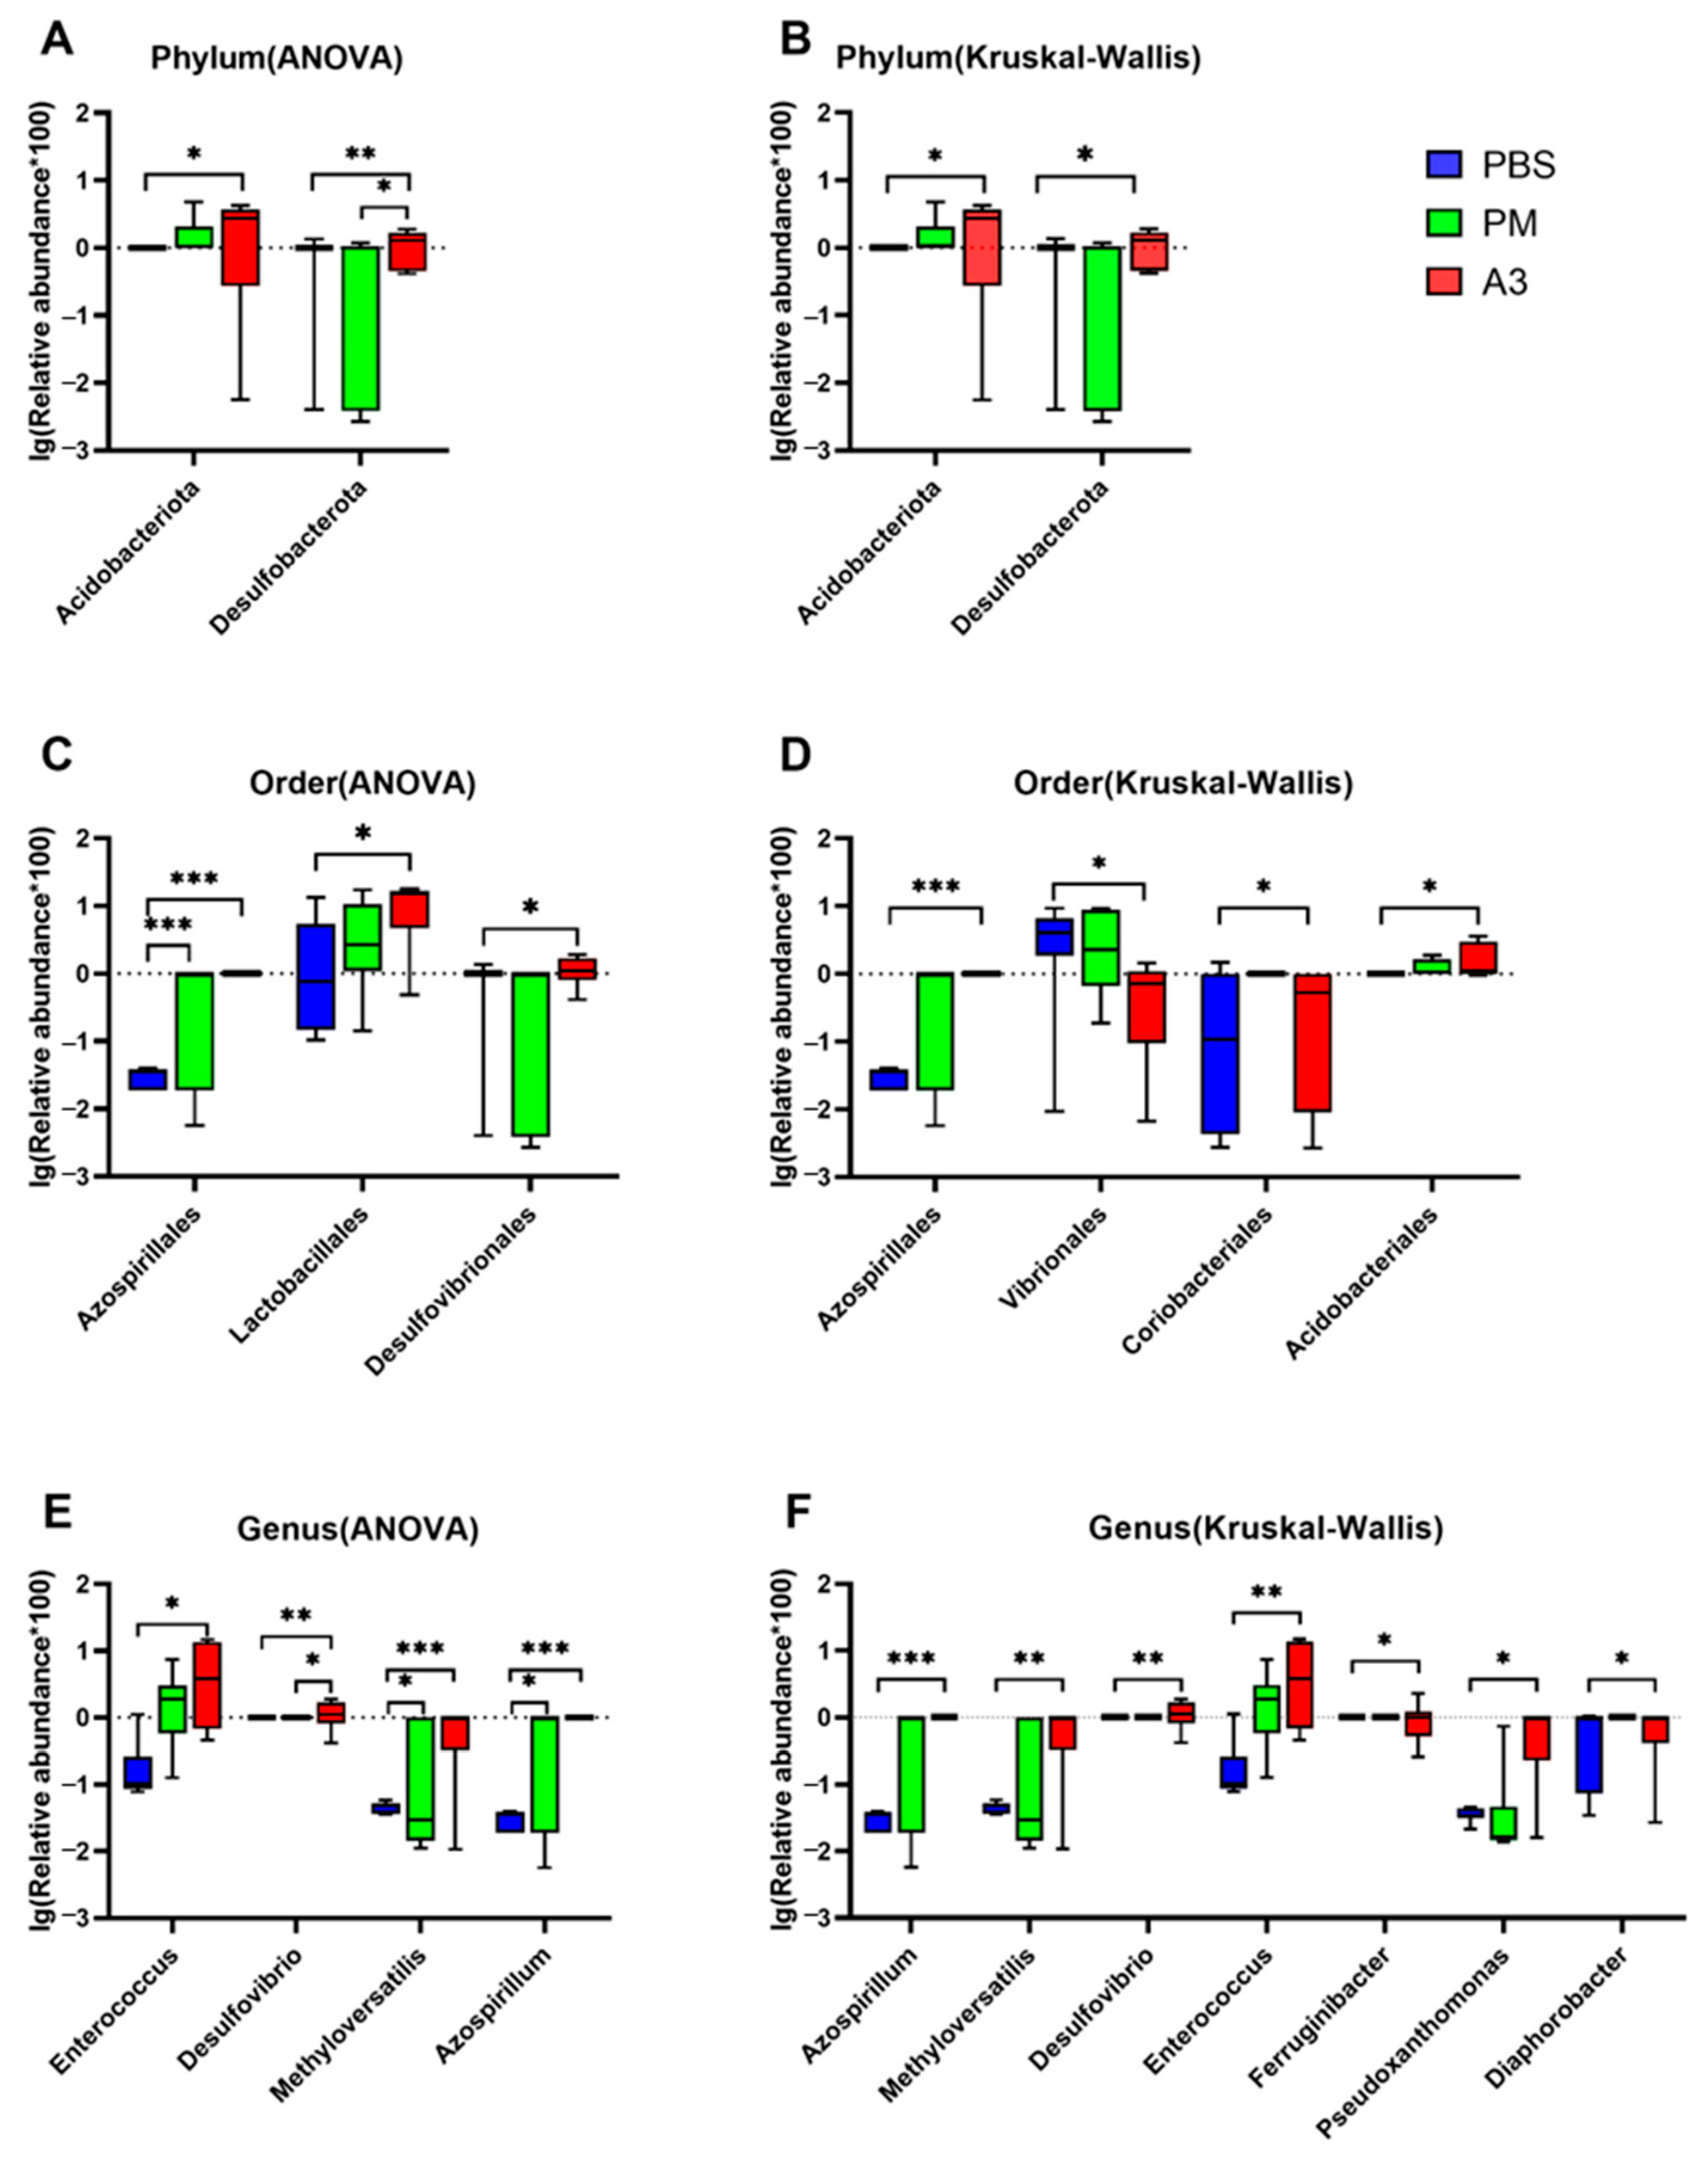
3.5. Comparison of Differences of the Microbiota at Phylum, Order, and Genus Levels in the Samples

Differences in the relative abundance of microorganisms at the phylum, order, and genus levels were analyzed by one-way analysis of variance (ANOVA) analysis and the Kruskal–Wallis test. Significant differences in the abundance of the microbial between the three groups were observed (Figure 9).
As shown in the ANOVA analysis, the relative abundance of Desulfobacterota (p < 0.01) and Acidobacteriota (p < 0.05) was significantly decreased at the phylum level in the A3 group compared with the control group (Figure 9A). In contrast, in the Kruskal–Wallis analysis, the A3 group exhibited significantly lower relative abundance of Desulfobacterota (p < 0.01) and Acidobacteriota (p < 0.05) at the phylum level compared to the control group (Figure 9B).
At the order level, in the ANOVA analysis, the relative abundance of Azospirillales was significantly decreased (p < 0.001), while that of Lactobacillales (p < 0.05) and Desulfovibrionales (p < 0.05) was significantly increased in the A3 group compared to the control group (Figure 9C). In the Kruskal–Wallis analysis, Azospirillales (p < 0.001), Vibrionales (p < 0.05), Coriobacteriales (p < 0.05), and Acidobacteriales (p < 0.05) exhibited significant differences in abundance (Figure 9D).
At the genus level, in the ANOVA analysis, Methyloversatilis (p < 0.001) and Azospirillum (p < 0.001) exhibited a significant decrease in relative abundance, while Desulfovibrio (p < 0.01) and Enterococcus (p < 0.05) demonstrated a significant increase in relative abundance in the A3 group compared to the control group (Figure 9E). In the Kruskal–Wallis analysis, Azospirillum (p < 0.001) and Methyloversatilis (p < 0.01) had a significantly lower relative abundance, while Desulfovibrio (p < 0.01), Enterococcus (p < 0.01), Ferruginibacter (p < 0.05), Pseudoxanthomonas (p < 0.05), and Diaphorobacter (p < 0.05) had a significantly higher relative abundance in the A3 group compared to the control group (Figure 9F).

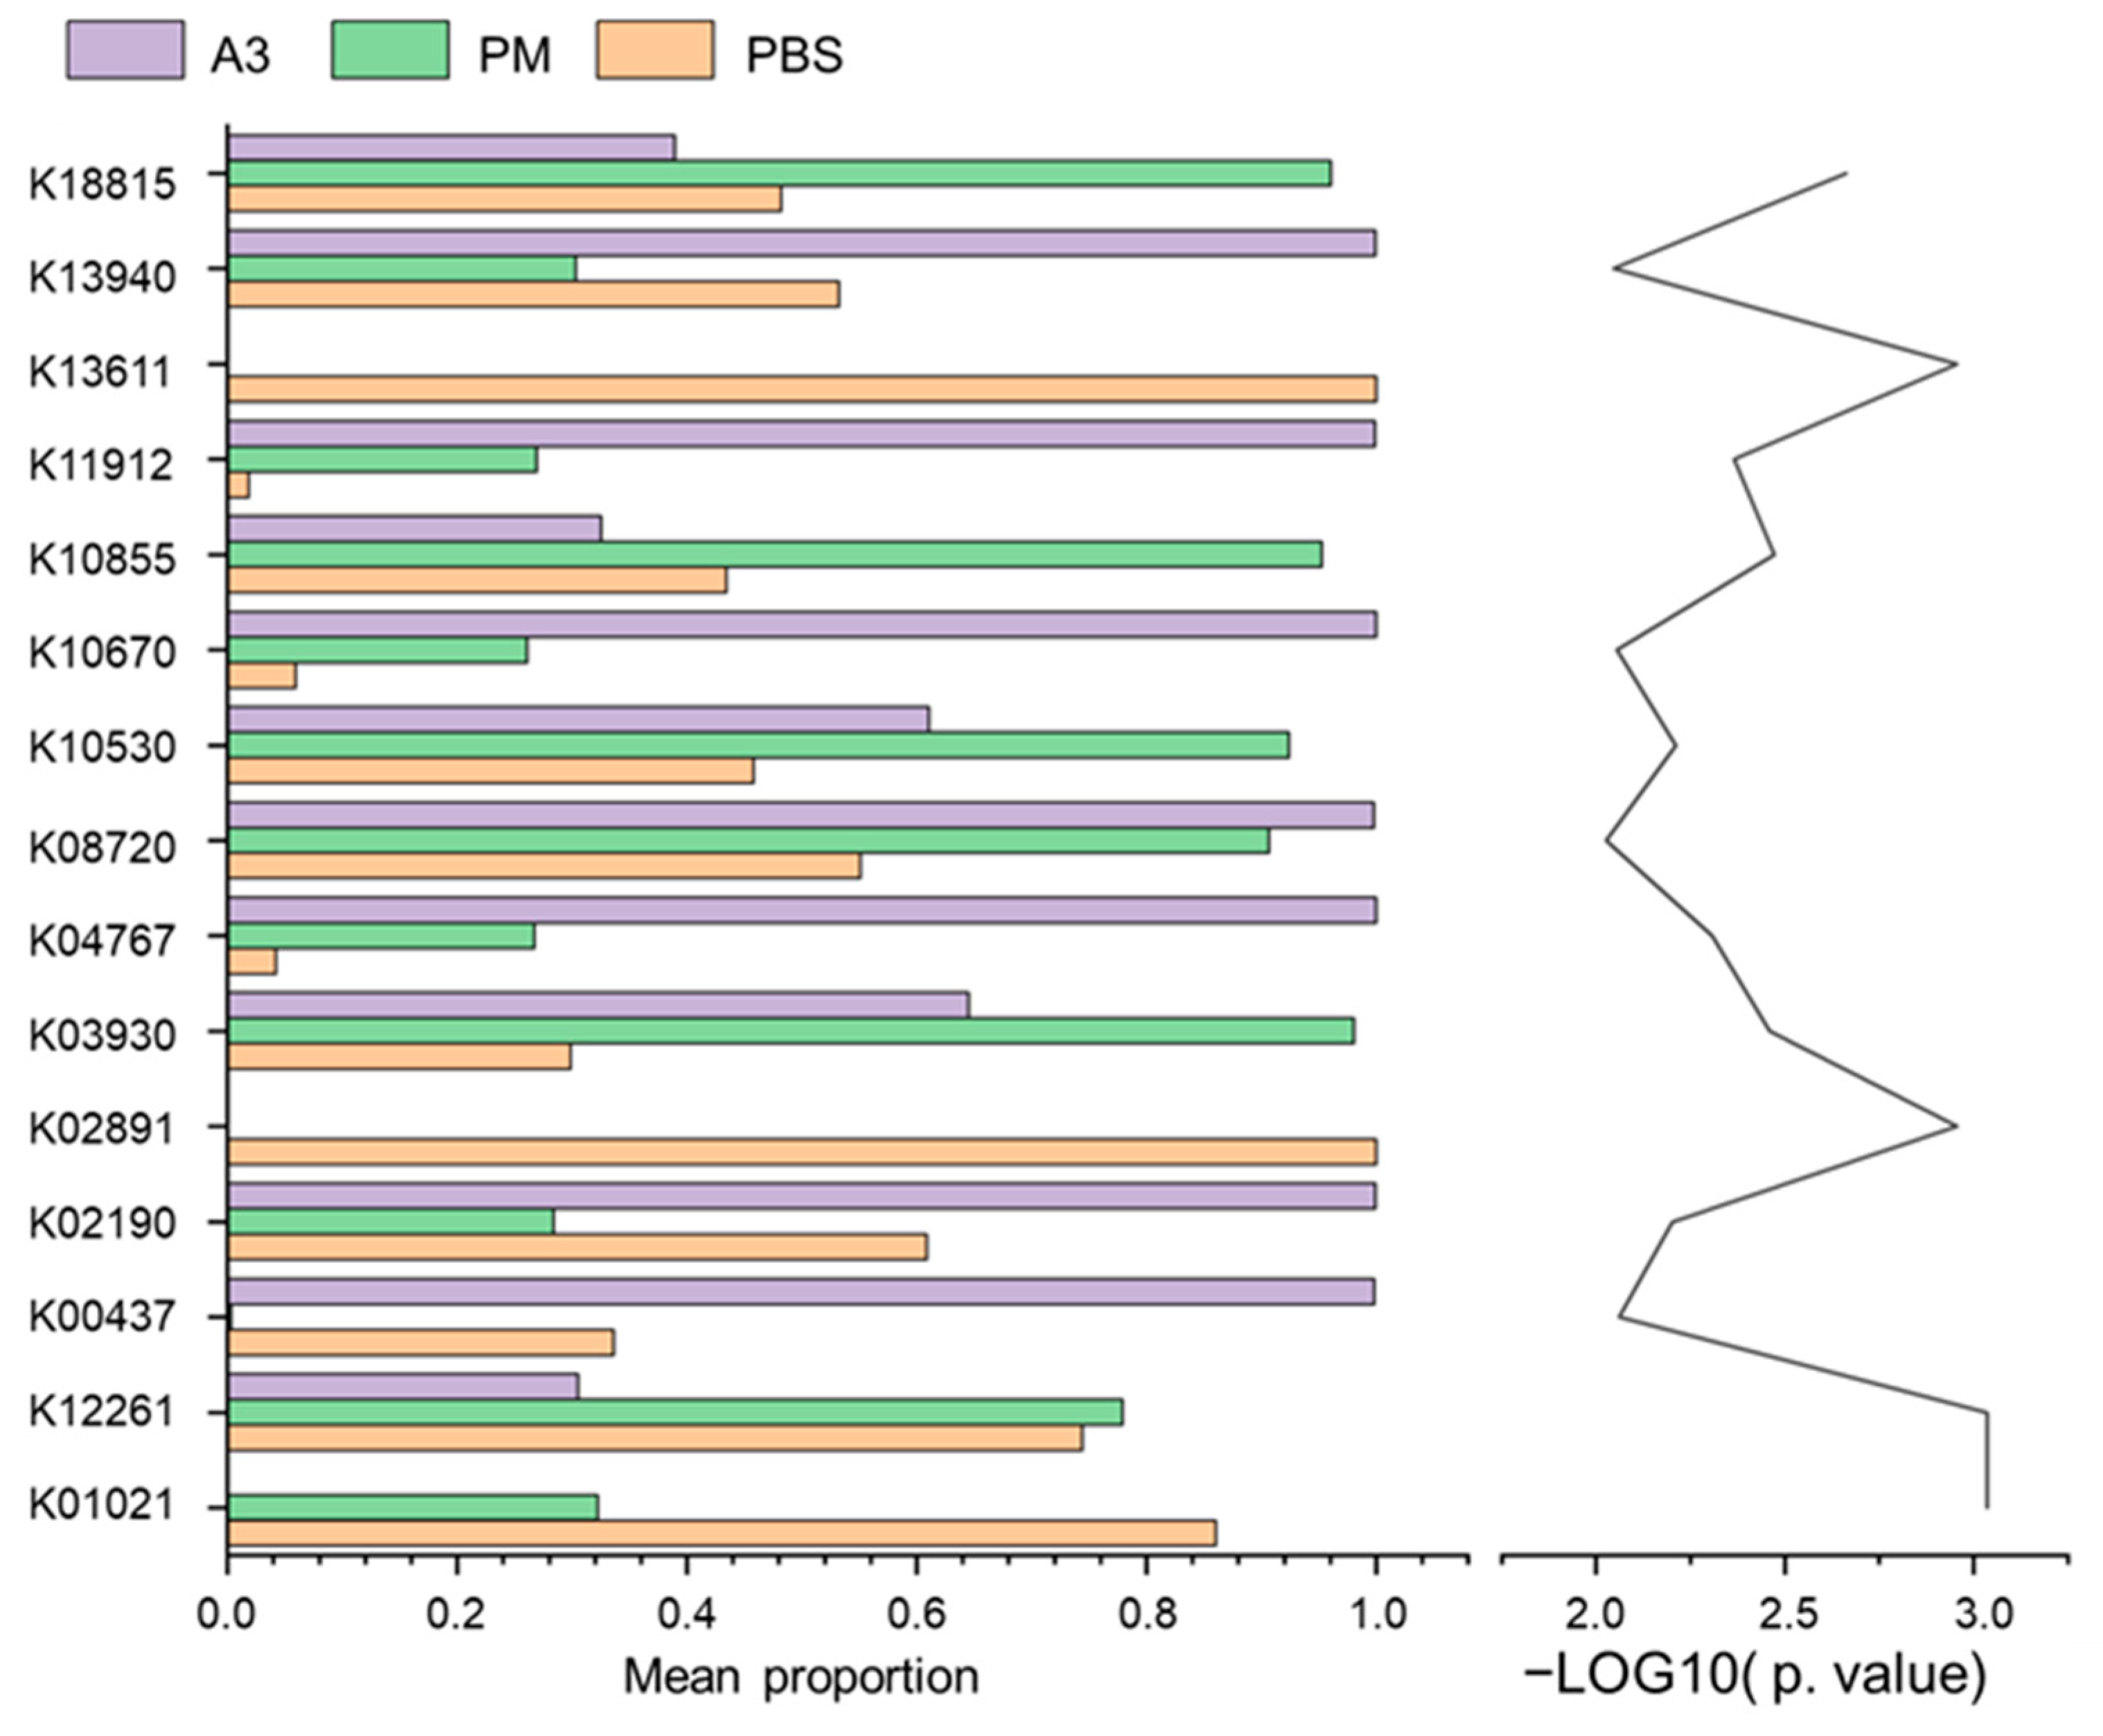
3.6. Functional Prediction of Lung Microbiota

Phylogenetic Investigation of Communities by Reconstruction of Unobserved States 2 (PICRUSt2) method was employed to investigate the impact of microbial communities on the related disease [15]. Our data showed that the KEGG pathways of the microbial proteins and enzymes, including K01021 protein-tyrosine sulfotransferase (TPST), K12261 2-hydroxyacyl-CoA lyase 1 (HACL1), K02891 large subunit ribosomal protein L22e (RPL22), K13611 bacillaene biosynthesis, polyketide synthase/nonribosomal peptide synthetase (PksJ/BaeJ), K18815 aminoglycoside 6‘-N-acetyltransferase I (aac6-I), K10855 acetone carboxylase (acxA), K03930 putative tributyrin esterase (estA), K11912 serine/threonine-protein kinase (PpkA), K04767 acetoin utilization protein (Acub), K10530 L-lactate oxidase (lctO), K02190 sirohydrochlorin cobaltochelatase (cbiK), K00437 hydrogenase large subunit (hydB), K10670 glycine/sarcosine/betaine reductase complex component A (grdA), K13940 dihydroneopterin aldolase/2-amino-4-hydroxy-6-hydroxymethyldihydropteridine diphosphokinase (sulD), and K08720 outer membrane protein (OmpU), varied differently after the mice were exposed to PMs and the A3 protein (Figure 10). These changes could contribute to the development of allergenic diseases.

3.7. The Relationship between Inflammatory Cytokines and Microbiota Alterations in Lung Tissue Samples

Different samples of the mice induced by the relative abundance of microbes in the lung tissue and cytokines in mice test results in OE cloud platform (https://cloud.oebiotech.com/task/, accessed on 12 April 2024) were analyzed as regards correlation. The Spearman’s correlation coefficient between microbiota and inflammatory factors was calculated, and the correlation between them was listed in the correlation heatmap (Figure S4A,B). The test results are shown in Table S2. Firmicutes, which accounted for the majority of the lung microbiota, showed a positive correlation with IgE. In addition, Desulfobacterota and Acidobacteriota showed a positive correlation with IgE, while Deferribacterota showed a negative correlation with IgE. Similarly, Desulfobacterota and Acidobacteriota showed a positive correlation with IgG. All of the aforementioned correlations exhibited significant disparities. Our data showed that alterations in lung microbiota were strongly correlated with the levels of immunoglobulins in the mouse serum. Furthermore, Fusobacteriota showed a positive correlation with TNF-α.
In addition, at the genus level, several bacteria, including Coprococcus, Enterococcus, Bifidobacterium, Desulfovibrio, Methylophaga, Pseudoxanthomonas, and Clade Ia, showed correlations with IgG. Notably, Pseudoxanthomonas and Clade Ia exhibited negative correlations. The microbes correlated with IgE included Enterococcus, Bifidobacterium, Desulfovibrio, Pseudoxanthomonas, and Clade Ia, with Pseudoxanthomonas and Clade Ia exhibiting negative correlations.
Photobacterium, Prevotella, and Parabacteroides showed negative correlations with IL-4. Fusobacterium, Lachnospiraceae NK4A136 group, and Prevotellaceae NK3B31 group exhibited a positive correlation with TNF-α. IFN-γ was positively correlated with Parabacteroides and Alloprevotella, but positively correlated with Lachnospiraceae NK4A136 group. IL-13 showed a negative correlation with Parabacteroides, Alloprevotella, and Chryseobacterium.

4. Discussion

Microbial diversity in mice lung was investigated after the mice were exposed to standard urban PMs and the allergenic pollen protein A3. Our data showed that the PMs and A3 protein could cause immune and pulmonary inflammation in mice lung, and significantly altered the microbial diversity in lung tissue.
IgE levels in mouse serum samples increased after the mice were exposed to the PMs and the protein (Figure 2B). Our finding was consistent with the study reported by Saravia et al. [16], who showed elevated IgE levels in mouse serum due to exposure to combustion-derived particles and house dust mites.
Previous studies demonstrated that the abundance of potentially pathogenic bacteria in the lung microbiota could increase after the mice were exposed to higher levels of particulate matter [17,18]. Our analysis showed that the abundance of Firmicutes tended to increase, but with no significant difference, while the abundance of Proteobacteria, Bacteroidota, and Actinobacteriota did not show a significant change after exposure to PMs and the A3 protein. This is in agreement with Chen et al. [19], who detected an increase in Firmicutes abundance in the intestine of SHR rats exposed to PMs. The diversity index of the lung microbiota increased, and the composition changed in the group of mice that were exposed to the PMs and the protein. Our result was consistent with those previous studies, which reported that microbiota diversity increased after mice were exposed to particles [20].
Our data also showed that the dominant genera, including Desulfovibrio [21,22], Enterococcus, (could cause severe inflammation of the skin and respiratory tract [23,24]) Ferruginibacter, Pseudoxanthomonas (could be found in plants) and Desulfovibrio could be enriched in the A3-protein-exposed group. In comparison with the control group, the abundance of Azospirillum, Methyloversatilis, and Diaphorobacter in the lung tissues of mice exposed to the A3 protein decreased significantly [25].
The PICRUSt2 software was employed to forecast the gene functions’ composition of the microbials (KEGG function prediction). It was found that the oxidoreductase HACL1 is upregulated after exposure to sensitizing components [26,27]. Furthermore, a diverse range of enzymes was found to be associated with the bacteria, including PksJ, an enzyme from Bacillus subtilis involved in the production of the uncharacterized antibiotic bacillaene [27,28]; PpkA, which is involved in the formation of biofilms in Pseudomonas aeruginosa [29,30]; LctO, a reductase enzyme derived from Escherichia coli [31,32]; GrdA, another reductase enzyme derived from Thermus acidaminophilum [33]; SulD, a bifunctional complex enzyme from the respiratory pathogen Streptococcus pneumoniae that catalyzes folate biosynthesis; and OmpU, which is related to Vibrio cholerae [34,35].
Studies have shown that air pollutants can cause oxidative stress and inflammation, which can disrupt the balance of microorganisms in the body, resulting in microbial dysregulation [36,37,38,39,40,41]. Our data showed that Acidobacteriota had a positive correlation with the mass level of IgE and IgG. A previous study reported a positive correlation between the abundance of Acidobacteriota in the nasal and pharyngeal passages of adults exposed to PM2.5 and the level of PM2.5 [42]. Deferribacterota was negatively correlated with the immunoglobulin IgE. This may be because Deferribacterota belongs to the probiotic group, and a study found that mice regularly exercising under a high-fat diet had higher levels of Deferribacterota in their feces [43].
Furthermore, this study identified several microbial species at the genus level, including Enterococcus, Desulfovibrio, and Pseudoxanthomonas, which were associated with changes in lung injury markers. Bifidobacterium, a probiotic, was found to have a positive correlation with immunoglobulin levels. Previous studies have shown that Bifidobacterium in the gut can promote the maturation of dendritic cells (DCs) and induce the secretion of TNF-α, IL-4, and IFN-γ, which aligns with our findings [44,45,46]. Prevotella, a pathogenic bacterium belonging to the phylum Bacteroidetes, is often associated with inflammation and has been detected in biological aerosols emitted from waste-sorting plants [47]. Previous studies have shown that Prevotella may cause oral-related diseases and induce inflammation. Large amounts of Prevotella have been detected in the oropharynx of asthma patients exposed to polycyclic aromatic hydrocarbons [48,49,50]. Fusobacterium is a Gram-negative bacterium that is primarily associated with periodontitis. However, it is also linked to colorectal cancer and can act as the main pathogen causing localized abscesses, pharyngeal infections, or even life-threatening diseases [51,52,53].

5. Conclusions

Our data showed that the mice exhibited strong immune and inflammatory responses after being exposed to PMs and the Pla a3 protein. This included increased levels of immunoglobulins IgG and IgE, as well as elevated levels of cytokines TNF-α, IFN-γ, IL-4, and IL-13. Furthermore, the amounts of pathogenic bacteria, such as Desulfobacterota, Enterococcus, Ferruginibacter, and Pseudoxanthomonas, in the lung microbiota of the Pla a3 exposure group increased significantly. Correlation analysis revealed a strong association between specific lung bacteria and alterations in cytokines from the lung samples. Probiotic bacteria, Deferribacterota and Bifidobacterium, were associated with changes in the levels of IgG and IgE. However, pathogenic bacteria, like Prevotella and Fusobacterium, were linked with cytokines IL-4 and TNF-α.

Supplementary Materials

The following supporting information can be downloaded at: https://www.mdpi.com/article/10.3390/atmos15040503/s1, Text S1. Sequencing data information; Table S1. chemical element in the PMs; Table S2. Results of the correlation between inflammatory cytokines and microorganisms; Figure S1. Data Processing Flow Chart; Figure S2. ASV level barplot of each sample; Enrichment of microbial taxa in lung tissue of mice in different groups; Figure S3. Enrichment of microbial taxa in lung tissue of mice in different groups; Figure S4. Correlationship between lung injury markers and varieties of microbial in lung tissue after the mice exposed to PMs and Pla a3 protein.

Author Contributions

S.L. designed the study, instructed all experiments. J.L. drafted the manuscript. J.L., W.H. and G.H. were responsible for the experiments. J.Z. and J.L. analyzed the data of PMs and the proteins. W.Z. and X.L. provided instruction on chemical analysis. E.C.E. checked the grammar and revised the manuscript. W.W. and Q.W. revised the manuscript. All authors have read and agreed to the published version of the manuscript.

Funding

This research was funded by the Natural Science Foundation of Xinjiang Uygur Autonomous Region (2022D01A364).

Institutional Review Board Statement

This study and the experimental procedures included were approved by the institutional animal care and use committee of Shanghai university (approval No. 2020-015).

Data Availability Statement

The data presented in this study are available on request from the corresponding author. The data are not publicly available due to privacy.

Conflicts of Interest

The authors declare that they have no known competing financial interests or personal relationships that could have appeared to influence the work reported in this paper.

References

  1. Wang, X.Y.; Ma, T.T.; Wang, X.Y.; Zhuang, Y.; Wang, X.D.; Ning, H.Y.; Shi, H.Y.; Yu, R.L.; Yan, D.; Huang, H.D.; et al. Prevalence of pollen-induced allergic rhinitis with high pollen exposure in grasslands of northern China. Allergy 2018, 73, 1232–1243. [Google Scholar] [CrossRef] [PubMed]
  2. Després, V.R.; Huffman, J.A.; Burrows, S.M.; Hoose, C.; Safatov, A.S.; Buryak, G.; Fröhlich-Nowoisky, J.; Elbert, W.; Andreae, M.O.; Pöschl, U.; et al. Primary biological aerosol particles in the atmosphere: A review. Tellus B Chem. Phys. Meteorol. 2012, 64, 15598. [Google Scholar] [CrossRef]
  3. Ravindra, K.; Goyal, A.; Mor, S. Does airborne pollen influence COVID-19 outbreak? Sustain. Cities Soc. 2021, 70, 102887. [Google Scholar] [CrossRef] [PubMed]
  4. Lou, H.; Ma, S.; Zhao, Y.; Cao, F.; He, F.; Liu, Z.; Bousquet, J.; Wang, C.; Zhang, L.; Bachert, C. Sensitization patterns and minimum screening panels for aeroallergens in self-reported allergic rhinitis in China. Sci. Rep. 2017, 7, 9286. [Google Scholar] [CrossRef] [PubMed]
  5. Li, X.; Sun, Y.; An, Y.; Wang, R.; Lin, H.; Liu, M.; Li, S.; Ma, M.; Xiao, C. Air pollution during the winter period and respiratory tract microbial imbalance in a healthy young population in Northeastern China. Environ. Pollut. 2019, 246, 972–979. [Google Scholar] [CrossRef] [PubMed]
  6. Hosgood, H.D., 3rd; Sapkota, A.R.; Rothman, N.; Rohan, T.; Hu, W.; Xu, J.; Vermeulen, R.; He, X.; White, J.R.; Wu, G.; et al. The potential role of lung microbiota in lung cancer attributed to household coal burning exposures. Environ. Mol. Mutagen. 2014, 55, 643–651. [Google Scholar] [CrossRef] [PubMed]
  7. Han, P.; Li, L.S.; Wang, Z.X.; Xi, L.; Yu, H.; Cong, L.; Zhang, Z.W.; Fu, J.; Peng, R.; Pan, L.B.; et al. Multi-Omics Analysis Provides Insight into the Possible Molecular Mechanism of Hay Fever Based on Gut Microbiota. Engineering 2022, 15, 115–125. [Google Scholar] [CrossRef]
  8. Thibeault, C.; Suttorp, N.; Opitz, B. The microbiota in pneumonia: From protection to predisposition. Sci. Transl. Med. 2021, 13, eaba0501. [Google Scholar] [CrossRef]
  9. Zhou, S.M.; Zhao, H.; Peng, J.X.; Hong, Q.; Xiao, K.; Shang, Y.; Lu, S.L.; Zhang, W.; Wu, M.H.; Li, S.J.; et al. Size distribution of allergen 3 (Pla a3) in Shanghai ambient size-resolved particles and its allergenic effects. Atmos. Environ. 2019, 198, 324–334. [Google Scholar] [CrossRef]
  10. Zhou, S.; Wang, X.; Lu, S.; Yao, C.; Zhang, L.; Rao, L.; Liu, X.; Zhang, W.; Li, S.; Wang, W.; et al. Characterization of allergenicity of Platanus pollen allergen a 3 (Pla a 3) after exposure to NO2 and O3. Environ. Pollut. 2021, 278, 116913. [Google Scholar] [CrossRef]
  11. Zhou, S.; Hong, Q.; Li, Y.; Li, Q.; Wang, M. Autophagy contributes to regulate the ROS levels and PCD progress in TMV-infected tomatoes. Plant Sci. 2018, 269, 12–19. [Google Scholar] [CrossRef] [PubMed]
  12. Hong, Q.; Zhou, S.; Zhao, H.; Peng, J.; Li, Y.; Shang, Y.; Wu, M.; Zhang, W.; Lu, S.; Li, S.; et al. Allergenicity of recombinant Humulus japonicus pollen allergen 1 after combined exposure to ozone and nitrogen dioxide. Environ. Pollut. 2018, 234, 707–715. [Google Scholar] [CrossRef] [PubMed]
  13. Chao, A. Nonparametric Estimation of the Number of Classes in a Population. Scand. J. Stat. 1984, 11, 265–270. [Google Scholar]
  14. Esty, W.W. The Efficiency of Good’s Nonparametric Coverage Estimator. Ann. Stat. 1986, 14, 1257–1260. [Google Scholar] [CrossRef]
  15. Douglas, G.M.; Maffei, V.J.; Zaneveld, J.; Yurgel, S.N.; Brown, J.R.; Taylor, C.M.; Huttenhower, C.; Langille, M.G.I. PICRUSt2: An improved and customizable approach for metagenome inference. BioRxiv 2019, 672295. [Google Scholar] [CrossRef]
  16. Saravia, J.; You, D.; Thevenot, P.; Lee, G.I.; Shrestha, B.; Lomnicki, S.; Cormier, S.A. Early-life exposure to combustion-derived particulate matter causes pulmonary immunosuppression. Mucosal Immunol. 2014, 7, 694–704. [Google Scholar] [CrossRef] [PubMed]
  17. Moelling, K.; Broecker, F. Air Microbiome and Pollution: Composition and Potential Effects on Human Health, Including SARS Coronavirus Infection. J. Environ. Public. Health 2020, 2020, 1646943. [Google Scholar] [CrossRef] [PubMed]
  18. Rylance, J.; Kankwatira, A.; Nelson, D.E.; Toh, E.; Day, R.B.; Lin, H.; Gao, X.; Dong, Q.; Sodergren, E.; Weinstock, G.M.; et al. Household air pollution and the lung microbiome of healthy adults in Malawi: A cross-sectional study. BMC Microbiol. 2016, 16, 182. [Google Scholar] [CrossRef] [PubMed]
  19. Chen, D.; Xiao, C.; Jin, H.; Yang, B.; Niu, J.; Yan, S.; Sun, Y.; Zhou, Y.; Wang, X. Exposure to atmospheric pollutants is associated with alterations of gut microbiota in spontaneously hypertensive rats. Exp. Ther. Med. 2019, 18, 3484–3492. [Google Scholar] [CrossRef]
  20. Li, N.; He, F.; Liao, B.; Zhou, Y.; Li, B.; Ran, P. Exposure to ambient particulate matter alters the microbial composition and induces immune changes in rat lung. Respir. Res. 2017, 18, 143. [Google Scholar] [CrossRef]
  21. Beerens, H.; Romond, C. Sulfate-reducing anaerobic bacteria in human feces. Am. J. Clin. Nutr. 1977, 30, 1770–1776. [Google Scholar] [CrossRef] [PubMed]
  22. Goldstein, E.J.; Citron, D.M.; Peraino, V.A.; Cross, S.A. Desulfovibrio desulfuricans bacteremia and review of human Desulfovibrio infections. J. Clin. Microbiol. 2003, 41, 2752–2754. [Google Scholar] [CrossRef]
  23. Lu, H.Z.; Weng, X.H.; Li, H.; Yin, Y.K.; Pang, M.Y.; Tang, Y.W. Enterococcus faecium-related outbreak with molecular evidence of transmission from pigs to humans. J. Clin. Microbiol. 2002, 40, 913–917. [Google Scholar] [CrossRef] [PubMed]
  24. Sava, I.G.; Heikens, E.; Huebner, J. Pathogenesis and immunity in enterococcal infections. Clin. Microbiol. Infect. 2010, 16, 533–540. [Google Scholar] [CrossRef]
  25. Doronina, N.V.; Kaparullina, E.N.; Trotsenko, Y.A. Methyloversatilis thermotolerans sp. nov., a novel thermotolerant facultative methylotroph isolated from a hot spring. Int. J. Syst. Evol. Microbiol. 2014, 64, 158–164. [Google Scholar] [CrossRef]
  26. Foulon, V.; Antonenkov, V.D.; Croes, K.; Waelkens, E.; Mannaerts, G.P.; Van Veldhoven, P.P.; Casteels, M. Purification, molecular cloning, and expression of 2-hydroxyphytanoyl-CoA lyase, a peroxisomal thiamine pyrophosphate-dependent enzyme that catalyzes the carbon-carbon bond cleavage during alpha-oxidation of 3-methyl-branched fatty acids. Proc. Natl. Acad. Sci. USA 1999, 96, 10039–10044. [Google Scholar] [CrossRef] [PubMed]
  27. Casteels, M.; Sniekers, M.; Fraccascia, P.; Mannaerts, G.P.; Van Veldhoven, P.P. The role of 2-hydroxyacyl-CoA lyase, a thiamin pyrophosphate-dependent enzyme, in the peroxisomal metabolism of 3-methyl-branched fatty acids and 2-hydroxy straight-chain fatty acids. Biochem. Soc. Trans. 2007, 35, 876–880. [Google Scholar] [CrossRef]
  28. Straight, P.D.; Fischbach, M.A.; Walsh, C.T.; Rudner, D.Z.; Kolter, R. A singular enzymatic megacomplex from Bacillus subtilis. Proc. Natl. Acad. Sci. USA 2007, 104, 305–310. [Google Scholar] [CrossRef]
  29. Filloux, A.; Hachani, A.; Bleves, S. The bacterial type VI secretion machine: Yet another player for protein transport across membranes. Microbiology 2008, 154, 1570–1583. [Google Scholar] [CrossRef]
  30. Coulthurst, S.J. The Type VI secretion system—A widespread and versatile cell targeting system. Res. Microbiol. 2013, 164, 640–654. [Google Scholar] [CrossRef]
  31. Deckers, H.M.; Wilson, F.R.; Voordouw, G. Cloning and sequencing of a [NiFe] hydrogenase operon from Desulfovibrio vulgaris Miyazaki F. J. Gen. Microbiol. 1990, 136, 2021–2028. [Google Scholar] [CrossRef] [PubMed]
  32. Maeda-Yorita, K.; Aki, K.; Sagai, H.; Misaki, H.; Massey, V. L-lactate oxidase and L-lactate monooxygenase: Mechanistic variations on a common structural theme. Biochimie 1995, 77, 631–642. [Google Scholar] [CrossRef] [PubMed]
  33. Wagner, M.; Sonntag, D.; Grimm, R.; Pich, A.; Eckerskorn, C.; Sohling, B.; Andreesen, J.R. Substrate-specific selenoprotein B of glycine reductase from Eubacterium acidaminophilum. Biochemical and molecular analysis. Eur. J. Biochem. 1999, 260, 38–49. [Google Scholar] [CrossRef] [PubMed]
  34. Skorupski, K.; Taylor, R.K. Control of the ToxR virulence regulon in Vibrio cholerae by environmental stimuli. Mol. Microbiol. 1997, 25, 1003–1009. [Google Scholar] [CrossRef] [PubMed]
  35. Sperandio, V.; Bailey, C.; Giron, J.A.; DiRita, V.J.; Silveira, W.D.; Vettore, A.L.; Kaper, J.B. Cloning and characterization of the gene encoding the OmpU outer membrane protein of Vibrio cholerae. Infect. Immun. 1996, 64, 5406–5409. [Google Scholar] [CrossRef] [PubMed]
  36. Mishra, V.; Banga, J.; Silveyra, P. Oxidative stress and cellular pathways of asthma and inflammation: Therapeutic strategies and pharmacological targets. Pharmacol. Ther. 2018, 181, 169–182. [Google Scholar] [CrossRef] [PubMed]
  37. Rizzatti, G.; Lopetuso, L.R.; Gibiino, G.; Binda, C.; Gasbarrini, A. Proteobacteria: A Common Factor in Human Diseases. Biomed. Res. Int. 2017, 2017, 9351507. [Google Scholar] [CrossRef] [PubMed]
  38. Saint-Georges-Chaumet, Y.; Edeas, M. Microbiota-mitochondria inter-talk: Consequence for microbiota-host interaction. Pathog. Dis. 2016, 74, ftv096. [Google Scholar] [CrossRef]
  39. Marsland, B.J.; Gollwitzer, E.S. Host-microorganism interactions in lung diseases. Nat. Rev. Immunol. 2014, 14, 827–835. [Google Scholar] [CrossRef]
  40. Duncan, S.H.; Louis, P.; Thomson, J.M.; Flint, H.J. The role of pH in determining the species composition of the human colonic microbiota. Environ. Microbiol. 2009, 11, 2112–2122. [Google Scholar] [CrossRef]
  41. Lodovici, M.; Bigagli, E. Oxidative stress and air pollution exposure. J. Toxicol. 2011, 2011, 487074. [Google Scholar] [CrossRef] [PubMed]
  42. Zhao, H.; Chen, S.; Yang, F.; Wu, H.; Ba, Y.; Cui, L.; Chen, R.; Zhu, J. Alternation of nasopharyngeal microbiota in healthy youth is associated with environmental factors: Implication for respiratory diseases. Int. J. Environ. Health Res. 2022, 32, 952–962. [Google Scholar] [CrossRef] [PubMed]
  43. Yu, C.X.; Zhang, P.; Liu, S.J.; Niu, Y.M.; Fu, L. SESN2 ablation weakens exercise benefits on resilience of gut microbiota following high-fat diet consumption in mice. Food Sci. Human. Wellness 2023, 12, 1961–1968. [Google Scholar] [CrossRef]
  44. Dong, P.; Yang, Y.; Wang, W.P. The role of intestinal bifidobacteria on immune system development in young rats. Early Hum. Dev. 2010, 86, 51–58. [Google Scholar] [CrossRef] [PubMed]
  45. Lopez, P.; Gueimonde, M.; Margolles, A.; Suarez, A. Distinct Bifidobacterium strains drive different immune responses in vitro. Int. J. Food Microbiol. 2010, 138, 157–165. [Google Scholar] [CrossRef] [PubMed]
  46. Menard, O.; Butel, M.J.; Gaboriau-Routhiau, V.; Waligora-Dupriet, A.J. Gnotobiotic mouse immune response induced by Bifidobacterium sp. strains isolated from infants. Appl. Environ. Microbiol. 2008, 74, 660–666. [Google Scholar] [CrossRef] [PubMed]
  47. Degois, J.; Simon, X.; Clerc, F.; Bontemps, C.; Leblond, P.; Duquenne, P. One-year follow-up of microbial diversity in bioaerosols emitted in a waste sorting plant in France. Waste Manag. 2021, 120, 257–268. [Google Scholar] [CrossRef] [PubMed]
  48. Ley, R.E. Gut microbiota in 2015: Prevotella in the gut: Choose carefully. Nat. Rev. Gastroenterol. Hepatol. 2016, 13, 69–70. [Google Scholar] [CrossRef] [PubMed]
  49. Hu, J.; Bao, Y.; Zhu, Y.; Osman, R.; Shen, M.; Zhang, Z.; Wang, L.; Cao, S.; Li, L.; Wu, Q. The Preliminary Study on the Association between PAHs and Air Pollutants and Microbiota Diversity. Arch. Environ. Contam. Toxicol. 2020, 79, 321–332. [Google Scholar] [CrossRef]
  50. Larsen, J.M. The immune response to Prevotella bacteria in chronic inflammatory disease. Immunology 2017, 151, 363–374. [Google Scholar] [CrossRef]
  51. Signat, B.; Roques, C.; Poulet, P.; Duffaut, D. Fusobacterium nucleatum in periodontal health and disease. Curr. Issues Mol. Biol. 2011, 13, 25–36. [Google Scholar] [PubMed]
  52. Castellarin, M.; Warren, R.L.; Freeman, J.D.; Dreolini, L.; Krzywinski, M.; Strauss, J.; Barnes, R.; Watson, P.; Allen-Vercoe, E.; Moore, R.A.; et al. Fusobacterium nucleatum infection is prevalent in human colorectal carcinoma. Genome Res. 2012, 22, 299–306. [Google Scholar] [CrossRef] [PubMed]
  53. Brazier, J.S. Human infections with Fusobacterium necrophorum. Anaerobe 2006, 12, 165–172. [Google Scholar] [CrossRef] [PubMed]
Figure 1. Immunological experiment of mice.
Atmosphere 15 00503 g001
Figure 2. Immunoglobulin levels in the mice serum after exposure to PMs and Pla a3 protein. (A) Concentrations of IgG in serum. (B) Concentrations of IgE in serum. Statistical significance among the three groups was analyzed using ANOVA. * p < 0.05; ** p < 0.01; *** p < 0.001. PBS, PBS control; PM, PMs exposure; A3, Pla a3 protein exposure.
Atmosphere 15 00503 g002
Figure 3. Mass levels of cytokine levels in lung tissues of mice exposed to standard particulate matter and Pla a3 protein. (A) Concentration of TNF-α in lung tissue, (B) concentration of IFN-γ in lung tissue, (C) concentration of IL-4 in lung tissue, (D) concentration of IL-13 in lung tissue. ANOVA was used to analyze the statistical significance of experimental results between the three groups. * p < 0.05; ** p < 0.01; *** p < 0.001; **** p < 0.0001. PBS, PBS control; PM, PMs exposure; A3, Pla a3 protein exposure.
Atmosphere 15 00503 g003
Figure 4. Hematoxylin–eosin staining results of lung tissue. (A) PBS control; (B) PMs exposure; (C) Pla a3 protein exposure. The red arrow indicates the inflammatory cells.
Atmosphere 15 00503 g004
Figure 5. Microbial analysis of lung tissue. (A) ASVs bar chart of three groups of lung tissue microorganisms, (B) ASV flower plot of each sample.
Atmosphere 15 00503 g005
Figure 6. Alpha diversity of the microbial in mouse lung tissue induced by PMs and Pla a3 protein. (A) Chao1 index, (B) Good’s coverage index, (C) PD whole tree index, and (D) ACE index. Statistical significance of experimental results between the three groups was analyzed by ANOVA. * p < 0.05; ** p < 0.01; *** p < 0.001. PBS, PBS control; PM, PMs exposure; A3, Pla a3 protein exposure.
Atmosphere 15 00503 g006
Figure 7. Beta diversity of the microbial in mouse lung tissue induced by PMs and Pla a3 protein in mouse lung tissue. (A) PCA analysis based on binary Jaccard calculation, (B) NMDS analysis based on Unweighted Unifrac calculation. PBS, PBS control; PM, PMs exposure; A3, Pla a3 protein exposure.
Atmosphere 15 00503 g007
Figure 8. Exposure to PMs and Pla a3 protein altered the abundance of major microbial phyla, taxa, genus in mouse lung tissue. (A) The top 10 abundant phyla in the three groups, (B) abundance analysis of dominant phyla. (C) The top 15 orders with the highest abundance in all three groups, (D) analysis of the abundance of dominant bacterial orders. (E) The top 20 genera in the three groups, (F) abundance analysis of dominant bacterial genera. * indicates p < 0.05.
Atmosphere 15 00503 g008
Figure 9. ANOVA analysis and Kruskal–Wallis analysis of the abundance differences at the phylum, order, and genus levels of lung microbiota in mice exposed to standard particulate matter and Pla a3 protein. Differences in relative abundance between the three groups are shown for (A) Desulfobacterota and Acidobacteriota, (B) Desulfobacterota and Acidobacteriota, (C) Azospirillales, Lactobacillales, and Desulfovibrionales, (D) Azospirillales, Vibrionales, Coriobacteriales, and Acidobacteriales, (E) Methyloversatilis, Azospirillum, Desulfovibrio, and Enterococcus, (F) Azospirillum, Methyloversatilis, Desulfovibrio, Enterococcus, Ferruginibacter, Pseudoxanthomonas, and Diaphorobacter. * p < 0.05; ** p < 0.01; *** p < 0.001. PBS, PBS control; PM, PMs exposure; A3, Pla a3 protein exposure.
Atmosphere 15 00503 g009
Figure 10. Bar plot of KEGG pathway differences in mouse lung tissue exposed to different treatments. The bar chart on the left represents the comparison of the mean abundance of pathways among the three groups, while the line chart on the right illustrates the significant differences between the pathways among the three groups (−log10(p-value)). PBS, PBS control; PM, PMs exposure; A3, Pla a3 protein exposure.
Atmosphere 15 00503 g010
Disclaimer/Publisher’s Note: The statements, opinions and data contained in all publications are solely those of the individual author(s) and contributor(s) and not of MDPI and/or the editor(s). MDPI and/or the editor(s) disclaim responsibility for any injury to people or property resulting from any ideas, methods, instructions or products referred to in the content.

