Article

Influence of Vertical Load, Inflation Pressure, and Driving Speed on the Emission of Tire–Road Particulate Matter and Its Size Distribution

Institute of Vehicle System Technology, Karlsruhe Institute of Technology, 76131 Karlsruhe, Germany
*
Author to whom correspondence should be addressed.
Atmosphere 2024, 15(4), 502; https://doi.org/10.3390/atmos15040502
Submission received: 8 March 2024 / Revised: 28 March 2024 / Accepted: 17 April 2024 / Published: 19 April 2024
(This article belongs to the Special Issue Traffic Related Emission (2nd Edition))

Abstract

:
As fleet electrification progresses, vehicles are continuously becoming heavier, while the used electric motors, with their high torques, enable longitudinal dynamics to be maintained or even increased. This raises the question of what effect electric vehicles have on the emission of tire–road particulate matter (PM). To answer this question, investigations were carried out in this study on a tire internal drum test bench with real road surfaces. In addition to the vertical load, the tire inflation pressure and the driving speed were varied. PM emissions were recorded in real time, resulting in emission factors (emission per kilometer driven) for different load conditions. This allows statements to be made about both the effect on the total emission and on the particle size distribution. It was shown that the PM emission increases linearly with the vertical load at constant longitudinal dynamics. If the tire inflation pressure is increased, the emission also increases linearly, and the increases in emission are equally large for both influences. A clear influence of the driving speed on the emission factor could not be determined. With regard to the particle size distribution, the following correlations were found: higher vertical load and higher tire inflation pressure result in a larger mean particle diameter, while a higher driving speed reduces it. Thus, this study contributes to a better understanding of the expected changes in tire-road PM emissions as a result of electrification.

1. Introduction

As part of the announced Euro 7 emission standards [1], the European Commission intends to regulate, for the first time, emissions which do not originate from the combustion engine. These so-called non-exhaust emissions (NEEs) include particles which are released through abrasion in the brakes and tire–road contact. According to the current state [1], the emission standards provide for the definition of limit values that relate to the particulate matter (PM) emitted by brakes, but only to the total mass loss in the case of tires. The fact that, initially, only total abrasion is to be limited for tires is primarily due to an insufficient database regarding emission factors (EFs) and a lack of standardized measurement methods that could be used across the board to determine the EFs [2,3,4]. However, as electrification progresses, internal combustion engines (ICEs) will be replaced by electric motors, and braking will no longer be achieved exclusively by friction braking, but increasingly by regenerative braking. Both sources of PM will therefore become less important [5,6], meaning that the contact between tires and the road will be the last remaining key source of PM from vehicles. It can therefore be assumed that, sooner or later, a limit value will also be set for tires that relates to the emission of particulate matter.
Hence, the electrification of road traffic will contribute to the fact that the issue of tire abrasion and the resulting tire–road PM will continue to gain in importance. Numerous studies have already shown that the advantage of lower PM emissions due to the elimination of combustion engines could be reduced or even overcompensated by higher NEEs [4,7]. On the tire–road PM side, the additional emission is due to higher vehicle masses [7] and torques, which are already provided when the vehicle is stationary and can therefore be used for starting off. Timmers and Achten [7] predicted that the PM10 emissions of battery electric vehicles (BEVs) would be at the same level as those of internal combustion engine vehicles (ICEVs), despite the omission of the ICE as a source of PM. This is also the conclusion reached by Beddows and Harrison [8] in their calculations based on the EMEP/EEA emission inventory guidebook, 2013 [9]. However, the authors point out that the proportion of regenerative braking processes has a significant influence on the result, as a large proportion of braking emissions can be avoided [8].
With regard to the relationship between vertical load and PM emissions from tire–road contact, Aatmeeyata et al. [10] and Kim et al. [11] found linear increases in their test bench experiments. In one of our own previous studies [12], we found fourth-order correlations between tire longitudinal forces and the PM emission. However, since BEVs combine higher vehicle masses with higher torques, the question arises as to how this combination affects the emission of particulate matter.
In addition to the level of emission, the particle size distribution is a decisive factor. From a medical point of view in particular, a distinction must be made between fine and coarse particles. As the penetration depth into the human body increases with decreasing particle diameter, different damage potentials are associated with different particle sizes [13]. This raises the question of whether electromobility merely increases emissions from tire–road contact due to the higher vehicle masses and torques associated with it, or also influences their size distribution. A shift towards smaller particles would be unfavorable for two reasons. Firstly, given the emission of a constant or even higher mass of PM [10,11], the number of particles would increase disproportionately. Secondly, each of these fine particles would pose a higher hazard potential [13].
Apart from the vertical load, the literature contains statements on the influence of tire inflation pressure on the generation of tire–road PM, as well as on the influence of driving speed. With regard to tire inflation pressure, there are indications that less PM is emitted at the correct inflation pressure [14]. Besides that, it is often mentioned that tire wear is influenced by the tire inflation pressure [15] and decreases with increasing inflation pressure [16,17,18]. However, it must be taken into account that this statement may not apply to particulate emissions, as these are made up of tire and road wear particles, and a higher tire inflation pressure could well contribute to greater road wear due to higher contact pressure. Which tire inflation pressure is actually optimal for reducing PM emissions from tires and the road is therefore still unanswered.
The situation is similarly unclear with regard to the influence of driving speed. It is often stated that PM emissions increase with increasing speed [19]. Foitzik et al. [20], on the other hand, found in their test bench experiments that at least the emission of nanoparticles is independent of driving speed. Here, it is essential not to compare particle concentrations (per time) with each other, but emission factors (per distance) derived from them, as indicated by the authors [20]. It is also important to ensure that the total emissions from tires and road surface are compared, as neglecting one component can lead to significant differences. Last but not least, when conducting open-road tests, it is important to note that driving resistance and the driving force required to overcome it increase with driving speed. Possible increases in emissions with increasing driving speed are therefore due to the increased driving force and not to the driving speed itself [21].
The objective of this study was to investigate the mathematical correlations between the three parameters described and the emission of tire–road PM. For this purpose, tests were carried out on an internal drum test bench, which has the special feature of using real road surfaces. Any driving maneuver can be simulated under laboratory conditions, while the PM emissions and particle size distributions are recorded. Results from PM measurements on this test bench have already been presented in our previous studies [12,22]. In [22], the methodology for analyzing the measurement data and for deriving the mathematical relationships between tire forces and PM emission was described. Summer, winter and all-season tires were investigated regarding their emission behavior under different longitudinal and lateral forces and at two ambient temperatures. In [12], the influence of longitudinal and lateral forces on a summer tire was investigated in more detail, and a characteristic map was derived, which assigns an emission factor (emission per distance traveled) to each horizontal tire force. In subsequent analyses, the density and composition of the emitted particles were examined. The current study builds on the two previous papers and uses the same experimental setup and methodology to investigate and analyze the effects of vertical load, tire inflation pressure and driving speed on the emission of tire–road PM. Both the absolute emissions and the particle size distributions are discussed. The fusion of the results from this paper and the two former ones [12,22] in conjunction with a simulation model based on real-driving data will enable accurate predictions of PM emissions for realistic driving behavior and therefore allow for a comparison with emission factors from literature.

2. Materials and Methods

All tests for this study were performed at the internal drum test bench of the Institute of Vehicle System Technology (FAST) at the Karlsruhe Institute of Technology (KIT).

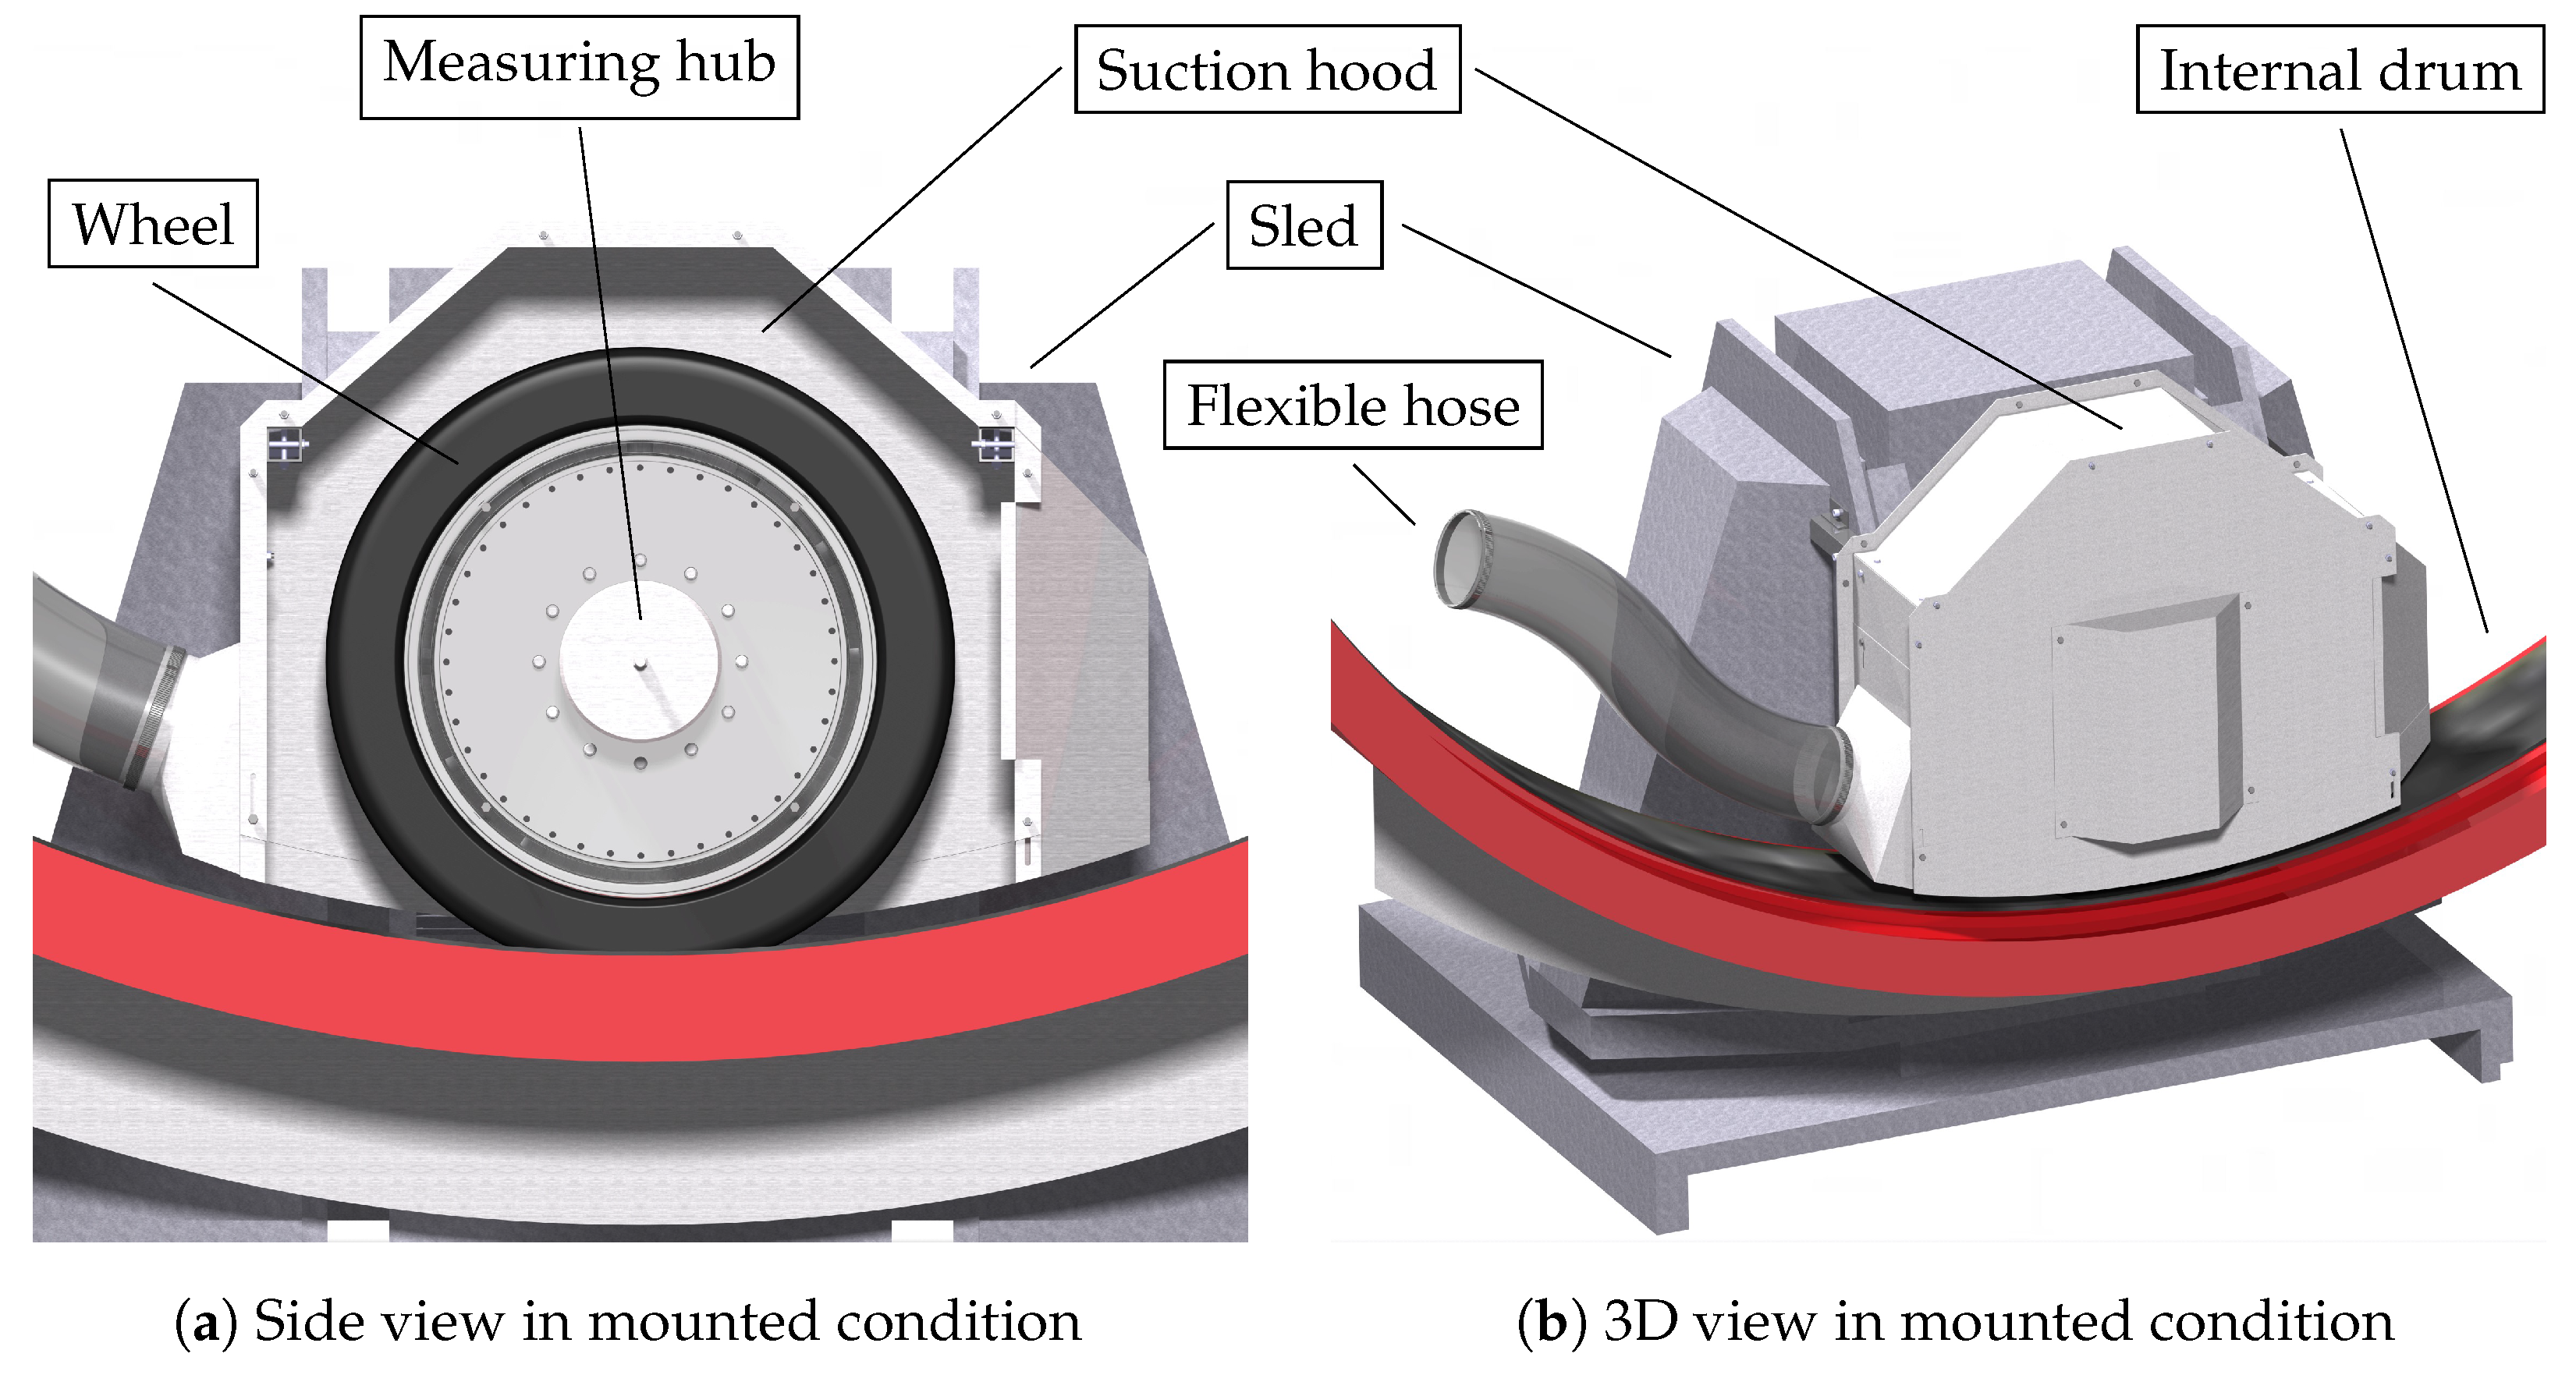
2.1. Internal Drum Test Bench

The setup, the technical characteristics as well as the versatile possibilities for investigation of the internal drum test bench have been described in detail in [12,22]. A further description is therefore not provided here.

2.2. Sampling and Measuring

A suction funnel is mounted directly behind the wheel for real-time measurement of particulate matter from tire–road contact. By attaching it to the test bench sled (see Figure 1), it follows the wheel at slip angles so that its relative position to the wheel remains constant across all load conditions. The suction funnel is connected to the suction device via a flexible hose (Ø160 mm) and downstream pipes. To minimize losses due to electrostatic charge, the hose is made of permanently anti-static polyurethane, and its copper spiral is grounded on both sides. The pipes are made of conductive galvanized sheet steel.
Instead of the suction funnel, a suction hood (see Figure 1) can be used, which completely encloses the wheel and leaves only a narrow slit to the road surface. The advantage of the hood is that the tire–road contact is shielded from the air flow in the drum. Especially at high driving speeds ( v d > 100 km/h), flow-induced turbulence without a hood would lead to lower collection efficiency and consequently falsify the results of the influence of driving speed on emissions. To minimize particle losses due to electrostatic charge, the hood, like the funnel, is made of conductive stainless steel and grounded via the test bench. It is connected directly to the extraction system at the rear so that emitted particles are reliably extracted. However, the shielding of the air flow, which usually cools the tire, now leads to faster rising tire temperatures, so that more time is required for cooling between the individual test runs. Therefore, only the test series on the influence of driving speed was performed with the hood, while the suction funnel was used for the other two test series (see Section 2.3).
The suction device (ESTA DUSTOMAT 4-10 eco+, Senden, Germany) generates the negative pressure for extracting the PM emitted. Sampling takes place between the suction funnel or suction hood and the suction device on the basis of ISO 9096:2017 [23]. For this purpose, one sampling port has been integrated into a pipe bend, enabling the sampling probe to be inserted into the flow. A partial flow of 5 L/min is taken isokinetically with the sampling probe. A second sampling port allows for the insertion of a dynamic pressure anemometer continuously measuring the flow velocity and thus ensuring isokinetic sampling. Particle measurement and analysis are carried out using an optical aerosol spectrometer system (PALAS Promo 2000 & welas 2500, Karlsruhe, Germany). To ensure consistently high measurement quality, the device must be cleaned regularly and calibrated with calibration dust (PALAS MonoDust 1500, Karlsruhe, Germany). For particle measurement, the particle diameter is inferred on the basis of the detected scattered light pulse, taking into account the refractive index and the aspect ratio. In this study, the refractive index and aspect ratio were set to 1.59 and 1, respectively, which correspond to spherical latex particles (analogous to the calibration dust [24]). The assumption of spherical particles was described and confirmed in previous tests [12]. During the measurements, particles in the size range of 0.3 μ m to 17 μ m were registered, of which only those smaller than 10 μ m were taken into account for the later analysis. The maximum measurement rate is 1 Hz [25], so that the aerosol spectrometer records the current number of particles and the associated size distribution once per second. Based on this information and using a density of 2.299 g/cm3, which had also been determined in [12], the emitted particle mass can be calculated at each time step.
The aerosol that is not extracted for measurement flows onto the suction device, which filters the volume flow in addition to extracting it. Due to the HEPA filter as the last filter stage, the air flowing back into the test bench does not contain any significant particle concentration. In order to further minimize or even prevent the influx of particles from the environment, the setup includes a secondary air intake. The imbalance between the lower exhaust flow and the higher fresh air flow creates a slight overpressure in the test bench, preventing ambient air from entering. Due to these two measures, it can be assumed that all PM emissions recorded by the aerosol spectrometer originate from the tire–road contact.
For more information on the test bench setup and the measuring devices and methods used, see [12,22].

2.3. Varied Parameters

To determine the mathematical relationships between the emission and the parameters vertical load, tire inflation pressure and driving speed, three independent test series were carried out. A standard 255/40 R20 summer tire was used for all test series. This tire had a load index of 101, making it suitable for luxury class vehicles. For the road surface, a widely-used asphalt mix AC 11 D S has been used (for more details see [12]). Several values were defined for the parameter under investigation, which was kept constant for the duration of one test block (see Figure 2). During these test blocks, only different load conditions consisting of longitudinal and lateral forces were applied. The same load conditions were investigated for each characteristic of the parameter under investigation. A complete overview of the test series and the load conditions applied is provided in Table 1. The test series on the influence of vertical load represents a special case. Here, different longitudinal forces were applied with different vertical loads, as it was not the longitudinal force itself that had been determined, but the underlying adhesion utilization F x / F z . The values defined for this were 0 (free rolling), 0.155, 0.31, 0.465 and 0.62. For a complete vehicle loaded in this way on all four wheels, accelerations of up to ± 6 m/s2 or ± 0.62 g would result with the vertical load used. This takes into account the fact that a proportionally higher or lower longitudinal force is required on a real vehicle for a constant acceleration with a higher or lower vertical load. The results of this test series are thus to be understood as representing the emission of vehicles with different masses but with the same adhesion utilization and thus the same longitudinal acceleration.

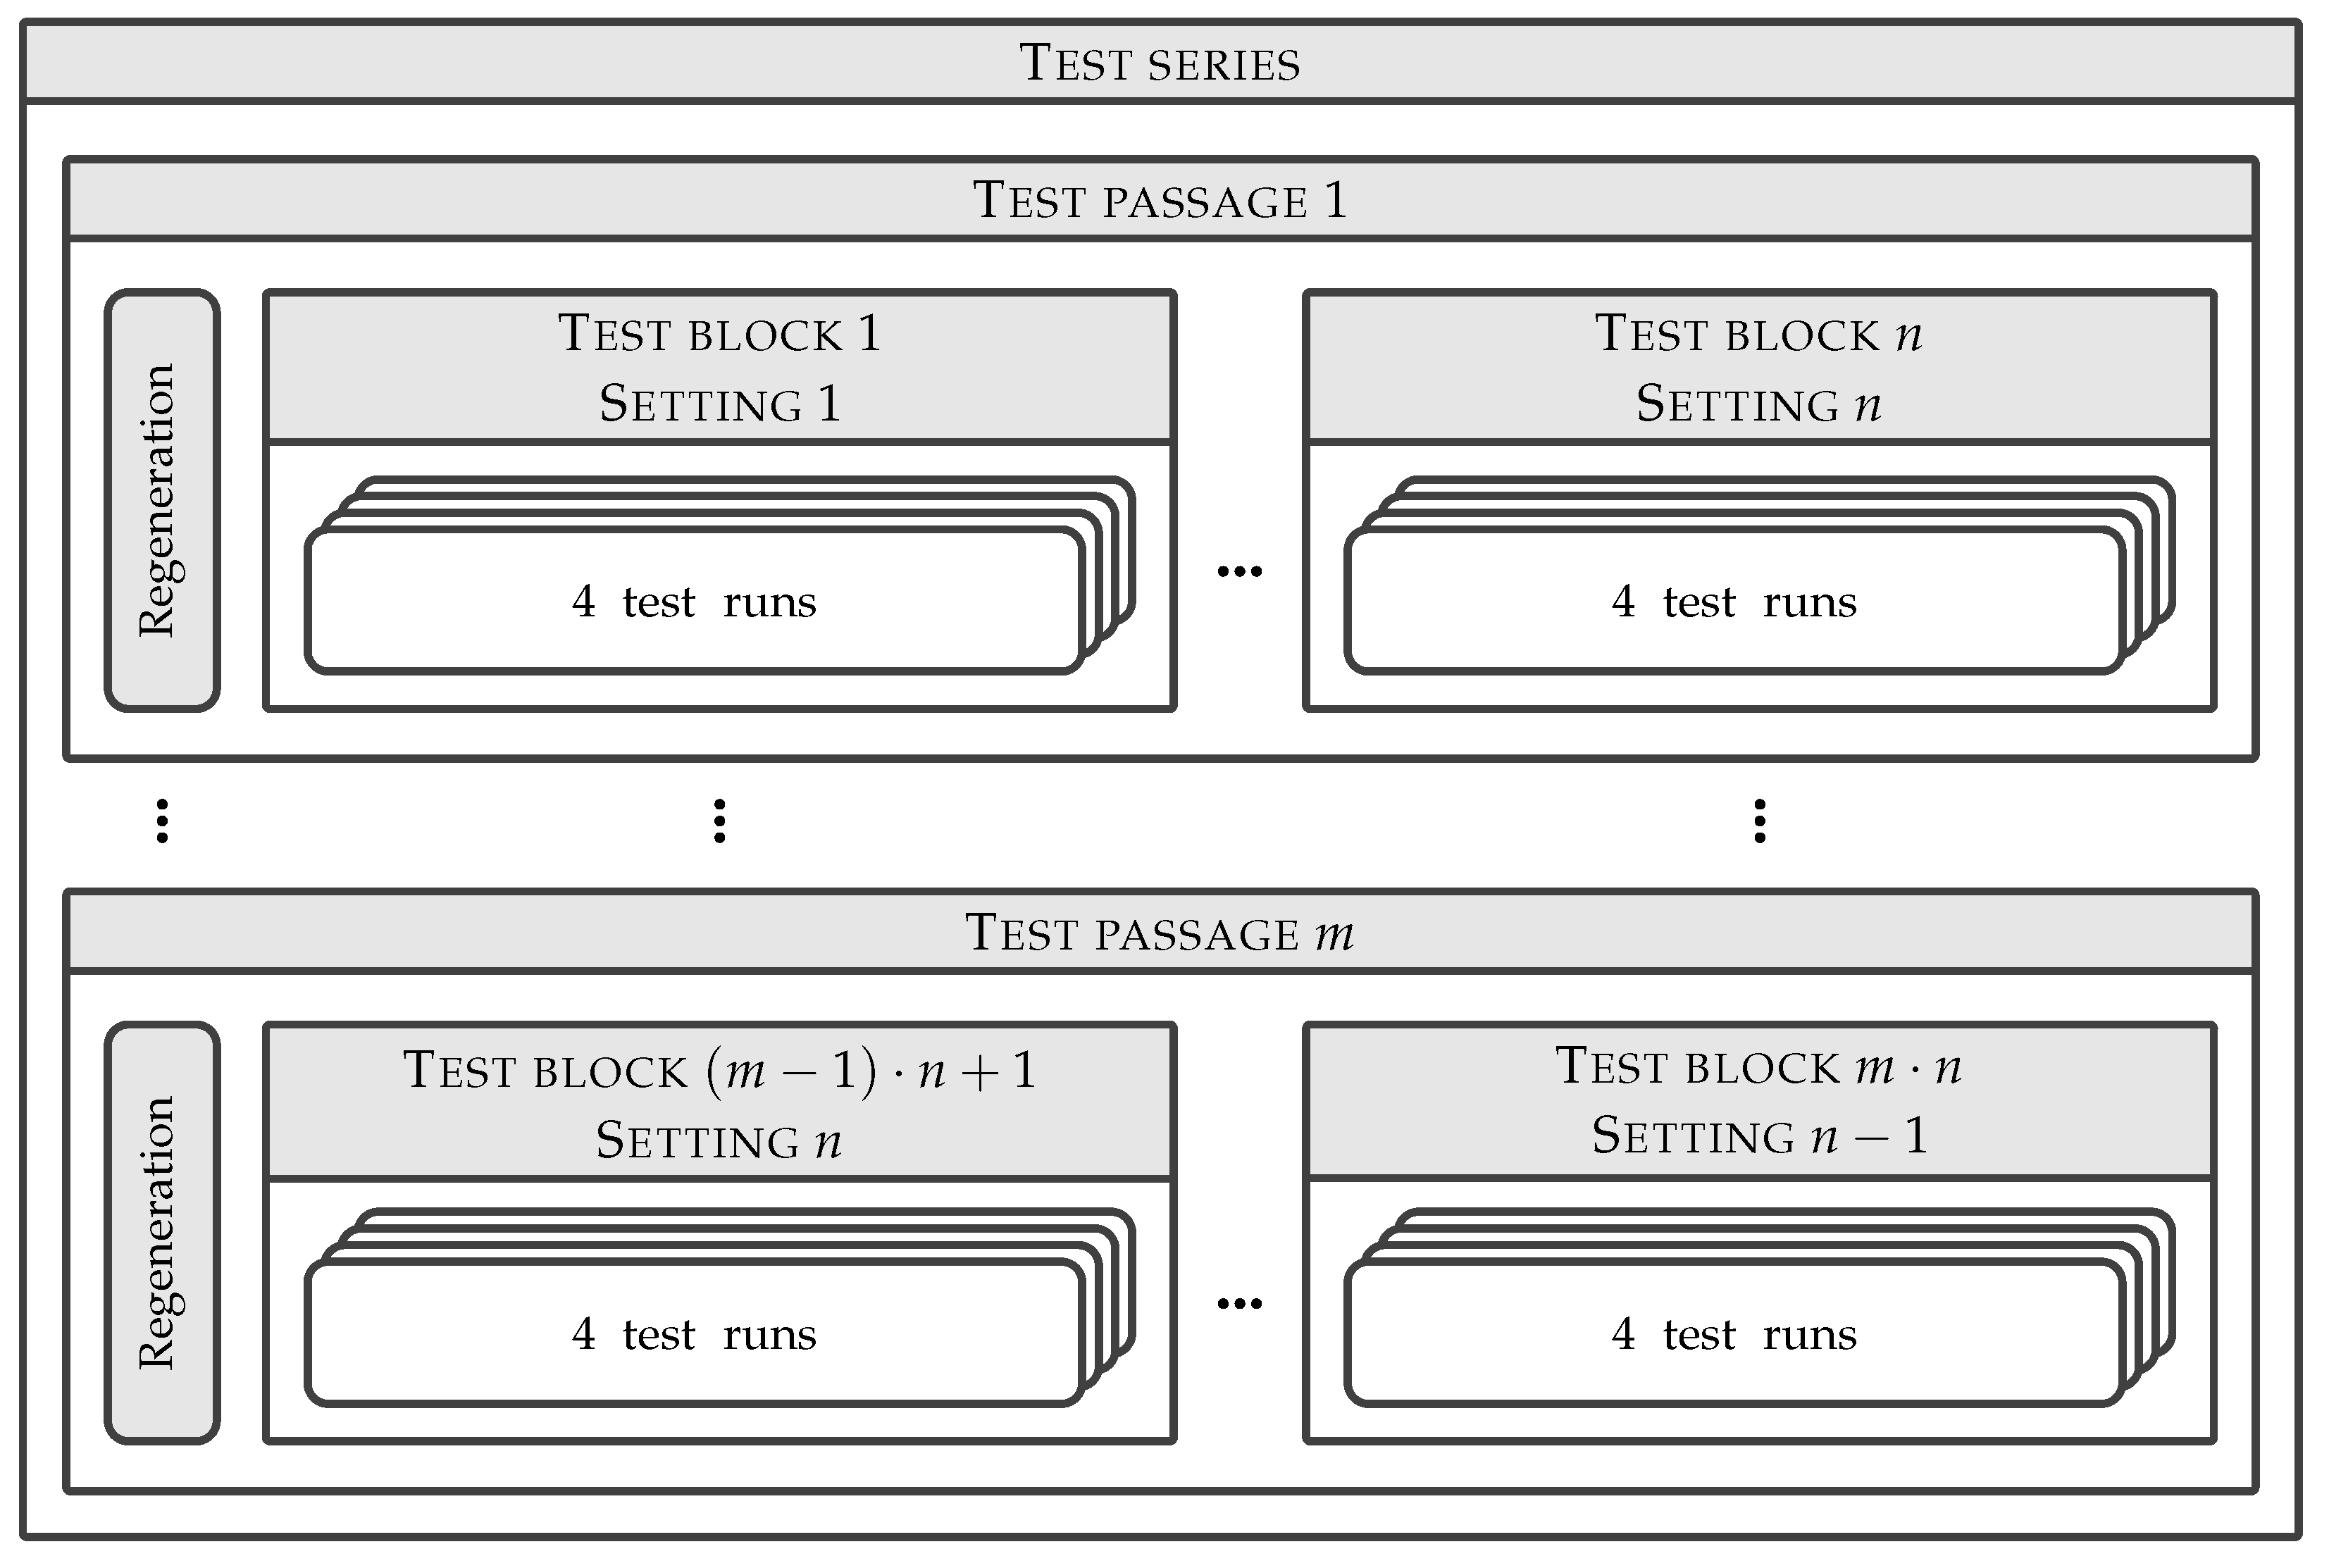
2.4. Experimental Setup, Test Procedure, Data Processing and Evaluation

All test series were carried out according to the test procedure developed and described in [22]. For data processing and evaluation, the method described in [12] was used. This method was also applied to calculate the emission factors from the measured raw data. A detailed specification of the test procedure is therefore not provided in this study, nor is a description of the data analysis. Based on the general test structure shown in Figure 2, only the extent and order of the test series are presented. Accordingly, each test series consisted of m test passages and n test blocks. Each test block was run with one setting of the parameter under investigation and consisted of four individual test runs. Previous tests (see [22]) had shown that the skid resistance of the road surface, and thus its abrasiveness, decrease as the test progresses. To prevent the resulting influence on PM emissions, several test passages were performed, and the road surface was regenerated at the beginning of each test passage. The number of test passages was set equal to the number of settings to be examined ( m = n ), and the order of the test blocks within the test passages was varied so that each setting was ultimately tested at each position in the sequence. More detailed information on road surface regeneration as well as on dealing with the skid resistance and the associated SRT value can be found in [22].
The test structure and the parameter variations specified in Table 1 show the number of test runs performed in each test series. Four settings (4 vertical loads or 4 driving speeds, respectively, n = m = 4 ) were tested within the test series on the influence of vertical load and driving speed. This resulted in 64 test runs for both test series. In the test series on the influence of tire inflation pressure, only three settings were tested (3 tire inflation pressures, n = m = 3 ), resulting in 36 test runs. Using the structure of a test run presented in [22] (8 individual load conditions, each 2 times per test run), the total number of repetitions of each individual load condition per test series was obtained: 128 for the test series on the influence of vertical load and driving speed, and 72 for the test series on the influence of tire inflation pressure.

3. Results

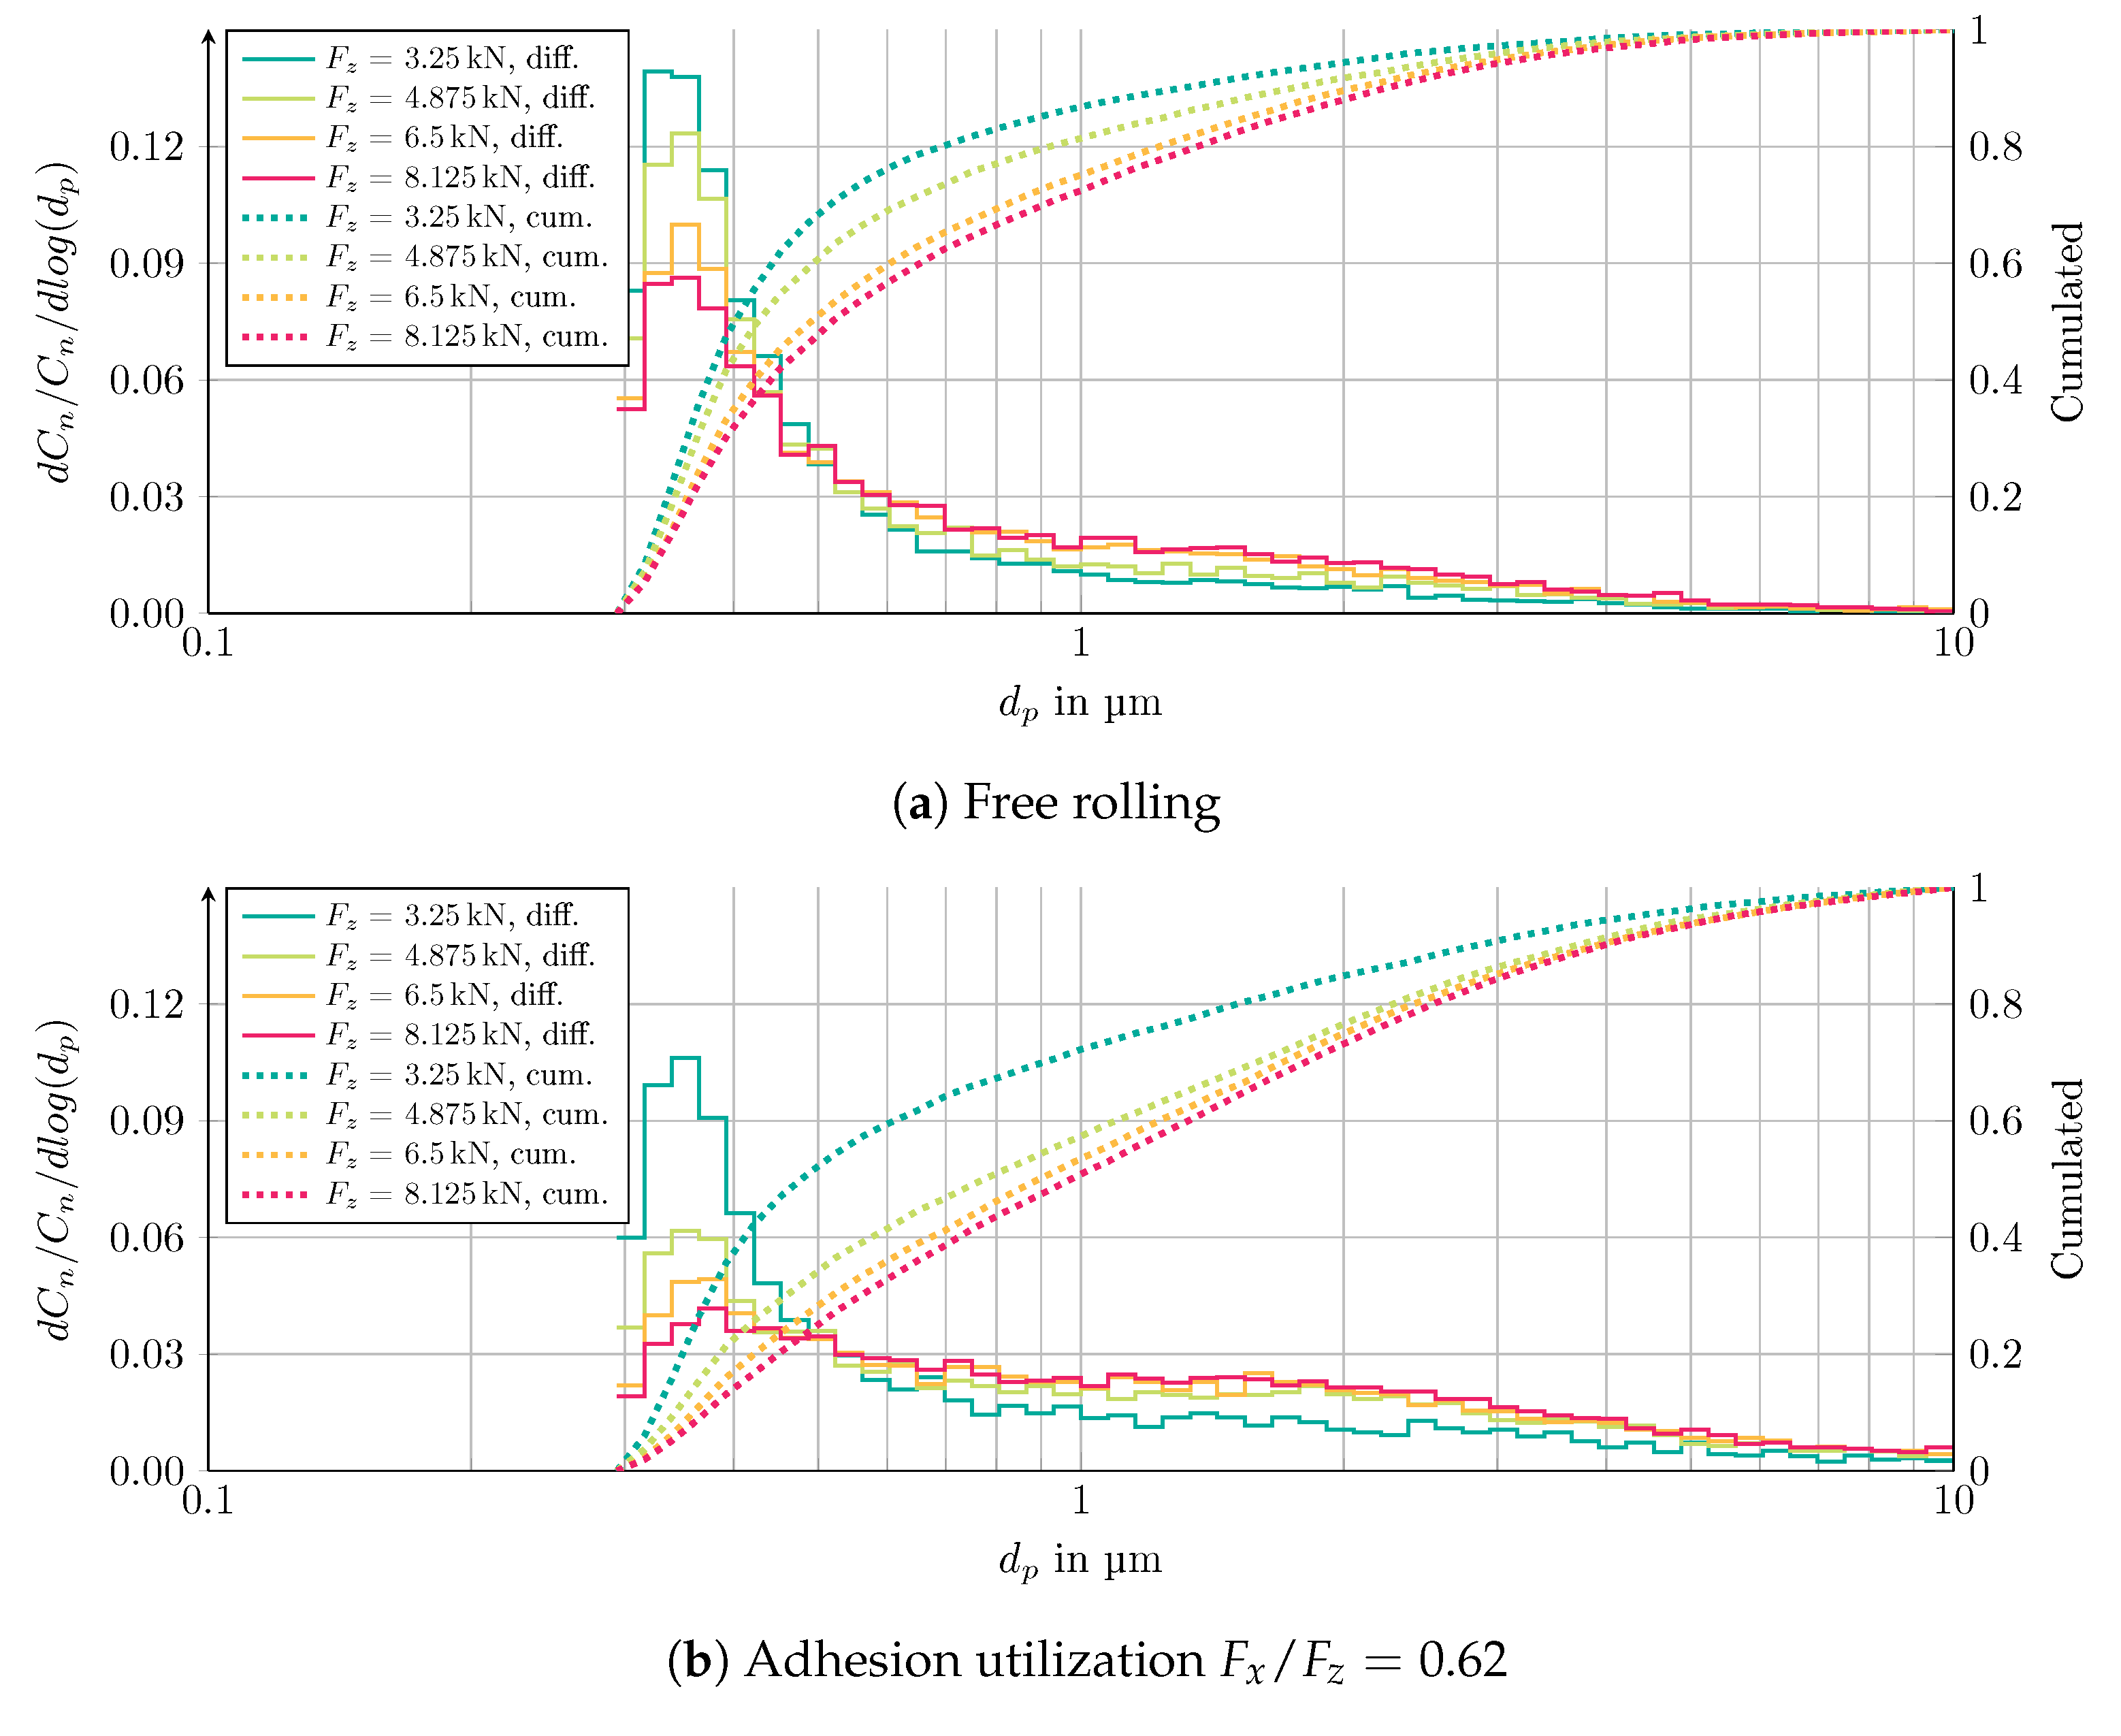
3.1. Influence of Vertical Load on PM Emission

The results of the test series on the influence of vertical load are shown in Figure 3. As explained in Section 2.3, different longitudinal forces were applied for different vertical loads in order to keep the adhesion utilization constant. The emissions are divided into braking (Figure 3a) and driving condition (Figure 3b). For the same adhesion utilizations at different vertical loads, the emission factors are shown with marks of the same color. The emission factors E F m are mass-based and distance-related ( mg / vkm ) and apply to a four-wheeled vehicle, assuming the same specified load condition on all four wheels. Furthermore, all emission factors shown in this study correspond to the emission at an SRT value of 60.
In both diagrams, regression functions reveal a linear relationship between vertical load and emission factor. However, the associated linearity factor changes depending on the adhesion utilization. For example, the emission factor only increases by 14% when the vertical load is increased by 25% from 4 kN (408 kg) to 5 kN (510 kg) in the free-rolling condition. The same change in vertical load at maximum adhesion utilization results in a growth of about 69% (mean value for positive and negative). Additionally, it can be seen that braking leads to higher emission factors than driving. The effect is presumably due to the less-favourable shear stress distribution during braking, which leads to more gliding slip [22]. Summarizing, the results show that the tire–road PM emission of an entire vehicle increases linearly with the vehicle mass for consistent longitudinal dynamics, with the magnitude of the influence depending on the adhesion utilization.
The linearly increasing emission factors over vertical load can be explained by the friction energy, which also increases. For a higher vertical load, the tire is more deflected, and the contact area flattens. This means that the contact patch between the tire and the road surface increases approximately linearly with the vertical load if the inflation pressure is kept constant. The increase is mainly in the longitudinal direction [26]. The higher vertical load is thus distributed over a surface area that has increased to approximately the same extent, so that the surface pressure remains almost unchanged. The magnitude and characteristics of the shear stress that ultimately occurs is therefore nearly unchanged in relation to the size of the contact patch. The ratio of deformation slip to gliding slip remains constant. Therefore, emissions increase in proportion to the increase in contact area between the tire and the road surface.
In addition to the quantity of particles emitted, their size distribution plays a decisive role, particularly in assessing the associated hazard potential for human health [27]. For this reason, particle size distributions were analyzed for all test series. In order to draw the most representative conclusions, the individual size distributions from all test runs of the respective test series were combined to form an average size distribution for each load condition. All size distributions were normalized to facilitate the comparison of different load conditions. The normalization was performed with respect to the total particle number concentration present at each time point. The non-normalized size distributions are included in the Supplementary Materials.
The particle number distributions for the free-rolling condition and for an adhesion utilization of 0.62 at various vertical loads are shown in Figure 4. In the free-rolling condition, a bimodal distribution is obtained for all vertical loads, with a pronounced peak at the lower end of the measurement range ( d p 0.3  μ m ) and an indication of a second, significantly lower peak in the range of 1 μ m (Figure 4a). It is not clear whether the lower peak is actually in the position indicated or rather shows a rising edge. The decreasing concentration in the lowest channel could be caused by the decreasing measurement efficiency for particles in the area of the lower detection limit of the aerosol spectrometer. Thus, their actual number could be underestimated. The actual peak could therefore be below 0.3  μ m . Furthermore, it can be seen that the lower peak decreases with increasing vertical load, while the peak in the area of larger particles increases. This means that the mean particle diameter is higher at higher vertical loads, which is also evident from the fact that the cumulative curve shifts to the right as the vertical load increases. The non-normalized differential size distribution (see Supplementary Materials Figure S1a) shows that the shift has two causes: on the one hand, the total number of small particles decreases slightly with increasing vertical load. On the other hand, the number of large particles increases significantly.
In the case of the adhesion utilization of 0.62 (Figure 4b), there are also bimodal distributions, which, however, show a flatter lower peak and a higher upper peak at low vertical loads. Just as in the free-rolling condition, the lower peak decreases with increasing vertical load, while the upper peak increases and shifts slightly to larger diameters. This is due to a minor decrease in small particles and a considerable increase in large particles (see Supplementary Materials Figure S1b). In addition, it can be seen that emission occurs up to the range of coarse particles ( d p 10 μ m ), which is not the case in the free-rolling condition. The clear shift in the particle number distribution towards larger diameters can also be seen in the cumulative curve, which turns flatter with increasing vertical load. Regardless of the load condition, an increase in the vertical load results in a shift towards larger particles, which is more pronounced at high adhesion utilizations.
The shift in the size distribution as a function of vertical load (at consistent adhesion utilization) can probably be explained by the effects on the tire–road contact patch. Both the vertical load and the contact patch increase, leading to consistent contact pressure. Therefore, relative to the length of the contact patch, the shear stress distribution remains constant, meaning that the ratio of deformation slip to gliding slip does not change. However, as the contact area becomes longer, the absolute sliding distance of the profile elements increases. The longer sliding distance could cause particles that detach from the tire tread in the front area of the sliding zone to be combined with other particles by subsequent profile elements sliding over them. The result would be a growth of coarse particles.
The shift in the size distribution as a function of adhesion utilization (Figure 4b compared to Figure 4a) is probably due to a similar effect. Higher adhesion utilization causes higher shear stress on the tire–road contact. This means that the tread elements reach the adhesion limit further forward in the tire–road contact. This results in a higher ratio of gliding slip to deformation slip. According to the mechanism described above, this could favor the formation of large particles.

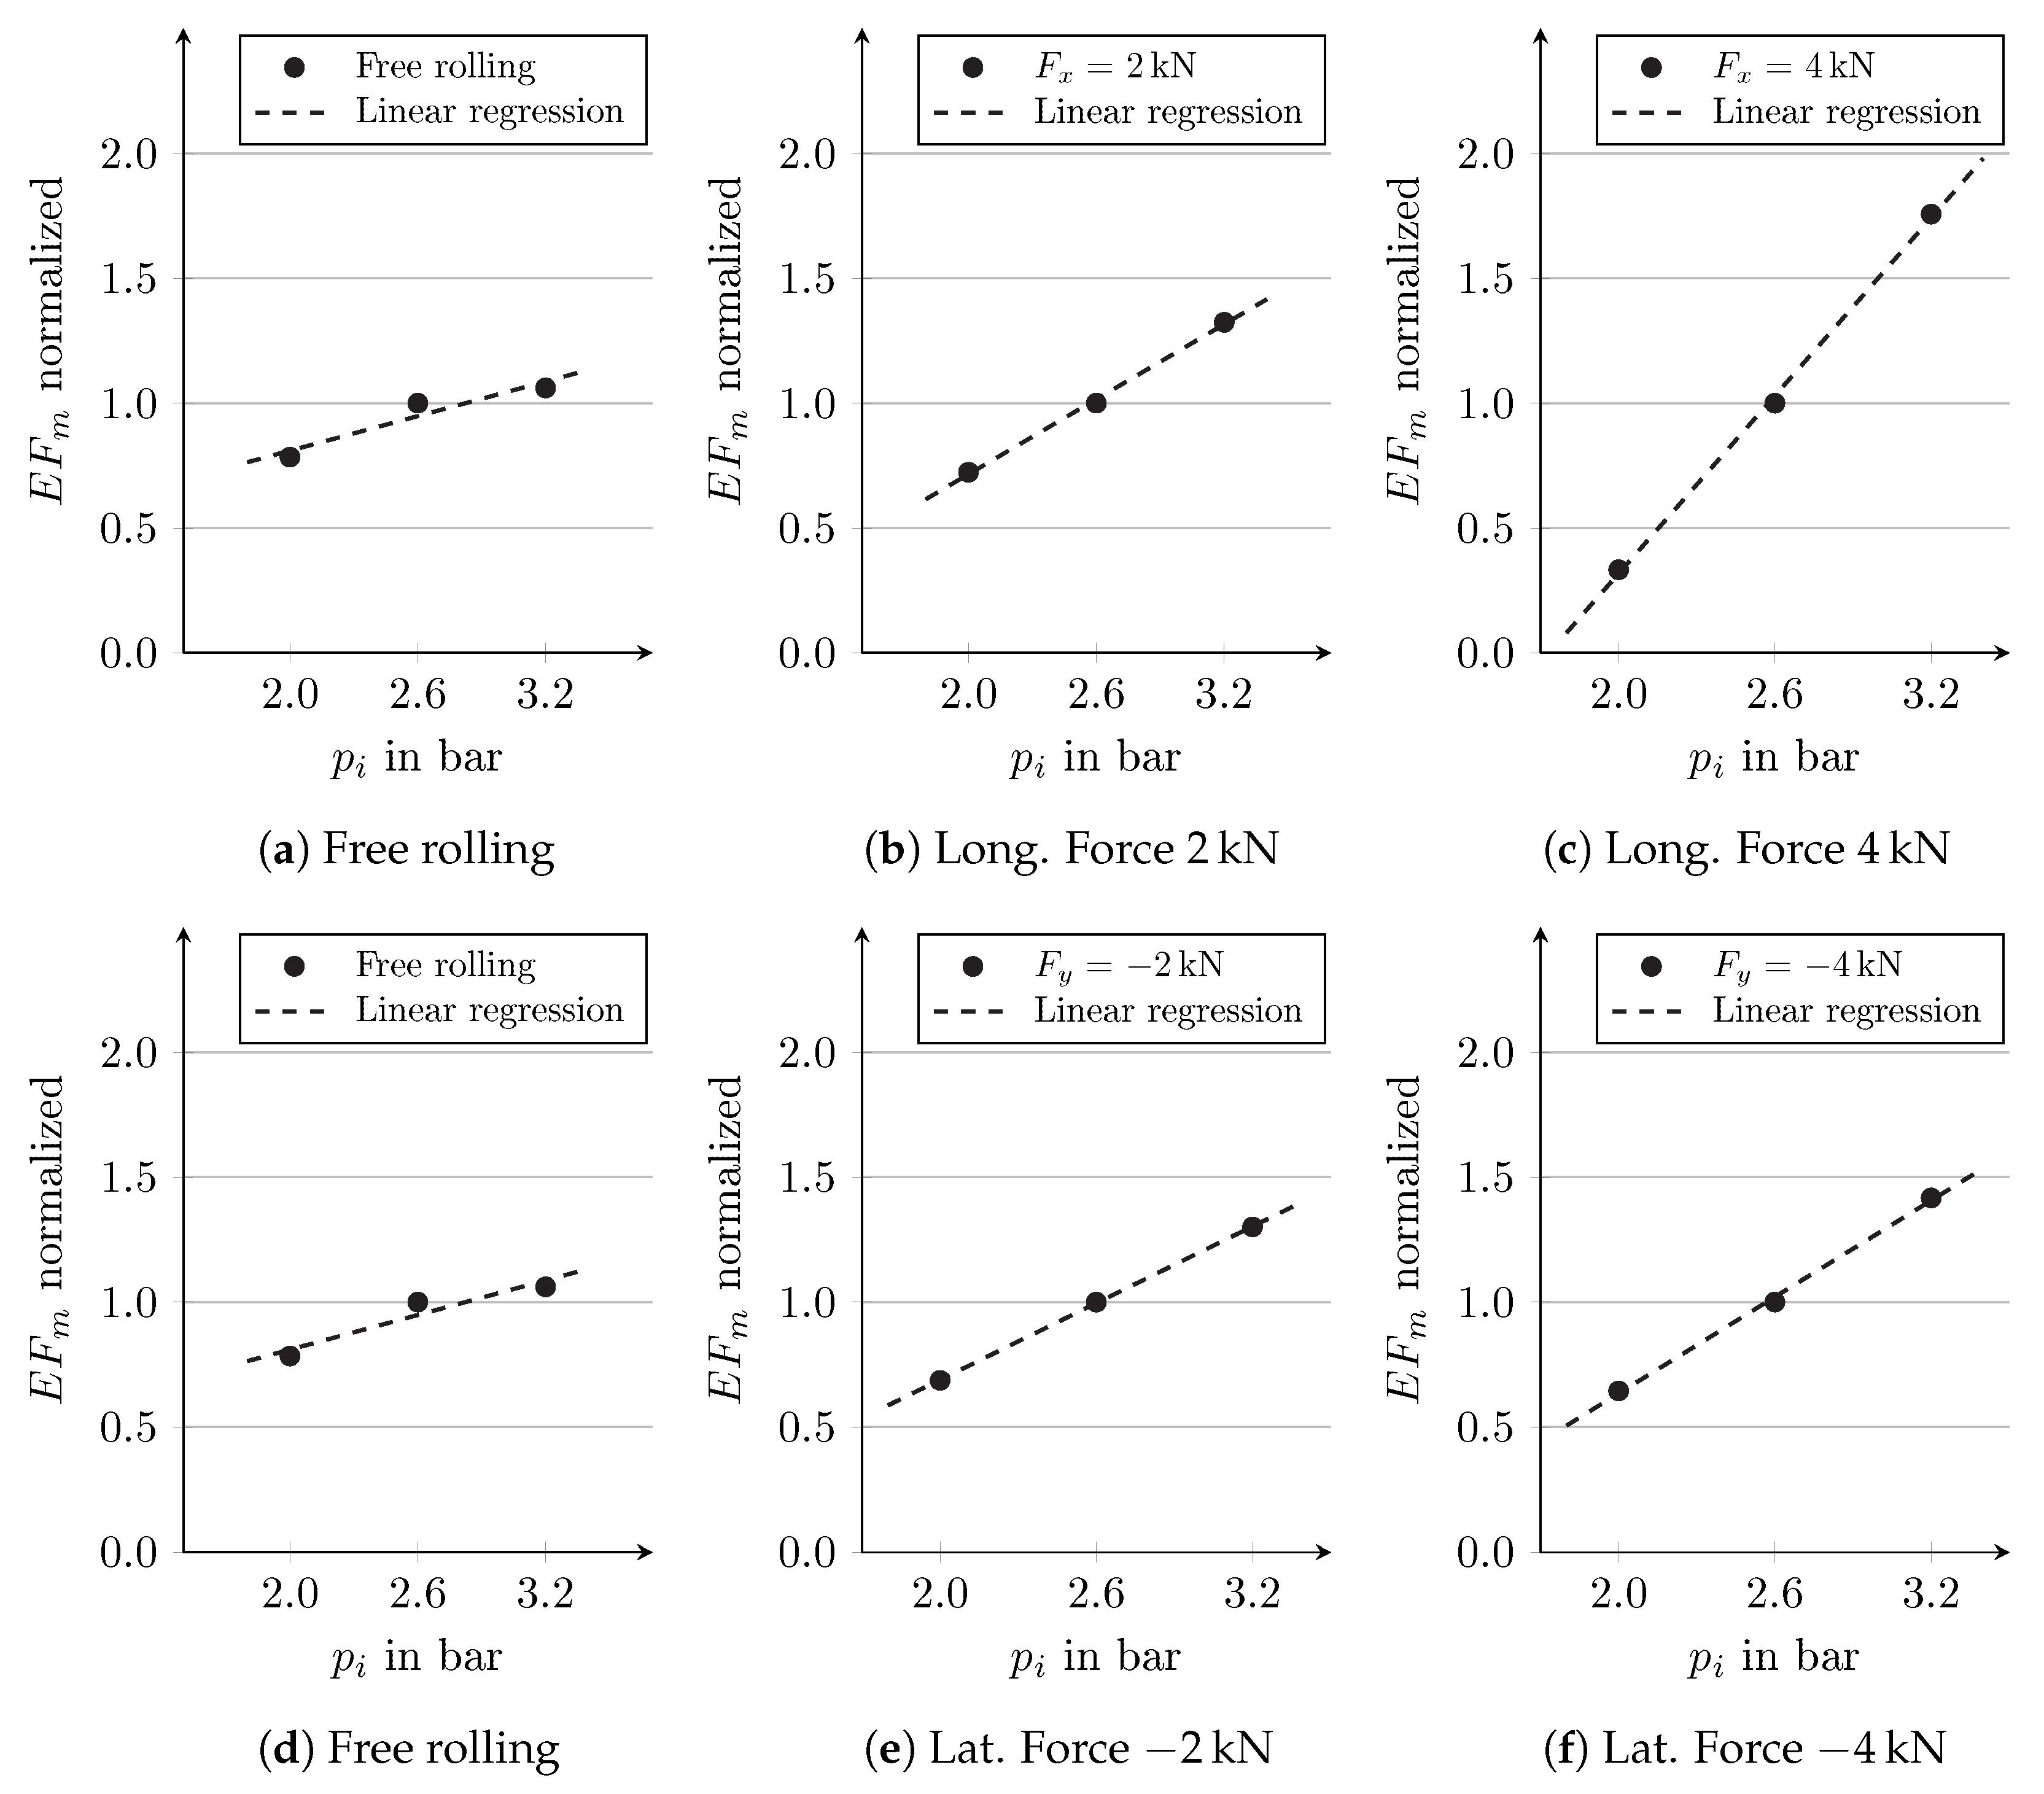
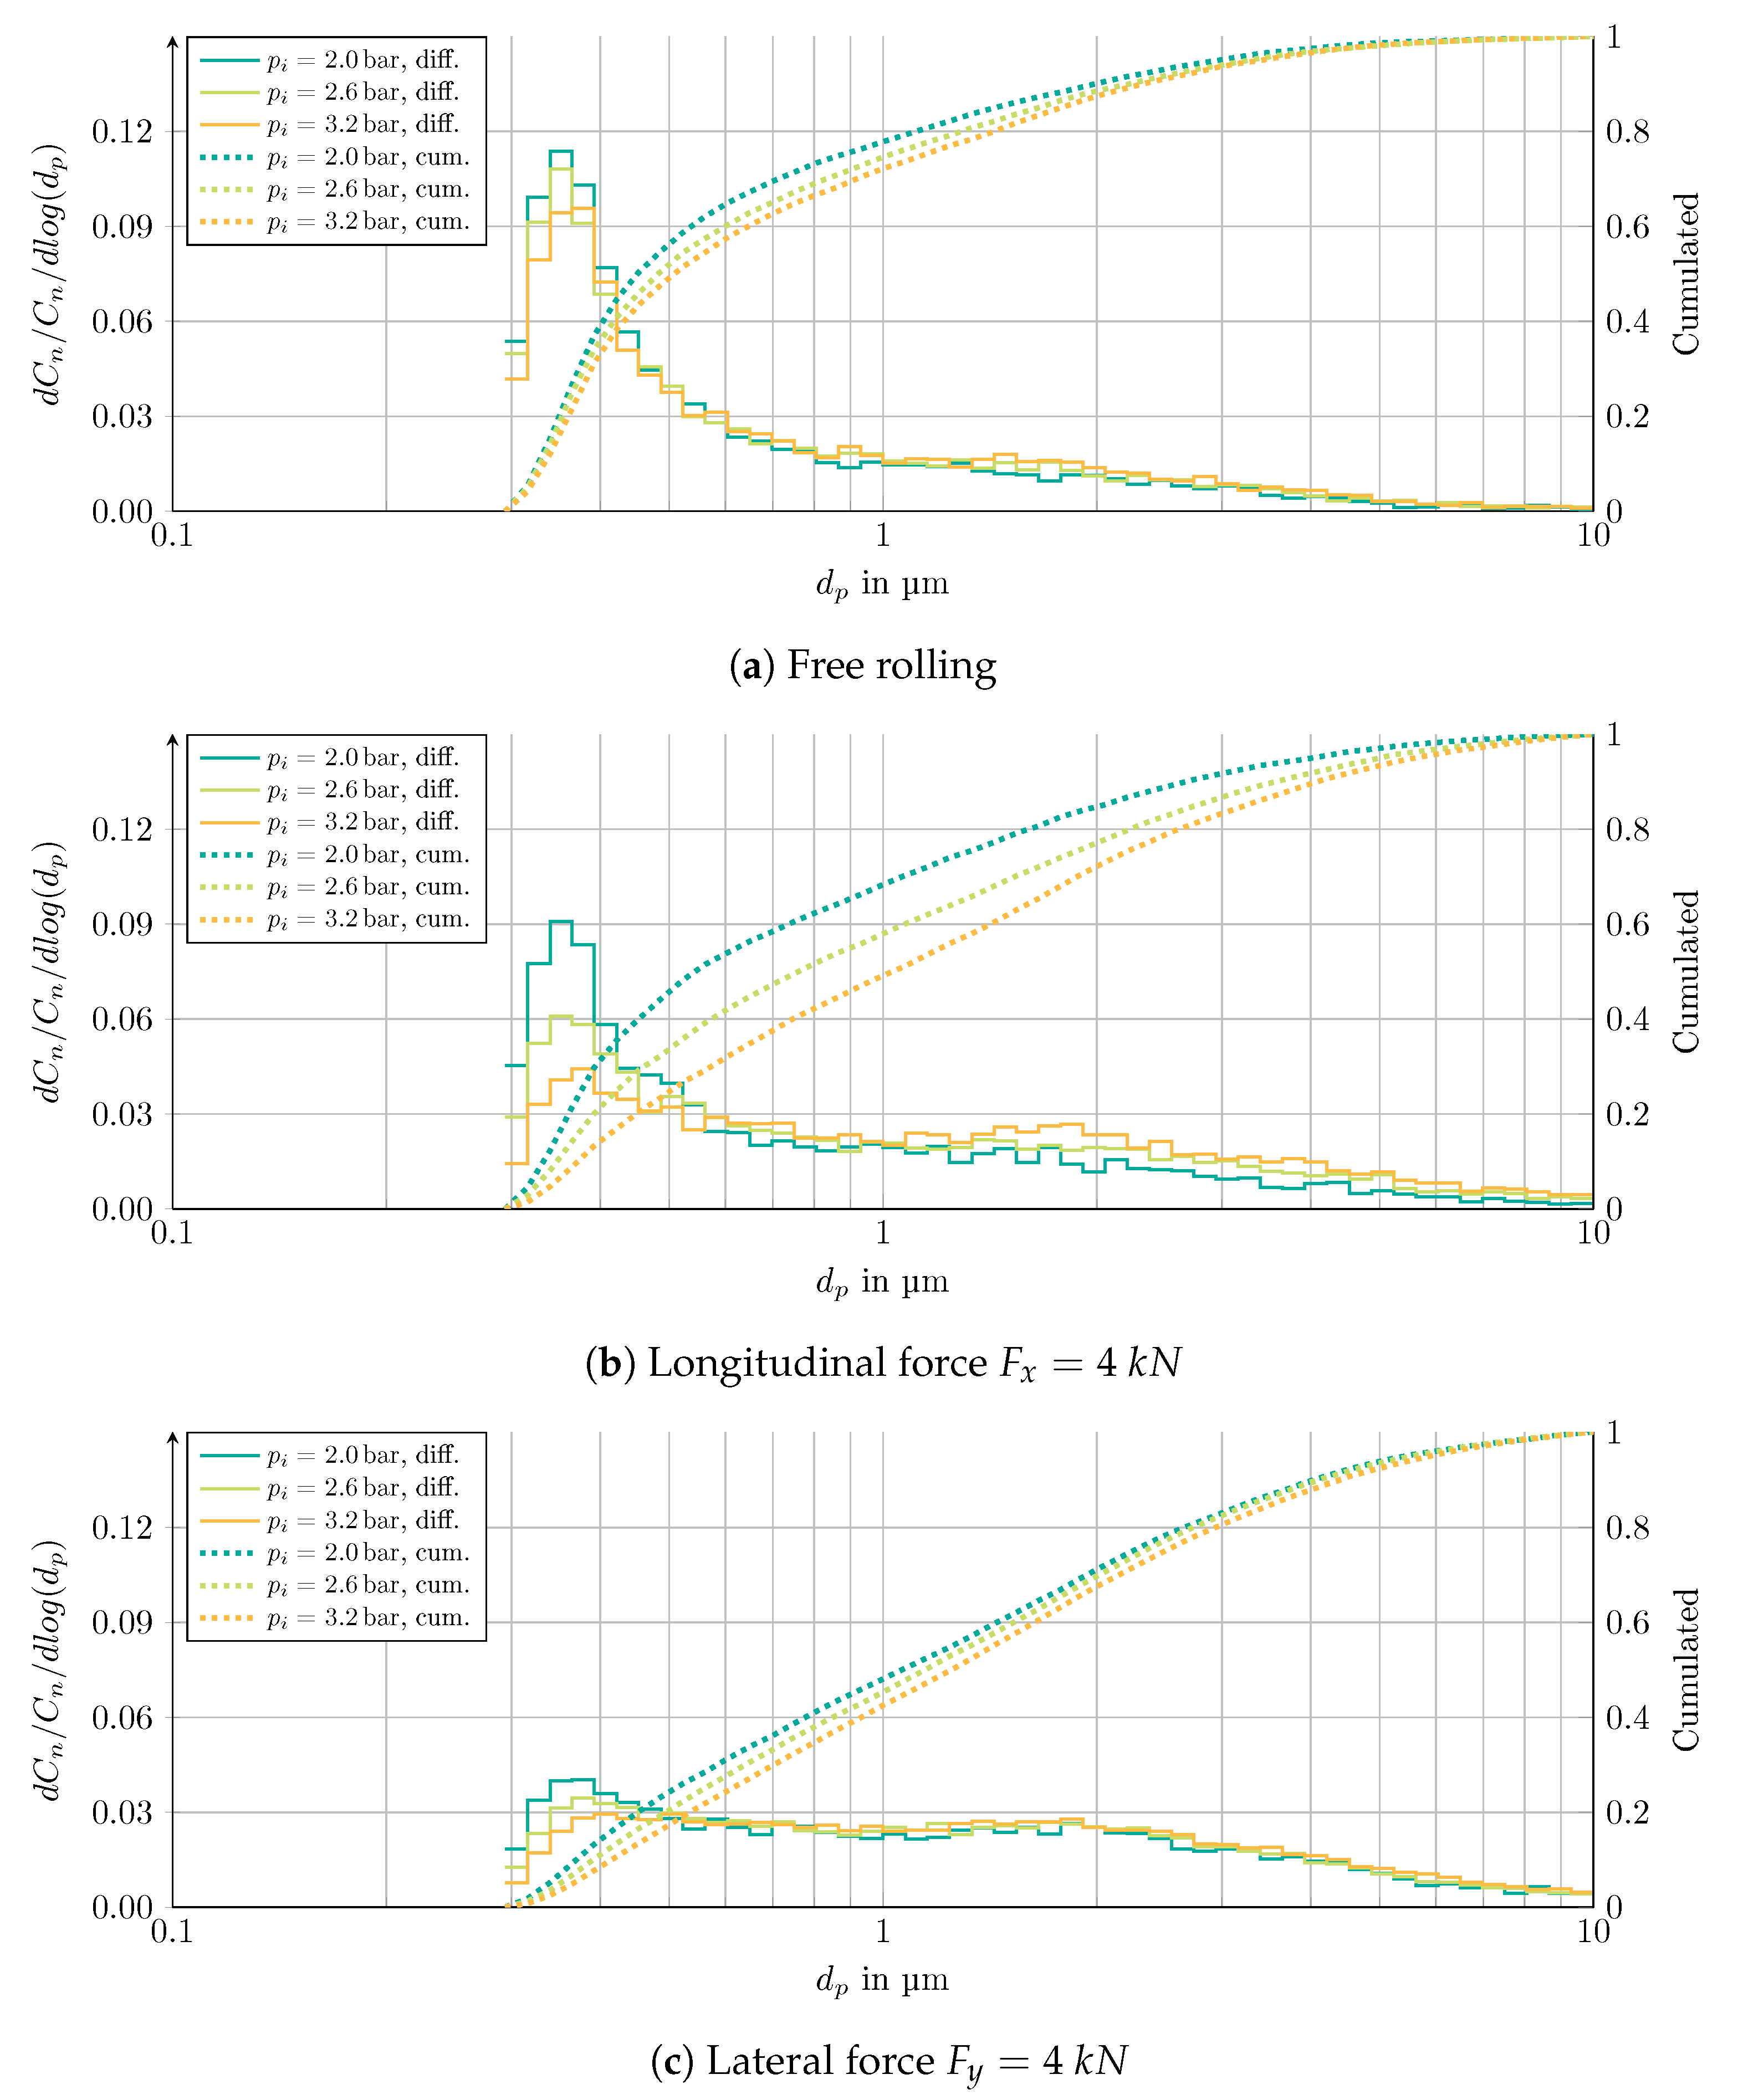
3.2. Influence of Inflation Pressure on PM Emission

The same evaluation was carried out for the test series on the influence of tire inflation pressure. In Figure 5, the results are shown for some representative load conditions. The EF is plotted in normalized form to facilitate comparing the influence of different load conditions. The normalization was carried out using the respective emission factor at an inflation pressure of 2.6 bar. The diagram for the free-rolling wheel is shown twice (Figure 5a,d) to simplify comparison to longitudinal and lateral forces.
The diagrams show a positive linear relationship between inflation pressure and emission factor for all load conditions. Similar to the change in vertical load, this effect is due to the changing tire–road contact patch. While the contact pressure remains almost constant if the vertical load is changed, here, it increases in inverse proportion to the contact area. Thus, a change in inflation pressure results in an inversely proportional change in the contact area between the tire and the road surface. The same horizontal force must be transmitted via the smaller contact area, which leads to higher shear stress in the tread elements. This in turn is expected to lead to a shorter distance between the starting position of sliding and the end of the contact patch. However, the sliding processes take place under greater shear stress. Eventually, as in Section 3.1, there are linear increases in the EF over the inflation pressure, whereby the gradient depends to a large extent on the applied force and its direction. Since it may seem implausible at first that higher tire inflation pressure leads to higher emissions, the relationship is discussed in more detail in Section 4.
While the gradient (influence of inflation pressure on the emission factor) is low in the free-rolling condition (Figure 5a), it becomes significantly higher with increasing longitudinal force (Figure 5b,c). This is probably due to an increase in the ratio between the proportion of longitudinal force caused by gliding slip and the proportion caused by deformation slip with increasing longitudinal force and tire inflation pressure. In detail, two effects contribute to that. On the one hand, higher inflation pressure at constant vertical load leads to a smaller tire contact patch. This in turn reduces the longitudinal force, provided that the slip remains the same. In addition, the maximum shear stress decreases with increasing tire inflation pressure and constant slip. The resulting curve for the relationship between longitudinal force and slip is correspondingly flatter [28]. Therefore, to achieve the same longitudinal force at higher inflation pressure, a higher slip value is required. The difference in slip for different inflation pressures is amplified by the degressive courses of the (total) longitudinal force (see Supplementary Materials Figure S2).
On the other hand, the ratio between longitudinal force due to gliding slip and that due to deformation slip changes with the slip value. At low slip values, the proportion of deformation slip predominates, and the proportion of gliding slip increases only gradually once the slip is increased [29]. Both effects together result in a continuously increasing ratio between gliding and deformation slip with increasing longitudinal force and tire inflation pressure (see Supplementary Materials Figure S2). The increase in the gliding proportion ultimately leads to enhanced emissions. Thus, the influence of inflation pressure increases with increasing longitudinal force.
In contrast, the influence of inflation pressure on emissions is smaller when lateral force is applied (Figure 5e,f). Due to the smaller contact area with increasing inflation pressure, the stiffness of the tread decreases in the same way as in the longitudinal direction. In contrast, with increasing inflation pressure, the tire carcass and tire belt become stiffer in the lateral direction and become less deflected. Due to the reduced belt deflection, the total displacement of the tire tread relative to the wheel center plane increases less so than for equivalent longitudinal forces. As the two effects become superimposed, they partially compensate each other, and there is only a slight decrease in cornering stiffness if the inflation pressure is increased. Because of the smaller change compared to the longitudinal stiffness, the difference in lateral slip between the total force curves at different tire inflation pressures is smaller. As a result, the effect described for longitudinal force is also present here, but to a lesser extent, so that the gradient of the EF increases only slightly with increasing lateral force.
To better exemplify the influence of tire inflation pressure and compare it to the influence of vertical load, a realistic scenario is first considered in which the target tire inflation pressure of 2.6 bar is exceeded by 0.2 bar. For the load conditions free rolling, 4 kN longitudinal force and −4 kN lateral force, this change in inflation pressure results in emission increases of 5%, 23%, and 13%, respectively. However, in order to obtain the same percentage increase in emissions as with the change in vertical load (4 kN to 5 kN, see Section 3.1), an increase of 0.6 bar to 3.2 bar would be required in the free-rolling condition as well as under maximum longitudinal force (mean value of positive and negative). As with the change in vertical load, this corresponds to an increase of approximately 25% in tire inflation pressure. This means that the influence of the tire inflation pressure is comparable in magnitude to that of the vertical load.
The particle size distributions were also evaluated for the test series on the influence of tire inflation pressure. Figure 6 contains the particle number distributions for the three different inflation pressures and three different load conditions: free rolling (Figure 6a), longitudinal force of 4 kN (Figure 6b) and lateral force of 4 kN (Figure 6c).
For the free-rolling condition (Figure 6a), a bimodal distribution is shown with one peak in the area of the lower detection limit of 0.3  μ m and an indication of a second peak just above 1 μ m . The inflation pressure appears to have an influence on the particle size distribution, although this is very small in the free-rolling condition. With increasing inflation pressure, there is a slight shift towards larger particles.
Similar processes can be seen for the conditions with longitudinal force (Figure 6b) and lateral force (Figure 6c). The higher the inflation pressure, the smaller the lower peak and the higher the upper one. Consequently, there is a shift towards larger particles. The shift with increasing inflation pressure occurs even though the absolute emission increases across all size ranges, which is due to the particularly pronounced increase in coarse particles (see Supplementary Materials Figure S3b,c). This is especially evident when looking at emissions at the upper detection limit of 10 μ m . There, it can be seen that in the loaded conditions, particles are still emitted, which is not the case for the free-rolling condition. In the case of longitudinal force, the tire inflation pressure has a significantly greater influence than in the free-rolling condition. The same applies to lateral force, whereby the emission in the coarse size range is even more pronounced than with longitudinal force. In general, lateral force seems to have a stronger influence on the overall size distribution, so that the two peaks are almost balanced for all three inflation pressures. With increasing inflation pressure, the shape of the size distribution changes only slightly (but its magnitude is amplified, see Supplementary Materials Figure S3c).
To explain the phenomena, the changes of tire tread are considered again. The contact patch shrinks with increasing inflation pressure, especially in the longitudinal direction [26], which leads to higher surface pressure and higher shear stress. The tread elements in contact with the road surface are therefore subjected to greater stress and tend to form larger particles. As only the basic shear stress distribution is present in the free-rolling condition, the influence of inflation pressure is low. If additional shear stress is added by longitudinal force, the deflection of the tread blocks increases. Compared to low inflation pressure, there is a greater increase in sliding processes, which could intensify the formation of large particles. Also, for longitudinal force, the influence of inflation pressure is particularly pronounced. This is related to the major change in tire stiffness in this direction. In the case of lateral force, however, the changes in size distribution are much smaller, as is the case for the total emission, since the cornering stiffness hardly changes with the inflation pressure.
The larger influence of lateral forces on the size distribution compared to longitudinal forces (Figure 6c compared to Figure 6a,b) is probably related to the design of the tire tread. The summer tire examined has almost continuous ribs in the longitudinal direction, which are only interrupted by narrow sipes. This results in less deformation and hardly any edge wear. In the lateral direction, the tread is divided by wide grooves. When lateral force is applied, this results in greater deformation with more edge wear. Both favour the formation of large particles.

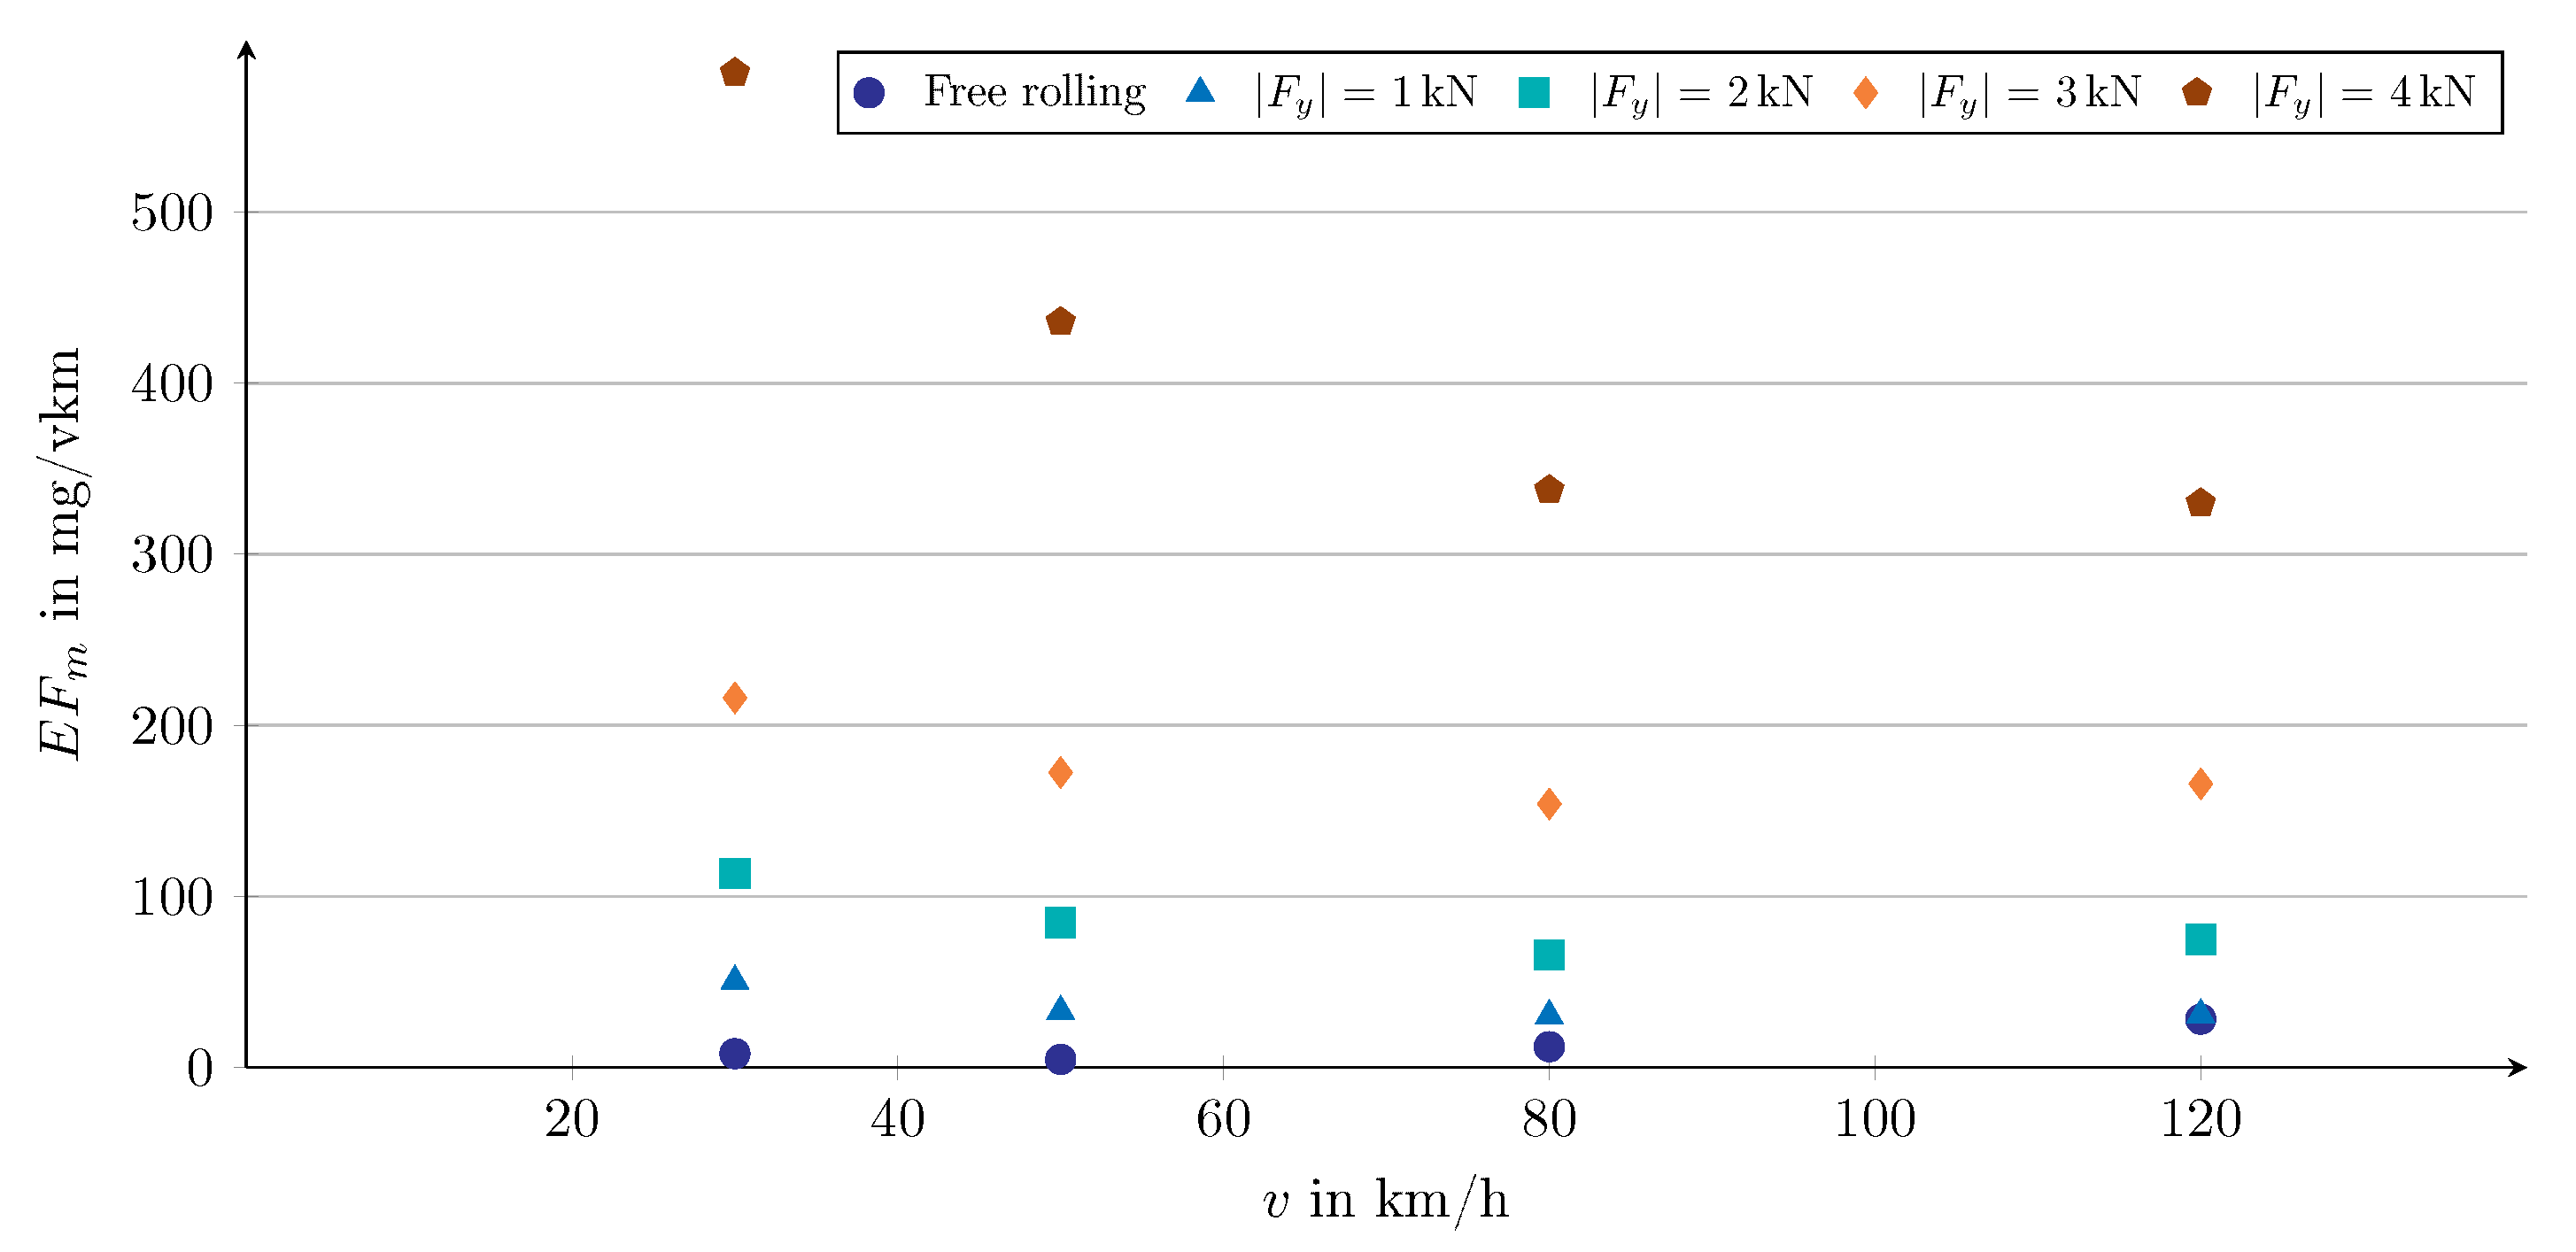
3.3. Influence of Driving Speed on PM Emission

The result of the test series on the influence of driving speed is illustrated in Figure 7. It should be noted that the emission factors shown here are also distance-related. This means that the emission values for different speeds have changed relative to each other compared to the particle concentrations measured (per time). While the particle mass concentration (per time) at high speeds was significantly higher than at low speeds, the ratio changes if the distance traveled is selected as a reference instead of the time. This means that the EFs (per distance) for low speed can be higher than those for high speed, although the latter ones led to higher particle mass concentrations (per time).
The same symbols indicate EFs at the same lateral force and different driving speeds. For high forces, it appears that the EF decreases with increasing driving speed. For lateral forces between 1 kN and 3 kN, it decreases slightly from 30 km/h to 80 km/h and increases again for 120 km/h. In the free-rolling condition, the EF increases with increasing driving speed. In total, no clear trend can be identified across the test series, which is why regression curves were not used. A more detailed analysis of the effects that could be responsible for the unclear results, together with a comparison with reference results from the literature, can be found in Section 4.
The size distributions are shown in Figure 8. In the free-rolling condition (Figure 8a), the basic distribution is very similar to that of the other test series with similarly high peaks at the same diameters. As the speed increases from 30 km/h to 80 km/h, the lower peak rises, while the upper peak diminishes. In this case, the change in particle size distribution is mainly due to a larger number of small particles. The number of large particles increases as well, but less than the number of small particles (see Supplementary Materials Figure S4a). As a result, the cumulative curve shifts to the left, indicating a decreasing mean diameter with increasing speed. An opposite trend results for the speed of 120 km/h. However, since the trend reversal only takes place in the free-rolling condition, the effect is probably not due to an actual tire phenomenon. It is much more likely that at high speeds, the associated high turbulence whirls up and sucks in larger particles that had already been deposited inside the test bench before. Due to the extremely low emission in the free-rolling condition, even the smallest amounts of such foreign material can cause a falsification of the size distribution. This hypothesis is supported by the fact that at high speeds, the number of large particles increases significantly in addition to the number of small particles. At lower speeds, however, the number of coarse particles hardly changes. As the speed has limited influence on the slip in the tire tread, it is unlikely that the additional emission of coarse particles is caused by a direct emission phenomenon.
At a lateral force of 4 kN (Figure 8b), very flat size distributions result with two peaks of approximately equal height in the range of 0.4  μ m and between 1  μ m and 2 μ m . As the speed increases, the lower peak rises while the upper peak decreases. At the same time, the upper peak appears to be shifting towards smaller particle diameters. The average particle size therefore decreases, which can also be seen in the cumulative curve shifting to the left. There is no trend reversal for high speeds at this load condition, which indicates that the effect described above is superimposed by the higher emissions and can therefore also be neglected for the free-rolling condition.
The decreasing average particle size with increasing speed is probably due to the faster processes at higher speeds. As a result of the shorter contact time, all tire–road contact processes happen more rapidly. On the one hand, the driving speed influences the visco-elastic properties of the tire material and thus the resulting tire forces. On the other hand, consistent slip at changing vehicle speed also means a proportional change in the differential speed between the tire and the road surface. Since the second effect is greater, it can be assumed that the interlocking effects occurring between the tire and the road are less intense, so that the overall formation of cracks in the tread material is reduced. This is expected to cause less big particles, which leads to the visible shift towards smaller particles.
Another effect that could influence the size distribution is the tire temperature. Even if the tire is rolling freely, higher driving speed results in a higher tread temperature. The heating effect is amplified if the tire is subjected to lateral forces. The sliding distance traveled by the tire elements at a given lateral force increases in proportion to the speed. This means that in the same duration, the sliding distance is higher at higher speed, resulting in a significantly higher tread temperature. The higher temperature leads to a softer tire compound, which influences the formation of particles.

4. Discussion

The results show the correlations between the parameters vertical load, tire inflation pressure and driving speed and the emission of tire–road particulate matter. In the following, the results are critically scrutinized and, where available, compared with the results of existing studies.
For the test series for vertical load, the same tire was driven with different vertical loads. The shown effects therefore reflect one vehicle driven under different load conditions. In order to most realistically represent the effect of vehicle mass on tire–road PM emissions, tires with different load indices would have to be used for different vehicle masses. However, since the compound and substructure of a tire can change along with the tire dimension for the same tire model, all tests were performed with the same tire. This ensured that the influence determined was solely due to the vertical load and that no other influences were represented. Therefore, it can be assumed that the influence of the vertical load would be somewhat lower if two vehicles of different masses were compared using tires that are perfectly balanced for them.
The found influence of vertical load on the emission is in good agreement with other studies. Both Aatmeeyata et al. [10] and Kim et al. [11] indicate a positive linear correlation between the vertical load and the PM emissions for their test bench measurements. Since the test benches used in their studies do not allow for slip conditions, only the effect in the free-rolling condition was evaluated. Both studies show a greater influence of vertical load than found here. In Aatmeeyata et al., an increase in vertical load of 25% leads to an increase in emission of 41% and in Kim et al., of 32%. These values are considerably higher than the 14% found in our study. However, numerous factors such as the type of test bench and its design, the road surface used or the tire tested may be responsible for this discrepancy. More important is the consistency of the qualitative correlation.
Little is known about the exact influence of tire inflation pressure on tire-road PM emissions. Most authors simply state that emissions can be minimized by using the optimum inflation pressure [30,31]. However, the question of what the optimum inflation pressure is remains unanswered. Aatmeeyata et al. [10] found a slight decrease in PM emissions with increasing tire inflation pressure in their tests. However, the difference in emissions was so small that the authors did not consider the effect to be significant. The results obtained here contradict this, in that emissions increase slightly with increasing inflation pressure in the free-rolling condition. This effect increases significantly when horizontal tire forces are applied. The difference from the results of Aatmeeyata et al. may be due to the different load conditions or, again, the different test benches and road surfaces.
At first glance, it seems implausible that emissions would increase with rising tire inflation pressure, as it would appear to be more logical that a lower rolling resistance due to higher inflation pressure would result in less tire wear. However, it is important to note that the particulate matter measured here is not exclusively tire material. A significant portion of the particles originate from the road surface [12]. Furthermore, with increasing tire inflation pressure, the frictional processes take place in a smaller area, making them more intense. Together with the processes described in Section 3.2, this explains the results presented in this study.
The finding that the influence of vertical load and the influence of tire inflation pressure are approximately the same could be caused by the two overlapping effects having a different impact. While the tire–road contact area increases, the vertical load rises and the contact pressure remains almost constant. However, as the tire inflation pressure increases, the contact area decreases and the contact pressure rises. According to the results shown, both changes lead to comparable increases in emissions. Thus, it can be concluded that the influence of contact pressure must be greater than the influence of the size of the contact area. Whether the findings and the statements made fully apply must be investigated in future tests.
The influence of driving speed also seems contradictory at first glance. In the literature, a higher speed is occasionally associated with higher PM emissions [11,32,33]. It should be noted, however, that only on the test bench can the effects of driving speed be separated from those of longitudinal and lateral forces, whereas on the open road, they always occur together. Due to the increasing air resistance of a vehicle with increasing speed on open roads, the drive power required to maintain a particular speed increases. It is therefore the higher driving force in the tire–road contact that leads to higher PM emissions, not the speed itself. Feißel et al. also draw this conclusion from their mobile on-board measurements [21]. Accordingly, this effect is not necessarily visible on the test bench, as there is no air resistance. However, to simulate the effect, the forces occurring at higher speeds could also be increased by the amount of air resistance. Furthermore, it must be noted that some authors do not relate the PM emission to the distance traveled, but rather provide time-dependent particle concentrations. As the emission per unit of time is higher when driving faster, this leads to imprecise or even incorrect statements about the influence of driving speed. From the reasons given above, it can therefore be assumed that the emission factor is nearly independent of the driving speed. This statement is supported by the findings of Beji et al. [34], Feißel et al. [21] and Tonegawa and Sasaki [35].
The fact that at high lateral forces the emission factor even decreases with increasing speed in the results shown in Figure 7 is presumably not an actual phenomenon, but rather due to effects of the test setup. Despite best possible shielding of the tire–road contact, it is possible that the proportion of particles which are not captured increases with increasing speed. This hypothesis is supported by two observations. Firstly, the increase in the emission factor with increasing lateral force is particularly more pronounced at low speeds than at high speeds. In the latter condition, most particles are generated, so it can be assumed that a particularly large number of particles are not detected here. Secondly, the analysis of the particle concentrations in the unloaded condition (between the individual load conditions) shows that at high speeds, a higher particle concentration remains in the test bench after the tire has been unloaded or lifted. This means that some of the particles emitted while loaded are not directly captured by the extraction device and leave the extraction hood in the first place. However, they are transported back to the wheel by the circular flow in the drum and only get detected after the actual load condition. Thus, these particles are not taken into account for the emission of the respective load condition. For future tests, it is therefore expedient to adjust the time span in which the particles are assigned to each load condition so that an optimal time span is used for each driving speed.
Another influence could be the tire temperature, which also depends on the driving speed. At high speeds, the temperature in the tire tread increases. This effect is further amplified by the surrounding suction hood. As a result, the tire temperature rises significantly faster at high speeds than at low speeds, especially in severe load conditions. The higher temperature could change the surface of the tire to release very coarse particles that are too large to be detected by the aerosol spectrometer. For future tests, it is therefore necessary to find a way to cool the tire as realistically as possible, despite the shielding of the suction hood.
All emission factors shown in this study are snapshots. Their values represent the emissions that would be generated by a theoretical vehicle with the same load condition on all four wheels driving one kilometer under exactly this load condition. Since vehicles on open roads are hardly stationary, but the load condition is constantly changing, the EFs shown are not directly representative of driving on a real road. In order to calculate an average value from the EFs shown, it is therefore necessary to record driving data during a real drive. The drive can be divided into infinitely short time steps, and an emission can be assigned to each time step according to the relationships established here and in [12]. The total emissions can be calculated by adding the individual emissions and the average EF results when relating it to the distance traveled. The values published in the literature so far for tire–road PM cannot be assigned to a specific load condition, but correspond to long-term EFs. They are in the range between 2.0 mg/vkm and 11.0 mg/vkm [36,37,38,39,40]. Initial extrapolations based on the correlations shown in this study indicate that the EFs for an average drive will be in the same range. However, the exact calculation using real driving data is still pending.

5. Conclusions

The objective of this study was to experimentally investigate the influence of vertical load, tire inflation pressure, and driving speed on tire–road particulate matter emissions. The tests were performed using an internal drum test bench, which closely mimics open-road conditions by using real road surfaces. Due to its encapsulation and the resulting constant test conditions, the results are highly reproducible. Using an aerosol spectrometer system, the test bench records PM emissions in the particle size range between 0.3 μ m and 10 μ m in real time. This allows an emission factor to be assigned to each of the driving conditions examined, which is valid for a distance traveled by an entire vehicle under this particular load condition. In addition to the total emission, the aerosol spectrometer records the particle size distribution, so that the influence of the investigated parameters can also be determined in this respect. The following conclusions can be drawn from the data:
  • Vertical load: An increase in vertical load at consistent longitudinal dynamics (constant adhesion utilization) results in a linear increase in the emission factor. This statement applies to both driving and braking. Only the vertical load has been changed, not the tire. As the vertical load increases, the mean diameter of emitted particles increases. While more coarse particles are emitted, the number of fine particles remains almost unchanged. This results in a flatter (normalized) particle number distribution.
  • Inflation pressure: An increase in inflation pressure causes a linear increase in PM emissions. In percentage terms, the influence of tire inflation pressure is as great as that of vertical load. The increase is accompanied by an increase in the average particle diameter. The shift in particle size distribution is mainly due to additional particles in the coarse size range. However, there is also a slight increase in the number of fine particles.
  • Driving speed: A clear influence of driving speed on PM emissions (per distance traveled) cannot be concluded from the tests carried out. It can be assumed that the speed has no or only an insignificant influence on the emission factor. However, as the driving speed increases, the average particle size decreases.
  • Size distribution: A bimodal particle number distribution results for all load conditions. One peak is located at the lower detection limit of 0.3  μ m . The exact position of the second peak depends on the load condition, but is always in the size range between 1 μ m and 2 μ m .
  • Others: Throughout the test series, higher adhesion utilization (in both the longitudinal and lateral direction) results in a larger mean diameter. Under the influence of a lateral force, the proportion of coarse particles is generally higher than under longitudinal force.
  • Future Research: In future studies, the influence of driving speed should be investigated in detail, taking into account the improvements discussed. In addition, the size range of particulate matter should be expanded to include larger particles in order to determine the relationship between total tire mass loss and particulate matter. Of particular interest is what happens to the particles after they are released. It should be investigated whether the particles tend to be further ground up or agglomerate into larger particles when they are rolled over again.
In conjunction with the results of our earlier study with the same test bench setup [12], the knowledge gained here can be used to develop a prediction model for tire–road PM emissions. Using real-driving data, each load condition can be assigned an emission factor that is valid for a given distance. By summing up the individual emissions, the total emission for such a trip can be predicted. Since this is likely to be a fairly simple model with low complexity and computational power, it could even be implemented as a real-time application in vehicles to best assist drivers in driving with low PM emissions. Ultimately, the model could also be used in autonomous vehicles to achieve the lowest possible PM emissions through targeted trajectory planning.

Supplementary Materials

The following supporting information can be downloaded at: https://www.mdpi.com/article/10.3390/atmos15040502/s1, Figure S1: Influence of vertical load on the particle number distribution at different load conditions in non-normalized view; Figure S2: Total tire force and proportion of force due to gliding slip as a function of slip for two different tire inflation pressures; Figure S3: Influence of tire inflation pressure on the particle number distribution at different load conditions in non-normalized view; Figure S4: Influence of driving speed on the particle number distribution at different load conditions in non-normalized view.

Author Contributions

Conceptualization, S.S.; methodology, S.S.; software, S.S.; validation, S.S., M.Z. and H.-J.U.; formal analysis, S.S. and M.Z.; investigation, S.S; resources, F.G.; data curation, S.S.; writing—original draft preparation, S.S.; writing—review and editing, S.S. and H.-J.U.; visualization, S.S.; supervision, S.S.; project administration, S.S.; funding acquisition, F.G. All authors have read and agreed to the published version of the manuscript.

Funding

We acknowledge support by the KIT-Publication Fund of the Karlsruhe Institute of Technology.

Institutional Review Board Statement

Not applicable.

Informed Consent Statement

Not applicable.

Data Availability Statement

Restrictions apply to the availability of these data. Due to a non-disclosure agreement, the data are only available from the corresponding author with the permission of the Mercedes-Benz Group AG.

Acknowledgments

We would like to thank the Mercedes-Benz Group AG, which made it possible to carry out this study by funding the framework project “Influence of the vehicle driving conditions on the tire-road particulate matter emissions”.

Conflicts of Interest

The authors declare that they have no known competing financial interest or personal relationships that could have appeared to influence the work reported in this paper.

Abbreviations

The following abbreviations are used in this manuscript:
BEVBattery Electric Vehicle
EFEmission Factor
FASTInstitute of Vehicle System Technology
gGravitational Acceleration
ICEInternal Combustion Engine
ICEVInternal Combustion Engine Vehicle
KITKarlsruhe Institute of Technology
NEENon-Exhaust Emissions
PMParticulate Matter

References

  1. European Commission. Regulation of the European Parliament and of the Council: On Type-Approval of Motor Vehicles and Engines and of Systems, Components and Separate Technical Units Intended for Such Vehicles, with Respect to Their Emissions and Battery Durability (Euro 7) and Repealing Regulations (EC) No 715/2007 and (EC) No 595/2009. 2022. Available online: https://ec.europa.eu/commission/presscorner/detail/en/IP_22_6495 (accessed on 27 March 2024).
  2. van der Gon, H.A.C.D.; Gerlofs-Nijland, M.E.; Gehrig, R.; Gustafsson, M.; Janssen, N.; Harrison, R.M.; Hulskotte, J.; Johansson, C.; Jozwicka, M.; Keuken, M.; et al. The policy relevance of wear emissions from road transport, now and in the future–an international workshop report and consensus statement. J. Air Waste Manag. Assoc. 2013, 63, 136–149. [Google Scholar] [CrossRef] [PubMed]
  3. Grigoratos, T.; Martini, G. Non-Exhaust Traffic Related Wmissions. Brake and Tyre Eear PM: Literature Review; European Union: Maastricht, The Netherlands, 2014. [Google Scholar] [CrossRef]
  4. OECD. Non-Exhaust Particulate Emissions from Road Transport: An Ignored Environmental Policy Challenge; OECD Publishing: Paris, France, 2020. [Google Scholar] [CrossRef]
  5. Park, I.; Kim, H.; Lee, S. Characteristics of tire wear particles generated in a laboratory simulation of tire/road contact conditions. J. Aerosol Sci. 2018, 124, 30–40. [Google Scholar] [CrossRef]
  6. Sommer, F.; Dietze, V.; Baum, A.; Sauer, J.; Gilge, S.; Maschowski, C.; Gieré, R. Tire Abrasion as a Major Source of Microplastics in the Environment. Aerosol Air Qual. Res. 2018, 18, 2014–2028. [Google Scholar] [CrossRef]
  7. Timmers, V.R.J.H.; Achten, P.A.J. Non-exhaust PM emissions from electric vehicles. Atmos. Environ. 2016, 134, 10–17. [Google Scholar] [CrossRef]
  8. Beddows, D.C.; Harrison, R.M. PM10 and PM2.5 emission factors for non-exhaust particles from road vehicles: Dependence upon vehicle mass and implications for battery electric vehicles. Atmos. Environ. 2021, 244, 117886. [Google Scholar] [CrossRef]
  9. Bruyninckx, H.; Vidič, S. EMEP/EEA Air Pollutant Emission Inventory Guidebook 2013: Technical Guidance to Prepare National Emission Inventories. In EEA Technical Report Series. Available online: http://www.eea.europa.eu/publications/emep-eea-guidebook-2013 (accessed on 27 March 2024).
  10. Aatmeeyata; Kaul, D.S.; Sharma, M. Traffic generated non-exhaust particulate emissions from concrete pavement: A mass and particle size study for two-wheelers and small cars. Atmos. Environ. 2009, 43, 5691–5697. [Google Scholar] [CrossRef]
  11. Kim, G.; Lee, S. Characteristics of Tire Wear Particles Generated by a Tire Simulator under Various Driving Conditions. Environ. Sci. Technol. 2018, 52, 12153–12161. [Google Scholar] [CrossRef]
  12. Schläfle, S.; Unrau, H.J.; Gauterin, F. Influence of Longitudinal and Lateral Forces on the Emission of Tire–Road Particulate Matter and Its Size Distribution. Atmosphere 2023, 14, 1780. [Google Scholar] [CrossRef]
  13. Umweltbundesamt. Feinstaub-Belastung. Available online: https://www.umweltbundesamt.de/daten/luft/feinstaub-belastung#gesundheitliche-wirkungen (accessed on 20 November 2023).
  14. Fussell, J.C.; Franklin, M.; Green, D.C.; Gustafsson, M.; Harrison, R.M.; Hicks, W.; Kelly, F.J.; Kishta, F.; Miller, M.R.; Mudway, I.S.; et al. A Review of Road Traffic-Derived Non-Exhaust Particles: Emissions, Physicochemical Characteristics, Health Risks, and Mitigation Measures. Environ. Sci. Technol. 2022, 56, 6813–6835. [Google Scholar] [CrossRef]
  15. Le Maitre, O.; Süssner, M.; Zarak, C. Evaluation of Tyre Wear Performance; SAE Technical Paper: Warrendale, PA, USA, 1998. [Google Scholar] [CrossRef]
  16. Li, Y.; Zuo, S.; Lei, L.; Yang, X.; Wu, X. Analysis of impact factors of tire wear. J. Vib. Control 2012, 18, 833–840. [Google Scholar] [CrossRef]
  17. Wang, C.; Huang, H.; Chen, X.; Liu, J. The influence of the contact features on the tyre wear in steady-state conditions. Proc. Inst. Mech. Eng. Part D J. Automob. Eng. 2017, 231, 1326–1339. [Google Scholar] [CrossRef]
  18. Stojanovic, N.; Abdullah, O.I.; Grujic, I.; Boskovic, B. Particles formation due to the wear of tires and measures for the wear reduction: A review. Proc. Inst. Mech. Eng. Part D J. Automob. Eng. 2021, 236, 3075–3089. [Google Scholar] [CrossRef]
  19. Kupiainen, K.J.; Pirjola, L. Vehicle non-exhaust emissions from the tyre—road interface—effect of stud properties, traction sanding and resuspension. Atmos. Environ. 2011, 45, 4141–4146. [Google Scholar] [CrossRef]
  20. Foitzik, M.J.; Unrau, H.J.; Gauterin, F.; Dornhöfer, J.; Koch, T. Investigation of Ultra Fine Particulate Matter Emission of Rubber Tires. Wear 2018, 394–395, 87–95. [Google Scholar] [CrossRef]
  21. Feißel, T.; Hesse, D.; Ricciardi, V.; Schiele, M.; Augsburg, K. Novel approaches for measuring and predicting particulate emissions from automotive brakes and tires. In 12th International Munich Chassis Symposium 2021; Pfeffer, P.E., Ed.; Springer: Berlin/Heidelberg, Germany, 2022; pp. 708–728. [Google Scholar]
  22. Schläfle, S.; Unrau, H.J.; Gauterin, F. Influence of Load Condition, Tire Type, and Ambient Temperature on the Emission of Tire–Road Particulate Matter. Atmosphere 2023, 14, 1095. [Google Scholar] [CrossRef]
  23. ISO 9096:2017; Stationary Source Emissions—Manual Determination of Mass Concentration of Particulate Matter. ISO: Geneva, Switzerland, 2017.
  24. PALAS. Datasheet MonoDust 1500. Available online: https://www.palas.de/en/product/download/monodust1500/datasheet/pdf (accessed on 13 June 2023).
  25. PALAS. Datasheet Promo 2000. Available online: https://www.palas.de/en/product/download/promo2000/datasheet/pdf (accessed on 13 June 2023).
  26. Riehm, P.; Unrau, H.J.; Gauterin, F.; Torbrügge, S.; Wies, B. 3D brush model to predict longitudinal tyre characteristics. Veh. Syst. Dyn. 2019, 57, 17–43. [Google Scholar] [CrossRef]
  27. Umweltbundesamt. Feinstaubbelastung in Deutschland. Dessau-Roßlau, Germany. 2009. Available online: https://www.umweltbundesamt.de/publikationen/feinstaubbelastung-in-deutschland/ (accessed on 27 March 2024).
  28. Gnadler, R.; Unrau, H.J.; Fischlein, H.; Frey, M. Ermittlung von µ-Schlupf-Kurven an Pkw-Reifen; FAT-Schriftenreihe; FAT: Tokyo, Japan, 1995; p. 170. [Google Scholar]
  29. Zhang, M.; Unrau, H.J.; Gießler, M.; Gauterin, F. A detailed tire tread friction model considering dynamic friction states. Tribol. Int. 2024, 193, 109342. [Google Scholar] [CrossRef]
  30. Gieré, R.; Dietze, V. Tire-Abrasion Particles in the Environment. In Degradation of Elastomers in Practice, Experiments and Modeling; Advances in Polymer Science; Heinrich, G., Kipscholl, R., Stoček, R., Eds.; Springer: Berlin/Heidelberg, Germany, 2022. [Google Scholar] [CrossRef]
  31. Mattsson, K.; de Lima, J.A.; Wilkinson, T.; Järlskog, I.; Ekstrand, E.; Andersson-Sköld, Y.; Gustafsson, M.; Hassellöv, M. Tyre and road wear particles from source to sea. Microplastics Nanoplastics 2023, 3, 14. [Google Scholar] [CrossRef]
  32. Belkacem, I.; Helali, A.; Khardi, S.; Slimi, K. Investigations on vehicle non-exhaust particle emissions: Real-time measurements. Int. J. Environ. Sci. Technol. 2022, 19, 11749–11762. [Google Scholar] [CrossRef]
  33. Cao, J.; Huang, H.; Jiao, R.; Pei, J.; Xu, Y.; Rui, R.; Wang, Y. The study of wear particle emissions of soft rubber on rolling contact under braking conditions. Wear 2022, 506–507, 204431. [Google Scholar] [CrossRef]
  34. Beji, A.; Deboudt, K.; Khardi, S.; Muresan, B.; Lumière, L. Determinants of rear-of-wheel and tire-road wear particle emissions by light-duty vehicles using on-road and test track experiments. Atmos. Pollut. Res. 2021, 12, 278–291. [Google Scholar] [CrossRef]
  35. Tonegawa, Y.; Sasaki, S. Development of Tire-Wear Particle Emission Measurements for Passenger Vehicles. Emiss. Control Sci. Technol. 2021, 7, 56–62. [Google Scholar] [CrossRef]
  36. Williams, R.L.; Cadle, S.H. Characterization of Tire Emissions Using an Indoor Test Facility. Rubber Chem. Technol. 1978, 51, 7–25. [Google Scholar] [CrossRef]
  37. Rauterberg-Wulff, A. Beitrag des Reifen- und Bremsenabriebs zur Rußemission an Straßen; Fortschritt-Berichte VDI: Düsseldorf, Germany, 1998. [Google Scholar]
  38. Kupiainen, K.J.; Tervahattu, H.; Räisänen, M.; Mäkelä, T.; Aurela, M.; Hillamo, R. Size and composition of airborne particles from pavement wear, tires, and traction sanding. Environ. Sci. Technol. 2005, 39, 699–706. [Google Scholar] [CrossRef]
  39. Sjödin, Å.; Ferm, M.; Björk, A.; Rahmberg, M.; Gudmundsson, A.; Swietlicki, E.; Johansson, C.; Gustafsson, M.; Blomqvist, G. Wear Particles from Road Traffic: A Field, Laboratory and Modelling Study: Final Report; IVL Svenska Miljöinstitutet: Stockholm, Sweden, 2010. [Google Scholar]
  40. Panko, J.M.; Chu, J.; Kreider, M.L.; Unice, K.M. Measurement of airborne concentrations of tire and road wear particles in urban and rural areas of France, Japan, and the United States. Atmos. Environ. 2013, 72, 192–199. [Google Scholar] [CrossRef]
Figure 1. Views of the suction hood. For better visibility of the wheel and the remaining slit between the hood and the road surface, the right side wall of the hood (in driving direction) is not shown in (a). The assembled hood as well as the direct connection to the extraction system can be seen in (b).
Atmosphere 15 00502 g001
Figure 2. General structure of all test series consisting of m test passages with n individual settings (test blocks) for the parameter under investigation, each of which comprised four single test runs.
Atmosphere 15 00502 g002
Figure 3. Influence of vertical load on the PM emission at different adhesion utilizations in the longitudinal direction: (a) braking condition and (b) driving condition. The emission factors are obtained for an SRT value of 60.
Atmosphere 15 00502 g003
Figure 4. Influence of vertical load on the particle number distribution at different load conditions.
Atmosphere 15 00502 g004
Figure 5. Influence of tire inflation pressure on the emission at different load conditions. The emission factors are obtained for an SRT value of 60.
Atmosphere 15 00502 g005
Figure 6. Influence of tire inflation pressure on the particle number distribution at different load conditions.
Atmosphere 15 00502 g006
Figure 7. Influence of driving speed on the emission at different lateral forces. The emission factors are obtained for an SRT value of 60.
Atmosphere 15 00502 g007
Figure 8. Influence of driving speed on the particle number distribution at different load conditions.
Atmosphere 15 00502 g008
Table 1. Varied and constant parameters with their respective values. The superscript Roman numerals indicate the longitudinal forces that were tested in combination with the corresponding vertical load.
Test Series
Vertical Load
Test Series
Infl. Pressure
Test Series
Driving Speed
Section Section 3.1Section 3.2Section 3.3
Vertical load
F z in kN
3.25 (I), 4.875 (II),
6.5 (III), 8.125 (IV)
6.56.5
Infl. pressure
p i in bar
2.62.0, 2.6, 3.22.6
Driving speed
v d in km / h
808030, 50, 80, 120
Long. force
F x in kN
(I): 0, ±0.5, ±1, ±1.5, ±2       
(II): 0, ±0.75, ±1.5, ±2.25, ±3
(III): 0, ±1, ±2, ±3, ±4               
(IV): 0, ±1.25, ±2.5, ±3.75, ±5  
0, ±2, ±4
Lateral force
F y in kN
0, ±2, ±40, ±1, ±2, ±3, ±4
Adh. utilization
F x / F z or F y / F z
0, ±0.155, ±0.31,
±0.465, ±0.62
0, ±0.31, ±0.620, ±0.155, ±0.31,
±0.465, ±0.62
Camber angle
γ in °
0
Ambient temp.
T a in °C
25
Disclaimer/Publisher’s Note: The statements, opinions and data contained in all publications are solely those of the individual author(s) and contributor(s) and not of MDPI and/or the editor(s). MDPI and/or the editor(s) disclaim responsibility for any injury to people or property resulting from any ideas, methods, instructions or products referred to in the content.

