Article

A Fuzzy-Based Analysis of Air Particle Pollution Data: An Index IMC for Magnetic Biomonitoring

by
Mauro A. E. Chaparro
1,
Marcos A. E. Chaparro
2,3,* and
Daniela A. Molinari
1
1
Centro Marplatense de Investigaciones Matemáticas (CEMIM, UNMDP-CIC, CONICET), Diagonal J. B. Alberdi 2695, Mar del Plata 7600, Argentina
2
Centro de Investigaciones en Física e Ingeniería del Centro de la Provincia de Buenos Aires (CIFICEN), UNCPBA-CICPBA-CONICET, Pinto 399, Tandil 7000, Argentina
3
IFAS, Facultad de Ciencias Exactas, Universidad Nacional del Centro de la Provincia de Buenos Aires (UNCPBA), Pinto 399, Tandil 7000, Argentina
*
Author to whom correspondence should be addressed.
Atmosphere 2024, 15(4), 435; https://doi.org/10.3390/atmos15040435
Submission received: 15 February 2024 / Revised: 15 March 2024 / Accepted: 27 March 2024 / Published: 30 March 2024
(This article belongs to the Special Issue Bioindicators in Air Pollution Monitoring)

Abstract

:
Airborne magnetic particles may be harmful because of their composition, morphology, and association with potentially toxic elements that may be observed through relationships between magnetic parameters and pollution indices, such as the Tomlinson pollution load index (PLI). We present a fuzzy-based analysis of magnetic biomonitoring data from four Latin American cities, which allows us to construct a magnetic index of contamination (IMC). This IMC uses four magnetic parameters, i.e., magnetic susceptibility χ, saturation isothermal remanent magnetization SIRM, coercivity of remanence Hcr, and SIRM/χ, and proposes summarizing the information to assess an area based exclusively on magnetic parameters more easily. The fuzzy inference system membership functions are built from the standardization of the data to become independent of the values. The proposed IMC is calculated using the baseline values for each case study, similar to the PLI. The highest IMC values were obtained in sites close to industrial areas, and in contrast, the lowest ones were observed in residential areas far from avenues or highways. The linear regression model between modeled IMC and PLI data yielded robust correlations of R2 > 0.85. The IMC is proposed as a complementary tool for air particle pollution and is a cost-effective magnetic approach for monitoring areas.

1. Introduction

The increase in urbanization levels has led to a reduction in the quality of air. This quality is impacted by gases and the contribution of particulate matter (PM) generated by several anthropogenic activities, such as industrial processes and vehicular traffic. According to the World Health Organization [1], air pollutants with the strongest evidence for public health concern include particulate matter, carbon monoxide, ozone, nitrogen dioxide, and sulfur dioxide. PM is one of the concerning pollutants in cities considered for air quality assessment. Among recent studies of air contamination in urban areas, Ref. [2] reported the spatial distribution of metals associated with oxidative stress and urban dust’s oxidative potential, Ref. [3] studied the metal concentration of PM during a decade, and Ref. [4] reviewed metals contamination in the urban surface of forty-one different countries around the world.
Magnetic biomonitoring (MB), i.e., using biomonitors and magnetic measurements for air particle pollution monitoring [5], is an emerging methodology for studying PM pollution problems. Airborne magnetic particles (AMP) may be related to morbidity from respiratory, cardiovascular, and neurodegenerative diseases [6]. Recent studies on magnetic PM10 and PM2.5 revealed that they cause health hazards in respiratory tracts and reach vital human organs such as the lungs, heart [7], and brain [8]. This fine magnetic fraction comprises the ubiquitous anthropogenic magnetite and adsorbed potentially toxic elements (PTE), which may cause genotoxic and mutagenic impacts. Several studies proved a relationship between PTE and magnetic parameters in soils [9], sediments [10,11], biomonitors [12,13,14], and atmospheric dust [15,16,17]. This association between the AMP and PTE in magnetic fractions of PM generated from industrial or vehicle emission was shown by [18,19,20]. It is worth noting that these studies indicate a relationship but have not been generalized so far. For example, Cr and Cd show positive correlations with magnetic susceptibility χ (or κ) and the anhysteretic remanent magnetization ARM (~0.7), but Ba displays a negative correlation with anhysteretic remanent magnetization ARM (~0.56). Only Zn and Pb show correlations with the anhysteretic ratio κARM/κ (or χARM/χ) [19]. Since the 1990s, various studies have shown the capacity of some ecological indicators (needles, tree leaves, tree ring cores, tree bark, mosses, and lichens) to suit as passive dust collectors [21] and, therefore, for magnetic biomonitoring in areas of interest [22,23]. Needles [24], tree leaves [25,26], tree barks [27,28], lichens [13,29,30], and Tillandsia spp. [31,32,33] have been used in an integrated way for biomonitoring air quality. The diagnosis of a study area is assessed using the MB approach through parameters related to magnetic concentration, magnetic particle size, and magnetic mineralogy.
From a mathematical modeling point of view, the “response variable” that describes the environment status or condition is a multivariate variable [34,35]. That is, the diagnosis is seen as a multivariate variable, which is related to magnetic properties. Previous works [34] and references therein have determined a relationship between magnetic properties (or magnetic variables) and the pollution load index [36]. They found that sites with the highest PLI values evidenced the highest magnetic concentration and coarser magnetic particles. In contrast, sites with the lowest PLI values only evidenced the lowest magnetic concentration values and material with paramagnetic characteristics. Because the PLI is defined from the PTE concentration, this index cannot specify particle sizes, whether the material is PM1, PM2.5, or PM10. Nevertheless, the MB approach makes it possible to determine the AMP’s properties, such as the size, concentration, and composition.
This study proposes a novel magnetic index of pollution (IMC) for magnetic monitoring studies. The hypothesis of this model is as follows: “If a site’s clean magnetic signature (CMS) is defined as the magnetic values measured in a clean or control site within the study area, then this CMS is perturbed when pollution sources contribute to AMP emissions in this site”.
The objective of this work is “to build an index that summarizes the magnetic information to easily understand the site’s interest status based exclusively on magnetic parameters”.
The IMC is a fuzzy-based model designed following the stated objective. It was developed using magnetic parameters and their observed relationship with the PLI through fuzzy logic and fuzzy number arithmetic. Additionally, the IMC relies solely on magnetic parameters, avoiding slow laboratory processing and the costs of PTE determinations.

2. Materials and Methods

2.1. Datasets

The IMC was developed based on four urban magnetic biomonitoring datasets (n = 472) (Table 1, Figure 1), which comprise biomonitors such as Tillandsia sp., lichens, and tree barks from Santiago de Querétaro (Mexico, [31]), Valle de Aburrá (Colombia, [32]), Tandil (Argentina, [13,23]), and Mar del Plata (Argentina, [28]). These diverse locations provide a range of environmental conditions and sources of pollution, enhancing the robustness and applicability of the IMC model.

2.2. The Magnetic Index of Pollution

2.2.1. Fuzzy Inference System in a Nutshell

The fundamental principle of fuzzy logic is rooted in recognizing that “all things admit degrees of vagueness” [37]. Within the framework of a discursive universe X, a fuzzy set F is defined as a set of ordered pairs F = {(x, μF(x))}, where x belongs to X and μF(x) is a numerical value between 0 and 1 representing the degree of membership of x in F. A fuzzy inference system (FIS) comprises three essential components: (1) the input processor, (2) the fuzzy rule base-inference engine, and (3) the defuzzification process.
The input processor (1) is the partitioning of each variable into fuzzy sets. This step allows for the representation of expert knowledge through the rule base and fuzzy inference engine (2), which describe the problem and its implications in terms of linguistic rules. These rules typically take the form of “IF this THEN that”. The inference process employs a generalized form of modus ponens, where observation A* is considered similar to A, and based on the rule “If x is A→y is B”, the conclusion B* will resemble B. This approach addresses the inference problem posed by these rules.
The output of the fuzzy inference process is a new fuzzy set, which necessitates a defuzzification step (3). Various methodologies can be employed for this process. In this study, the fuzzy set mean is calculated by interval arithmetic.

2.2.2. The Model

In this subsection, the selection and construction methods of the input variables and output variables are described. As mentioned, the magnetic features (concentration, mineralogy, and magnetic particle size) were used as the input variables, i.e., mass-specific magnetic susceptibility (χ), saturation isothermal remanent magnetization (SIRM), the coercivity of remanence (Hcr), and the ratio SIRM/χ.
The parameters of the membership functions were determined using the entire dataset. A relative standardization process was performed for the clean samples at each study site to ensure comparability. This standardization process is expressed as follows:
n e w m i , S I T E ( χ i , S I R M i , H c r i , S I R M χ i ) = ( ln χ i χ b a s e , ln S I R M i S I R M b a s e , ln H c r i H c r b a s e , ln S I R M χ i S I R M χ b a s e )
Here, m i , S I T E χ i , S I R M i , H c r i , S I R M χ i represents the i-th value in the study site (Santiago de Querétaro, Valle de Aburrá, Tandil, or Mar del Plata). The subscript “base” corresponds to the CMS value of each study site. Therefore, the standardized values of the samples indicate the degree of deviation from the clean site. The reference value (0,0,0,0) corresponds to the CMS site. The corresponding CMS value for each study case in Latin America was determined from biomonitor samples collected in control areas with minimum or no direct pollution exposition as reported by the authors [13,28,31,32]. Samples were collected at a height of 1.5 m above the ground to avoid the influence of re-suspended soil particles. Individuals were also carefully collected using latex gloves and non-magnetic tools to avoid contamination, stored in paper bags stored in the laboratory, and dried at 40 °C for 24 h. Control areas were selected far from urban settlements, located in parks and forest areas.
The output variable is the IMC index, a fuzzy number obtained through fuzzy number arithmetic. This output has ten levels, where the lowest value is “0”, corresponding to the control site, and the highest level is “10”, i.e., the highest level of magnetic pollution (Figure 2).

Input Variables—Selection

In constructing the FIS model, the selection of input variables focused on magnetic properties associated with concentration, mineralogy, and magnetic particle size. The variable representing “concentration” refers to the abundance of magnetic minerals (e.g., Fe-rich minerals). χ and SIRM were considered input variables for this magnetic concentration. Although χ is a magnetic parameter accounting for all magnetic materials (i.e., dia-, para- and ferromagnetic materials, [38]), the SIRM only accounts for ferromagnetic materials.
Various magnetic parameters and ratios can describe different magnetic properties, such as magnetic mineralogy type (e.g., Hcr, and field coercivity Hc) and grain size (SIRM/χ, and anhysteretic ratios χARM/χ, and ARM/SIRM). Among these, Hcr and the SIRM/χ were selected for this study. The Hcr allows for identifying the dominant magnetic mineralogy present in the sample [39]. In particular, Hcr values are associated with the contribution to the magnetic signal of high- and low-coercivity materials. The SIRM/χ can be a grain size-sensitive parameter for materials with similar magnetic mineralogy types [40]; it provides insights into the AMP’s dominant ferromagnetic particle size regarding micron iron oxides. Finer ferrimagnetic particles display higher SIRM/χ values and, in contrast, lower values with increasing grain sizes for (titano)magnetite [39].
By incorporating these selected input variables into the FIS model, the essential magnetic properties related to the airborne magnetic particles’ concentration, mineralogy, and particle size can be effectively captured.

Input Variables—Construction of Membership Functions. Fuzzy c-Means and Membership Functions

The triangular membership functions for all variables were used (Figure 2). This type of function allows us to quantify the empirical certainty accurately. In cases where deviation from the exact empirical value occurs, an approach based on a linear model is used to represent the associated uncertainty. The function is defined by Equation (2):
f x ; a , b , c = m a x m i n x a b a , c x c b , 0
For each input variable, the parameters of the triangular membership functions were determined through fuzzy c-means clustering analysis (FCM) [37]. In the FCM methodology, each sample is assigned a membership value concerning all clusters.

Fuzzy Number as the Response of the IMC Model

Empirical knowledge was used to determine the output value of IMC for each unique rule. For this, a subset of one hundred and four data (n = 104) with PLI values was considered for the analysis. Therefore, if a sample recorded a PLI value = 1 (control site), the corresponding IMC output function is the trapezoidal membership (0,0,0,0).
Fuzzy inference uses the min/max norms as the associated operations. The t-conorms were utilized to calculate the response interval of the model or the IMC value.
Let A and B represent two fuzzy sets, with a ∈ A and b ∈ B.
T-norm:
T M a , b = m i n a , b   ( o p e r a t i o n   a n d   o r   i n t e r s e c t i o n   i n   f u z z y   s e t s )
S-conorm:
S M a , b = m a x a , b     ( o p e r a t i o n   o r   o r   u n i o n   i n   f u z z y   s e t s )
Fuzzy implication:
μ A B x , y = min μ A x , μ B y
In the given scenario, it is possible for an input sample to activate multiple rules simultaneously. As a result, the corresponding number of fuzzy sets are generated. The IMC response is determined using a fuzzy average calculation that considers all activated rules. The resulting value is represented as a fuzzy number, which is defined by Equation (3).
I M C s a m p ¯ = 1 # I i ϵ I X i i n f , X i C i n f , X i C S U P , X i S U P
where I is the amount of set of active rules and X i i n f , X i C i n f , X i C S U P , X i S U P is the parameter of the fuzzy number i ϵ I . The superscripts inf, Cinf, CSUP, and SUP are the four points that define the trapezoidal fuzzy number.

The Base Rules

The membership values obtained from the FCM analysis were utilized to establish the base rule for the model. Each sample’s membership values for different clusters were recorded in a matrix format as shown in the following example,
m i , S I T E χ i , S I M R i , H c r i , S I R M X i = 0.89 0.10 0.01 0.00 0.04 0.73 0.03 0.20 0.61 0.10 0.02 0.40 0.30 0.30 0.07 0.20 C l u s t e r   o f   X C l u s t e r   o f   S I M R C l u s t e r   o f   H c r C l u s t e r   o f   S I R M X
where the elements represent the membership values and the rows and columns correspond to input variables and clusters, respectively.
The maximum membership values for each input variable were selected to construct the rule’s premise for a given sample. For the example, consider a sample with the premise values of 1, 2, 1, and 2 (matrix elements 11, 22, 31, and 42, see values in bold in the matrix). In linguistic terms, this model describes a sample with membership to the categories of
  • Low perturbation of concentration χ (C1, i.e., the first row).
  • Medium perturbation of ferromagnetic concentration SIRM” (C2, i.e., the second row).
  • Low perturbation of coercivity Hcr” (C1, the third row).
  • Medium perturbation of particle size SIRM/χ (C2, the fourth row).
Furthermore, to determine the consequent fuzzy set, the PLI values of the samples were used for the ten fuzzy sets of IMC.

2.3. An Indicator of the Accuracy of the Model

For model selection, the uncertainty of the approximation is evaluated. The amplitude of the IMC (or uncertainty) is considered to evaluate the estimation accuracy. For this, a modification of the classic “coefficient of determination R 2 = 1 i = 1 n x ^ i x i 2 i = 1 n x i x ¯ 2 is proposed, in this work, in Equation (4),
I m o d = 1 i = 1 n X ¯ ^ i x i 2 1 + c i 1 + n max X i m i n X i 2
where X i ¯ = X i i n f + X i C i n f + X i C S U P + X i S U P 4 , x i = P L I i and
c i = d ( X i C i n f , X i C S U P ) + m a x d x i , X i i n f , d ( x i , X i S U P ) i f x i X i i n f , X i S U P d ( X i C i n f , X i C S U P ) i f x i X i i n f , X i S U P
d a , b = a b
Therefore, the interval length is punished with the “ci” value. In other words, the “ci” value assesses how the model is penalized when the fuzzy number does not contain the xi point; hence, a lower Imod value is due to a higher value in the numerator of Equation (4).
The selected model has IMCs with the shortest d X i C i n f , X i C S U P .

2.4. Model Selection

To select the model, a range of different architectures was proposed by varying the number of membership functions for each input variable. The partitioning of the output variable consisted of ten functions.
Each input variable was divided into 3, 4, 5, 6, and 7 groups. For each partition, the parameters of the membership functions associated with the IMC membership functions were determined for each variable. Thus, the minimal model configuration was defined as [3 3 3 3 10], while the maximal model configuration was specified as [7 7 7 7 10]. As a result, six hundred and twenty-five different models have been constructed autonomously, arising from different combining fuzzy partitions. The Imod value (Equation (4), Section 2.3), i.e., an indicator of the accuracy of the model, was calculated for each one, and the selected model was determined based on the highest observed value.

3. Results

In Table 1, the clean or CMS values for each site are shown. These sites were previously selected for each study case by the researchers. They are typically situated in remote areas, away from urban centers, with low or no vehicular or industrial intervention.
The concentration values, i.e., χ (4.3–23.9 × 10⁻⁸ m3 kg−1) and SIRM (0.7–4.0 × 10⁻³ Am2 kg−1), vary up to 4 times between sites. However, it is essential to note that there are no important differences in their magnetic mineral characteristics, i.e., Hcr and SIRM/χ parameters, between these sites. These differences could be attributed to the coincidence of emission sources of particulate matter and the resuspended soil particles in the different zones, while the variation in magnetic material concentration may be a characteristic related to the different geographical zones, meteorological conditions, and the specific species’ ability to accumulate AMP [5].

3.1. The Selected Model

As mentioned in Section 2.4, the selected model was obtained from calculating and evaluating 625 possible models. The selected model was built using [4 6 4 3 → 10] partitions (Imod = 0.8142) for the input variables χ, SIRM, Hcr, and SIRM/χ, respectively. The specific parameter values for all magnetic variables are detailed in Table 2. These values were obtained using the FCM method and fuzzy partitions as part of the analysis process.
It is necessary to mention that with this membership function architecture, the rule corresponding to the CMS site is given by 1 1 2 3 or 2 2 3 4. This rule is because each membership function contains “0”, which is identified as a null disturbance in the reference value. It should be noted that negative values imply a decrease in the reference value.

3.2. Rules Base

The rule base associated with the selected model has 2880 potential rules. These rules were generated autonomously based on the results of the FCM analysis. Subsequently, an expert panel conducted a detailed assessment of each rule, considering its applicability and relevance within the environmental magnetism approach. This detailed evaluation process involved identifying and merging redundant rules, eliminating those that lacked meaningful interpretation, and removing any duplicated entries. As a result of this procedure, the original set of rules was substantially reduced to forty-nine, as presented in Table 3.

3.3. Study Sites and Simulations

3.3.1. Dataset with PLI of Reference

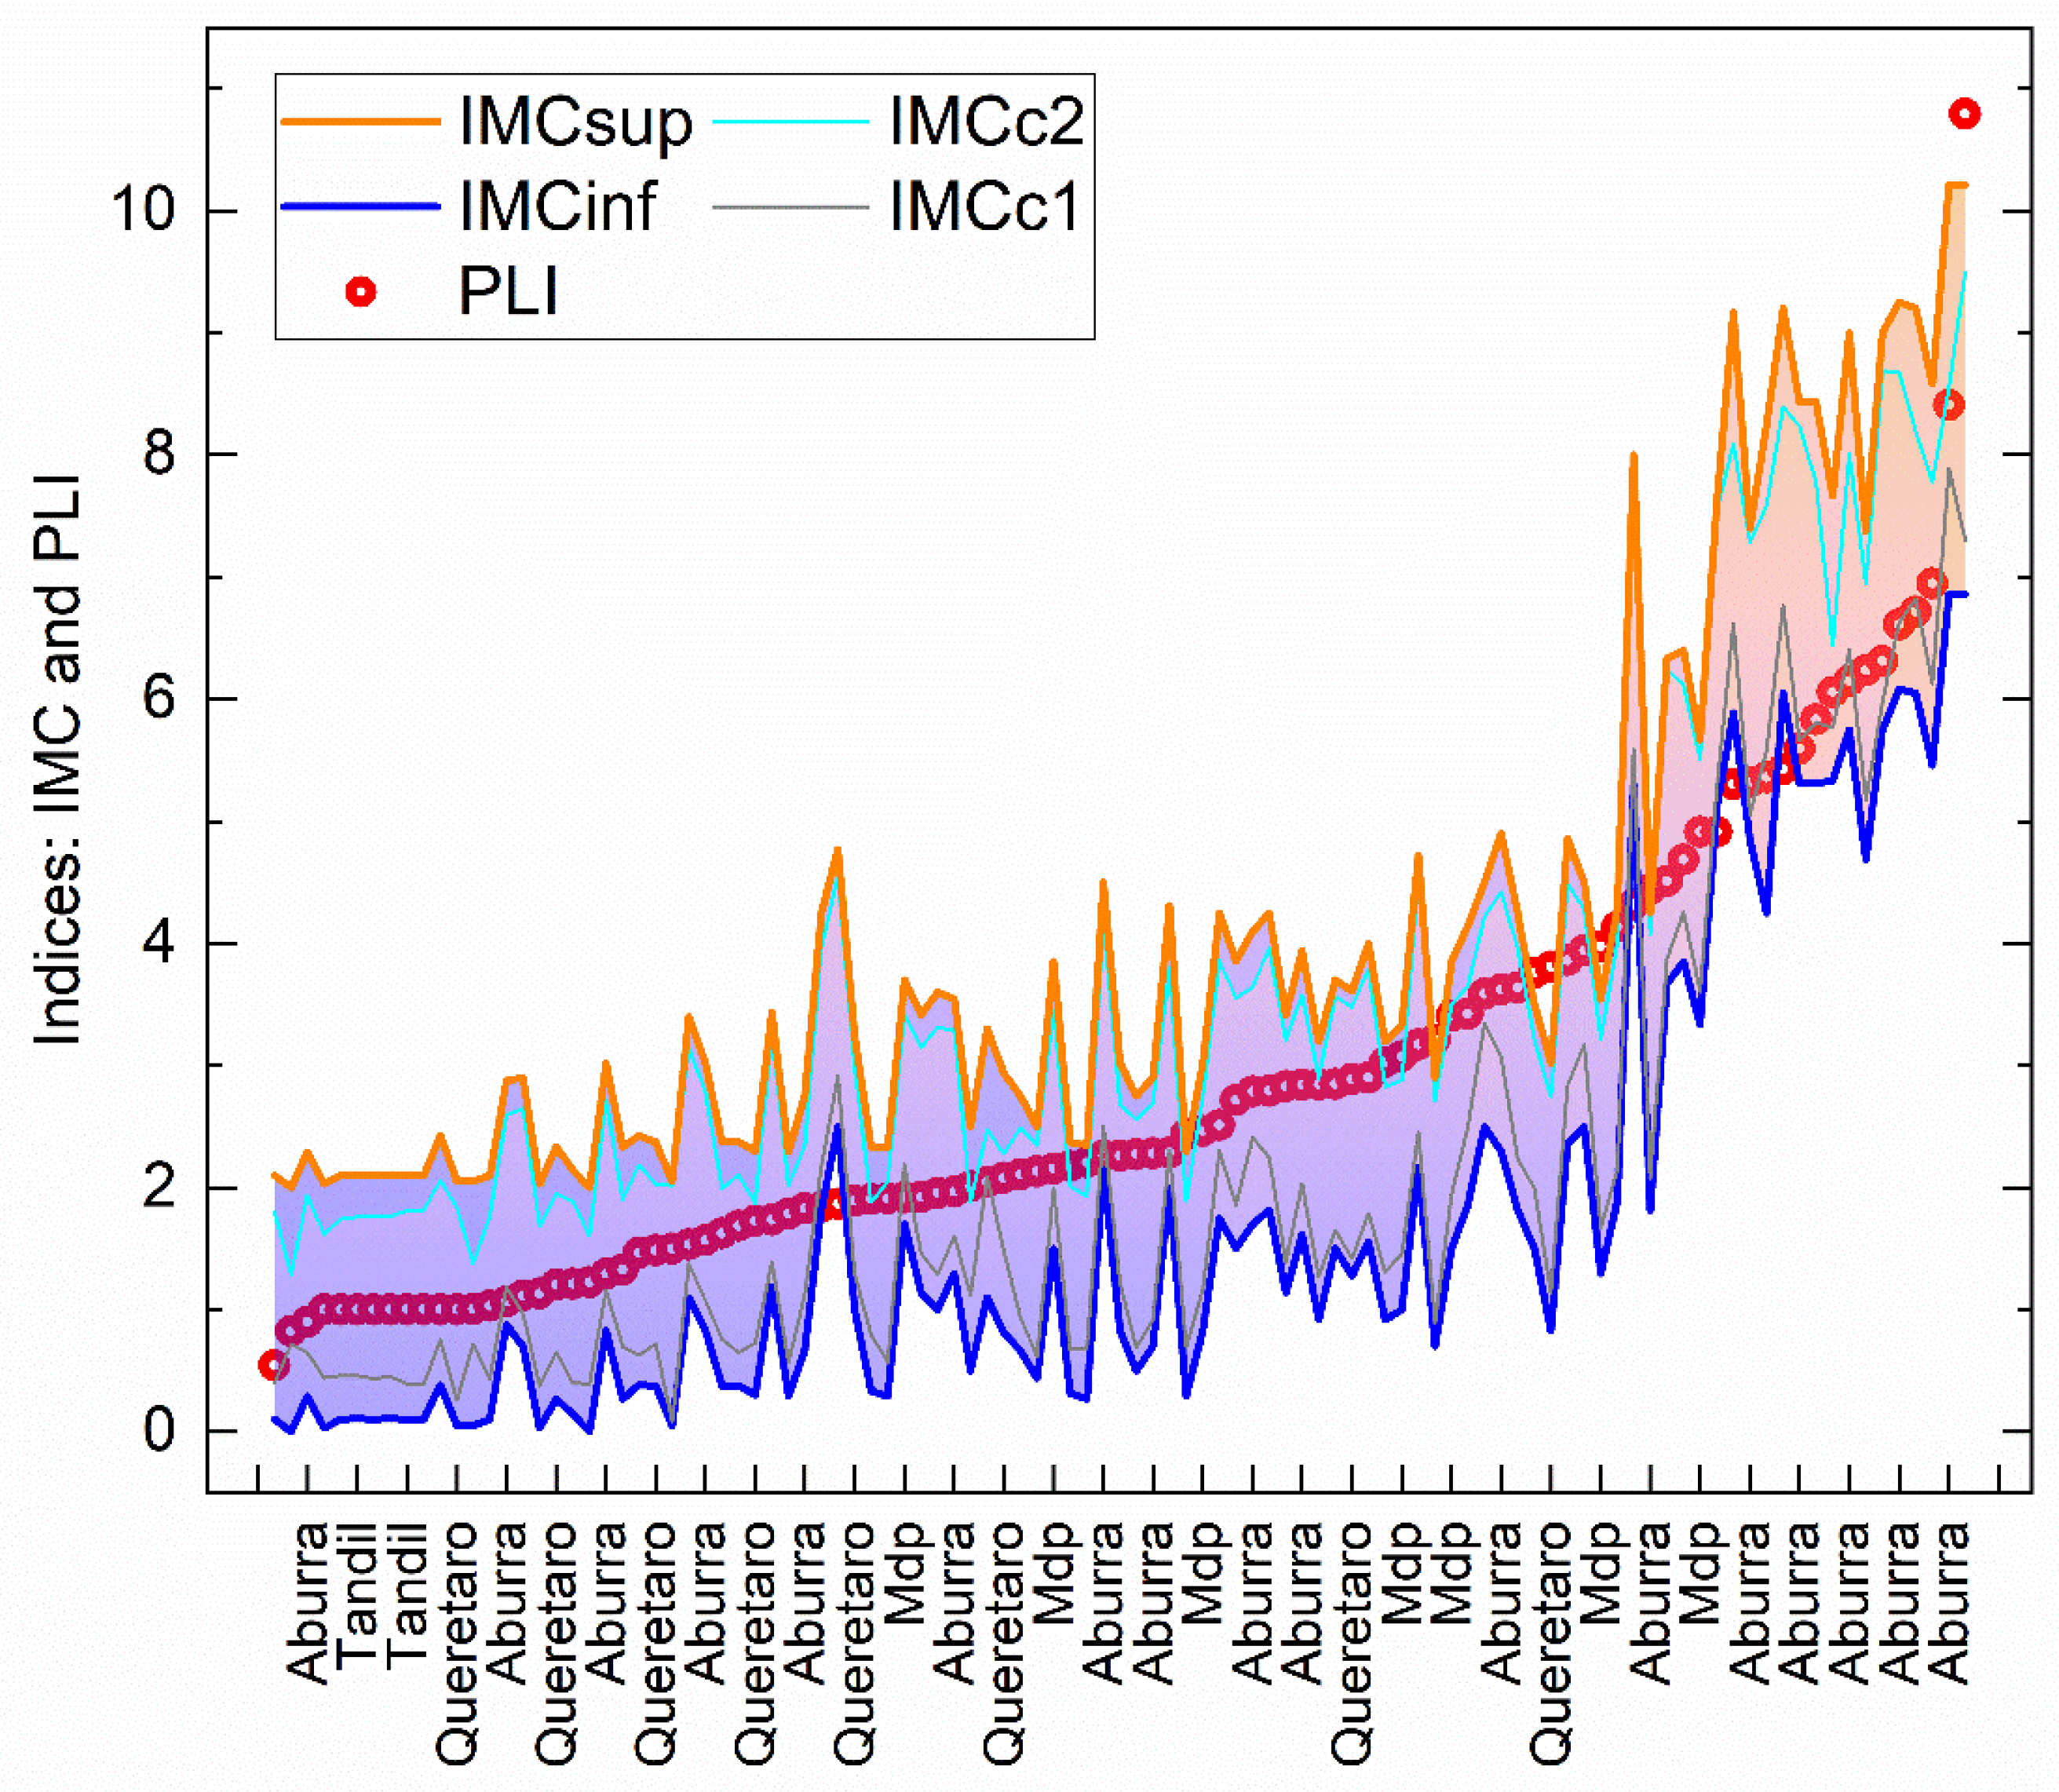
The resulting IMC values of the dataset with PLI (n = 103), obtained using the final model, are presented in Figure 3. A considerable proportion of the PLI samples, 91 out of 103 data points, is contained within the external interval defined by IMCinf and IMCsup. Moreover, 73 out of 103 data points are within the central interval, delimited by the highest membership values of IMCc1 and IMCc2.
A linear trend between the modeled IMC values and the corresponding PLI values is observed in Figure 4. As a result, a linear regression model was constructed to establish the relationship among the set values of IMCinf ( I M C i n f = 1.06 × P L I + 0.70 ), IMCc1 ( I M C c 1 = 1.12 × P L I + 0.42 ), IMCc2 ( I M C c 2 = 1.16 × P L I + 1.08 ), and IMCsup ( I M C s u p = 1.27 × P L I 1.18 ). Notably, all sets yielded R2 > 0.85, indicating a robust correlation between the variables and fulfilling the assumptions of normality in the errors.

3.3.2. Estimation of Value IMC without PLI of Reference

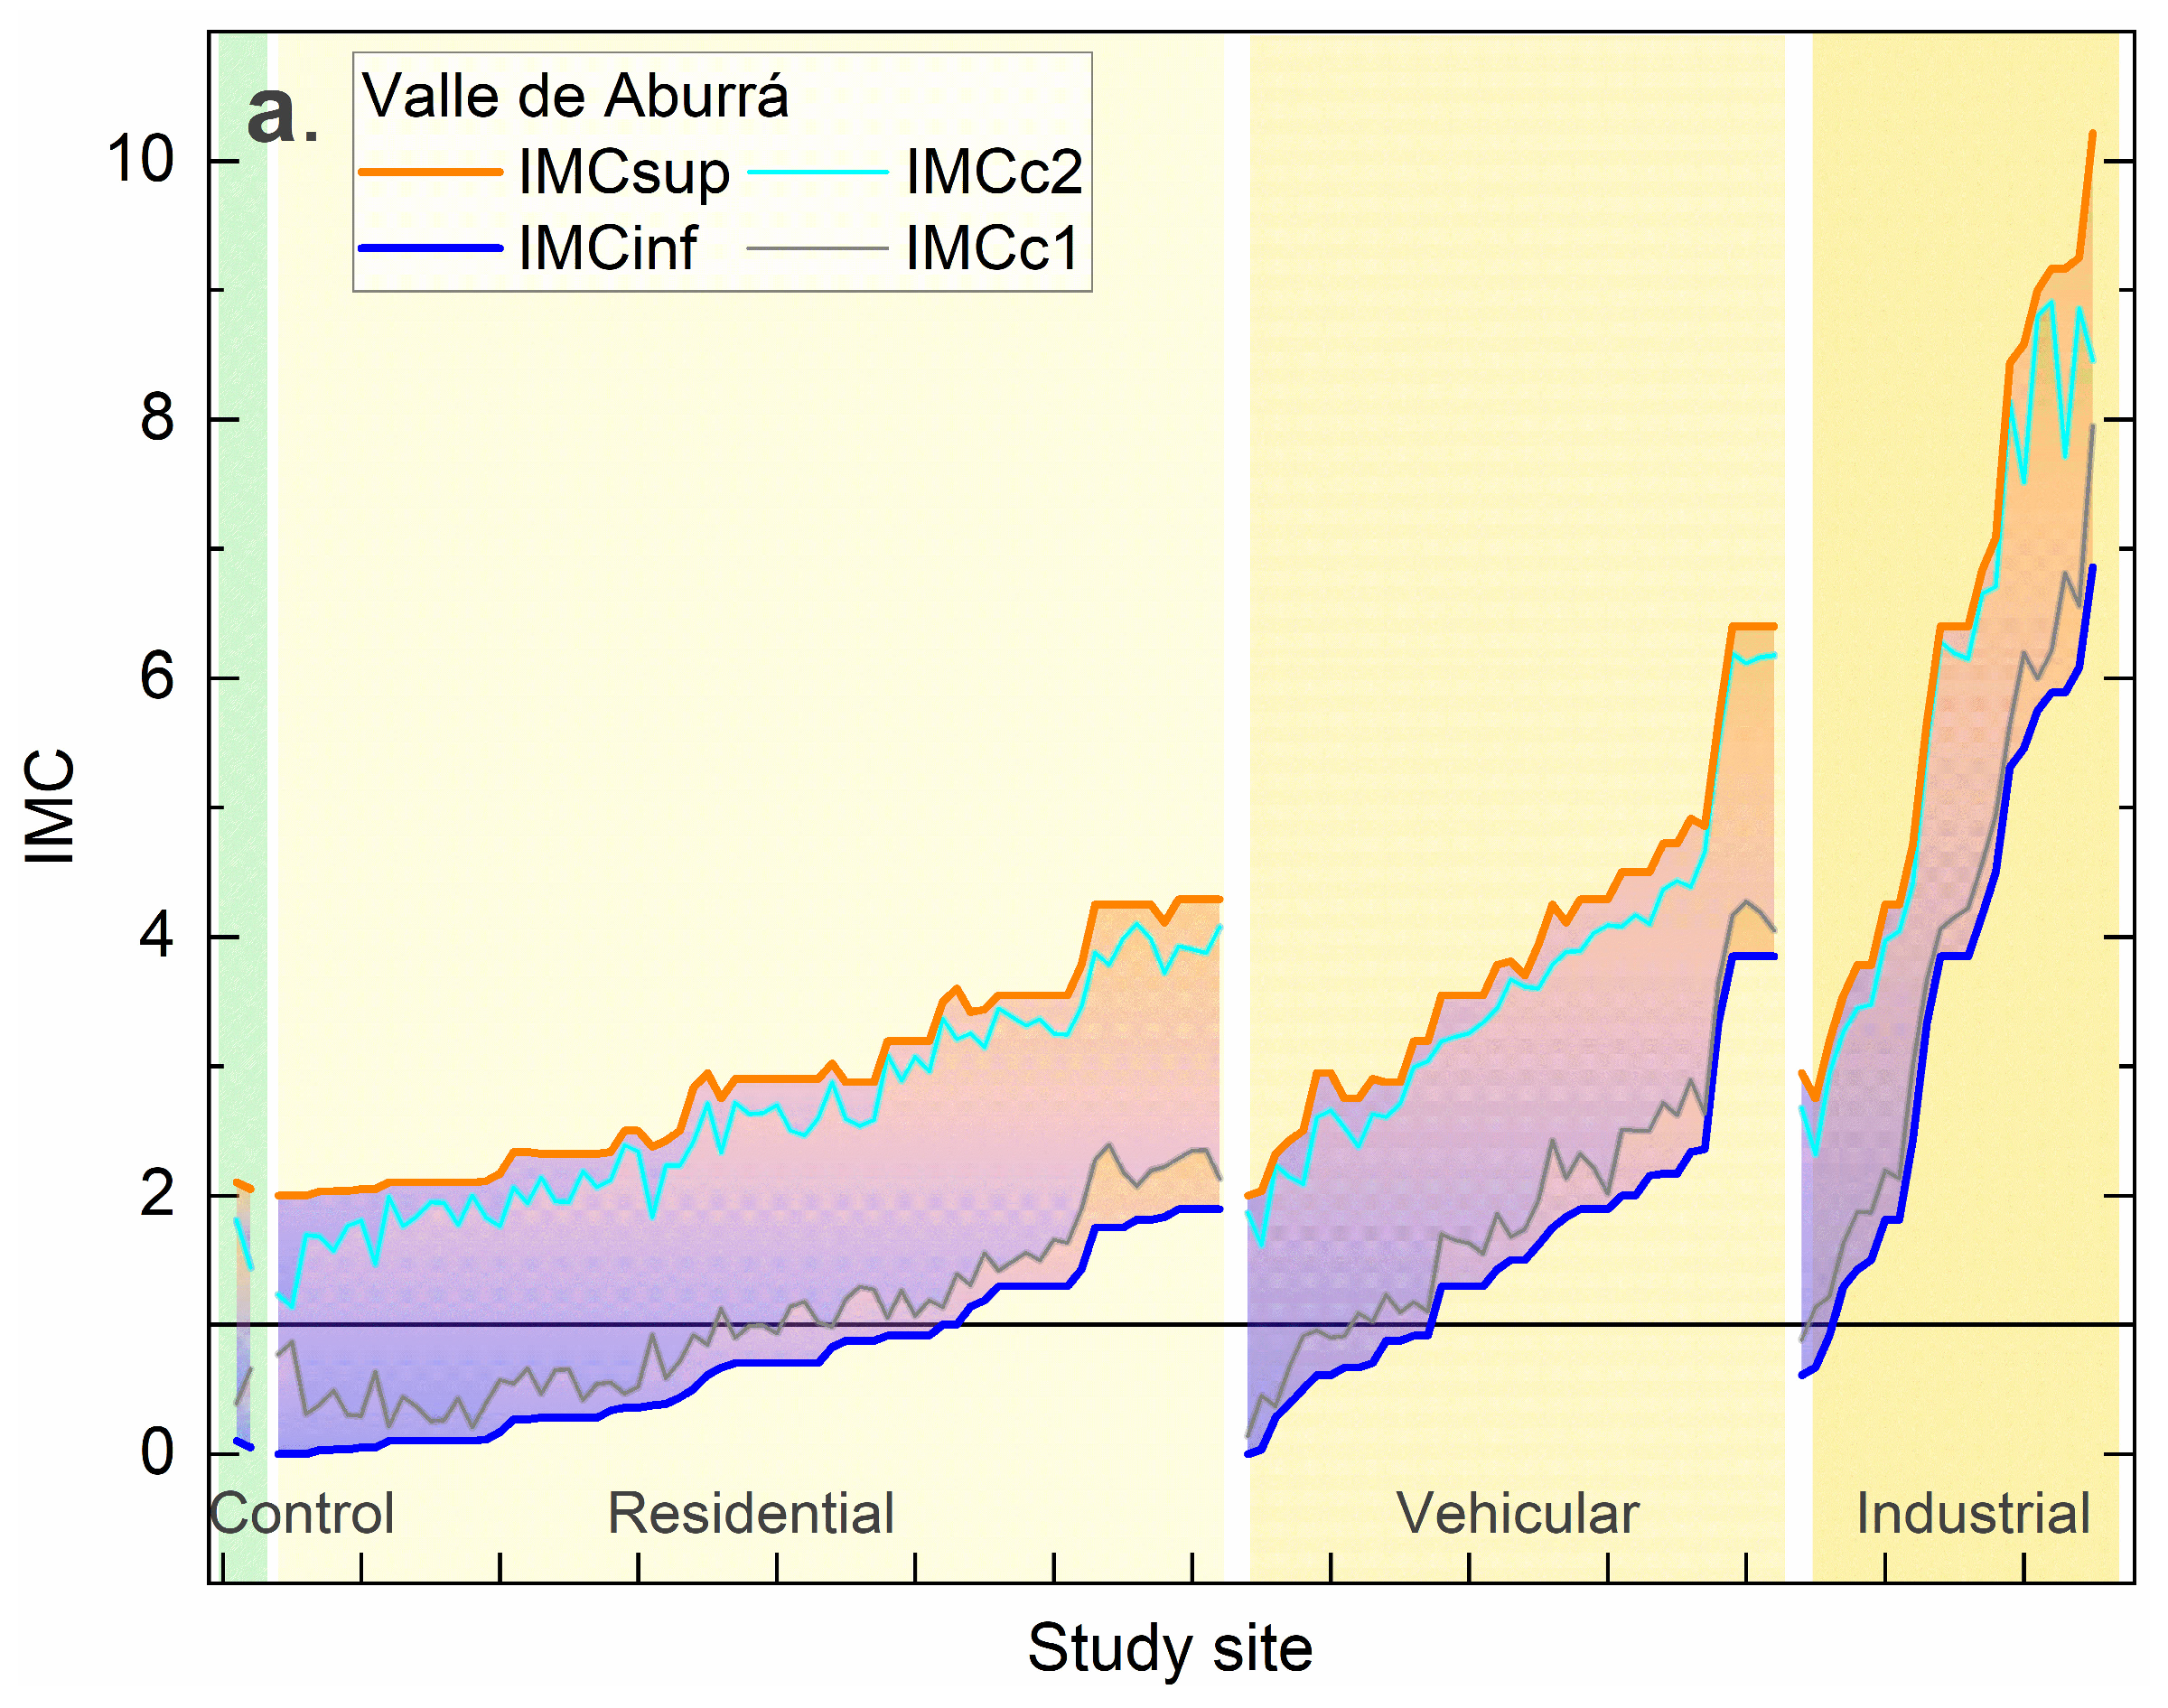
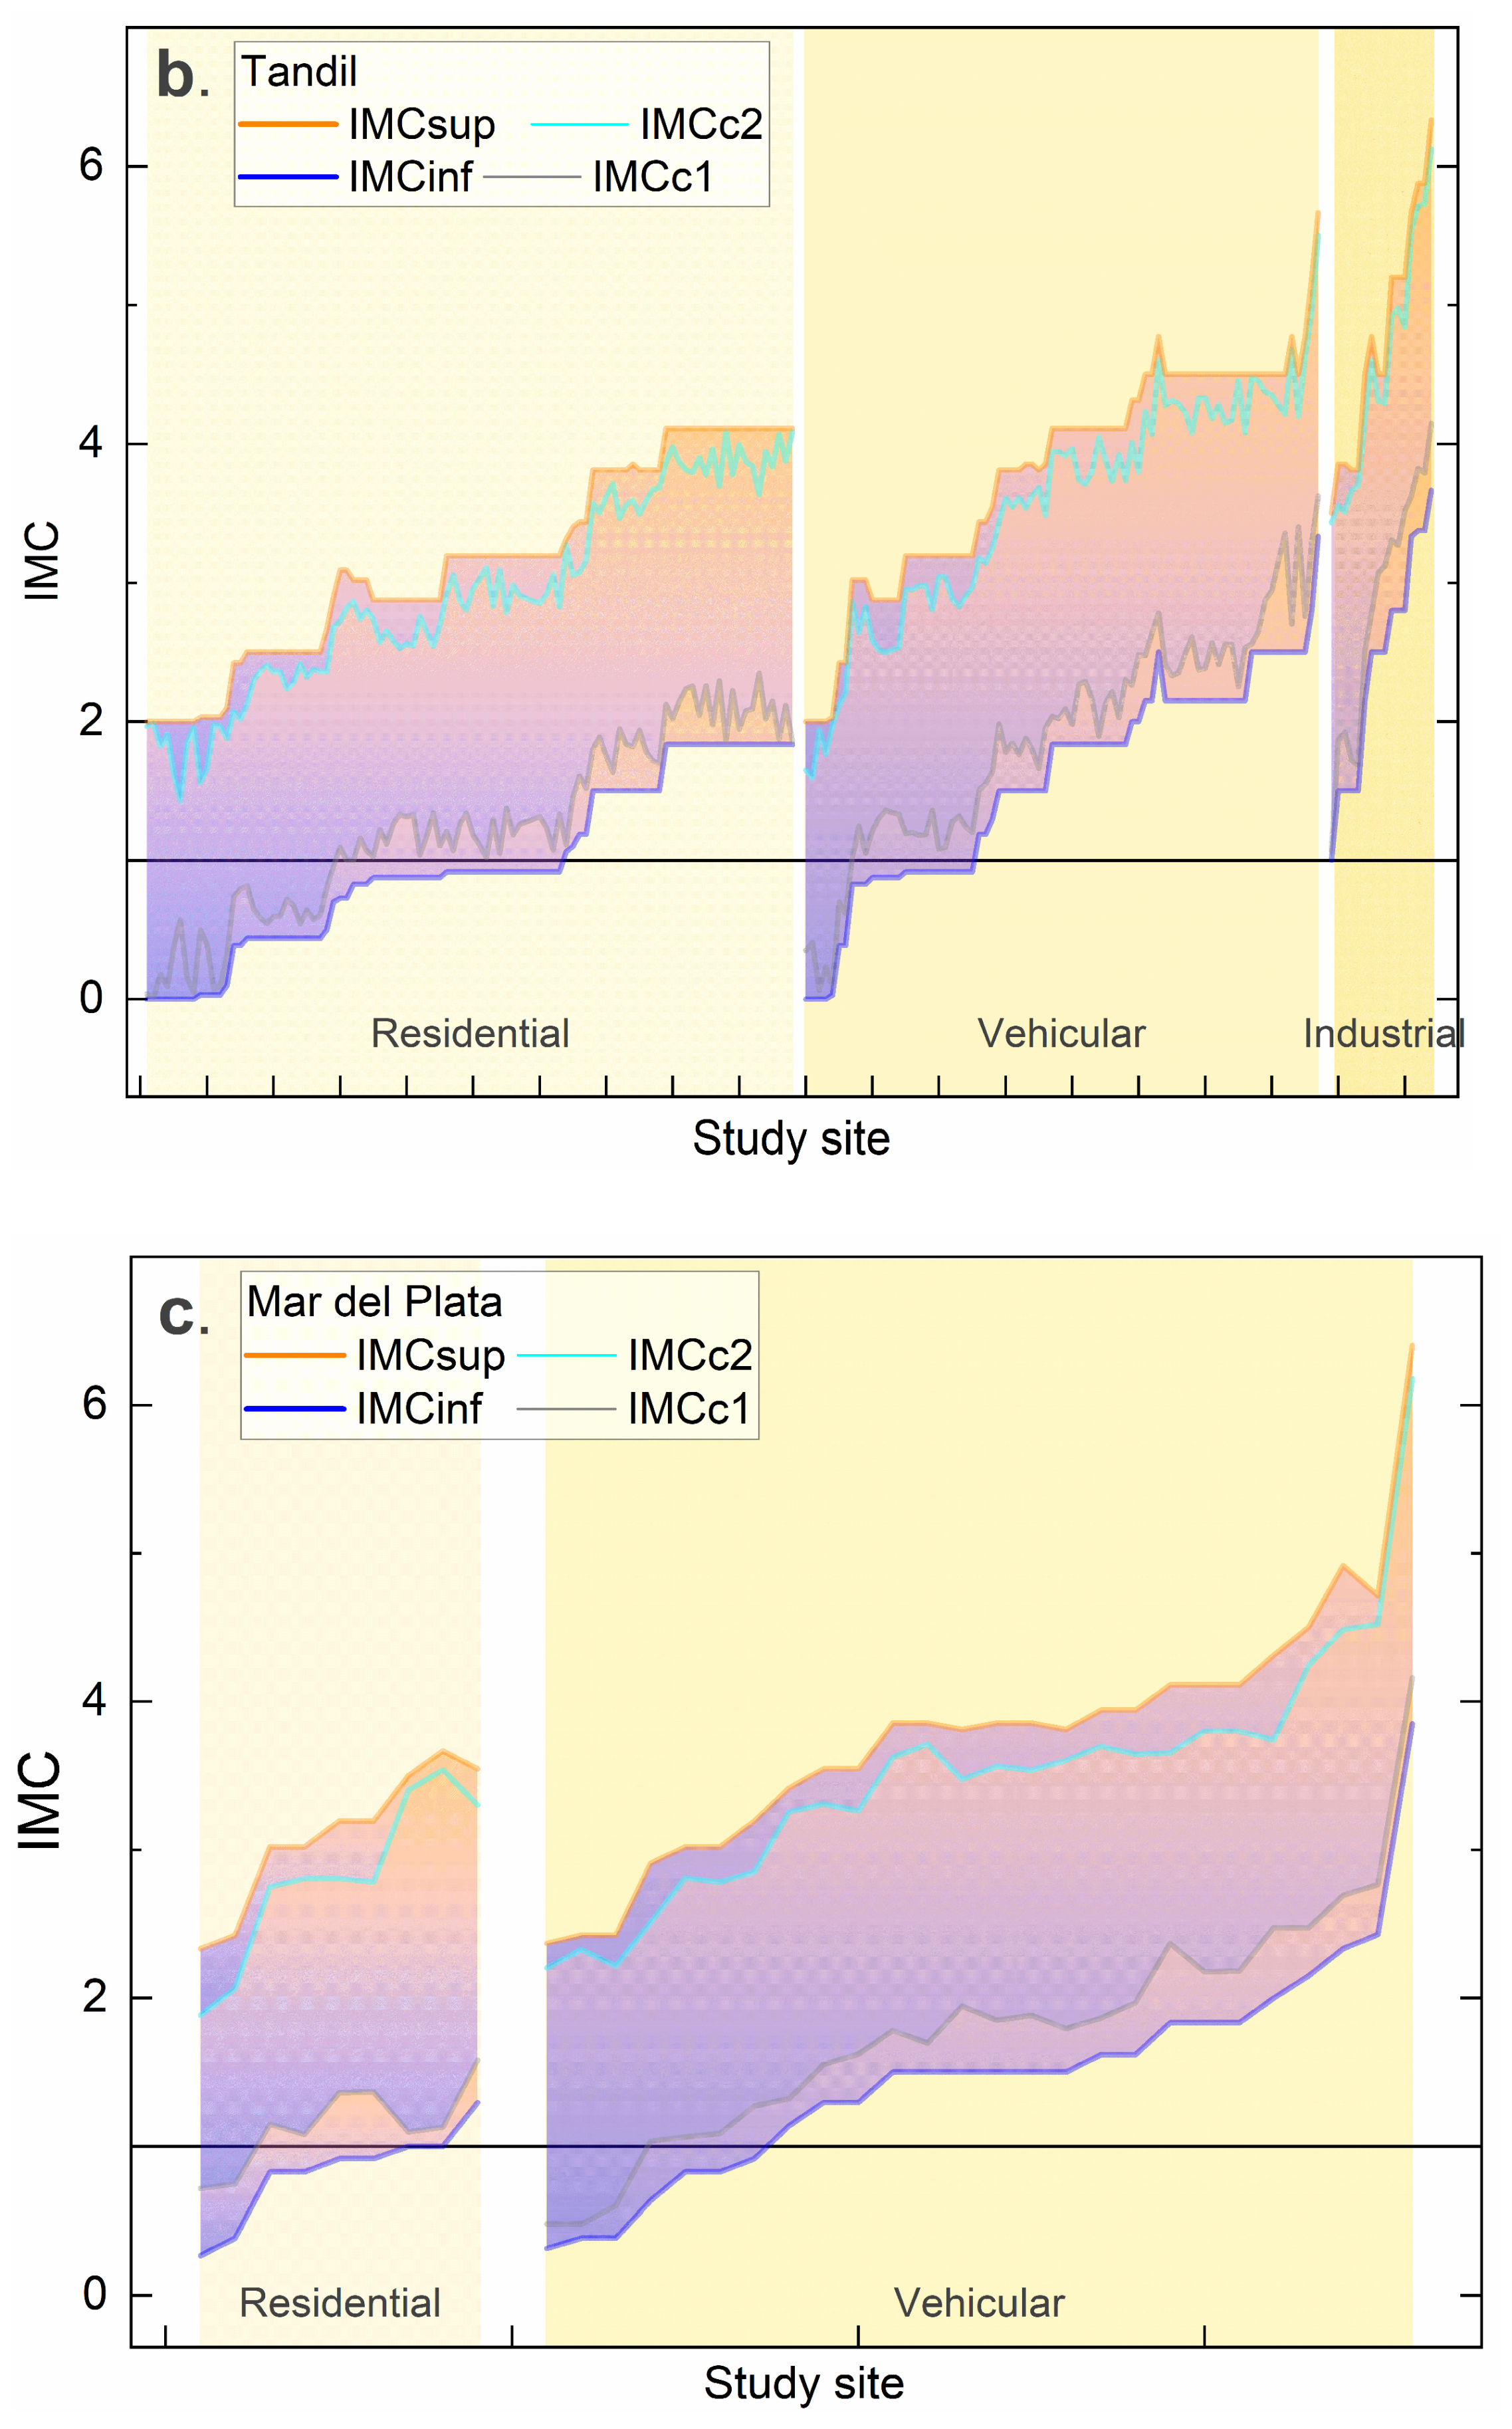
The calculated IMC values obtained from the mathematical model are shown in Figure 5. Consistent with reported studies [13,23,28,31,32], each sample was classified as control, residential, vehicular, or industrial. The IMC output values give the highest IMC values (≈10) in sites close to industrial areas and, in contrast, the lowest zero (≈0) in residential areas far from avenues.

4. Discussion

It is pertinent to highlight that including multiple datasets from diverse regions enhances the generalizability of the findings and fosters a broader understanding of magnetic particle pollution patterns in urban areas. By incorporating these heterogeneous datasets, the IMC model can effectively capture variations in magnetic parameters associated with different pollution sources and local characteristics. The determination or selection of the CMS is fundamental for calculating the IMC for a new study zone. Typically, these sites are chosen far from urban centers, as in these study zones. However, in the case of a large city or megacity where such pristine sites were not available, suggested CMS locations may include parks, forests, or other green spaces within the urban environment, commonly referred to as “green lungs”.
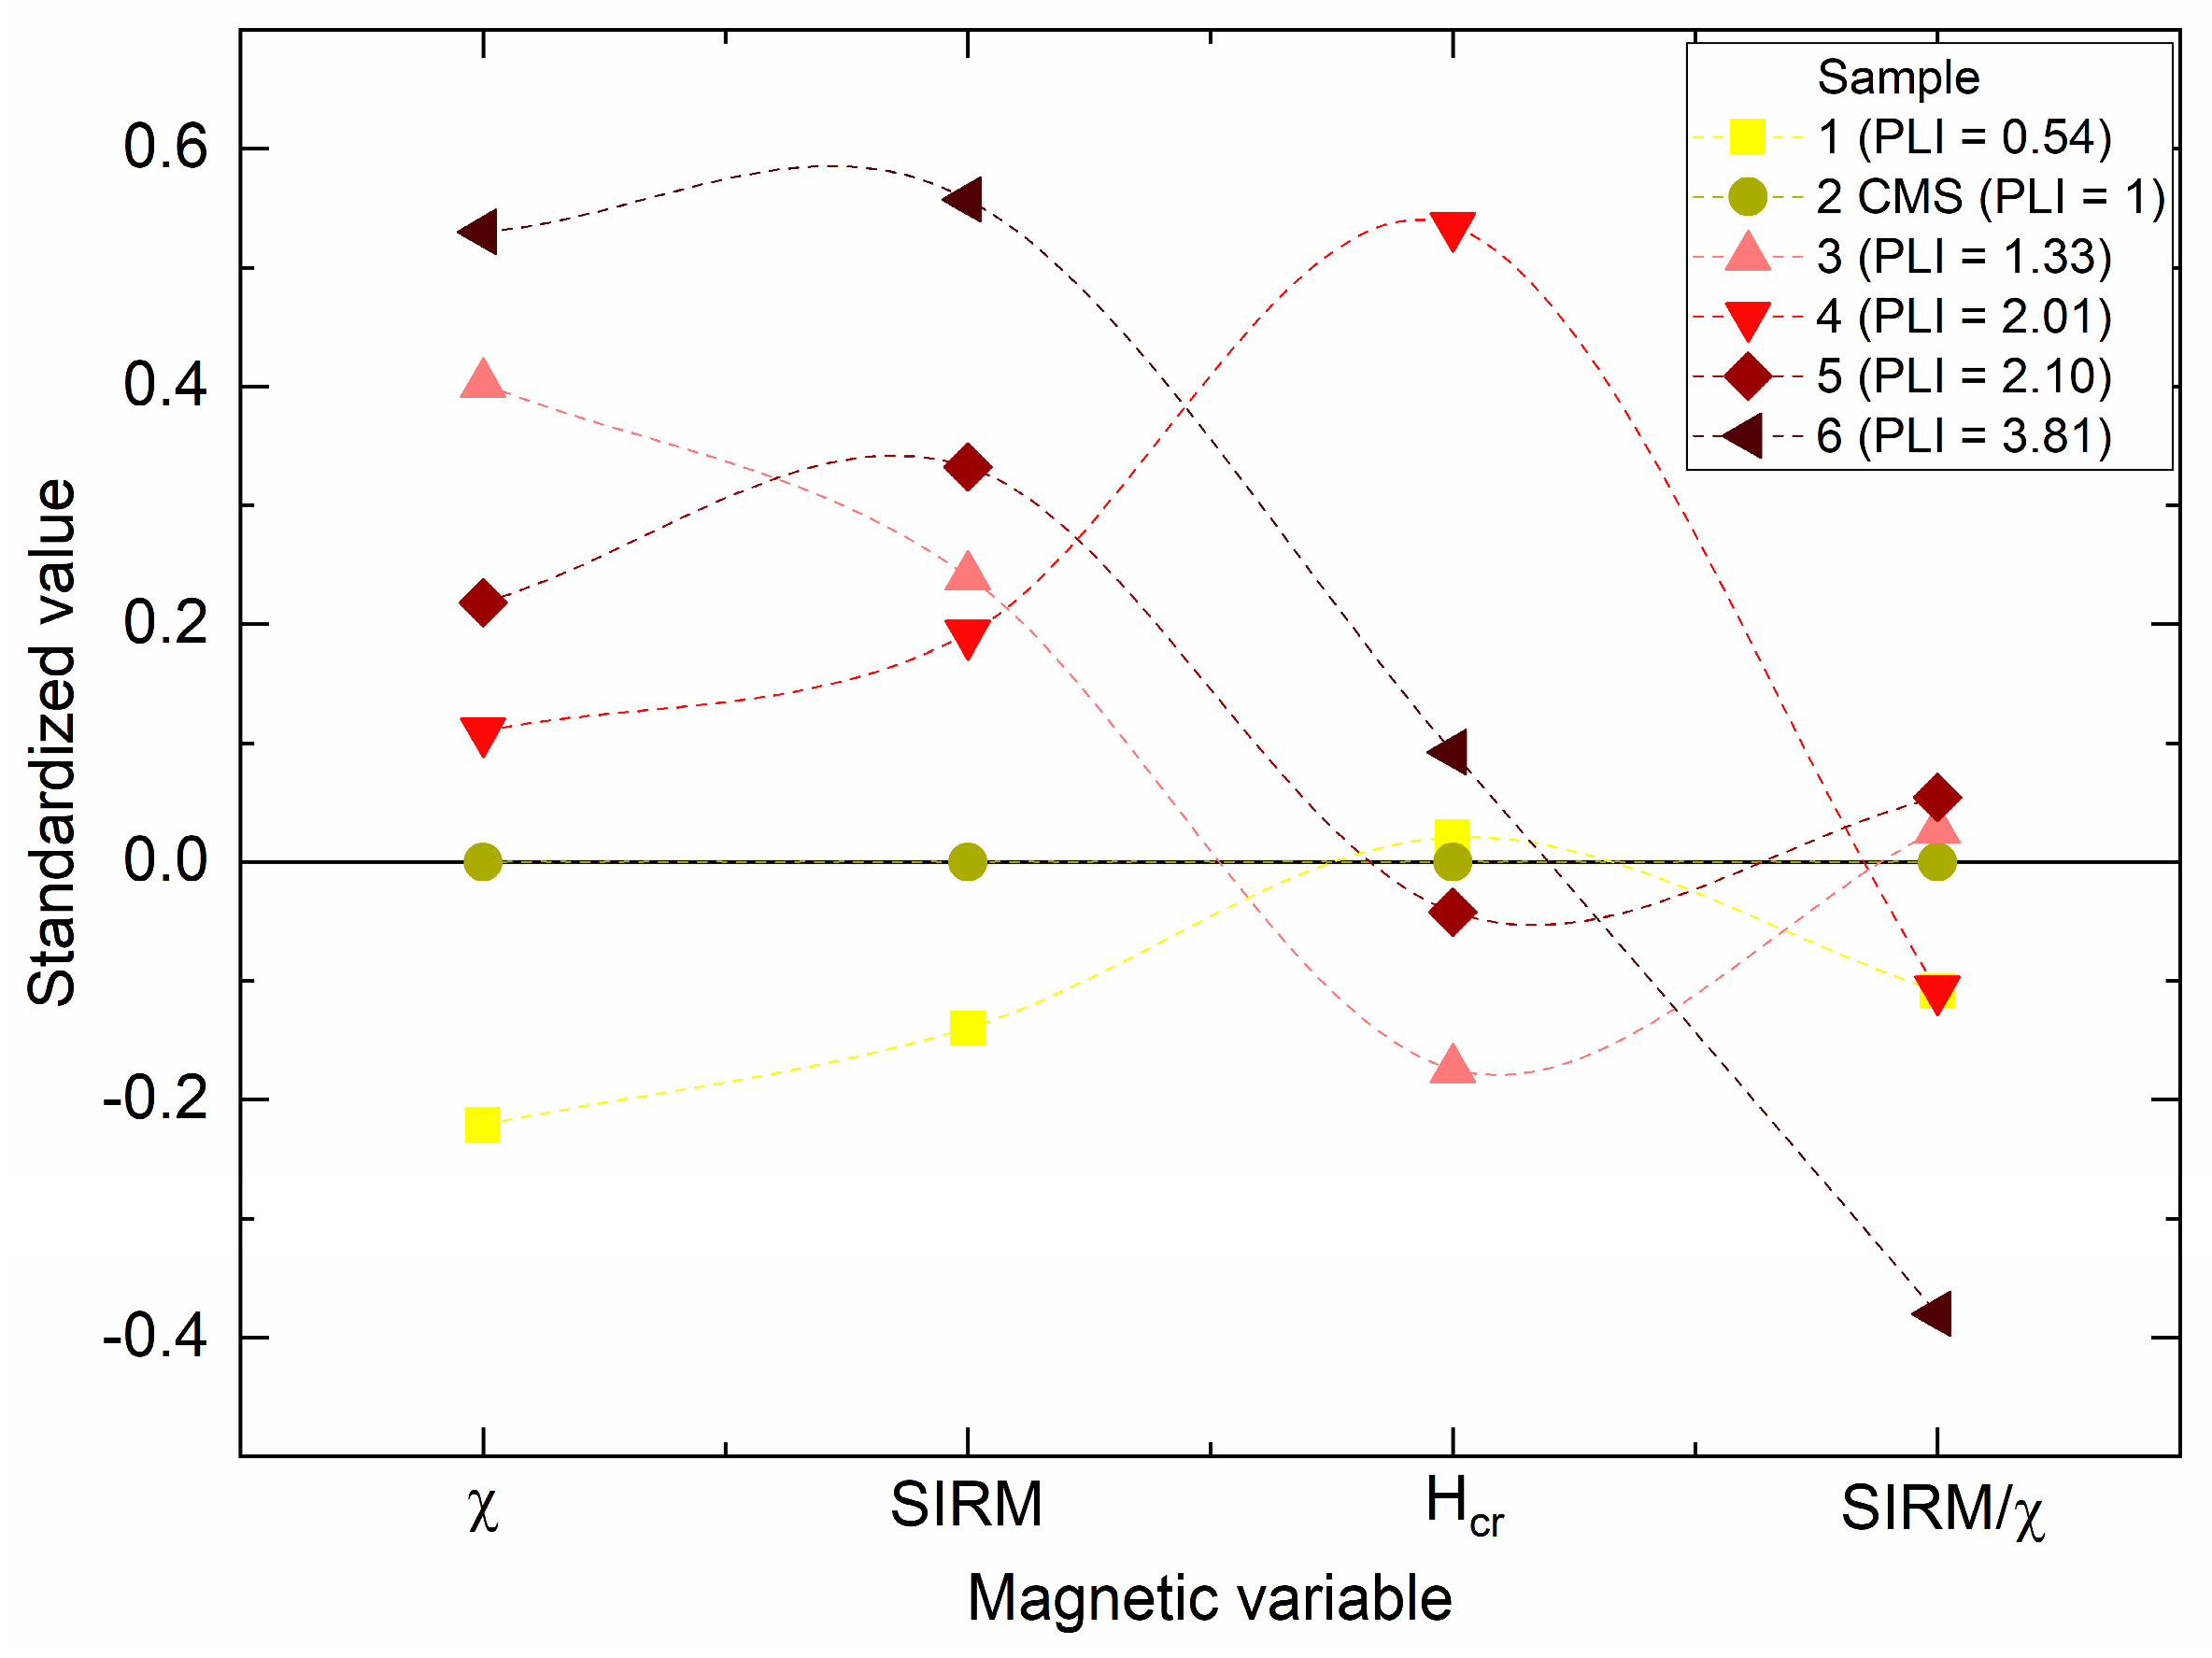
The results of standardization and the construction of the membership functions show that CMS sites exhibit reference values with low magnetic concentration (MF2, Table 2) and high values related to mineralogy and grain size (MF3). The perturbation of the magnetic signature regarding the reference value may occur in different directions. For example, in Figure 6, different magnetic signatures (concentration and mineralogy-dependent magnetic parameters) of Santiago de Queretaro’s samples are shown, suggesting that there is no direct relationship between increases or decreases in magnetic values and pollution levels (PLI).
The IMC is associated with increased disturbance on CMS with χ and SIRM from the constructed rule base (MF1, Table 2). In this way, it can be observed that low disturbances in the CMS (1133, 2233, 1142) will be concluded with membership functions IMC1 or/and IMC2 (Table 3), hence, low contamination values will be indicated. When the signature is highly disturbed in terms of concentration and mineralogy, as in the cases with rules 4541, 4641, 4532, and 4631, the conclusion involves membership functions ranging from IMC6 to IMC10 (Table 3), indicating high contamination values.
Notably, 88% of the PLI samples in Figure 3 are contained within the external interval defined by IMCinf and IMCsup, and 71% of them are within the central interval, delimited by the highest membership values of IMCc1 and IMCc2. A linear regression between the modeled IMC values and the recognized PLI [36] (Figure 4, R2 > 0.85) establishes a relationship between indices and fulfills the assumptions of normality in the errors. It is essential to mention that major uncertainty is introduced in the intermediate values of the IMC, creating a broad range in the fuzzy IMC number. This uncertainty can be addressed by incorporating new data where PLI values were available.
The estimations of the IMC (Figure 5, Section 3.3.2) demonstrated a discernible trend across the categories of residential, vehicular, and industrial within all study sites. Industrial zones in Tandil [13,23] and Valle de Aburrá [32], wherein industries are situated within or close to urban areas, exhibited the highest IMC values. The highest IMCinf–IMCsup values varied between 7 and 10 for Valle de Aburrá (Figure 5a) and between 4 and 6 for Tandil (Figure 5b). Such estimated differences between areas are expected because Tandil has 120,000 inhabitants [13], and Valle de Aburrá has approximately 3.8 million inhabitants [32]. In contrast, residential areas consistently displayed the lowest IMC values, i.e., the lowest IMCinf–IMCsup values varied between 0 and 2 for Valle de Aburrá (Figure 5a), Tandil (Figure 5b), and Mar del Plata (Figure 5c). However, the characterization of the IMC values for vehicular areas was less definitive (Figure 5). Describing vehicular traffic in greater detail is necessary. Their movement must be specified in addition to the quantity of vehicles observed. A higher quantity of particulate matter may be present at lower displacement speeds. The increment of AMP concentration, the presence of ferrimagnetic materials (in terms of magnetic mineralogy), and relatively coarser magnetic particles indicate samples with elevated levels of AMP pollution. These case studies underscore the potential health hazards of micron-sized particles that can be inhaled as breathable particles (e.g., PM2.5) containing iron oxides. Furthermore, regardless of mineralogy and magnetic particle size, a low concentration of magnetic material is associated with a clean site. It is worth noting that the rules are less elucidated for intermediate IMC values, as evidenced in Table 3.
The IMC index summarizes the various properties of magnetic parameters typically examined in magnetic biomonitoring. Consequently, IMC quantitatively measures pollution levels or disturbances relative to “clean sites” (Figure 6). It is considered that the utilization of the four variables contributes to a more precise description of the condition of a sampled site in terms of AMP contamination. A clear indication is given by the variability of premises leading to different IMC values because the modeled problem is non-linear. In other words, not all obtained values are determined by a single rule but rather by a combination of them. This fact is what enables the employment of fuzzy logic for the construction of the intended calculated value. Since different magnetic parameters may be determined for each case of study, other new analyses with the IMC will be possible using other available magnetic parameters. Alternatively, saturation magnetization (Ms), ARM, and remanent magnetization (Mr) can be tested for magnetic concentration-dependent parameters. In addition, for magnetic mineralogy type and grain size properties, Hc, acquisition remanent coercivity (H1/2), χARM/χ, and ARM/SIRM can also be tested.
Complementary to this manuscript, an application has been developed for readers, available at https://6ashoe-mauro-chaparro.shinyapps.io/IMC_ChaparroMAE/, accessed on 29 March 2024. The application calculates the IMC using personal data. The researcher can upload their data along with reference values for a clean zone, and then an IMC value, represented as a triangular fuzzy number, will be determined and displayed. If the model lacks a predefined rule for an uploaded case, it will display “−100”. An email address is provided for communication, facilitating the submission of proposals to include any missing rules and enhance the model.

5. Conclusions

The IMC quantitatively measures pollution levels or disturbances relative to “clean sites”. The highest estimated IMC values varied between 7 and 10 for Valle de Aburrá and between 4 and 6 for Tandil, which is expected regarding the population density. In contrast, residential areas consistently displayed the lowest IMC values, between 0 and 2.
The modeled IMC and the corresponding PLI showed a linear trend; a linear regression model yielded an R2 > 0.85 and fulfilled the assumptions of normality in the errors.
The magnetic techniques for biomonitoring are a cost-effective alternative methodology for assessing AMP pollution that complements other methods reliant on chemical determinations for monitoring urban environments. The IMC index is valuable for summarizing this information about a sample’s fundamental magnetic properties in only one fuzzy value (or fuzzy number).
This methodology developed for building this IMC (fuzzy clustering + fuzzy arithmetic + fuzzy inference system) can be utilized for magnetic monitoring data from other environmental matrices, such as soils and sediments.

Author Contributions

Conceptualization, M.A.E.C. (Mauro A. E. Chaparro) and M.A.E.C. (Marcos A. E. Chaparro); methodology, D.A.M.; software, M.A.E.C. (Mauro A. E. Chaparro); formal analysis, M.A.E.C. (Mauro A. E. Chaparro); investigation, M.A.E.C. (Marcos A. E. Chaparro) and D.A.M.; writing—original draft preparation, M.A.E.C. (Mauro A. E. Chaparro) and D.A.M.; writing—review and editing, M.A.E.C. (Marcos A. E. Chaparro); visualization, M.A.E.C. (Mauro A. E. Chaparro); funding acquisition, M.A.E.C. (Marcos A. E. Chaparro). All authors have read and agreed to the published version of the manuscript.

Funding

This research was funded by the Bilateral CONICET/CONACYT Project Res. 1001/14-5131/15 (Marcos A.E.C.) and the project PAPIIT-BG-101921. The APC was funded by the MDPI Editorial Team.

Institutional Review Board Statement

Not applicable.

Informed Consent Statement

Not applicable.

Data Availability Statement

Data will be made available upon request.

Acknowledgments

The authors thank the Universidad Nacional del Mar del Plata (UNMdP), the Universidad Nacional del Centro de la Provincia de Buenos Aires (UNCPBA), and the National Council for Scientific and Technological Research (CONICET) for their financial support.

Conflicts of Interest

The authors declare no conflicts of interest.

References

  1. WHO. WHO Global Air Quality Guidelines: Particulate matter (PM 2.5 and PM 10), Ozone, Nitrogen Dioxide, Sulfur Dioxide and Carbon Monoxide; World Health Organization: Geneva, Switzerland, 2021; p. 290.
  2. Schiavo, B.; Meza-Figueroa, D.; Vizuete-Jaramillo, E.; Robles-Morua, A.; Angulo-Molina, A.; Reyes-Castro, P.A.; Inguaggiato, C.; Gonzalez-Grijalva, B.; Pedroza-Montero, M. Oxidative Potential of Metal-Polluted Urbsan Dust as a Potential Environmental Stressor for Chronic Diseases. Environ. Geochem. Health 2023, 45, 3229–3250. [Google Scholar] [CrossRef]
  3. Morton-Bermea, O.; Hernández-Alvarez, E.; Almorín-Ávila, M.A.; Ordoñez-Godínez, S.; Bermendi-Orosco, L.; Retama, A. Historical Trends of Metals Concentration in PM10 Collected in the Mexico City Metropolitan Area between 2004 and 2014. Environ. Geochem. Health 2021, 43, 2781–2798. [Google Scholar] [CrossRef]
  4. Hanfi, M.Y.; Mostafa, M.Y.A.; Zhukovsky, M.V. Heavy Metal Contamination in Urban Surface Sediments: Sources, Distribution, Contamination Control, and Remediation. Environ. Monit. Assess 2020, 192, 32. [Google Scholar] [CrossRef]
  5. Chaparro, M.A.E. Airborne Particle Accumulation and Loss in Pollution-Tolerant Lichens and Its Magnetic Quantification. Environ. Pollut. 2021, 288, 117807. [Google Scholar] [CrossRef]
  6. Maher, B.A. Airborne Magnetite- and Iron-Rich Pollution Nanoparticles: Potential Neurotoxicants and Environmental Risk Factors for Neurodegenerative Disease, Including Alzheimer’s Disease. J. Alzheimer’s Dis. 2019, 71, 361–375. [Google Scholar] [CrossRef]
  7. Calderón-Garcidueñas, L.; González-Maciel, A.; Mukherjee, P.S.; Reynoso-Robles, R.; Pérez-Guillé, B.; Gayosso-Chávez, C.; Torres-Jardón, R.; Cross, J.V.; Ahmed, I.A.M.; Karloukovski, V.V.; et al. Combustion and Friction-Derived Magnetic Air Pollution Nanoparticles in Human Hearts. Environ. Res. 2019, 176, 108567. [Google Scholar] [CrossRef] [PubMed]
  8. Maher, B.A.; Ahmed, I.A.M.; Karloukovski, V.; MacLaren, D.A.; Foulds, P.G.; Allsop, D.; Mann, D.M.A.; Torres-Jardón, R.; Calderon-Garciduenas, L. Magnetite Pollution Nanoparticles in the Human Brain. Proc. Natl. Acad.Sci. USA 2016, 113, 10797–10801. [Google Scholar] [CrossRef] [PubMed]
  9. Magiera, T.; Górka-Kostrubiec, B.; Szumiata, T.; Wawer, M. Technogenic Magnetic Particles from Steel Metallurgy and Iron Mining in Topsoil: Indicative Characteristic by Magnetic Parameters and Mössbauer Spectra. Sci. Total Environ. 2021, 775, 145605. [Google Scholar] [CrossRef]
  10. Georgeaud, V.M.; Rochette, P.; Ambrosi, J.P.; Vandamme, D.; Williamson, D. Relationship between Heavy Metals and Magnetic Properties in a Large Polluted Catchment: The Etang de Berre (South of France). Phys. Chem. Earth 1997, 22, 211–214. [Google Scholar] [CrossRef]
  11. Chaparro, M.A.E.; Ramírez-Ramírez, M.; Chaparro, M.A.E.; Miranda-Avilés, R.; Puy-Alquiza, M.J.; Böhnel, H.N.; Zanor, G.A. Magnetic Parameters as Proxies for Anthropogenic Pollution in Water Reservoir Sediments from Mexico: An Interdisciplinary Approach. Sci. Total Environ. 2020, 700, 134343. [Google Scholar] [CrossRef] [PubMed]
  12. Jordanova, D.; Petrov, P.; Hoffmann, V.; Gocht, T.; Panaiotu, C.; Tsacheva, T.; Jordanova, N. Magnetic Signature of Different Vegetation Species in Polluted Environment. Stud. Geophys. Geod. 2010, 54, 417–442. [Google Scholar] [CrossRef]
  13. Chaparro, M.A.E.; Lavornia, J.M.; Chaparro, M.A.E.; Sinito, A.M. Biomonitors of Urban Air Pollution: Magnetic Studies and SEM Observations of Corticolous Foliose and Microfoliose Lichens and Their Suitability for Magnetic Monitoring. Environ. Pollut. 2013, 172, 61–69. [Google Scholar] [CrossRef]
  14. Vuković, G.; Urošević, M.A.; Tomašević, M.; Samson, R.; Popović, A. Biomagnetic Monitoring of Urban Air Pollution Using Moss Bags (Sphagnum Girgensohnii). Ecol. Indic. 2015, 52, 40–47. [Google Scholar] [CrossRef]
  15. Sagnotti, L.; Taddeucci, J.; Winkler, A.; Cavallo, A. Compositional, Morphological, and Hysteresis Characterization of Magnetic Airborne Particulate Matter in Rome, Italy. Geochem. Geophys. Geosystems 2009, 10. [Google Scholar] [CrossRef]
  16. Petrovský, E.; Zbořil, R.; Grygar, T.M.; Kotlík, B.; Novák, J.; Kapička, A.; Grison, H. Magnetic Particles in Atmospheric Particulate Matter Collected at Sites with Different Level of Air Pollution. Stud. Geophys. Geod. 2013, 57, 755–770. [Google Scholar] [CrossRef]
  17. Petrovský, E.; Kapička, A.; Grison, H.; Kotlík, B.; Miturová, H. Negative Correlation between Concentration of Iron Oxides and Particulate Matter in Atmospheric Dust: Case Study at Industrial Site during Smoggy Period. Environ. Sci. Eur. 2020, 32, 134. [Google Scholar] [CrossRef]
  18. Kapička, A.; Petrovský, E.; Ustjak, S.; Macháčková, K. Proxy Mapping of Fly-Ash Pollution of Soils around a Coal-Burning Power Plant: A Case Study in the Czech Republic. J. Geochem. Explor. 1999, 66, 291–297. [Google Scholar] [CrossRef]
  19. Marié, D.C.; Chaparro, M.A.E.; Gogorza, C.S.G.; Navas, A.; Sinito, A.M. Vehicle-Derived Emissions and Pollution on the Road Autovia 2 Investigated by Rock-Magnetic Parameters: A Case Study from Argentina. Stud. Geophys. Geod. 2010, 54, 135–152. [Google Scholar] [CrossRef]
  20. Nyirő-Kósa, I.; Ahmad, F.; Hoffer, A.; Pósfai, M. Nanoscale Physical and Chemical Properties of Individual Airborne Magnetic Particles from Vehicle Emissions. Atmos. Environ. X 2022, 15, 100181. [Google Scholar] [CrossRef]
  21. Flanders, P.J. Collection, Measurement, and Analysis of Airborne Magnetic Particulates from Pollution in the Environment. J. Appl. Phys. 1994, 75, 5931–5936. [Google Scholar] [CrossRef]
  22. Salo, H.; Paturi, P.; Mäkinen, J. Moss Bag (Sphagnum Papillosum) Magnetic and Elemental Properties for Characterising Seasonal and Spatial Variation in Urban Pollution. Int. J. Environ. Sci. Technol. 2016, 13, 1515–1524. [Google Scholar] [CrossRef]
  23. Marié, D.C.; Chaparro, M.A.E.; Irurzun, M.A.; Lavornia, J.M.; Marinelli, C.; Cepeda, R.; Böhnel, H.N.; Castañeda Miranda, A.G.; Sinito, A.M. Magnetic Mapping of Air Pollution in Tandil City (Argentina) Using the Lichen Parmotrema Pilosum as Biomonitor. Atmos. Pollut. Res. 2016, 7, 513–520. [Google Scholar] [CrossRef]
  24. Lehndorff, E.; Urbat, M.; Schwark, L. Accumulation Histories of Magnetic Particles on Pine Needles as Function of Air Quality. Atmos. Environ. 2006, 40, 7082–7096. [Google Scholar] [CrossRef]
  25. McIntosh, G.; Gómez-Paccard, M.; Osete, M.L. The Magnetic Properties of Particles Deposited on Platanus x hispanica Leaves in Madrid, Spain, and their Temporal and Spatial Variations. Sci. Total Environ. 2007, 382, 135–146. [Google Scholar] [CrossRef] [PubMed]
  26. Mitchell, R.; Maher, B.A.; Kinnersley, R. Rates of Particulate Pollution Deposition onto Leaf Surfaces: Temporal and Inter-Species Magnetic Analyses. Environ. Pollut. 2010, 158, 1472–1478. [Google Scholar] [CrossRef] [PubMed]
  27. Vezzola, L.C.; Muttoni, G.; Merlini, M.; Rotiroti, N.; Pagliardini, L.; Hirt, A.M.; Pelfini, M. Investigating Distribution Patterns of Airborne Magnetic Grains Trapped in Tree Barks in Milan, Italy: Insights for Pollution Mitigation Strategies. Geophys. J. Int. 2017, 210, 989–1000. [Google Scholar] [CrossRef]
  28. Chaparro, M.A.E.; Chaparro, M.A.E.; Castañeda-Miranda, A.G.; Marié, D.C.; Gargiulo, J.D.; Lavornia, J.M.; Natal, M.; Böhnel, H.N. Fine Air Pollution Particles Trapped by Street Tree Barks: In Situ Magnetic Biomonitoring. Environ. Pollut. 2020, 266, 115229. [Google Scholar] [CrossRef] [PubMed]
  29. Winkler, A.; Caricchi, C.; Guidotti, M.; Owczarek, M.; Macrì, P.; Nazzari, M.; Amoroso, A.; Di Giosa, A.; Listrani, S. Combined Magnetic, Chemical and Morphoscopic Analyses on Lichens from a Complex Anthropic Context in Rome, Italy. Sci. Total Environ. 2019, 690, 1355–1368. [Google Scholar] [CrossRef] [PubMed]
  30. Winkler, A.; Contardo, T.; Vannini, A.; Sorbo, S.; Basile, A.; Loppi, S. Magnetic Emissions from Brake Wear Are the Major Source of Airborne Particulate Matter Bioaccumulated by Lichens Exposed in Milan (Italy). Appl. Sci. 2020, 10, 2073. [Google Scholar] [CrossRef]
  31. Castañeda-Miranda, A.G.; Chaparro, M.A.E.; Chaparro, M.A.E.; Böhnel, H.N. Magnetic Properties of Tillandsia Recurvata L. and Its Use for Biomonitoring a Mexican Metropolitan Area. Ecol. Indic. 2016, 60, 125–136. [Google Scholar] [CrossRef]
  32. Mejía-Echeverry, D.; Chaparro, M.A.E.; Duque-Trujillo, J.F.; Chaparro, M.A.E.; Castañeda Miranda, A.G. Magnetic Biomonitoring as a Tool for Assessment of Air Pollution Patterns in a Tropical Valley Using Tillandsia sp. Atmosphere 2018, 9, 283. [Google Scholar] [CrossRef]
  33. Chaparro, M.A.E.; Buitrago Posada, D.; Chaparro, M.A.E.; Molinari, D.; Chiavarino, L.; Alba, B.; Marié, D.C.; Natal, M.; Böhnel, H.N.; Vaira, M. Urban and suburban’s airborne magnetic particles accumulated on Tillandsia capillaris. Sci. Total Environ. 2024, 907, 167890. [Google Scholar] [CrossRef] [PubMed]
  34. Chaparro, M.A.E.; Chaparro, M.A.E.; Castañeda Miranda, A.G.; Böhnel, H.N.; Sinito, A.M. An Interval Fuzzy Model for Magnetic Biomonitoring Using the Specie Tillandsia recurvata L. Ecol. Indic. 2015, 54, 238–245. [Google Scholar] [CrossRef]
  35. Martins Gurgatz, B.; Carvalho-Oliveira, R.; Canavese de Oliveira, D.; Joucoski, E.; Antoniaconi, G.; Hilário do Nascimento Saldiva, P.; Arantes Reis, R. Atmospheric metal pollutants and environmental injustice: A methodological approach to environmental risk analysis using fuzzy logic and tree bark. Ecol. Indic. 2016, 71, 428–437. [Google Scholar] [CrossRef]
  36. Tomlinson, D.L.; Wilson, J.G.; Harris, C.R.; Jeffrey, D.W. Problems in the Assessment of Heavy-Metal Levels in Estuaries and the Formation of a Pollution Index. Helgol. Meeresunters. 1980, 33, 566–575. [Google Scholar] [CrossRef]
  37. Klir, G.J.; Yuan, B. Fuzzy Sets and Fuzzy Logic: Theory and Applications; Prentice Hall: Upper Saddle River, NJ, USA, 1995. [Google Scholar]
  38. Walden, J.; Oldfield, F.; Smith, J.P. (Eds.) Environmental Magnetism: A Practical Guide; Quaternary Research Association: London, UK, 1999; Volume Technical Guide, No. 6; p. 243. [Google Scholar]
  39. Peters, C.; Dekkers, M.J. Selected Room Temperature Magnetic Parameters as a Function of Mineralogy, Concentration and Grain Size. Phys. Chem. Earth Parts 2003, 28, 659–667. [Google Scholar] [CrossRef]
  40. Maher, B.A. Characterisation of Soils by Mineral Magnetic Measurements. Phys. Earth Planet. Inter. 1986, 42, 76–92. [Google Scholar] [CrossRef]
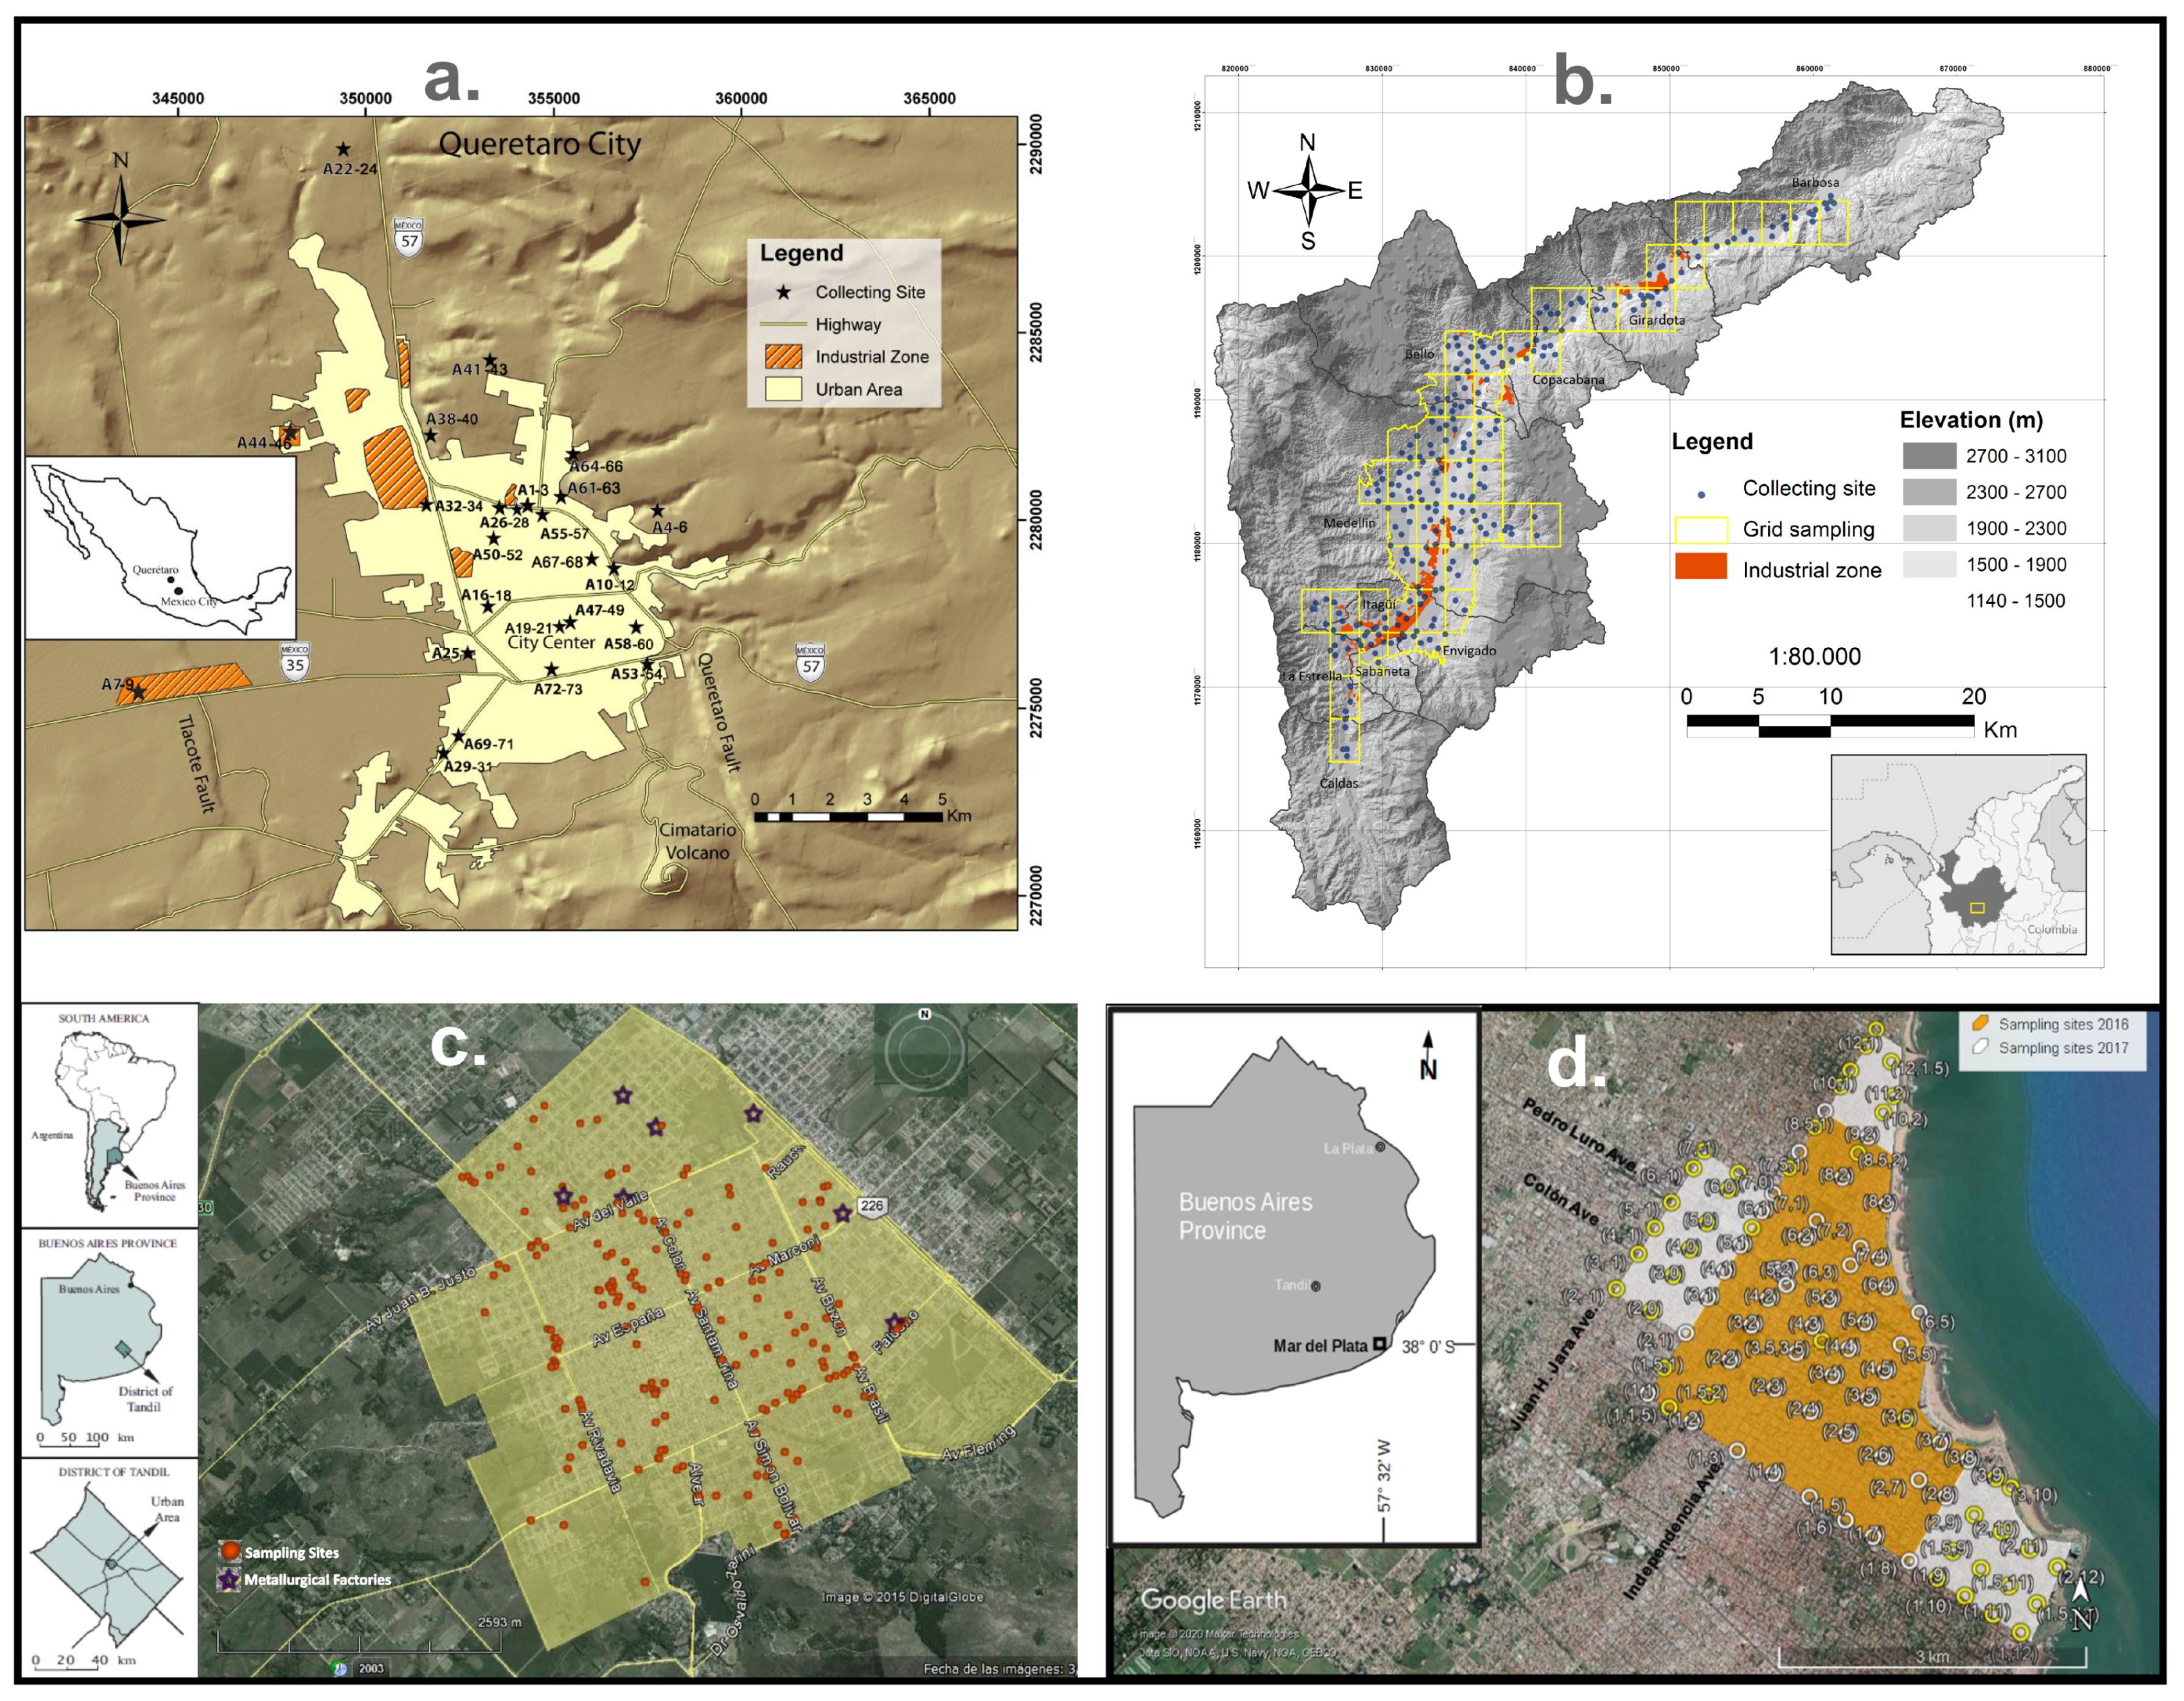
Figure 1. Urban magnetic biomonitoring in Latin American areas: (a) Santiago de Querétaro (Mexico, [31]), (b) Valle de Aburrá (Colombia, [32]), (c) Tandil (Argentina, [13,23]), and (d) Mar del Plata (Argentina, [28]). The studies comprise biomonitors such as Tillandsia sp., lichens, and tree barks, respectively.
Atmosphere 15 00435 g001
Figure 2. Representation of the membership functions for the IMC output variable. The membership functions for the IMC output variable are Triangular type, and it was decided to partition them into ten membership functions in increasing order from 1-Base/Control site (No contamination) to 10-High contamination.
Atmosphere 15 00435 g002
Figure 3. The FCM-based model calculates IMC values. The PLI (open) dots are the PLI values.
Atmosphere 15 00435 g003
Figure 4. IMC versus PLI values. Regression models for I M C i n f ,   I M C C i n f ,   I M C C S U P ,   I M C S U P .
Atmosphere 15 00435 g004
Figure 5. IMC values by local zona for each study site, i.e., (a) Valle de Aburrá (Col.), (b) Tandil, and (c) Mar del Plata (Arg.), without PLI values.
Atmosphere 15 00435 g005aAtmosphere 15 00435 g005b
Figure 6. Standardized values of concentration and mineralogy-dependent magnetic parameters. These data correspond to Santiago de Queretaro and are shown as an example of the magnetic signal perturbation concerning the reference value of CMS.
Atmosphere 15 00435 g006
Table 1. Magnetic biomonitoring datasets from the studied areas in Colombia, Argentina, and México, numbers of data, and biomonitors. Magnetic parameter values of clean sites for each study case are detailed.
DatasetArea
km2
nBiomonitor and Speciesχ
10−8 m3 kg−1
SIRM
10−3 Am2 kg−1
Hcr
mT
SIRM/χ
kA m−1
Valle de Aburrá [32]290185Tillandsia sp.: T. recurvata4.30.733.817.7
Mar del Plata [28]1154Tree barks: Cordyline australis, Fraxinus excelsior L., F. pensylvanica18.42.537.413.6
Santiago de Querétaro [31]2525Tillandsia sp.: T. recurvata5.51.439.725.7
Tandil [13,23]17208Lichens: Parmotrema pilosum, Punctelia hipoleucites, Dirinaria picta23.94.038.217.1
Table 2. Triangular membership function parameters for each input variable for the selected model. The “L”, “center”, and “U” represent the inferior, center, and superior limits, respectively. The values in italics and green correspond to the membership functions of CMS.
Variable χSIRMHcrSIRM/χ
MF1L−2.000−0.800−1.000−1.000
center−0.250−0.202−0.082−0.284
U0.2100.106−0.005−0.120
MF2L−0.250−0.202−0.082−0.284
center0.2100.106−0.005−0.120
U0.6900.3320.0280.018
MF3L0.2100.106−0.005−0.120
center0.6900.3320.0280.018
U1.2600.5750.0671.000
MF4L0.6900.3320.028
center1.2600.5750.067
U3.0000.8121.000
MF5L 0.575
center 0.812
U 1.148
MF6L 0.812
center 1.148
U 3.000
Table 3. Rules base for the selected model. The values correspond to the membership function for each input/output variable. For example, rule 1 1 3 3 corresponds to IF χ is χ1, and IF SIRM is SIRM1 and IF Hcr is Hcr3 and IF SIRM/χ is SIRM/χ3 THEN IMC is IMC1.
RuleIMCRuleIMCRuleIMC
1112123331 ∩ 2 ∩ 445414 ∩ 6
113313431346425 ∩ 7
123313433346226 ∩ 7
2212134232 ∩ 445327
222212211446315 ∩ 9
231113311446117 ∩ 8
11131 ∩ 23341446418 ∩ 10
22131 ∩ 235434
22331 ∩ 234112 ∩ 4 ∩ 5
23121 ∩ 234122 ∩ 4 ∩ 5
1142233322 ∩ 5
1143235232 ∩ 5
2243235332 ∩ 5
2313234324 ∩ 5
2332234414 ∩ 5
3241235225
3442246325
3443246335
3531245116
3532245126
Disclaimer/Publisher’s Note: The statements, opinions and data contained in all publications are solely those of the individual author(s) and contributor(s) and not of MDPI and/or the editor(s). MDPI and/or the editor(s) disclaim responsibility for any injury to people or property resulting from any ideas, methods, instructions or products referred to in the content.