Article

Characteristics of Vehicle Tire and Road Wear Particles’ Size Distribution and Influencing Factors Examined via Laboratory Test

1
China Automotive Technology and Research Center Co., Ltd., Tianjin 300300, China
2
Tianjin Eco-Environmental Monitoring Center, Tianjin 300191, China
3
Tianjin Key Laboratory of Urban Transport Emission Research, State Environmental Protection Key Laboratory of Urban Ambient Air Particulate Matter Pollution Prevention and Control, College of Environmental Science and Engineering, Nankai University, Tianjin 300071, China
*
Author to whom correspondence should be addressed.
Atmosphere 2024, 15(4), 423; https://doi.org/10.3390/atmos15040423
Submission received: 1 February 2024 / Revised: 1 March 2024 / Accepted: 19 March 2024 / Published: 29 March 2024
(This article belongs to the Special Issue Traffic Related Emission (2nd Edition))

Abstract

:
With the implementation of strict emission regulations and the use of cleaner fuels, there has been a considerable reduction in exhaust emissions. However, the relative contribution of tire wear particles (TWPs) to particulate matters is expected to gradually increase. This study conducted laboratory wear experiments on tires equipped on domestically popular vehicle models, testing the factors and particle size distribution of TWPs. The results showed that the content of tire wear particle emission was mainly ultrafine particles, accounting for 94.80% of particles ranging from 6 nm to 10 μm. There were at least two concentration peaks for each test condition and sample, at 10~13 nm and 23~41 nm, respectively. The mass of TWP emission was mainly composed of fine particles and coarse particles, with concentration peaks at 0.5 μm and 1.3–2.5 μm, respectively. Both the number and mass of TWPs exhibited a bimodal distribution, with significant differences in emission intensity among different tire samples. However, there was a good exponential relationship between PM10 mass emissions from tire wear and tire camber angle. The orthogonal experimental results showed that the slip angle showed the greatest impact on TWP emission, followed by speed and load, with the smallest impact from inclination angle.

1. Introduction

The study of vehicle emissions has long been a crucial focus in the field of research. To tackle the increasingly significant problem of vehicle pollution and decrease vehicle emissions, scientific researchers have devoted extensive efforts to enhance engine thermal efficiency, refine fuel quality, and create new exhaust-after-treatment devices [1,2]. Additionally, numerous countries and regions worldwide have taken significant measures, such as imposing stricter vehicle emission standards, placing restrictions on vehicle purchases and regional driving, promoting the development of rail transit, offering new standard fuels like ethanol gasoline, and encouraging the replacement of old vehicles [3,4,5]. These scientific research and policy initiatives have played a pivotal role in mitigating urban vehicle pollution.
Motor vehicles are a major contributor of particulate matter in the environment through their exhaust emissions, as well as non-exhaust emissions from sources such as tire wear, brake pad wear, road dust, road wear, and other parts such as clutches [1,6]. With the implementation of stricter motor vehicle emission standards and the increasing promotion of new energy vehicles, exhaust emissions from motor vehicles are expected to decrease, while non-exhaust emissions will become a more significant source of pollution. However, current research and regulations on particulate matter emissions from motor vehicles primarily focus on exhaust emissions, with limited attention given to non-exhaust emissions, particularly in China’s atmospheric environment field due to a lack of relevant emission control standards [7,8,9,10]. As new energy vehicles significantly reduce non-exhaust emissions, and even reach zero in the case of pure electric vehicles, non-exhaust particulate emissions require further attention.
New energy vehicles, especially pure electric vehicles, have demonstrated significant emission reductions for tailpipe particulate matter. However, due to the increase in vehicle weight (generally 24% heavier) and improved performance, non-exhaust emissions such as brake and tire wear emit more particulate matter than traditional fuel vehicles [11]. This further increases the contribution of non-exhaust to particulate matter emissions from motor vehicles, potentially making non-exhaust emissions the most significant anthropogenic source of particulate matter in urban areas worldwide. To strengthen the regulation of such non-exhaust particulate matter emissions, the Euro 7 proposal for the first time includes brake particulate matter emissions and tire wear under control and proposes relevant limit requirements. At present, the Euro 7 proposal only provides classification rules for different types/grades of tires. Specific limit requirements have not been proposed yet. According to the EU plan, the corresponding limit values will be established by the end of 2024 [12].
Tires are one of the important components of motor vehicles. They directly contact the road surface and work together with the suspension to cushion the impact on the vehicle during driving, ensuring a comfortable ride and smooth driving experience. Tires also ensure good adhesion between the wheels and the road surface, improve traction, braking, and passing ability, and play an important role in supporting the weight of the vehicle. As the tire surface rubs against the road surface during vehicle operation, frictional forces are generated, leading to tire wear and making tires one of the sources of airborne particulate matter [13,14,15,16,17]. During the interaction between the tire and road surface, friction and sliding occur, leading to micro-cutting and tearing. The contact area between the tire and road surface is constantly under stress, with the accumulated friction energy reaching a critical point, causing localized detachment in the form of debris and resulting in wear. Schallamach et al. pointed out that rubber samples under unidirectional abrasion are abraded with the formation of surface abrasion patterns. The appearance of such patterns is regarded to be because of the relative friction sliding of an elastomer characterized by low elasticity modulus over another harder counter face, and is thus referred to as an important abrasion characteristic or specified as the pattern abrasion, a special wear mechanism of rubber and tires [18,19].
The emission amount, particle size distribution, and chemical composition of TWPs are influenced by multiple factors, including tire properties, road structure, vehicle characteristics and conditions, and driving style [20,21,22,23]. Generally, tire manufacturers set the service life of tires at three years, which may vary based on the mileage, with a maximum of five years. Thus, the amount of tire wear is considerable. Previous studies have shown that tire wear is mainly influenced by tire properties (tire type, size, mileage, and age), road surface properties (material, pattern, humidity, temperature), and vehicle driving conditions (speed, acceleration, braking, turning, tire pressure) [24,25]. In addition, frequent and rapid acceleration and braking as well as poor road conditions can generate more tire wear particles [21,22].
The analysis of particulate matter emission sources in the European road transportation sector shows that non-exhaust particulate matter has reached 85% of total road particulate matter emissions, with the vast majority coming from braking and tire wear [26]. Even electric vehicles with zero exhaust emissions cannot avoid particulate matter emissions caused by braking and tire wear. Early studies on TWPs utilized scanning electron microscopy to analyze from a microscopic perspective. Dannis et al. found that the average size of TWPs was 20 μm, with only a small fraction of particles being smaller than 3 μm. Camatini et al. studied the particle size of tire wear collected from an automotive testing facility using scanning electron microscopy and found that the particle size could reach several hundred micrometers [27]. However, particles with a size larger than tens of micrometers will quickly settle due to the effect of gravity. Pierson et al. discovered that only 10% by weight of TWPs had a size smaller than 3 μm, and only a small fraction of wear particles actually entered the air. Most of them settled directly onto the road or nearby areas.
Laboratory experiments have shown that TWPs are distributed in sizes both below 100 nm and above 30 μm, indicating that tire wear contributes to submicron-sized particles. Kreider et al. analyzed TWPs’ size distribution using laser diffraction and transmission optical microscopy, finding that the volume-based size distribution followed a unimodal pattern with peak sizes of 75 μm and 100 μm [28]. Therefore, the proportion of PM10 in TWP is low, ranging from approximately 0.1% to 10%. This observation is supported by Fauser’s research [29], which indicates that most TWPs generated by tire–road friction settle on the road surface, and only 5% of the total suspended particulate matter in cities come from particles that enter the air directly or through resuspension, with these particles exhibiting a bimodal size distribution and particles smaller than 1 μm, accounting for over 90% of the total mass.
There are two main methods for studying TWPs: laboratory testing and road measurement [1,30,31]. Andreas Dahl et al. studied the ultrafine particles in TWPs using the VTI road simulator and found that the mean diameter of TWPs (by number) was 15~50 nm [32]. The emission factor was 3.7 × 10¹¹ particles/veh/km at an initial braking speed of 50 km/h and 3.2 × 10¹¹ particles/veh/km at 70 km/h. Marcel Mathissen et al. used an EEPS (TSI) installed between the tire and the road surface to test TWPs in a vehicle testing facility, and analyzed the emission characteristics of ultrafine particles generated by tire wear on the road surface [33]. They found that particles were produced in the range of 6~562 nm, with the maximum value appearing at 30~60 nm, and that the emission rate increased significantly when the tire was skidding. Dall’Osto et al. used a tire wear test machine and particle size spectrometers (APS and SMPS, TSI) to detect the particle size distribution of particles in the range of 6 nm to 20 μm, and found two peak values at 35 nm and 85 nm [34]. Fauser et al. believed that the mass particle size distribution of tire wear particles entering the air showed a bimodal mode, with particles below 1 μm accounting for more than 90% of the total mass [29]. Chang et al. used a tire test bench to analyze the factors that may affect the number and particle size distribution of tire wear particles and found a single peak mode with a peak diameter of 10~200 nm. The peak size varied due to factors such as tire model, wear resistance index, and experimental conditions (such as temperature and humidity). Kwak et al. conducted road experiments and laboratory simulations and found that the number and particle size distribution of tire wear particles followed a single peak mode [35]. The peak size varied, with a peak diameter of 60 μm for the former and 30~40 nm for the latter. This study did not find any significant effect of driving speed on the number and particle size distribution. Therefore, different studies have come to different conclusions about the particle size distribution, and the differences can be significant.
In summary, the characterization of TWPs is still not comprehensive enough, with significant differences in particle size distribution and variations in research objects across different regions. Previous studies have provided little reference value for understanding the current status of tire wear in China. Furthermore, differences in research methods and technical approaches have led to poor data comparability. Therefore, this study aims to use a tire durability testing platform to investigate the particle size distribution of tire wear emissions and the quantitative impact of various factors on particle emissions, deepening our understanding of non-exhaust particles, particularly those generated by motor vehicle tires in China. This study investigated the size distributions and influencing factors of TWPs via laboratory tests. The findings will provide a theoretical basis and scientific evidence for formulating emission standards and control policies for non-exhaust particles, advancing motor vehicle particle pollution control, improving urban air quality, and enhancing environmental sustainability.

2. Materials and Methods

2.1. Sampling Information

Based on the brand and domestic usage in the Chinese market, five tire samples were selected for wear testing, and their respective properties are shown in Table 1, including the sample number, the country of the brand, the rated load in kilograms, and the specification model.

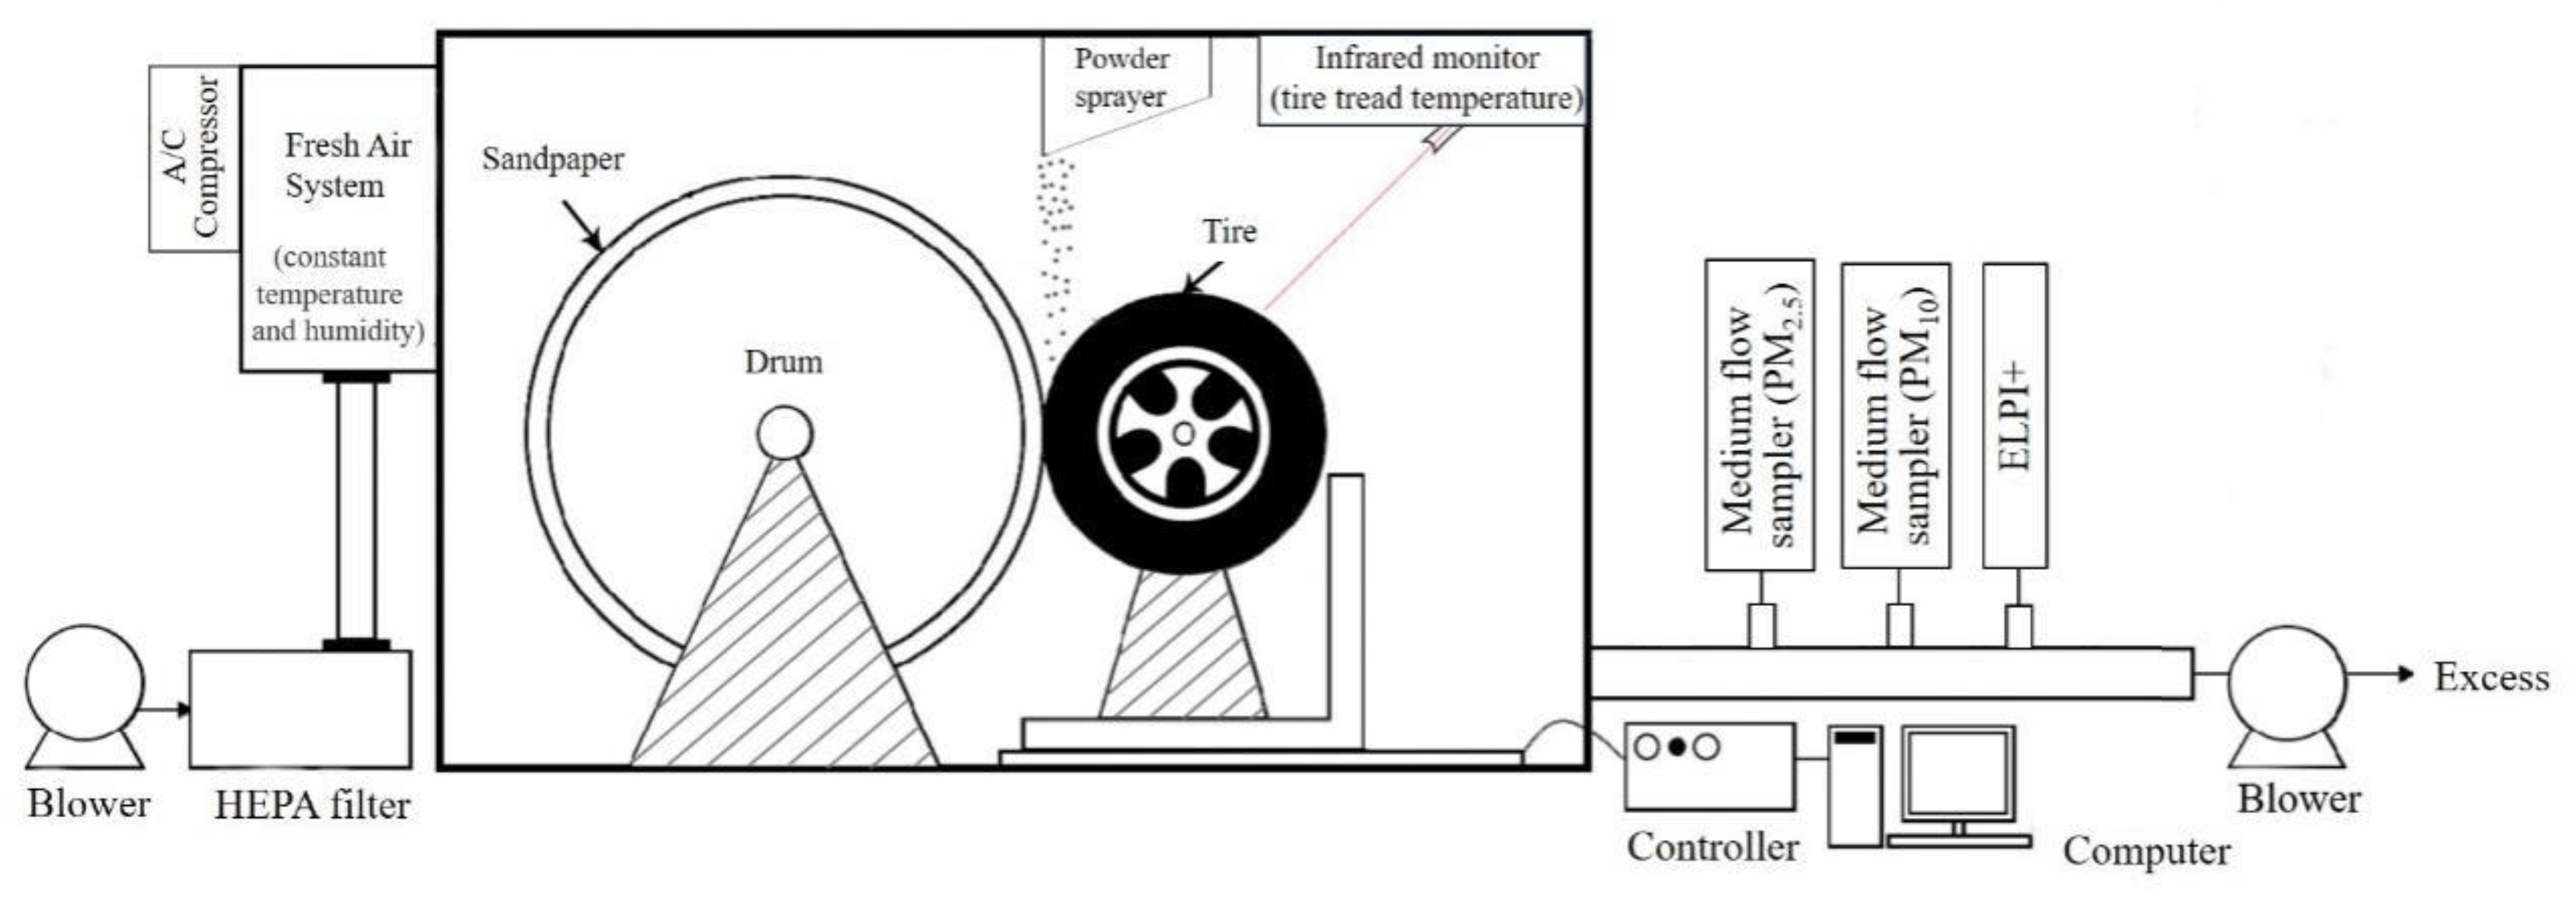
2.2. Sampling Method

The tire wear experiment involves simulating various tire conditions using a High Dynamic Outsider Wheel Tester, which consists of a control system, tire, and drum, as shown in Figure 1. The drum is roughened with tungsten carbide to increase surface roughness, and the right drum speed drives the left tire at the same speed to simulate real-world tire travel. By controlling the drum speed, tire load, tire inclination angle, and lateral deviation angle, various test conditions can be completed. The wheel tester was installed in an enclosed antistatic plexiglass chamber (length: 3.5 m × width: 2.4 m × height: 2.2 m). A fresh air system was installed at the air inlet of the chamber to reduce the influence of the background environment. According to Hagino et al.’s research [36], when the flow rate is between 0.5 and 5 m3/min, it has no significant effect on the particle emission rates. Therefore, in this study, the wind speed of the air pump was set at 6 m/s.
To monitor the distribution of TWPs beneath the tire, the Electrical Low-Pressure Impactor Plus (ELPI+) with High-Resolution Analysis Software (High-Resolution ELPI®+, Dekati, Finland) was used to monitor the particle size of emitted particulate matter [37]. It is based on the principle of inertial impact separation and measures the particle size distribution and mass concentration in the air in real time. It utilizes a data inversion algorithm that gives real-time particle size distribution in up to 500 size classes 6 nm~10 μm. In this study, the particles within the monitored size range (6 nm~10 μm) are divided into 100 size segments with a maximum time resolution of 1 s by HR-ELPI+ with a time resolution of 1 s. By spraying powder directly onto the contact face between tires and simulated road surfaces, the produced particles are better dispersed an emitted. Since the sprayed powders are pure and made of relatively coarse particles, the influence of the nanoparticle size segment, in particular, on the particle size distribution characteristic is relatively small and not variable.

2.3. Tire Wear Test Conditions

In order to understand the effects of various factors (speed, load, slip angle, and roll angle) on TWPs and emission of particulate matter, multiple combination conditions were tested in the experiment, as shown in Table 2. All conditions in the table are divided into two groups. The first group comprises conditions 1 and 0-1~0-15, which are devised to assess the individual factors’ impact on emissions. The second group encompasses conditions 1 and 2~25, aiming to comprehensively examine the particle size distribution and comprehend the diverse combinations of factors affecting tire wear and particle emissions. Among them, the 25 conditions in the second group are designed using a mixed-level orthogonal experimental design.

3. Results and Discussion

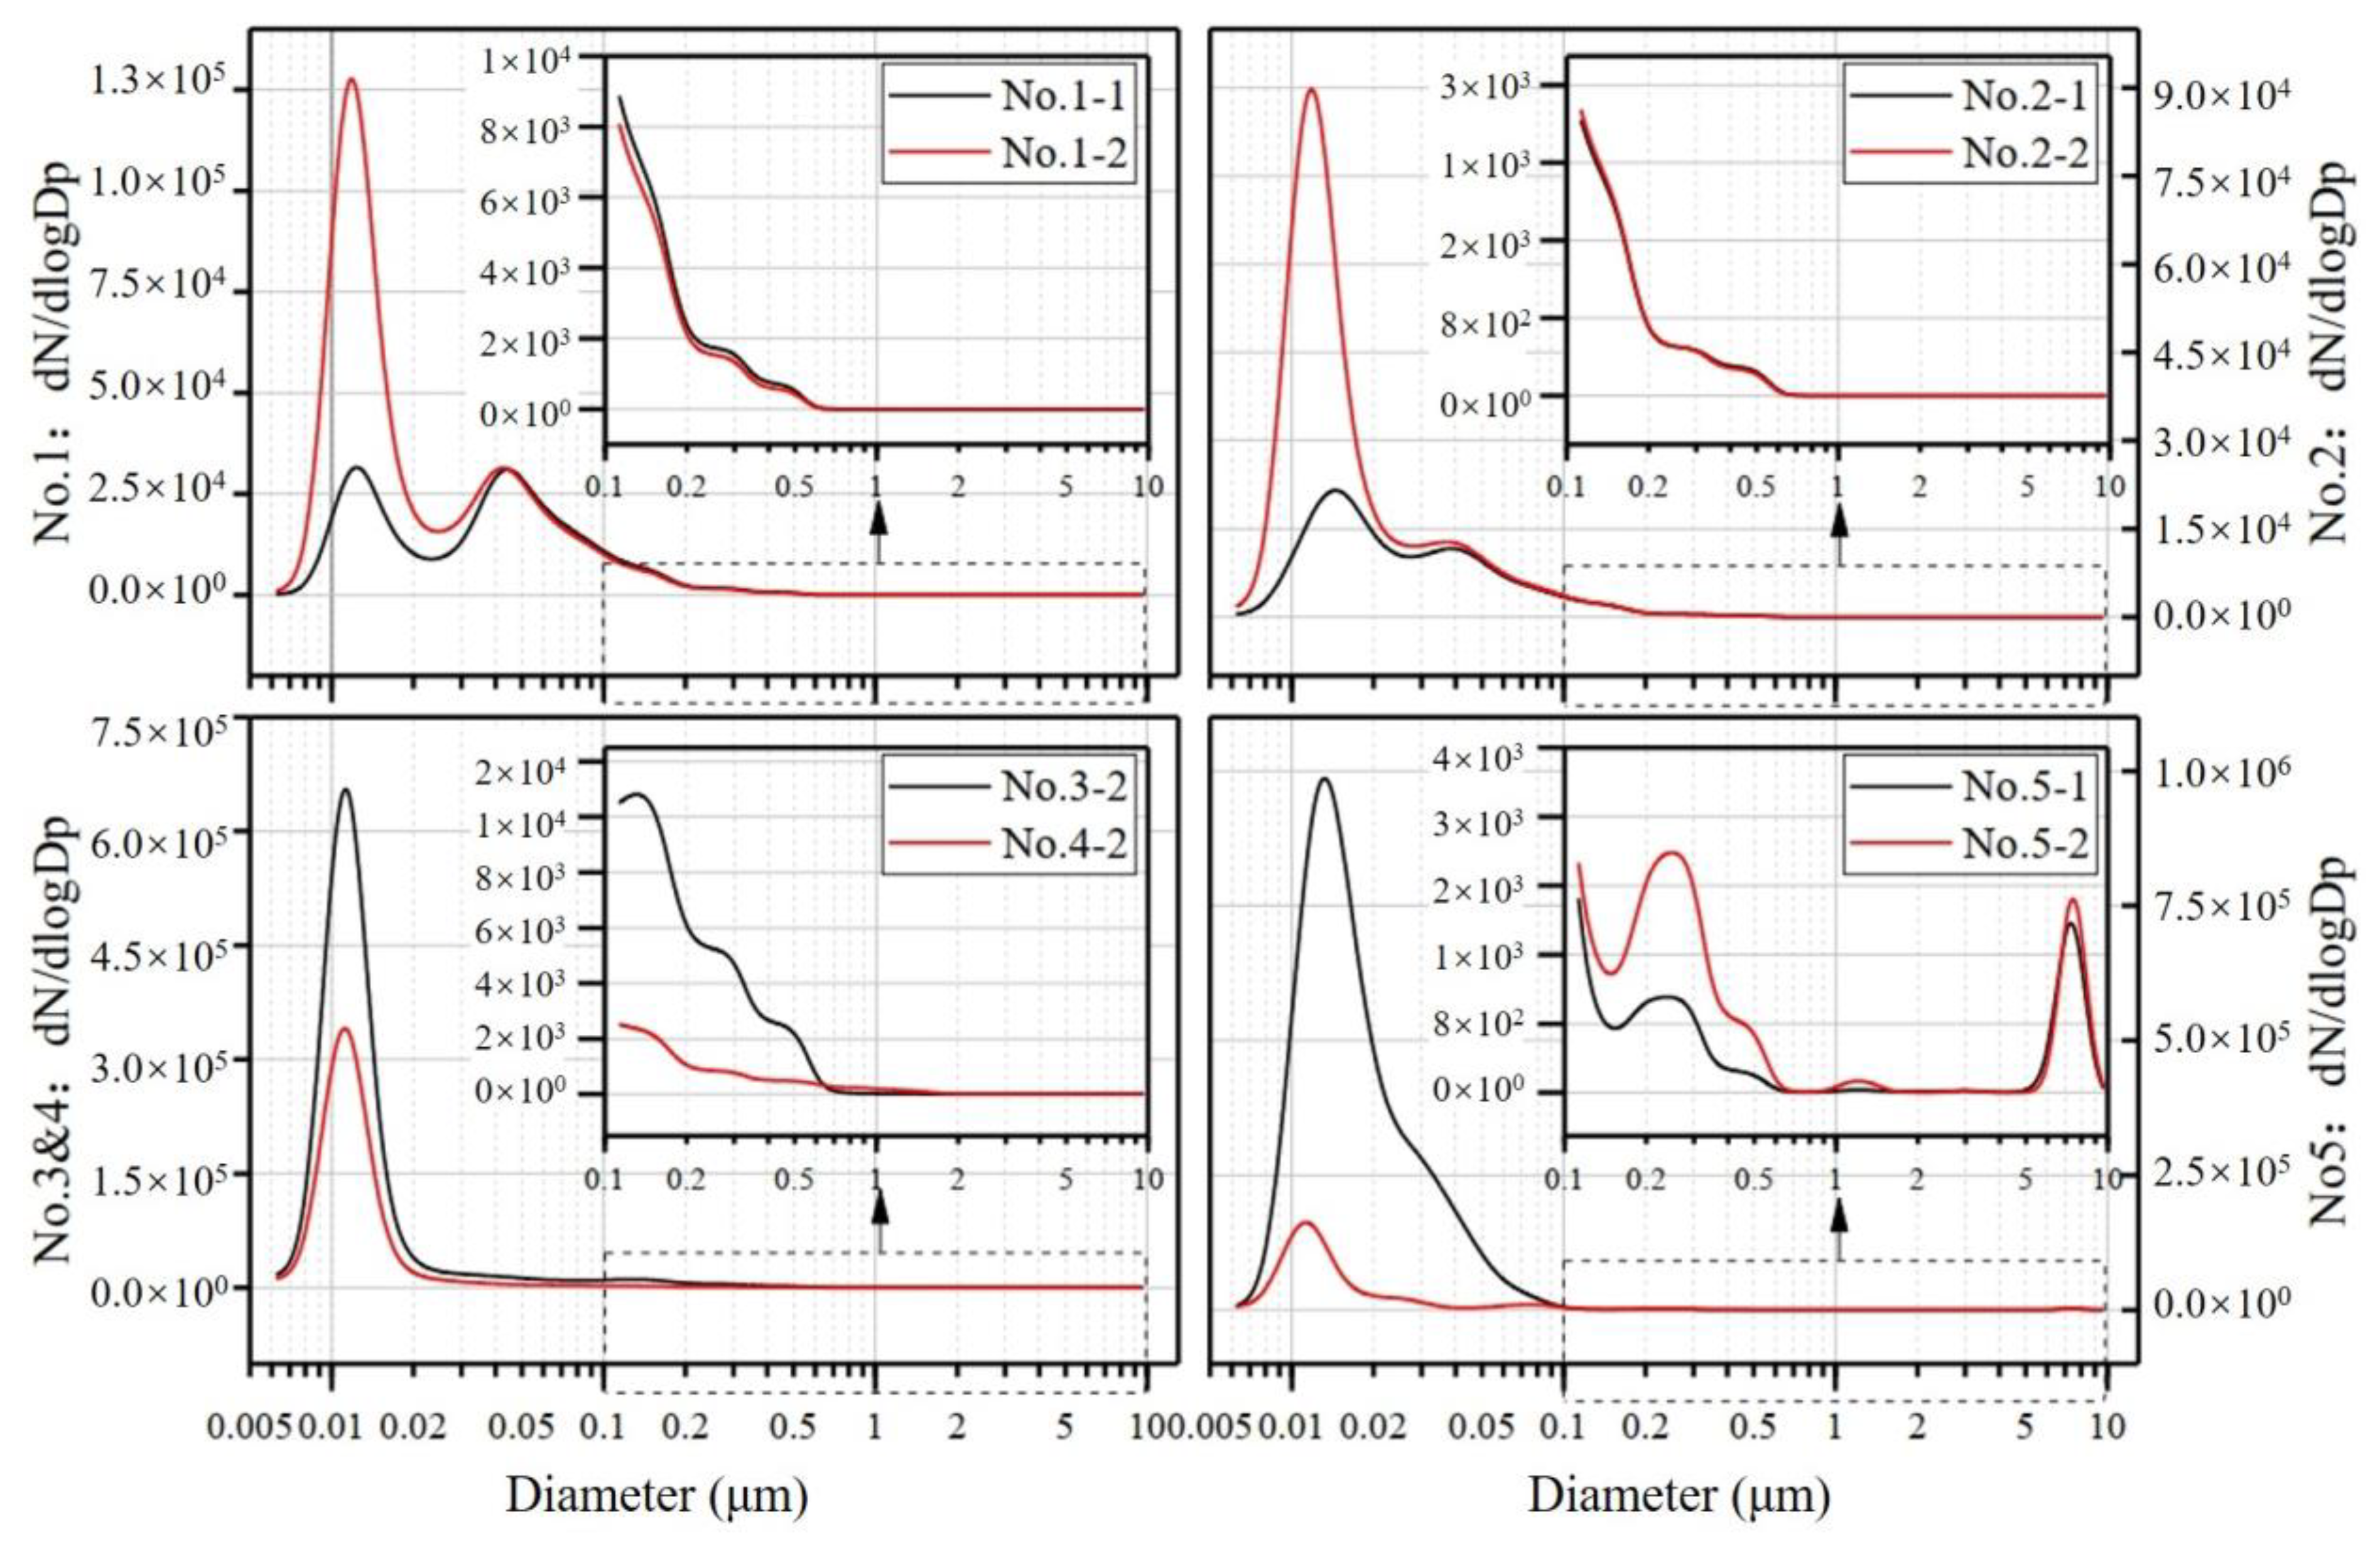
3.1. Number Distribution of TWPs

Figure 2 presents the results of a hierarchical cluster analysis on the number distribution of emitted particulate matter during tire wear processes. The figure demonstrates that the particle number distribution of the five tire samples can be divided into two categories. In Tire 1, conditions 1 to 6 and the background value belong to the first category (No. 1-1), while the other conditions belong to the second category (No. 1-2). Similarly, in Tire 2, conditions 1 to 5, 24, and the background value belong to the first category (No. 2-1), while the remaining conditions belong to the second category (No. 2-2). In Tire 3, the background belongs to the first category (No. 3-1), and all conditions belong to the second category (No. 3-2). In Tire 4, conditions 1 and the background belong to the first category (No. 4-1), while the other conditions belong to the second category (No. 4-2). Finally, in Tire 5, conditions 5, 9, 12, 16, and 20 belong to the first category (No. 5-1), and the remaining conditions belong to the second category (No. 5-2).
Figure 3 displays typical particle number distribution examples of five tire samples measured by ELPI+. According to ELPI+’s particle size range, particles can be divided into three size segments: PN0.1 (6 nm < Dp ≤ 0.1 μm, ultrafine particles), PN0.1–2.5 (0.1 μm < Dp < 2.5 μm), and PN2.5–10 (2.5 μm ≤ Dp < 10 μm, coarse particles). It is evident that the majority of emitted particles from all samples are concentrated in the PN0.1 segment, accounting for an average of 94.80% of the total particle count. Within the PN0.1 segment, at least one clear concentration peak is observed. For example, in Tire 1, there are two concentration peaks in the PN0.1 segment. In the first distribution mode (red line), the first peak appears at 13 ± 3 nm, and the second peak at 41 ± 1 nm. In the second distribution mode (black line), the first peak appears at 11 ± 1 nm, and the second peak at 26.5 ± 7 nm. Similarly, Tire 2 exhibits two concentration peaks in the PN0.1 segment. In the first distribution mode, the first peak appears at 12.8 ± 0.8 nm, and the second peak at 34 ± 7.6 nm. In the second distribution mode, the first peak appears at 10.6 ± 0.5 nm, and the second peak at 22.8 nm. Tire 3 and Tire 4 show only one concentration peak in the PN0.1 segment, at 10.8 ± 0.9 nm and 10.6 ± 0.4 nm, respectively. For Tire 5, there is one concentration peak in the PN0.1 segment, with the two distribution modes showing peaks in the same particle size range, at 10.3 ± 0.7 nm. For the first distribution mode of Tire 1, Tire 2, and Tire 5, the concentration difference between the two peaks in the PN0.1 segment is small, while in the second distribution mode, the concentration of the second peak is lower.
On average, the particles emitted from each sample in the PN0.1–2.5 segment account for only 5.18% of the total particle count at a smaller proportion as the particle emission rate increases. Only No. 5 shows one concentration peak in this size range, at 0.11 μm for the first distribution mode and 0.13 ± 0.05 μm for the second distribution mode. The number of particles emitted in the PN2.5–10 segment is very small, averaging only 0.02%. Only Tire 5 exhibits a concentration peak in this size range, with both distributions showing peaks in the same concentration range (7.08 ± 0.73 μm).
From the data presented, it is evident that the majority of TWP emissions consist of ultrafine particles, with concentration peaks occurring at sizes below 100 nm. Similar results have been found in studies on the number size distribution of TWP emissions (Table 3), such as Mathissen et al., who found that the maximum number of TWPs occurred in the range of 30–60 nm during field tests [33], and Dall’Osto et al., who found concentration peaks of TWPs at 35 nm and 85 nm during tire wear experiments [34]. As inferred from on-road and laboratory measurements, intensive driving conditions could enhance the emission of ultrafine particles and peak particle number concentrations via nucleation and condensation processes [33,35,38].

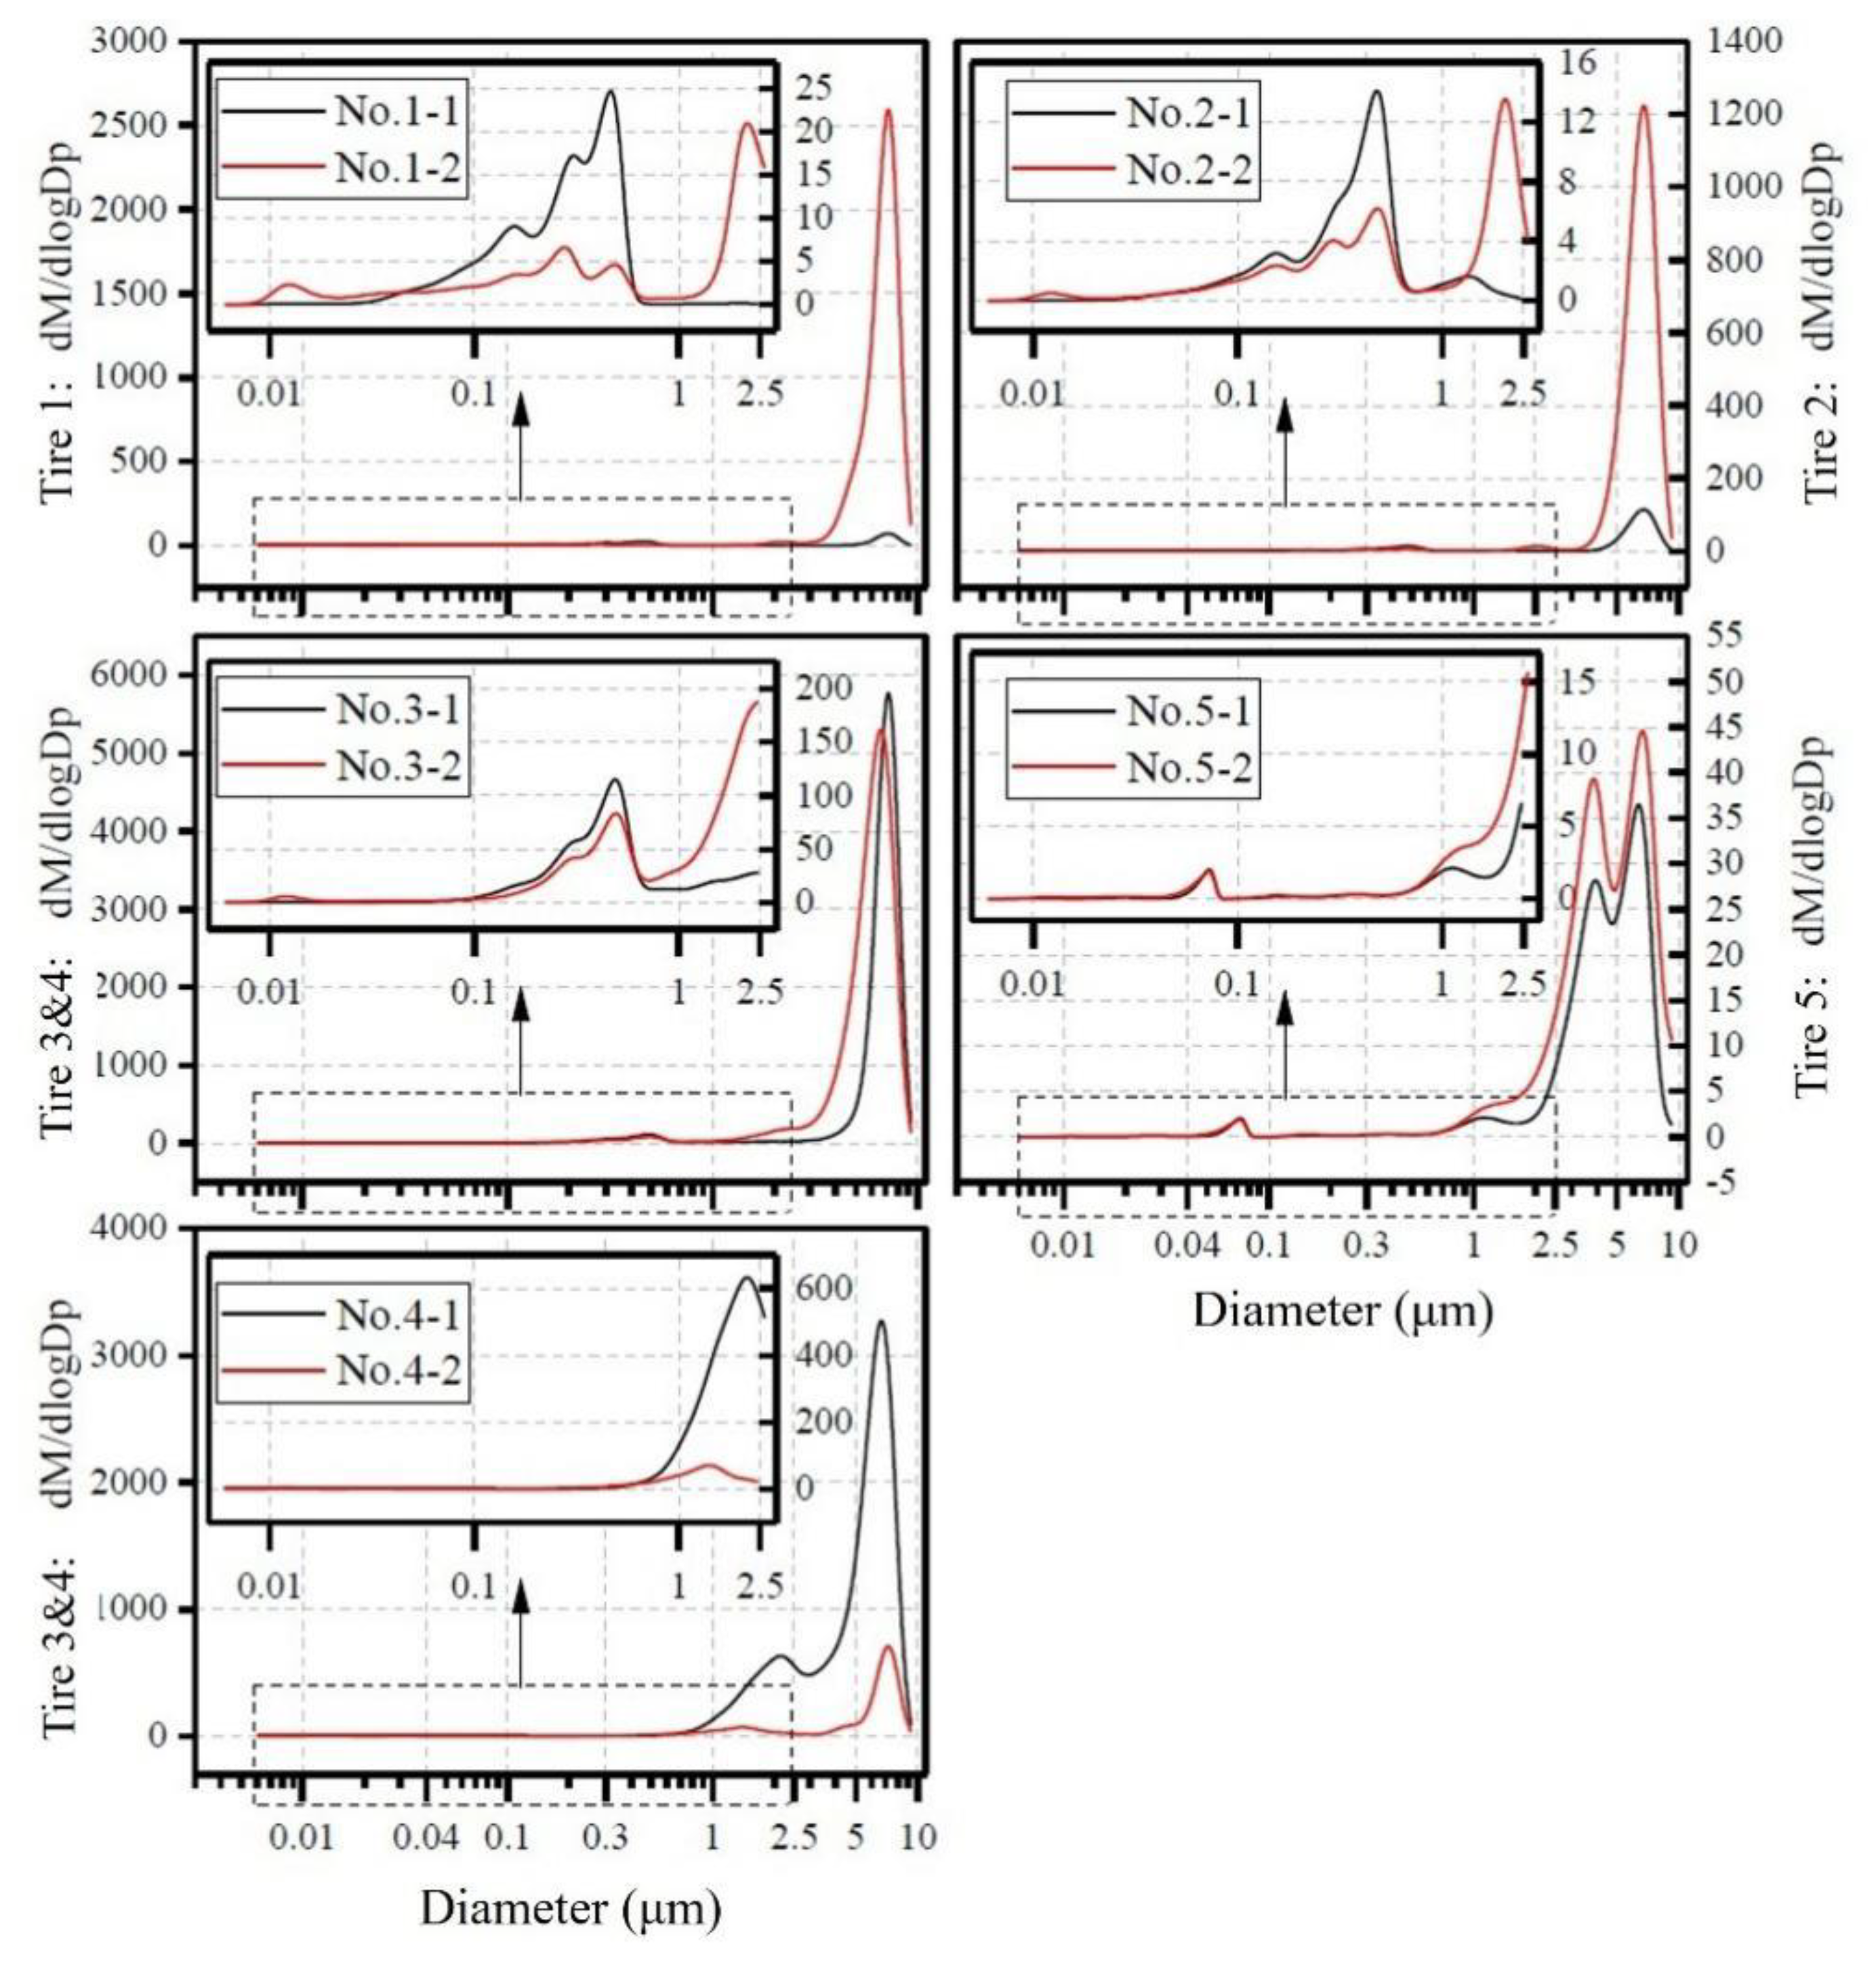
3.2. Mass Distribution of TWPs

Figure 4 provides the typical mass distribution characteristics of TWPs from tire samples. The contribution of particles in the PM0.1 size range to the total mass of emitted particles is minimal, accounting for only 0.05% on average. All samples exhibit concentration peaks in the PM0.1–2.5 size range. In sample Tire 1, particles in the PM0.1–2.5 size range contribute 30.89% on average to the total particle mass, with the first concentration peak occurring at 0.48 μm or 2.11 μm. In sample Tire 2, particles in the PM0.1–2.5 size range contribute 4.42% on average to the total particle mass, with the first concentration peak occurring at 0.33 ± 0.003 μm and the second at 2.12 ± 0.08 μm. In sample Tire 3, particles in the PM0.1–2.5 size range contribute 41.88% on average to the total particle mass, with the first concentration peak occurring at 0.49 ± 0.02 μm and the second at 2.25 ± 0.44 μm. In sample Tire 4, particles in the PM0.1–2.5 size range contribute 36.46% on average to the total particle mass, with the concentration peak occurring at 1.39 ± 0.07 μm or 2.16 ± 0.12 μm. In sample Tire 5, particles in the PM0.1–2.5 size range contribute 2.86% on average to the total particle mass, with the concentration peak occurring at 1.27 ± 0.05 μm.
The TWP emissions from tire samples also exhibit concentration peaks in the PM2.5–10 size range. The concentration peak in sample Tire 1 occurs at 6.81 ± 0.32 μm, while in sample Tire 2, it occurs at 6.88 ± 0.11 μm. In sample Tire 3, the concentration peak occurs at either 5.78 ± 0.30 μm or 6.71 ± 0.37 μm, while in sample Tire 4, it occurs at 4.43 μm or 6.83 ± 0.18 μm or 7.43 ± μm. In sample Tire 5, the concentration peak occurs at 2.53 and 7.57 ± 0.25 μm. Overall, the particle mass of TWPs is mainly composed of fine and coarse particles, with concentration peaks appearing at 0.5 μm and 1.3~2.5 μm. This result differs from the findings of Kwak et al., who detected concentration peaks at particle sizes of 2~3 μm in both test field experiments and road simulation experiments [35,38].

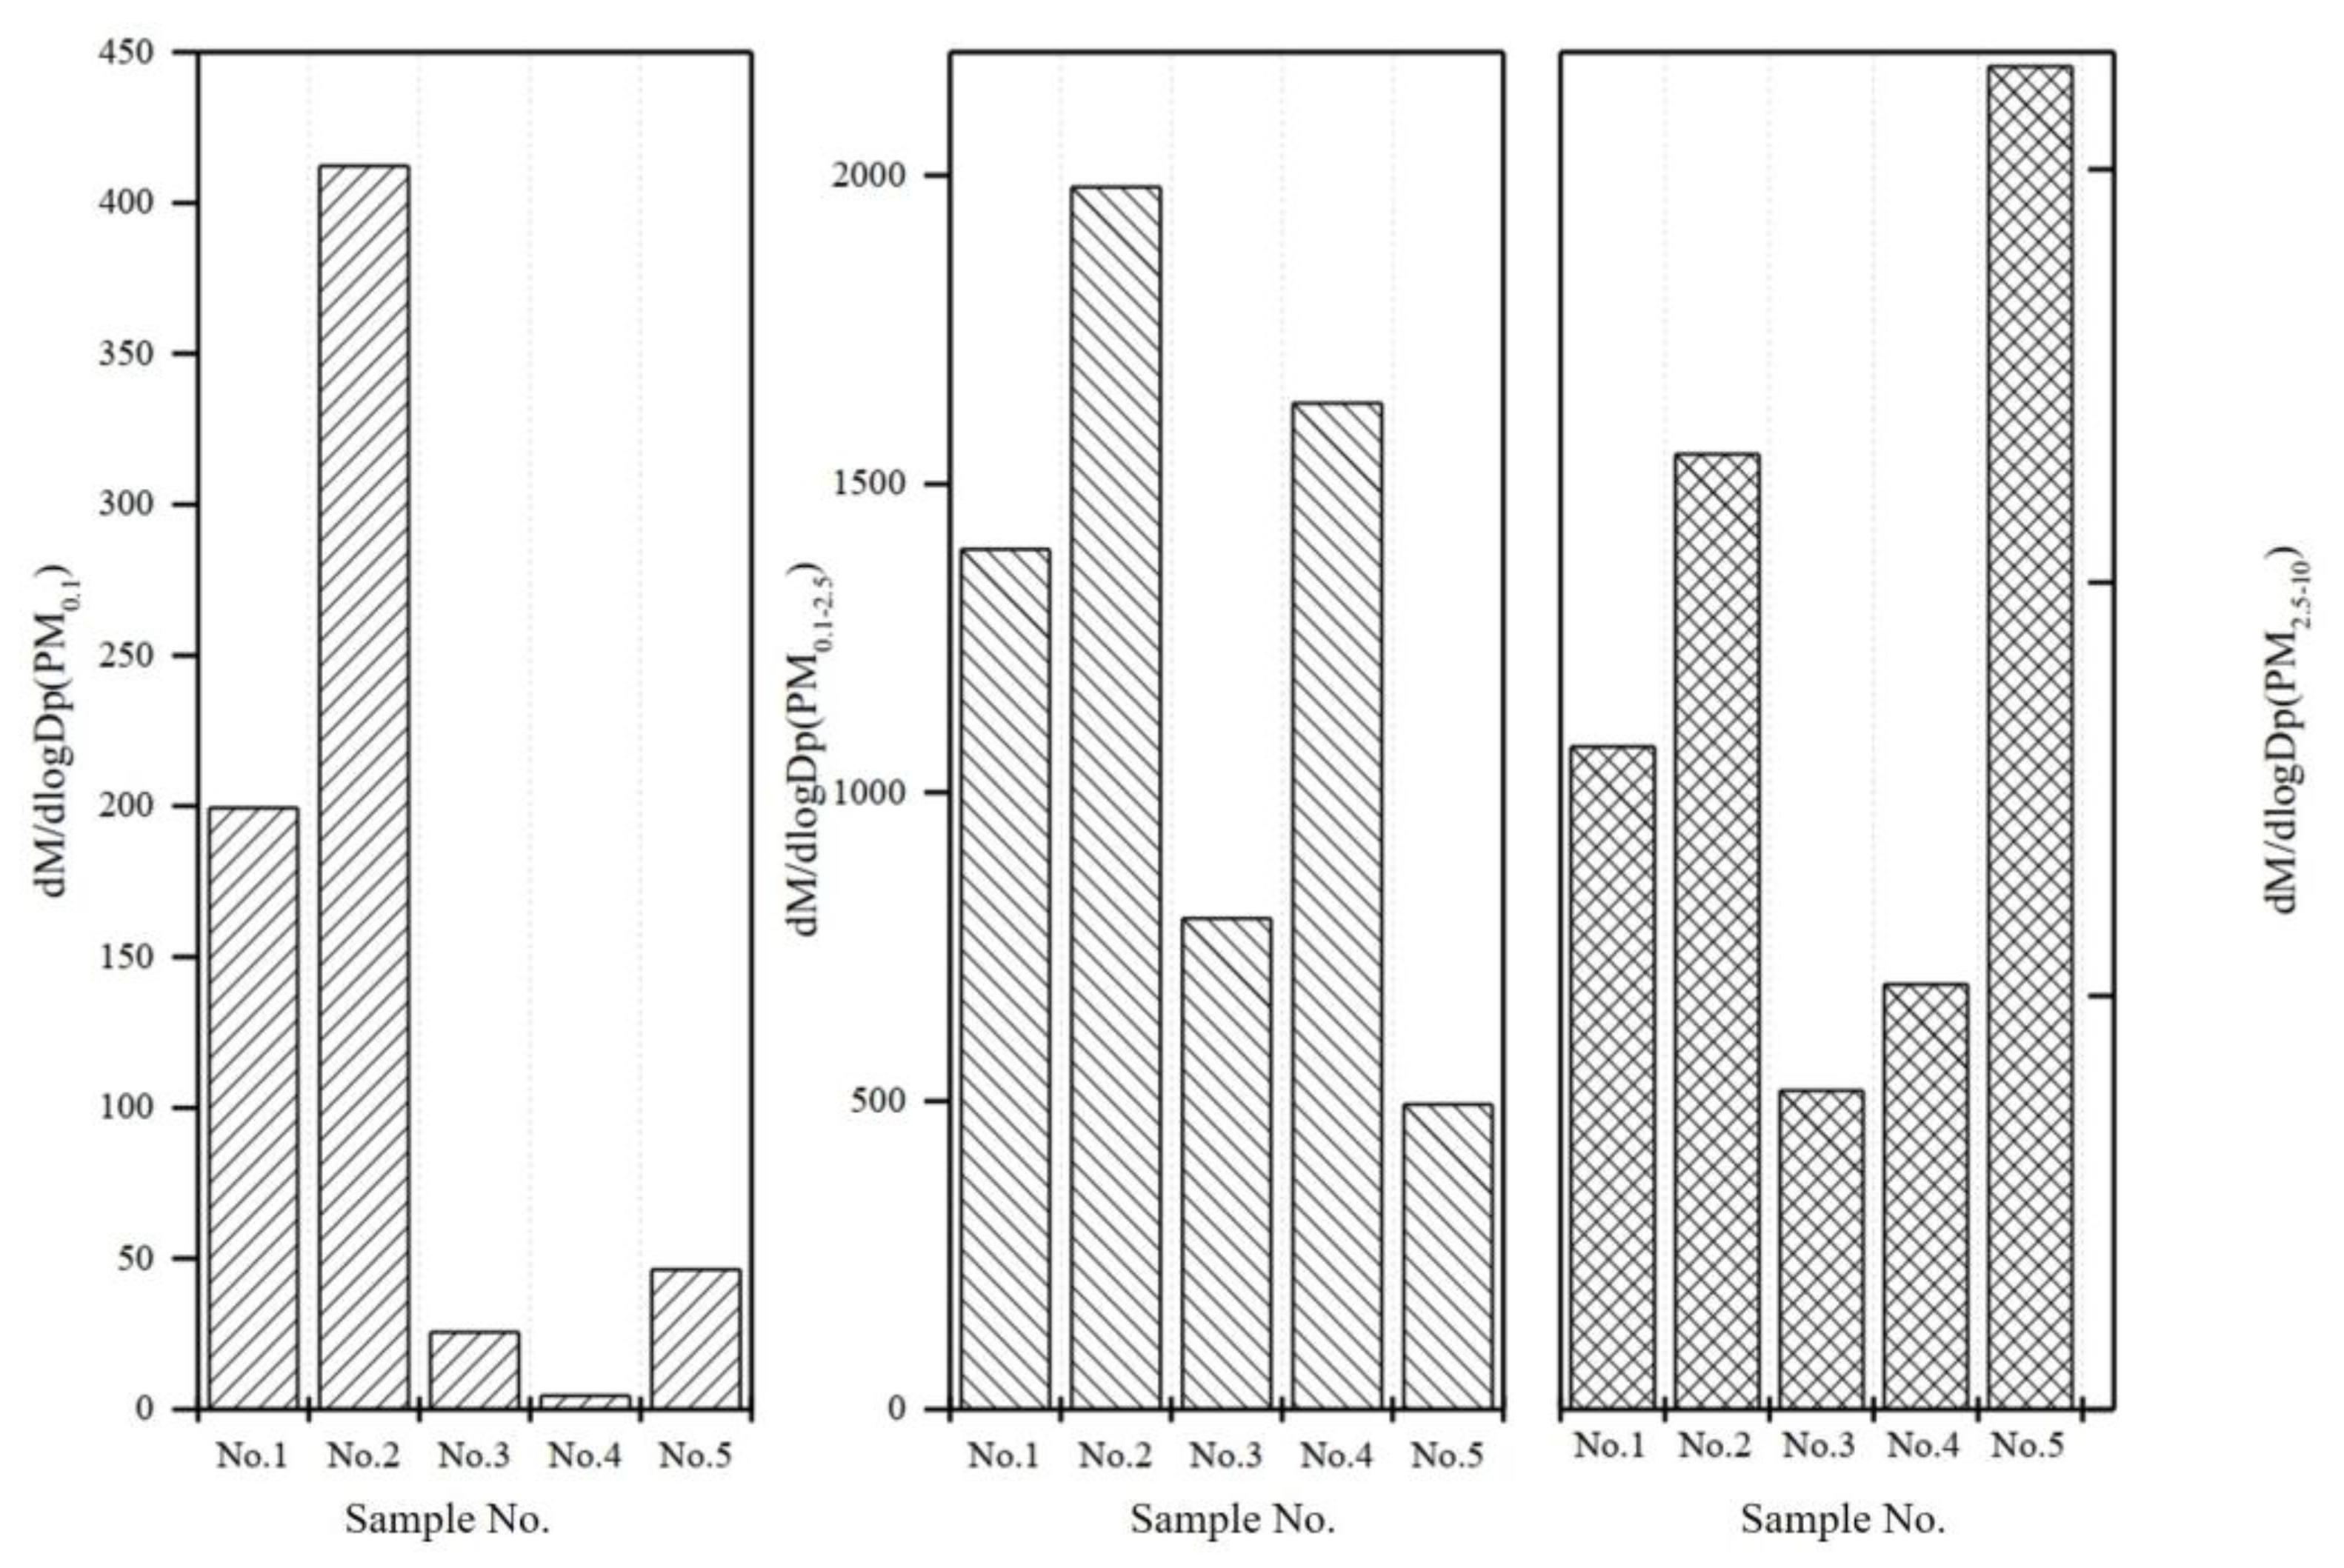
3.3. Emissions Intensity

The emission intensities including PM0.1, PM0.1–2.5, and PM2.5–10 emitted by tire samples with different specification models were investigated and compared under the same conditions (speed = 80 km/h, load = 100%, inclination = 0, yaw = 3°). As shown in Figure 5, it is apparent that there are significant differences between the samples and each sample has its unique characteristics. The contributions of PM0.1 to the particulate matters with diameters ranging within 6 nm and 10 μm from Tire 1 to Tire 5 are 0.48%, 0.20%, 0.38%, 0.04%, and 0.003%, respectively. Among them, Tire 2 has the highest emissions, followed by Tire 1, while Tire 4 has the lowest emissions. PM0.1–2.5 contributes 3.34%, 0.96%, 11.82%, 13.25%, and 0.03% of the particulate matter emissions from each sample, respectively. Tire 2 has the highest emissions, followed by Tire 4, and Tire 5 has the lowest emissions. PM2.5–10 contributes 96.18%, 98.84%, 87.80%, 86.71%, and 99.97% of the particulate matter emissions from each sample, respectively. Tire 5 has the highest emissions, followed by Tire 2, while Tire 3 has the lowest emissions. The results indicate that particles with coarser particle sizes contribute more to the emissions, in the descending order of PM2.5–10, PM0.1–2.5, and PM0.1. This suggests that the physical mechanical wear process may be the dominant process for the generation of tire wear particles. The results gave relatively controllable data but which may differ to some extent from the field experiments and road simulation experiments due to the presence of other components in the actual road surface, such as asphalt, bitumen, etc.

3.4. Analysis of Influencing Factors

The range analysis method is the predominant technique employed for interpreting results from orthogonal experiments within the realm of automotive emissions research. The range analysis results for the orthogonal experimental results in this study are shown in Table 4. The calculated range R’ is in descending order, as follows: slip angle, speed, load, and roll angle. This indicates that among these four factors, the slip angle has the greatest impact on PM10 emissions, followed by speed and load, and tilt angle has the smallest impact.
The PM10 concentration tested in the controlled variable experiment was standardized (standardized concentration = PM10 concentration/the maximum PM10 concentration obtained in each group of controlled variable experiments) to the converted PM10 concentration to between 0 and 1. Then, a fitting analysis was conducted between the standardized PM10 concentration and speed, load, slip angle, and roll angle, as shown in Figure 6 and Table 5. The results indicate that the slip angle has the most significant effect on PM10 emissions from the three tire samples, and the slip angle has a good exponential relationship with the standardized PM10 concentration (R2 > 0.999). The effect of roll angle on standardized PM10 concentration is relatively small, and as the roll angle changes, the PM10 concentration changes are also small, consistent with the range analysis results. The effect of speed on the standardized PM10 concentration of Tire 3 and Tire 4 is relatively significant, and there is a good quadratic function relationship between speed and PM10 (R2 > 0.923). The size of the tire load is related to PM10 emissions, but the differences between each sample are large. Tire 3 has a good quadratic function relationship (R2 = 0.998) between the load and PM10, while Tire 4 and Tire 5 show no clear pattern.

4. Conclusions

This study applied the tire simulator testing and investigated the emission of TWPs under different laboratory test conditions. The main findings are below.
The content of particulate matter emitted from tire wear is mainly ultrafine particles, which account for 94.80% of particles ranging from 6 nm to 10 μm. There are at least two concentration peaks for each test condition and sample, at 10~13 nm and 23~41 nm, respectively.
The mass of TWPs emitted is mainly composed of fine and coarse particles, with concentration peaks at 0.5 μm and 1.3~2.5 μm. Both the number and mass of TWPs show a bimodal distribution, and the emission intensity varies significantly among different tire samples. However, there is a good exponential relationship between the mass of PM10 emitted by tire wear and the tire slip angle. The orthogonal experimental results show that the slip angle has the greatest impact on TWP emissions, followed by speed and load, while the impact of roll angle is the smallest. The slip angle and standardized PM10 concentration have a good exponential relationship with a coefficient of determination (R2) greater than 0.999. The impacts of four influencing factors on PM10 emissions in TWPs were investigated, including slip angle, speed, load, and roll angle, where the slip angle has the greatest impact, followed by speed and load, and tilt angle has the smallest impact, showing different impacts to TWP emission, which has been acknowledged by current research.
Currently, attention from researchers investigating emission factors, regulations, and other factors related to tire wear, is simultaneously being paid to micron particles, especially for PM10 and PM2.5. In addition, ultrafine particle exposure is strongly linked to adverse health effects, and guidance for exposure limits has recently been provided by the World Health Organization (WHO) [39]. Research relating to ultrafine particles produced by tire wear process is expected to be considered in the future.

Author Contributions

Conceptualization, writing—original draft preparation, C.Z. and J.S.; writing—review and editing, J.Z.; methodology, Z.L. and T.F.; validation, X.L. and J.Y.; investigation, J.P. and L.W.; resources, Q.Z.; conceptualization, supervision and project administration, H.M. All authors have read and agreed to the published version of the manuscript.

Funding

This research was funded by CATARC Automotive Test Center (Tianjin) Co., Ltd., grant number TJKY2325004. And The APC was funded by CATARC Automotive Test Center (Tianjin) Co., Ltd., grant number TJKY2325004.

Institutional Review Board Statement

Not applicable.

Informed Consent Statement

Not applicable.

Data Availability Statement

Due to privacy the data that supports the findings of this study are available from the corresponding author, Hongjun Mao, upon reasonable request.

Acknowledgments

We acknowledge CATARC etc.

Conflicts of Interest

Authors Chongzhi Zhong, Jiaxing Sun and Zishu Liu were employed by the company China Automotive Technology and Research Center Co., Ltd. The remaining authors declare that the research was conducted in the absence of any commercial or financial relationships that could be construed as a potential conflict of interest. The paper reflects the views of the authors, not the company.

Abbreviations

AbbreviationFull name
TWPsTire wear particles
dM/dlogDpNormalized mass concentration
dN/dlogDpNormalized number concentration

References

  1. Winkler, S.L.; Anderson, J.E.; Garza, L.; Ruona, W.C.; Vogt, R.; Wallington, T.J. Vehicle criteria pollutant (PM, NOx, CO, HCs) emissions: How low should we go? Npj Clim. Atmos. Sci. 2018, 1, 26. [Google Scholar] [CrossRef]
  2. Harrison, R.M.; Allan, J.; Carruthers, D.; Heal, M.R.; Lewis, A.C.; Marner, B.; Murrells, T.; Williams, A. Non-exhaust vehicle emissions of particulate matter and VOC from road traffic: A review. Atmos. Environ. 2021, 262, 118592. [Google Scholar] [CrossRef]
  3. Ho, C.S.; Peng, J.; Yun, U.; Zhang, Q.; Mao, H. Impacts of methanol fuel on vehicular emissions: A review. Front. Environ. Sci. Eng. 2022, 16, 121. [Google Scholar] [CrossRef]
  4. Duarte, G.T.; Naas, I.d.A.; da Silva Lima, N.D. Estimating the urban environmental impact of gasoline-ethanol blended fuels in a passenger vehicle engine. Environ. Sci. Pollut. Res. 2021, 28, 63977–63988. [Google Scholar] [CrossRef] [PubMed]
  5. Lee, S.H.; Kwak, J.H.; Lee, S.Y.; Lee, J.H. On-road chasing and laboratory measurements of exhaust particle emissions of diesel vehicles equipped with aftertreatment technologies (DPF, urea-SCR). Int. J. Automot. Technol. 2015, 16, 551–559. [Google Scholar] [CrossRef]
  6. Panko, J.; Kreider, M.; Unice, K. Review of Tire Wear Emissions. In Non-Exhaust Emissions; Amato, F., Ed.; Academic Press: Cambridge, MA, USA, 2018; pp. 147–160. [Google Scholar] [CrossRef]
  7. Amato, F.; Cassee, F.R.; van der Gon, H.A.C.D.; Gehrig, R.; Gustafsson, M.; Hafner, W.; Harrison, R.M.; Jozwicka, M.; Kelly, F.J.; Moreno, T.; et al. Urban air quality: The challenge of traffic non-exhaust emissions. J. Hazard. Mater. 2014, 275, 31–36. [Google Scholar] [CrossRef] [PubMed]
  8. Keuken, M.; van der Gon, H.D.; van der Valk, K. Non-exhaust emissions of PM and the efficiency of emission reduction by road sweeping and washing in the Netherlands. Sci. Total Environ. 2010, 408, 4591–4599. [Google Scholar] [CrossRef] [PubMed]
  9. Bukowiecki, N.; Lienemann, P.; Hill, M.; Furger, M.; Richard, A.; Amato, F.; Prevot, A.S.H.; Baltensperger, U.; Buchmann, B.; Gehrig, R. PM10 emission factors for non-exhaust particles generated by road traffic in an urban street canyon and along a freeway in Switzerland. Atmos. Environ. 2010, 44, 2330–2340. [Google Scholar] [CrossRef]
  10. Nagpure, A.S.; Gurjar, B.R.; Kumar, V.; Kumar, P. Estimation of exhaust and non-exhaust gaseous, particulate matter and air toxics emissions from on-road vehicles in Delhi. Atmos. Environ. 2016, 127, 118–124. [Google Scholar] [CrossRef]
  11. Beddows, D.C.S.; Harrison, R.M. PM10 and PM2.5 emission factors for non-exhaust particles from road vehicles: Dependence upon vehicle mass and implications for battery electric vehicles. Atmos. Environ. 2021, 244, 117886. [Google Scholar] [CrossRef]
  12. European Commission. Commission Proposes New Euro 7 Standards to Reduce Pollutant Emissions from Vehicles and Improve Air Quality; European Commission: Brussels, Belgium, 2022. [Google Scholar]
  13. Thorpe, A.; Harrison, R.M. Sources and properties of non-exhaust particulate matter from road traffic: A review. Sci. Total Environ. 2008, 400, 270–282. [Google Scholar] [CrossRef] [PubMed]
  14. Rauert, C.; Rødland, E.S.; Okoffo, E.D.; Reid, M.J.; Meland, S.; Thomas, K.V. Challenges with Quantifying Tire Road Wear Particles: Recognizing the Need for Further Refinement of the ISO Technical Specification. Environ. Sci. Technol. Lett. 2021, 8, 231–236. [Google Scholar] [CrossRef]
  15. Rausch, J.; Jaramillo-Vogel, D.; Perseguers, S.; Schnidrig, N.; Grobety, B.; Yajan, P. Automated identification and quantification of tire wear particles (TWP) in airborne dust: SEM/EDX single particle analysis coupled to a machine learning classifier. Sci. Total Environ. 2022, 803, 149832. [Google Scholar] [CrossRef] [PubMed]
  16. Jarlskog, I.; Jaramillo-Vogel, D.; Rausch, J.; Gustafsson, M.; Stromvall, A.M.; Andersson-Skold, Y. Concentrations of tire wear microplastics and other traffic-derived non-exhaust particles in the road environment. Environ. Int. 2022, 170, 107618. [Google Scholar] [CrossRef] [PubMed]
  17. Johannessen, C.; Liggio, J.; Zhang, X.; Saini, A.; Harner, T. Composition and transformation chemistry of tire-wear derived organic chemicals and implications for air pollution. Atmos. Pollut. Res. 2022, 13, 101533. [Google Scholar] [CrossRef]
  18. Schallamach, A. A Theory of Dynamic Rubber Friction. Rubber Chem. Technol. 1966, 39, 320–327. [Google Scholar] [CrossRef]
  19. Nguyen, V.H.; Zheng, D.; Schmerwitz, F.; Wriggers, P. An advanced abrasion model for tire wear. Wear 2018, 396–397, 75–85. [Google Scholar] [CrossRef]
  20. Foitzik, M.-J.; Unrau, H.-J.; Gauterin, F.; Dörnhöfer, J.; Koch, T. Investigation of ultra fine particulate matter emission of rubber tires. Wear 2018, 394–395, 87–95. [Google Scholar] [CrossRef]
  21. Baensch-Baltruschat, B.; Kocher, B.; Stock, F.; Reifferscheid, G. Tyre and road wear particles (TRWP)—A review of generation, properties, emissions, human health risk, ecotoxicity, and fate in the environment. Sci. Total Environ. 2020, 733, 137823. [Google Scholar] [CrossRef]
  22. Yan, H.; Zhang, L.; Liu, L.; Wen, S. Investigation of the external conditions and material compositions affecting the formation mechanism and size distribution of tire wear particles. Atmos. Environ. 2021, 244, 118018. [Google Scholar] [CrossRef]
  23. Kim, G.; Lee, S. Characteristics of Tire Wear Particles Generated by a Tire Simulator under Various Driving Conditions. Environ. Sci. Technol. 2018, 52, 12153–12161. [Google Scholar] [CrossRef] [PubMed]
  24. Kole, P.J.; Lohr, A.J.; Van Belleghem, F.; Ragas, A.M.J. Wear and Tear of Tyres: A Stealthy Source of Microplastics in the Environment. Int. J. Environ. Res. Public Health 2017, 14, 1265. [Google Scholar] [CrossRef] [PubMed]
  25. Wagner, S.; Huffer, T.; Klockner, P.; Wehrhahn, M.; Hofmann, T.; Reemtsma, T. Tire wear particles in the aquatic environment—A review on generation, analysis, occurrence, fate and effects. Water Res. 2018, 139, 83–100. [Google Scholar] [CrossRef] [PubMed]
  26. Air Quality Expert Group. Non-Exhaust Emissions from Road Traffic; Air Quality Expert Group: London, UK, 2019. Available online: https://uk-air.defra.gov.uk/assets/documents/reports/cat09/1907101151_20190709_Non_Exhaust_Emissions_typeset_Final.pdf (accessed on 1 February 2024).
  27. Camatini, M.; Crosta, G.F.; Dolukhanyan, T.; Sung, C.; Giuliani, G.; Corbetta, G.M.; Cencetti, S.; Regazzoni, C. Microcharacterization and identification of tire debris in heterogeneous laboratory and environmental specimens. Mater. Charact. 2001, 46, 271–283. [Google Scholar] [CrossRef]
  28. Kreider, M.L.; Panko, J.M.; McAtee, B.L.; Sweet, L.I.; Finley, B.L. Physical and chemical characterization of tire-related particles: Comparison of particles generated using different methodologies. Sci. Total Environ. 2010, 408, 652–659. [Google Scholar] [CrossRef] [PubMed]
  29. Fauser, P.; Tjell, J.C.; Mosbaek, H.; Pilegaard, K. Tire-tread and bitumen particle concentrations in aerosol and soil samples. Pet. Sci. Technol. 2002, 20, 127–141. [Google Scholar] [CrossRef]
  30. Zhang, X.; Chen, P.; Liu, F. Review of Tires Wear Particles Emission Research Status. IOP Conf. Ser. Earth Environ. Sci. 2020, 555, 012062. [Google Scholar] [CrossRef]
  31. Beji, A.; Deboudt, K.; Khardi, S.; Muresan, B.; Flament, P.; Fourmentin, M.; Lumière, L. Non-exhaust particle emissions under various driving conditions: Implications for sustainable mobility. Transp. Res. Part D Transp. Environ. 2020, 81, 102290. [Google Scholar] [CrossRef]
  32. Dahl, A.; Gharibi, A.; Swietlicki, E.; Gudmundsson, A.; Bohgard, M.; Ljungman, A.; Blomqvist, G.; Gustafsson, M. Traffic-generated emissions of ultrafine particles from pavement-tire interface. Atmos. Environ. 2006, 40, 1314–1323. [Google Scholar] [CrossRef]
  33. Mathissen, M.; Scheer, V.; Vogt, R.; Benter, T. Investigation on the potential generation of ultrafine particles from the tire–road interface. Atmos. Environ. 2011, 45, 6172–6179. [Google Scholar] [CrossRef]
  34. Dall’Osto, M.; Beddows, D.C.S.; Gietl, J.K.; Olatunbosun, O.A.; Yang, X.; Harrison, R.M. Characteristics of tyre dust in polluted air: Studies by single particle mass spectrometry (ATOFMS). Atmos. Environ. 2014, 94, 224–230. [Google Scholar] [CrossRef]
  35. Kwak, J.; Lee, S.; Lee, S. On-road and laboratory investigations on non-exhaust ultrafine particles from the interaction between the tire and road pavement under braking conditions. Atmos. Environ. 2014, 97, 195–205. [Google Scholar] [CrossRef]
  36. Hagino, H.; Oyama, M.; Sasaki, S. Airborne brake wear particle emission due to braking and accelerating. Wear 2015, 334–335, 44–48. [Google Scholar] [CrossRef]
  37. DEKATI. High Resolution ELPI®+. 2019. Available online: https://dekati.com/products/high-resolution-elpi/ (accessed on 1 February 2024).
  38. Kwak, J.-H.; Kim, H.; Lee, J.; Lee, S. Characterization of non-exhaust coarse and fine particles from on-road driving and laboratory measurements. Sci. Total Environ. 2013, 458, 273–282. [Google Scholar] [CrossRef] [PubMed]
  39. WHO. WHO Global Air Quality Guidelines; WHO: Geneva, Switzerland, 2021. [Google Scholar]
Figure 1. Schematic of the tire simulator and the measurement setup.
Atmosphere 15 00423 g001
Figure 2. Clustering result of TWPs’ number size distribution of the five tire samples (Tires 1~5).
Atmosphere 15 00423 g002
Figure 3. TWPs’ number size distribution of each tire samples (Tires 1~5).
Atmosphere 15 00423 g003
Figure 4. TWPs mass distributions of each tire samples (Tires 1~5).
Atmosphere 15 00423 g004
Figure 5. Comparison of emissions on PM0.1, PM0.1–2.5, and PM2.5–10 under the same conditions.
Atmosphere 15 00423 g005
Figure 6. The impact of influencing factors on TWP emission.
Atmosphere 15 00423 g006
Table 1. Tire sample parameters.
Sample No.Country of BrandRated Load (kg)Specification Model
Tire 1South Korea690215/55 R18 95H
Tire 2Germany340195/55 R16 91H
Tire 3China690205/65 R16 95H
Tire 4Germany615195/55 R16 95H
Tire 5South Korea500195/60 R15 88H
Table 2. Tire wear test conditions.
No.Speed (km/h)Load (%)Slip Angle (°)Roll Angle (°)Factor
1407520Speed
0-1607520
0-2807520
0-31007520
0-41207520
0-5607520Load
0-6608020
0-7609020
0-86010020
0-9407510Slip angle
0-10407520
0-11407530
0-12407550
0-13607501Roll angle
0-14607502
0-15607503
2408011Orthogonal test
3409022
44010033
54010053
6607512
7608023
8609033
96010050
106010001
11807523
12808030
13809051
148010002
158010013
161007531
171008052
181009003
1910010013
2010010020
211207553
221208003
231209010
2412010021
2512010032
Table 3. Overview of the TWPs’ number size distribution in the literature.
ReferenceCountryMethodInstrumentMeasured Size RangeSize Distribution
This studyChinaTire simulatorELPI6 nm~10 μmBimodal
(10~13 nm, 23~41 nm)
Dall’Osto et al., 2014 [34]SpainTire simulatorAPS + SMPS/CPCAPS: 523 nm~20 μm
SMPS TSI3071/CPC 3022: 15~800 nm
SMPS TSI3085/CPC 3025: 5~160 nm
Bimodal (35 nm, 85 nm) (35 nm, 85 nm)
Mathissen et al., 2011 [33]GermanyTest siteEEPS5.6~562.3 nmLow speed: unimodal (70~90 nm)
High speed: bimodal (<10 nm, 30~60 nm)
Dahl et al., 2006 [32]DenmarkRoad simulationSMPS + CPC15~700 nm15–50 nm a
Kreider et al., 2010 [28]U.S.Road vacuum cleaningTOM0.3~100 μmUnimodal (50~75μm)
a Average number size distribution.
Table 4. The range analysis of TWPs’ orthogonal experiments.
Tire 3Tire 4
SpeedLoadRoll AngleSlip AngleSpeedLoadRoll AngleSlip Angle
Range (R)40,40037,86722,35594,772181,105156,56786,886266,692
Converted range (R′)36,13533,86922,49484,767161,985157,54387,427238,537
Ranking23412341
Table 5. The fitting parameters between the influencing factors and TWPs PM10 emissions.
SpeedRoll AngleLoadSlip Angle
y = C + B1 × x + B2 × x2y = A1 × exp(−x/t1) + y0
Tire 3Tire 4Tire 3Tire 4Tire 3Tire 3Tire 4Tire 5
C0.8730.1090.9730.9511.582y00.055251.04 × 10−2 1.17 × 10⁻²
B1−2.14 × 10²−4.28 × 10⁻³−1.67 × 10−23.97 × 10−2−3.84 × 10⁻²A15.72 × 10−41.0 × 10−43.84 × 10−5
B21.84 × 1049.73 × 10−58.63 × 10⁻³−7.79 × 10−33.25 × 10−4t1−0.67483−0.54625−0.49228
R20.9230.9990.9860.9990.998R20.9990.9990.999
Disclaimer/Publisher’s Note: The statements, opinions and data contained in all publications are solely those of the individual author(s) and contributor(s) and not of MDPI and/or the editor(s). MDPI and/or the editor(s) disclaim responsibility for any injury to people or property resulting from any ideas, methods, instructions or products referred to in the content.

