Abstract
Five typical in-use city buses in Tangshan with different emission standards, fuel power types, and emission control technology routes were selected as the research objects. PEMSs (Portable Emissions Measurement Systems) and OBD (On-Board Diagnostic) remote monitoring technologies were used to conduct research on actual road conditions and emission characteristics. The research aimed to analyze the driving characteristics of different power types of bus engines and after-treatment systems, as well as their impact on emissions. The results indicated that the actual road driving is mainly in the urban and suburban areas of the local region. Additionally, the VSP (Vehicle Specific Power) was found to be distributed in the low- and medium-speed range of mode Bin0~Bin24. The emission rates of each pollutant showed an increasing trend with the increase in VSP. THC and NOx emissions of CNG and LNG buses are significantly higher than those of gas–electric hybrid buses. However, the PM emissions are lower. Therefore, it is necessary to strengthen the NOx emission control of CNG and LNG buses. With the improvement in emission standards and the use of hybrid technology, CO2 and NOx emissions of China IV buses can be reduced by 13% and 53.5% compared with China III buses of the same tonnage. The CO2 and NOx emissions of China V buses using natural gas combustion and an electric mixture are 20% and 18.8% lower than those of China V buses of the same tonnage using only natural gas. In the actual operation of the diesel–electric hybrid bus equipped with the SCR (Selective Catalytic Reduction) system, the working time of the engine is about 35.5 ± 5%, and the working time of the SCR system only accounts for 65.5 ± 12%. The low working conditions of the SCR system and the low temperature of SCR system are the reasons for the high NOx concentration at the rear end of the SCR system when the hybrid electric bus is running at low speeds.
1. Introduction
City buses, as crucial tools for urban public transportation, have distinctive features such as prolonged low-speed operation, frequent stops and starts, high idling ratio, extensive mileage, and a complex mix of fuel power types. At the same time, in cities with automobile traffic, the vehicle will emit more PM, NOx, etc., which seriously affects human health [1]. Since 2010, Chinese cities have gradually replaced traditional diesel-fueled buses with those powered by cleaner fuels such as natural gas (CNG and LNG), diesel–electric hybrids, and gas–electric hybrids [2,3,4]. However, due to the high maintenance and procurement costs of diesel–electric hybrid buses, natural gas buses remain the preferred choice in developing countries. While new buses in domestic cities are predominantly electric, there is still a significant number of traditional fuel or natural gas-powered buses in the emission stages of China III to China V. Their pollutant emissions are more severe than other types of motor vehicles [5,6], making traditional buses, especially older ones, a focal point for the comprehensive control and governance of urban motor vehicle pollution. Understanding their emission characteristics is crucial in this context.
In this study, we discussed the emissions of urban buses conforming to China III to China V standards. The emission standards for these buses align with European standards and are primarily determined through emission tests conducted on engine benches. However, we found that engine bench testing cannot accurately simulate real road driving conditions, thus failing to reflect actual on-road emission characteristics. Therefore, buses complying with China V and Euro V standards (heavy-duty vehicles) require on-road emission testing using Portable Emission Measurement Systems (PEMSs). In the current market, the after-treatment systems of diesel buses (including hybrids) meeting China IV and above emission stages primarily employ SCR (Selective Catalytic Reduction) technology to reduce NOx emissions. However, there are significant differences in the combustion and emission after-treatment technologies for natural gas buses [7,8]. The primary emission control technology schemes for natural gas buses at different emission stages are as follows [9]: engines meeting China III and part of China IV stages mainly use a theoretical air/fuel ratio combustion + TWC (Three-Way Catalyst) internal and external combination technology route to control pollutant emissions. For parts of engines meeting China IV and China V stages, a lean combustion + EGR (Exhaust Gas Re-circulation) + OC (Oxidation Catalyst) or lean combustion + OC + SCR emission control scheme is employed. This approach utilizes lean combustion to reduce fuel consumption and NOx emissions, and OC and SCR emission after-treatment technologies are used to, respectively, reduce CO/THC and NOx emissions. Scholars both domestically and internationally have made significant progress in studying the emission characteristics of buses via PEMSs (Portable Emissions Measurement Systems). For instance, Guo Jiadong and others [10,11,12] utilized PEMSs to conduct on-road emission tests for Beijing China V stage diesel and natural gas vehicles, finding that natural gas vehicles have higher exhaust temperatures and can effectively reduce NOx emissions after installing SCR systems. Yang Qiang, Zhou Hua, and others [13,14,15,16,17] used OBD (On-Board Diagnostic) remote communication technology to analyze the operation and NOx emission characteristics of 11 hybrid buses with SCR systems, revealing that the hybrid buses operate in internal combustion engine mode for 32.4 ± 4% of the time, and NOx emissions increase by around 70% in winter compared to autumn. PEMSs have been widely used in several studies to test real-world on-road pollutant emissions from diesel- and CNG-fueled heavy-duty vehicles [18,19,20,21,22,23]. Barouch Giechaskiel [24] and Sheng Su [25] measured the uncertainty of the PEMS, and it was difficult to determine the type of zero drift, and there are challenges in the reliability of the PEMS measurements as the emission regulation limits decrease. Additionally, the actual road emissions of buses are not only influenced by the engine, fuel type, and emission after-treatment technology but are also significantly affected by road conditions. Scholars like Ruoyun Ma [26] and Nizar Khemri [27] used large-scale vehicle survey data to analyze real road conditions and energy consumption characteristics, while Srinath Mahesh [28] and others studied the correlation between actual road emissions and driving conditions. At present, the research has primarily focused on the actual road emissions of traditional natural gas and diesel–electric hybrid buses, with relatively less research on the actual road emissions of gas–electric hybrid and natural gas buses.
Researchers such as Ar’ antzazu G’ omez [29] used Euro 6-compliant buses for re-al-world emission comparisons, and the diesel buses emitted slightly more NOx through Selective Catalytic Reduction. However, CNG buses emitted more particulate matter, mainly concentrated in rural sections of the route. The NOx and particulate concentrations along the route indicate that traffic is a determining factor for high pollutant concentrations. Orkun Özener et al. [30] evaluated the fuel consumption and emissions of a BRT system under different operating conditions and pointed out that driving behavior has a significant effect on both the emissions and fuel consumption of the vehicle. The study showed that cumulative emissions in the vicinity of bus stops have a greater impact on public health. Fredy Rosero investigated the fuel consumption and emissions of a Euro VI compressed natural gas (CNG) city bus and a Euro V diesel city bus under real traffic conditions in Madrid, Spain, where fuel consumption and CO2 emissions increased by 6–55% for both types of buses as road class and congestion increased. Unlike the diesel bus, the NOx emissions of the CNG bus decreased by 40–50% with increasing road class and congestion [19]. Robin Smit et al. [31] evaluated the real-world gas emission performance of SCR and diesel particulate filter bus retrofits. Jiadong Guo and other researchers [32] used parallel hybrid buses with SCR and two diesel buses on real roads using PEMSs, and CNG city buses without SCR were tested for emissions [32]. All studies concluded that the impact on NOx during braking was high, SCR effectiveness was affected by cold start and coolant temperature, and the out-of-engine NOX emissions from the hybrid bus were lower than those of the diesel buses [33]. Cavan McCaffery, HanweiZhu, and other researchers [34] concluded that diesel vehicles typically exhibit higher brake NOx emissions compared to CNG vehicles, and diesel hybrids have higher emissions compared to CNG and LPG vehicles. Meng Lyu et al. [35] compared China-III and China-IV heavy-duty diesel vehicles at an altitude of 3650 m. The experimental results showed that SCR can effectively affect NOx emissions and concluded that there is a strong correlation between the relative emission factors of O2 and NOx and the average vehicle speed.
Furthermore, in order to better evaluate the pollutant emissions from vehicles, Maria Vittoria Corazza [36] proposed the iGreen model, and Zhuoqun Sun [37] proposed long short-term memory (LSTM) network-based emission models to evaluate the CO, CO2, HC, and NOx emissions from buses. On the basis of LSTM, Guo Jinquan [38] added pattern recognition, and the prediction effect of the low-speed driving cycle of urban buses was improved to some extent.
Tangshan, as a heavy industrial city along the northern coast, is also a pilot city for vehicle emission control in the “2 + 26” Beijing–Tianjin–Hebei atmospheric pollution transmission corridor. With a large vehicle population, there are significant structural differences among vehicle types, there is comprehensive coverage of various road types, and there are advanced control technologies. Tangshan is considered to be typical, representative, and a demonstration city for research purposes [39]. Currently, in Tangshan, public buses at the China VI emission stage are primarily electric, but some buses at China V and earlier stages use natural gas (including CNG and LNG), diesel, and hybrid power. In order to study and assess the actual road driving conditions and pollutant emission characteristics of typical in-use city buses with different emission stages, fuel types, and emission control technology routes, this study employed PEMS to conduct tests on the actual road driving conditions and pollutant emissions of city buses in Tangshan. A list of actual on-road bus emission factors was created and studied to analyze the influencing factors of emissions. This research aims to provide recommendations and support for local authorities in assessing and controlling emissions from urban buses and pollution prevention.
2. Materials and Methods
2.1. Test Vehicles
At present, there are 3300 city buses in Tangshan for local transit operations. These city buses are powered by engines or hybrid technology. In this paper, 5 typical bus fleets with different emission stages and power types were selected to carry out the actual road emission test, including China III~China V standard, and the CNG vehicle, LNG vehicle, parallel diesel–electric hybrid vehicle, and parallel CNG–electric hybrid vehicle. The fleets can cover more than 90 percent of Tangshan’s city buses, directly reflecting the current technical and emission characteristics.
In the Tangshan bus fleet, 5 typical buses from China III to China V emission standards, with 3 different fuel power types and emission control technology routes, were selected for on-road emission tests. Two actual road emission tests were carried out for each test vehicle according to the same test route, and the average value of the two emission results was taken as the emission result. Commercially available fuels were used in all experiments. The specific parameters of the test vehicles are shown in Table 1.

Table 1.
Bus vehicle parameters.
2.2. Test Vehicles
In this study, two experimental devices, including PEMS and on-board remote OBD terminal, were used, and the experimental tests were conducted according to the standard ‘On-board Measurement Methods and Technical Requirements for Exhaust Pollutants from Heavy-duty Diesel Vehicles and Gas Fuel Vehicles’ (HJ857-2017) [40].
- (1)
- The experimental apparatus used in this test are illustrated in Figure 1. PEMS [41], mainly consisting of the on-board exhaust gas analyzer SEMTECH-DS produced by the American company SENSORS and charged low-pressure impactor ELPI+ produced by the Finnish company DEKATI, was used to test gaseous pollutants and particulate matter emissions. The system utilizes GPS to obtain the vehicle’s actual road driving speed and geographical location, with a data frequency of 1 Hz.
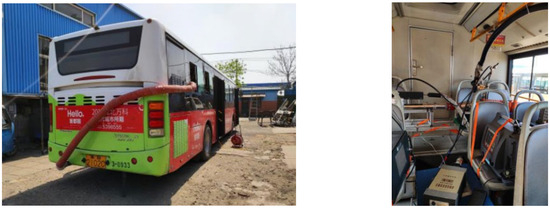 Figure 1. PEMS test vehicle on actual bus road.The SEMTECH-DS system (Figure 2) consists of a shock-resistant gas analyzer, a flow meter connected to the vehicle’s tailpipe, a computer for control and data recording, and associated sensors. Specifically, the gas analyzer uses Non-Dispersive Infrared Analysis (NDIR) to measure CO and CO2; a heated flame ionization detector (HFID) that measures THC; and Non-Dispersive Ultraviolet Analysis (NDUV), which is employed for NOx measurements. The ELPI+ [42] is utilized for the real-time online measurement of particle dynamics, including the quantity and size distribution of particles in the exhaust with diameters ranging from 0.006 to 10 μm. The testing process mainly involves particle charging, low-pressure impact, and charge measurement. Prior to entering the ELPI, the sample gas must pass through a diluter for dilution, aiming to reduce the temperature, humidity, and particle concentration of the sample gas. To increase the dilution ratio, a two-stage dilution method is employed, where the first-stage diluter and dilution air are both heated to 190 °C to prevent or reduce the condensation of semi-volatile substances in the sample gas, which could lead to measurement errors. The second-stage diluter is maintained at atmospheric temperature. After the two-stage dilution, the dilution ratio is approximately 56. To ensure the accuracy and effectiveness of the experimental data, the gas analyzer needs to be zeroed and calibrated before and after each test to ensure that the error is less than 2%. Additionally, the exhaust flow meter and ELPI+ undergo backflushing and zero calibration.
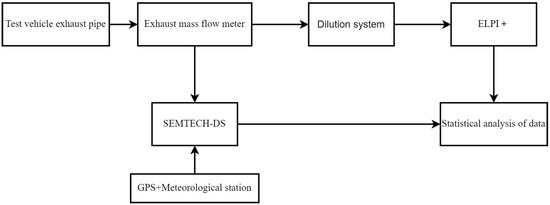 Figure 2. Spherical trapping unit hypothesis.
 - (2)
- The on-board remote OBD terminal is connected to the OBD diagnostic interface of the test vehicle for communication. Remote OBD technology is utilized to obtain actual road driving data and aftertreatment system driving conditions data from the vehicle and engine. The relevant data are processed using the “Technical Specifications for Remote Monitoring of Emissions from Heavy-duty Vehicles Part 3: Communication Protocols and Data Formats” (HJ1239.3-2021) [43], with data collection and a transmission frequency of 1 Hz.
During the test, the test vehicles followed standardized bus routes (Figure 3) with regular stops along the way and were driven by test drivers. The test route included a total of 42 bus stops, and vehicle weighting was conducted using sandbags. The principal purpose of using sandbags for counterweighting is to simulate a real load situation by applying a weight equivalent to the actual load on the vehicle to ensure the accuracy and reliability of the test. When using sandbags for weight distribution, it is necessary to ensure that the sandbags are firmly fixed on the vehicle to prevent them from moving or affecting the handling performance of the vehicle. At the same time, attention should be paid to the number and weight distribution of sandbags during the test to ensure compliance with the test requirements and standards.
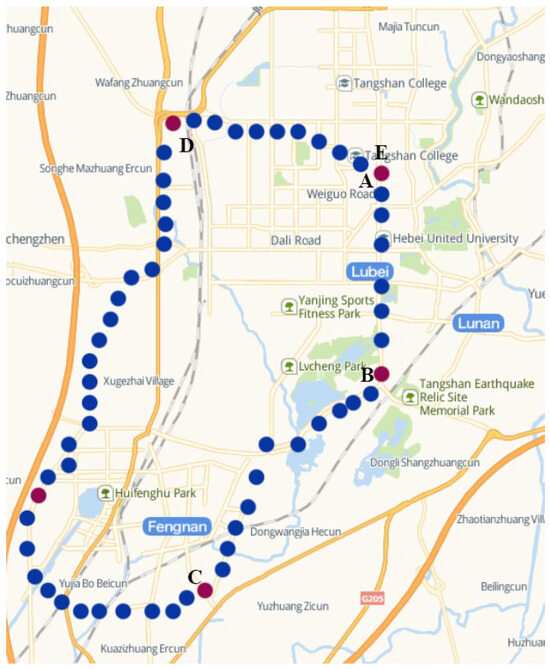
Figure 3.
Experimental vehicle driving route.
2.3. The Data Analysis Method
In order to comprehensively study and analyze the factors affecting emissions from transient characteristics, such as speed, acceleration, road gradient, etc., the data processing analysis incorporates the Vehicle Specific Power (VSP) method proposed by Jimenez Palacios from the Massachusetts Institute of Technology [44]. This method includes parameters such as transient speed, acceleration, and road gradient. The VSP systematically characterizes the changes in kinetic and potential energy as well as the work carried out by the engine to overcome air resistance and rolling friction during the actual operation of motor vehicles [45]. It is a vector quantity with physical properties. Studies by Liu Huan [46] have shown that, compared to transient parameters such as instantaneous speed and acceleration, VSP and the transient emission rates of pollutants under actual road conditions exhibit better correlation. In this research, the formula proposed by Jimenez is organized and refined to obtain the transient VSP formula:
In the formula, v represents the vehicle speed, m/s; a represents the vehicle acceleration, m/s²; and θ represents the road gradient.
Based on the actual road driving conditions and VSP, the transient driving conditions of vehicles are divided into several bins. Each bin corresponds to different pollutant emission rates, establishing a mutual relationship between transient conditions and emissions. To better analyze the relationship between VSP and emissions, and considering the characteristics of actual driving conditions, the driving conditions of vehicles are categorized into five intervals: deceleration, idling (0~1.6 km/h), low speed (1.6~40 km/h), medium speed (40~80 km/h), and high speed (>80 km/h).
Due to the limited variation in road gradient on the selected test route, a road gradient of 0 is set during data processing. Based on the actual road test data characteristics and VSP distribution, the bin interval in the study starts from less than or equal to −8 kW/t, with an increment of 2 kW/t, gradually increasing to above 12 kW/t. As shown in Table 2, a total of 38 bin intervals are determined, where Bin0 and Bin1 represent deceleration and idling intervals, respectively; Bin2-Bin13 represent low-speed intervals; Bin14~Bin25 represent medium-speed intervals; and Bin26~Bin37 represent high-speed intervals. The emission rates of various pollutants are calculated as the average values of the per second emission rates within each interval.
Table 2.
Bin division criteria for actual driving conditions of motor vehicles.
The method for calculating the actual road emission factors of the test vehicles is as follows:
In the formula, EFi represents the emission factor of pollutant i under actual road conditions, g/km; Dj represents the frequency distribution of the j bin interval, in percentage (%); ERij represents the emission rate of pollutant i in the j bin interval, g/s; and v represents the average speed under actual road conditions, m/s.
3. Results and Discussion
3.1. Distribution of Actual Road Conditions and Construction of Typical Driving Conditions
Speed and acceleration, as the most significant characteristic parameters influencing the actual road emissions and energy consumption of buses, can reflect the actual driving characteristics of motor vehicles. Using the On-Board Diagnostic (OBD) method, actual road condition data for #2 China V-Compressed Natural Gas (CNG) and #3 China IV-Diesel Hybrid buses were collected. A comparative analysis was conducted to examine the operational differences between buses powered by single fuel and hybrid power.
Figure 4 shows the speed and acceleration condition distribution during the actual road driving of the China V-CNG and China IV-Diesel Hybrid buses. Due to urban driving, road conditions, speed limits, and other factors, the actual driving speeds of the two test vehicles are mostly below 50 km/h, with accelerations concentrated in the range of −2 to 2 m/s2. Acceleration conditions are predominant, which is a core characteristic distinguishing bus conditions from those of other vehicles. The reasons for this include the complex movement conditions of bus routes, often in densely populated areas, and the frequent restarting of buses due to entering and exiting stations and yielding to pedestrians, leading to increased acceleration. Additionally, in the low-speed range where the speed is below 30 km/h, the acceleration distribution range of the China IV-Diesel Hybrid bus is significantly higher than that of the China V-CNG bus, ranging from −3 to 3 m/s2. Especially during the deceleration process, the acceleration is more intense. This is mainly because in the low-speed range, where the engine of the hybrid bus is not working and the electric motor is driving. During acceleration and braking, the torque output is faster. Therefore, it can be seen that hybrid buses have more intense and complex driving conditions during actual driving.
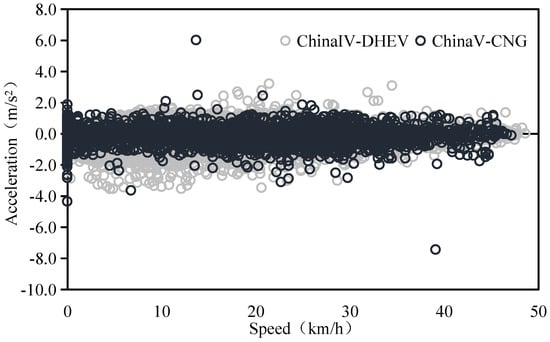
Figure 4.
Distribution characteristics of actual road speed and acceleration of experimental vehicles.
Driving behavior directly influences the actual road emissions of buses. In this study, the parameter Relative Positive Acceleration (RPA) [43] is introduced to characterize and reflect acceleration intensity and severity during the vehicle’s driving process.
The formula is as follows: ai+ represents the positive acceleration of test vehicle i at time t in seconds, m/s2.
The formula is as follows: ai represents the acceleration of test vehicle i at time t in seconds, m/s2; ∆t is the time interval between i seconds and ∆I + t, where ∆t = 1, s.
By considering the test vehicles driving in urban and suburban areas, this paper mainly analyzes urban, suburban, and comprehensive RPA characteristics. From Table 3, it can be observed that the difference in RPA distribution in the actual road driving conditions of buses is relatively large. Especially in the low-speed range, there are frequent segments of acceleration and deceleration, with the RPA reaching 0.195~0.348 m/s2, significantly higher than in suburban roads. In addition, we found that the RPA of hybrid vehicles (#3 China IV-DHEV and #5 China V-CHEV) is higher than other test vehicles generally, reaching 0.275 m/s2 and 0.256 m/s2, respectively. The main reason is that the motors of hybrid buses were started under medium and low speed, and the acceleration and deceleration were relatively obvious, resulting in aggressive driving.
Table 3.
Urban, suburban and comprehensive RPA characteristics of test vehicles.
In order to study and construct the actual road driving conditions of buses in Tangshan, our study utilized OBD remote monitoring technologies to obtain actual road driving, engine, and after-treatment system working data from 200 buses, such as speed. The researchers developed a typical Regional Driving Cycle-Bus (abbreviated as RDC-B) with real roadway driving conditions for a typical regional bus using the short-trip method and the operating condition construction method, as shown in Figure 5. A comparison of the main parameters under CHTC-B and RDC-B cycling conditions is shown in Table 4. Compared to the China CHTC-B cycle condition [46,47], the average speed and operational average speed of the bus in the RDC-B cycle condition were higher, while the average acceleration and deceleration acceleration were lower, indicating that buses experience better road conditions and smoother acceleration and deceleration processes in the actual operation. The proportions of constant speed and deceleration conditions are similar between RDC-B and CHTC-B cycle conditions, but there are significant differences in the proportions of idle and acceleration conditions. The idle condition proportion in the RDC-B cycle is only 17.8%, indicating that buses spend more time in low-speed driving conditions. In comparison to high-speed conditions, the exhaust temperature is less likely to reach the driving temperature of the SCR system in low-speed conditions. However, the increase in engine load may lead to higher NOx emissions.
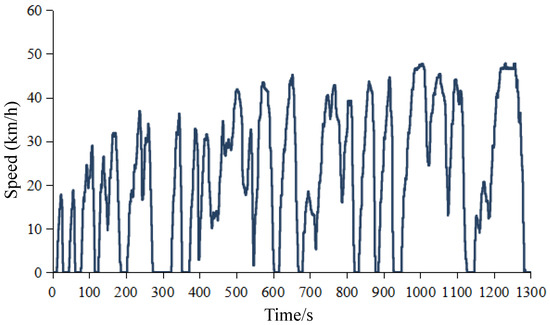
Figure 5.
Cycle of actual road driving conditions for regional bus (RDC-B).
Table 4.
Main parameter comparison between CHTC-B and RDC-B cycle conditions.
3.2. Actual Road Emission Characteristics and Variances for Different Types of Buses
Based on the calculations in Equation (2), the comprehensive emission factors of different pollutants for the experimental vehicles on actual roads are compared, as shown in Table 5.
Table 5.
Comprehensive pollutant emission factors (g/km) for different types of buses on actual roads.
From Table 5, it can be observed that there are significant differences in pollutant emissions among buses with different emission standards, fuel types, and emission control technology routes. With the improvement in emission standards and the use of hybrid power technology, the CO2 and NOx emissions of China IV diesel–electric hybrid buses have decreased by 11.5% and 41.1%, respectively, compared to China III buses. For China V stage gas–electric hybrid buses, CO2 and NOx emissions have decreased by 9.1%, 12.9%, 15.9%, and 34.2%, respectively, compared to buses using only CNG and LNG in the same emission stage.
NOx and PM, as the primary pollutants emitted by buses, show relatively higher NOx emissions for CNG and LNG fuel types compared to diesel–electric hybrid buses, ranging from 14.5 to 23.8 g/km. This is mainly attributed to the use of lean combustion technology in CNG and LNG buses at the China IV stages and above, which tends to produce higher NOx emissions. However, the adoption of OC technology in post-treatment devices cannot effectively reduce NOx emissions. In contrast, China IV diesel–electric hybrid buses equipped with SCR systems can effectively reduce NOx emissions. For CNG fuel, compared to the China III stage, there is a significant decrease in CO, CO2, and NOx emissions at the China V stage, while THC and PM emissions show an increasing trend.
In addition, the engine operation in hybrid power systems is more stable, reducing instances of rapid acceleration and high load conditions. The decreased occurrences of such events contribute to a lower average load, which is beneficial for controlling NOx emissions. However, in the case of diesel–electric hybrid buses at the China IV stage, the PM emissions are significantly higher compared to other emission stages and fuel types. This is primarily attributed to the diesel engine’s running time, which accounts for 35% of the total operation time and its higher particulate matter emissions [48].
Furthermore, single-fuel CNG/LNG buses generally exhibit lower PM emissions, controlled within 10 mg/km. On the other hand, PM emissions from China V stage gas–electric hybrid buses are higher. The main reason for this is the prolonged operation of these buses within urban areas, leading to frequent engine restarts and lower exhaust temperatures in the cylinders. This, in turn, results in incomplete fuel combustion and increased PM generation. CO2 emissions directly reflect the actual road energy consumption characteristics of buses. From the China III to China V stages and across different fuel types, CO2 emissions from buses tend to be higher. This is mainly associated with the prolonged low-speed operation of buses, leading to increased fuel consumption during actual operation. It is evident that the tightening of emission standards and the implementation of hybrid power technology both contribute to effectively reducing CO2 emissions.
The THC emissions of CNG, LNG, and gas–electric hybrid buses are generally high, especially for gas–electric hybrid buses in the China V stage, with THC emissions reaching 84.2 mg/km. The main reason for this is that buses and sanitation vehicles operate at low speeds in urban areas for extended periods. In engines running on CNG, LNG, and oil-gas hybrid fuels, the combustion of natural gas is insufficient, leading to an increase in methane (CH4) emissions. In natural gas engine THC emissions, approximately 90% of the components are CH4, and CH4 has good stability with a high ignition temperature. However, the oxidation of CH4 by oxidizing catalysts is poor, resulting in a decrease in THC reduction efficiency and an increase in emissions [49].
3.3. The Analysis of the Relationship between Actual Road Vehicle Specific Power (VSP) Bins and Pollutant Emission Rates
In order to investigate the relationship between pollutant emissions and actual road driving conditions for buses with different emission standards and fuel types, Figure 6, Figure 7, Figure 8, Figure 9 and Figure 10 depict the variation in gaseous pollutants and PM emission rates for buses in the China III to China V emission stages under micro-scale driving conditions.
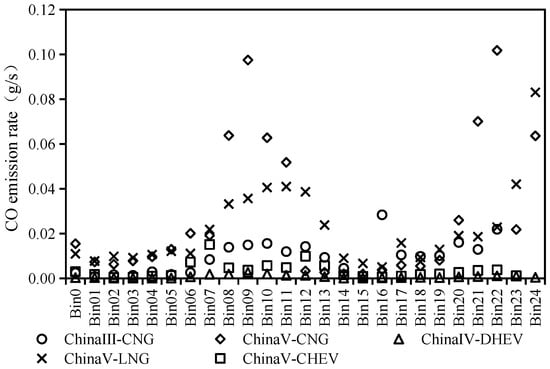
Figure 6.
Distribution of CO emission rates of different emission stages and fuel types.
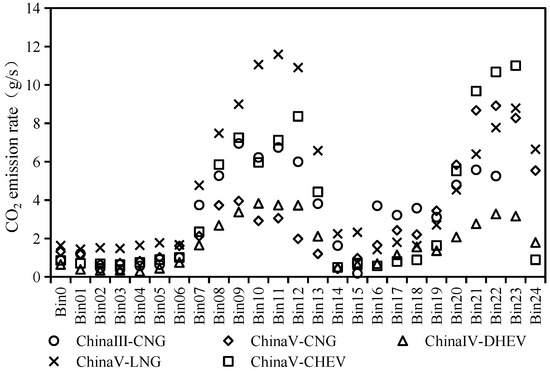
Figure 7.
Distribution of CO2 emission rates of different emission stages and fuel types.
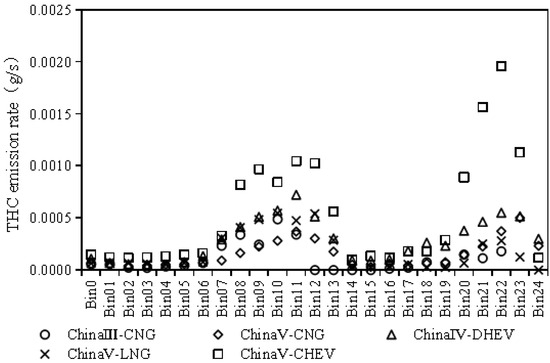
Figure 8.
Distribution of THC emission rates of different emission stages and fuel types.
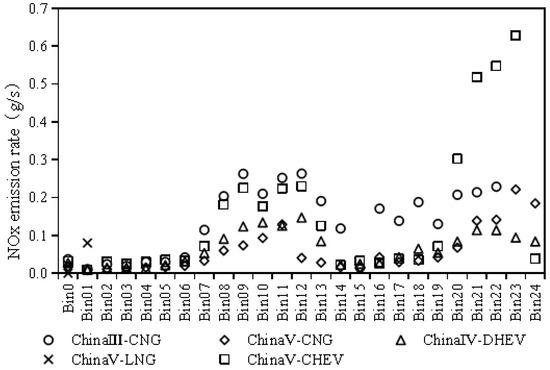
Figure 9.
Distribution of NOx emission rates of different emission stages and fuel types.
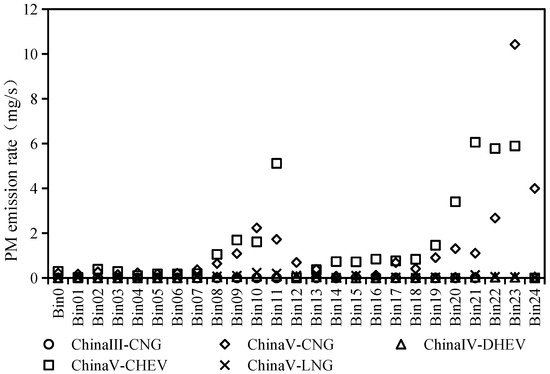
Figure 10.
Distribution of PM emission rates of different emission stages and fuel types.
Overall, the experimental vehicles primarily operated in urban and suburban areas, with emissions specific to power output distributed across Modal Bins 0 to 24 in the low- and medium-speed ranges. As VSP increased, the emission rates of various pollutants exhibited an upward trend. With the exception of hybrid buses, buses of other fuel and power types showed a decreasing trend in gaseous pollutant emissions with increasing speed. However, diesel–electric hybrid buses show a trend of “first decrease, then increase, then decrease”, while gas–electric hybrid buses show a trend of “first increase, then decrease”. This is mainly attributed to the fact that hybrid buses often rely on electric motors at low speeds and switch to fuel-only operation at higher speeds. The particulate matter mass and number emissions from diesel–electric hybrid buses followed the same trend as gaseous pollutant emissions, whereas gas–electric hybrid buses showed an increase with speed.
3.3.1. The Characteristics of CO Emission
The CO emission rates for all five types of buses show an increasing trend in the low- and medium-speed ranges. The primary reason for this is that as the VSP increases, the engine load and fuel injection quantity also increase. This leads to an overly rich air–fuel mixture in the engine cylinder, causing incomplete combustion of the fuel and resulting in an increase in CO emissions. Meanwhile, in most Bin ranges, the CO emission rates of China III stage CNG buses and China IV stage diesel–electric hybrid buses are higher than those of China V stage CNG, LNG, and gas–electric hybrid buses. The main reasons for this analysis are as follows: CNG buses of China III stage are not equipped with emission after-treatment devices, making it impossible to purify CO emissions externally. China IV stage diesel–electric hybrid buses are powered by two systems: a diesel engine and an electric motor. During low- and medium-speed driving, the engine and motor automatically switch power modes based on the actual road conditions, leading to incomplete combustion of the mixed gas in the engine cylinder. In addition, the exhaust temperature of the after-treatment unit fluctuates greatly, resulting in increased CO emissions.
3.3.2. The Characteristics of CO2 Emission
At idle and low speeds, the CO2 emission rates of all types of buses are relatively low and show minimal differences. However, as VSP increased, the bus speed and acceleration rose, necessitating an increase in fuel injection to enhance power, resulting in increased CO2 emissions. In the case of CNG buses, the CO2 emissions of China V vehicles are reduced by approximately 40% to 60% compared to China III counterparts. For gas–electric hybrid buses at China V, the CO2 emissions are slightly higher (10% to 20%) than those of China IV diesel–electric hybrid buses. This is primarily attributed to the lower compression ratio and lower thermal efficiency of natural gas engines using lean combustion. Despite the lower carbon-to-hydrogen ratio of natural gas compared to diesel, the CO2 emissions from its engine are still higher. Simultaneously, in comparison to traditional CNG, LNG, and other fuel-powered buses, diesel–electric hybrid buses exhibit a significant reduction in CO2 emissions in low- and medium-speed ranges. The main reason for this lies in the control strategy of parallel hybrid buses, which contrasts with the characteristics of conventional diesel engines and is closely tied to engine speed and vehicle speed. In low-speed and low-power-demand scenarios, parallel hybrid diesel–electric buses keep the engine idle, with the vehicle being entirely driven by the electric motor. Since the energy of the electric motor is primarily recovered during deceleration, it reduces the engine power requirements, consequently decreasing fuel consumption and CO2 emissions.
3.3.3. The Emission Characteristics of THC
CNG, LNG, and gas–electric hybrid buses have higher THC emission rates than diesel–electric hybrids. In addition to the natural gas engine, air combustion is relatively small, but the natural gas fuel itself has a direct relationship with the higher auto-ignition temperature. The automotive diesel fuel atomization effect is better than LNG, and the fuel ignition point is smaller than natural gas, so diesel and hybrid bus THC emissions are significantly smaller than those of LNG vehicles, mainly because the dilution of diesel combustion is higher than the degree of natural gas engines. In particular, in the National V stage, gas–electric hybrid bus THC emissions are higher than those of CNG and LNG buses by 1.5~2 times. The main reasons for this were analyzed: Firstly, the gas–electric hybrid bus is the main electric power driver in the actual road operation, the engine is a supplement, the engine exhaust temperature is low, and it is difficult to reach the TWC starting temperature, resulting in a decline in the efficiency of the THC purification. Secondly, the gas–electric hybrid bus automatically and frequently switches the motor and engine operation modes according to the actual road conditions, which leads to the failure of natural gas fuel burning in the engine, and thus methane (CH4) gas is discharged, increasing THC emissions.
3.3.4. The Characteristics of NOx Emission
In comparison to China IV stage diesel–electric hybrid buses, the NOx emissions of China III stage CNG buses, and China V stage CNG, LNG, and gas–electric hybrid buses show a significant increase. The NOx emissions of China III stage CNG buses are 1.2 to 2 times higher than those of the China V stage, utilizing TWC after-treatment technology. This is mainly attributed to the improvement in engine in-cylinder purification technology and Exhaust Gas Recirculation (EGR) efficiency with the upgrade of emission standards to reduce NOx emissions. The primary reasons for increased NOx emissions are the impact of traffic control and road congestion during actual road operations, which intensify the vehicle acceleration and deceleration processes. Frequent engine start–stop cycles lead to unstable engine operation, resulting in difficulty achieving a normal exhaust temperature and a reduction in the efficiency of the SCR system. Furthermore, among China V stage buses using CNG, gas–electric hybrid, and LNG fuels, NOx emissions increase sequentially, especially with LNG buses emitting approximately 2.5 times more NOx than CNG buses. The main reasons for this are that (1) LNG buses adopt SCR after-treatment technology, while CNG buses use an engine combustion equivalence ratio combined with TWC after-treatment technology; (2) natural gas engines have higher exhaust temperatures, and in conditions of lower vehicle speed, the SCR system of natural gas buses effectively reduces NOx emissions.
3.3.5. The Characteristics of PM emission
The PM mass emissions of China III stage CNG buses, China V stage CNG buses, and LNG buses are significantly lower than those of China IV stage diesel–electric hybrid buses and China V stage gas–electric hybrid buses. The main reasons are as follows: (1) natural gas fuels (CNG and LNG) lack carbon chain elements in their molecular chain structure, making it challenging to form aggregated modal particles, which primarily exist in the form of nucleation mode particles; (2) as a gaseous fuel, CNG is easily and evenly mixed with air during the intake process, which is conducive to the full combustion of the mixture and inhibits the generation of solid carbon soot particles. Additionally, for diesel–electric hybrid buses and gas–electric hybrid buses, during low- and medium-speed driving with increasing VSP, especially in the Bin09~Bin11 and Bin19~Bin24 ranges, the engine speed and load increase, leading to a rise in fuel consumption per unit time. The automatic switching between the motor and the engine under different driving conditions results in incomplete combustion in the engine cylinder. This, coupled with the generation of particles at high temperatures in the fuel and steam mixture, makes it difficult to effectively reduce PM emissions with an after-treatment system mainly utilizing EGR + OC or EGR + SCR technologies.
Compared to natural gas buses burning at the theoretical stoichiometric air/fuel ratio (TWC route), natural gas buses with lean combustion (OC and OC + SCR routes) exhibit lower PM emissions. This could be attributed to the OC playing a reducing role in the particulate matter’s soluble organic fraction (SOF), while also reducing the presence of semi-volatile organic compounds in the exhaust. This reduction decreases the opportunities for these compounds to condense into particulate matter.
3.4. The Influence of Engine and After-Treatment System Working Conditions on Emissions
Selecting experimental vehicle #3 equipped with the SCR system as the subject of study, we utilized on-board remote OBD remote monitoring technologies to obtain data on the engine and after-treatment system working conditions over the course of one month. The research aims to analyze the engine working ratio and SCR system working ratio of the diesel–electric hybrid bus.
Through an analysis of data from experimental vehicle #3, as shown in Figure 11 it was found that the actual driving time ratio of the engine in diesel–electric hybrid buses was approximately 35.5 ± 5%. During this process, the SCR system operated for only about 65.5 ± 12% of the time. This result is generally consistent with related findings by Yang Qiang et al. [13]. Driving conditions, mainly at idle and low to medium speeds, are the primary reasons for buses being in electric mode for an extended period, leading to the SCR system not working during engine operation and reduced efficiency of the SCR system. Additionally, the low engine working ratio contributes to lower fuel consumption as well as reduced emissions of NOx and THC. However, with the engine frequently starting and stopping, incomplete combustion of fuel in the engine cylinder leads to increased CO and PM emissions, with PM emissions reaching emissions as high as 52.3 g/km. Therefore, for hybrid buses, while controlling NOx emissions, it is essential to coordinate the control of PM emissions.
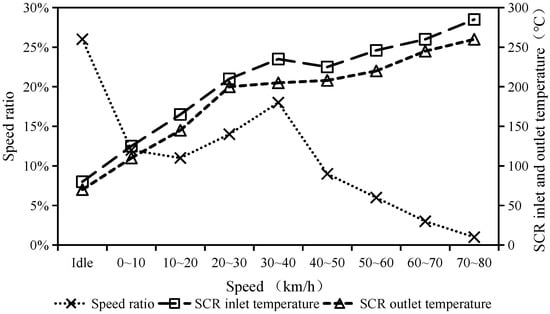
Figure 11.
Characteristics of SCR system outlet NOx concentration and urea injection quantity variation in different speed ranges.
Parallel hybrid buses have smaller engine power and lower exhaust temperatures. Under the same vehicle conditions, the urea injection time ratio of parallel hybrid buses is significantly lower than that of conventional diesel-powered buses. The urea injection time ratio is only around 20% when the VSP value is low, gradually increasing with the instantaneous power of the vehicle. As shown in Figure 12, with the gradual increase in vehicle speed, the NOx concentration at the outlet of the SCR system exhibits a “decrease-rise-decrease” characteristic. The urea injection amount slightly increases when idle and in the low to medium speed range of 0–50 km/h, followed by a substantial increase at speeds ≥50 km/h. Under all driving conditions, the NOx emission concentration remains below 800 × 10−6, lower than the original emissions of similar models. This further indicates that the addition of the SCR after-treatment system significantly reduces NOx emission concentrations at different vehicle speeds. There are variations in NOx emissions and urea injection amounts at different speeds. As the vehicle speed gradually increases within the low-speed range of 20–30 km/h, the urea injection amount increases while NOx continuously decreases, dropping from an average of 570 × 10−6 to an average of 410 × 10−6. This is due to the initially low level of NOx emissions, and as the SCR system outlet temperature rises, the proportion of SCR system operation within this range gradually increases. In the medium-speed range of 30–50 km/h, the NOx concentration initially rises to an average of 615 × 10−6 and then decreases to 215 × 10−6 in the high-speed range of 50–80 km/h. In this process, the increase in engine load leads to an increase in NOx emissions, while the rise in urea injection amount results in a gradual increase in the efficiency of SCR in reducing NOx emissions. The combined effect of these two factors causes the NOx emission concentration to exhibit a “decrease-rise” trend. Overall, the higher NOx concentrations with the SCR system during low-speed operation were attributed to the SCR system not operating and the reduced efficiency of the low-temperature conversion, which did not meet the operational requirements. During medium-speed operation, the urea injection amount of the SCR system cannot match the original NOx emissions from the bus engine, resulting in higher NOx concentration behind the SCR system.
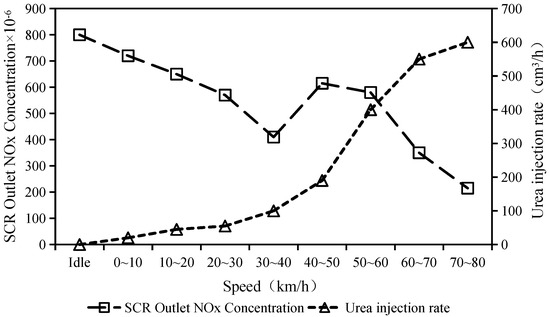
Figure 12.
Characteristics of SCR outlet NOx concentration and urea injection rate variation in different speed ranges.
4. Conclusions
This study focuses on typical urban buses in use in Tangshan City, considering five different emission standards, fuel power types, and various emission control technology routes. Utilizing PEMSs and OBD remote monitoring technology, we conducted an in-depth investigation into real road conditions and emission characteristics. The aim was to analyze the driving characteristics of bus engines and after-treatment systems based on different power types and their impact on emissions. The main findings of this study are as follows:
- (1)
- CNG, LNG, and gas–electric hybrid buses exhibit significantly higher THC and NOx emissions compared to diesel–electric hybrid buses. Compared to diesel–electric hybrid buses, NOx emissions of CNG and LNG fuel-type buses are relatively higher and reach from 16.8 to 23.8 g/km. However, the PM emissions are lower than those of diesel–electric hybrid buses.
- (2)
- Compared to China III CNG buses, the CO2 and NOx emissions of China IV diesel–electric hybrid buses decreased by 11.5% and 41.1%. In addition, compared to China V CNG and LNG buses, the CO2 and NOx emissions of China V gas–electric hybrid buses decreased by 9.1% and 12.9%, and 15.9% and 34.2%, respectively. The results of this study show that considering the reduction in fuel consumption and NOx emissions, hybrid technology, especially diesel hybrid technology, should be promoted and used in city buses.
- (3)
- For diesel–electric hybrid buses equipped with SCR systems, the engine working time ratio is approximately 35.5 ± 5%, and, during this period, the SCR system operates for only about 65.5 ± 12%. The urea injection amount slightly increases when idle and in the low- to medium-speed range of 0–50 km/h, followed by a substantial increase at speeds ≥50 km/h. The SCR system failing to reach the operational conditions and the low temperature of the SCR catalyst are the reasons behind the higher NOx concentration with the SCR system during the low-speed operation of hybrid buses.
With improvements in emission standards and the use of hybrid power technology, the CO2 and NOx emissions of China IV diesel–electric hybrid buses have decreased by 11.5% and 41.1%, respectively, compared to China III buses. For China V stage gas–electric hybrid buses, CO2 and NOx emissions have decreased by 9.1% and 12.9%, and 15.9% and 34.2%, respectively, compared to buses using only CNG and LNG in the same emission stage. Therefore, considering the reduction in fuel consumption and NOx emissions, hybrid technology, especially diesel hybrid technology, should be promoted and used in city buses based on the results of this study.
Author Contributions
Conceptualization, J.W. and F.X.; methodology, J.W.; software, X.C.; validation, J.W., F.X. and J.L.; formal analysis, J.W.; investigation, J.W.; resources, J.W., F.X., X.C., L.W. and B.J.; data curation, J.W. and F.X.; writing—original draft preparation, J.W.; writing—review and editing, J.W., F.X. and Y.C.; visualization, J.L.; supervision, J.L.; project administration, J.L.; funding acquisition, J.L. All authors have read and agreed to the published version of the manuscript.
Funding
This work is financially supported by the National Natural Science Foundation of China (NSFC) (No. 51968065), Yunnan Provincial High-Level Talent Support Project (Nos. YNWR-QNBJ-2018-066 and YNQR-CYRC-2019-001), and the Yunnan Provincial Science and Technology Department Project (202301BD070001-077).
Institutional Review Board Statement
Not applicable.
Informed Consent Statement
Not applicable.
Data Availability Statement
The data presented in this study are available on request from the corresponding author. The data are not publicly available due to confidentiality of test data.
Conflicts of Interest
Jiguang Wang, Feng Xu, Xudong Chen, Li Wang, Bigang Jiang are employees of CATARC Automotive Test Center (Kunming) Co., Ltd. Jiaqiang Li and Yanlin Chen are teachers of Southwest Forestry University. The paper reflects the views of the scientists and not the company. The authors declare no conflicts of interest.
References
- Albuquerque, P.C.; Gomes, J.F.; Bordado, J.C. Assessment of exposure to airborne ultrafine particles in the urban environment of Lisbon, Portugal. J. Air Waste Manag. Assoc. 2012, 62, 373–380. [Google Scholar] [CrossRef] [PubMed]
- Lou, D.M.; Cheng, W.; Feng, Q. On road particle emission characteristics of a Chinese phase IV natural gas bus. Huan Jing Ke Xue 2014, 35, 864–869. (In Chinese) [Google Scholar] [CrossRef]
- Zou, C.; Wang, Y.; Wu, L.; He, J.; Ni, J.; Mao, H. Environmental Benefits of Electrification of Bus Fleet in Zhengzhou City for Pollution Reduction and Carbon Reduction. Environ. Sci. 2023, 1–13. (In Chinese) [Google Scholar] [CrossRef]
- Xu, G.; Li, M.; Zhao, Y.; Chen, Q. Study on Emission Characteristics of Hybrid Buses under Driving Cycles in a Typical Chinese City. Adv. Mech. Eng. 2017, 9, 168781401772823. [Google Scholar] [CrossRef]
- Guo, J.; Ge, Y.; Tan, J.; Zhang, X.; Yu, L.; Fu, M. A Research on the Real World Emission Characteristics of State-V Buses. Automot. Eng. 2015, 37, 120–124. [Google Scholar] [CrossRef]
- Li, F.; Zhuang, J.; Cheng, X.; Li, M.; Wang, J.; Yan, Z. Investigation and Prediction of Heavy-Duty Diesel Passenger Bus Emissions in Hainan Using a COPERT Model. Atmosphere 2019, 10, 106. [Google Scholar] [CrossRef]
- He, L.; Hu, J.; Zhang, S.; Wu, Y.; Guo, X.; Guo, X.; Song, J.; Zu, L.; Zheng, X.; Bao, X. Investigating real-world emissions of China’s heavy-duty diesel trucks: Can SCR effectively mitigate NOx emissions for highway trucks? Aerosol Air Qual. Res. 2017, 17, 2585–2594. [Google Scholar] [CrossRef]
- Nogueira, T.; Dominutti, P.A.; Vieira-Filho, M.; Fornaro, A.; Andrade, M.d.F. Evaluating Atmospheric Pollutants from Urban Buses under Real-World Conditions: Implications of the Main Public Transport Mode in São Paulo, Brazil. Atmosphere 2019, 10, 108. [Google Scholar] [CrossRef]
- Shan, W.; Yu, Y.; Zhang, Y.; He, H. Advances in the development of exhaust aftertreatment technologies for heavy-duty diesel vehicles in China. Res. Environ. Sci 2019, 32, 1672–1677. (In Chinese) [Google Scholar] [CrossRef]
- Guo, J.D. On-Board Emission Testing and Emission Characterisation of Heavy Duty Vehicles for Real Road Vehicles. Ph.D. Thesis, Beijing Institute of Technology, Beijing, China, 2015. Available online: https://gfffgc1d129f57bb244a4sx5n60bncqpcv6690fgfy.eds.tju.edu.cn/kcms2/article/abstract?v=5SxrylDe_PP-Pctx22LKA0qov2UQ-BkOHYM9HWKhZrwW6y8mamfg4ZSbXnq4ssY5TswF09jz5EATD-2h-6RiEh_OXYjmbJ3XyQHPDeMcp9RyteFiEhlJuU0jf4ft_wjr2tiSwAAXoWqvCtRWGFseAQ==uniplatform=NZKPTlanguage=CHS (accessed on 27 November 2023). (In Chinese).
- Xu, H.; Lei, Y.; Liu, M.; Ge, Y.; Hao, L.; Wang, X.; Tan, J. Research on the CO2 Emission Characteristics of a Light-Vehicle Real Driving Emission Experiment Based on Vehicle-Specific Power Distribution. Atmosphere 2023, 14, 1467. [Google Scholar] [CrossRef]
- Leach, F.C.P.; Peckham, M.S.; Hammond, M.J. Identifying NOx Hotspots in Transient Urban Driving of Two Diesel Buses and a Diesel Car. Atmosphere 2020, 11, 355. [Google Scholar] [CrossRef]
- Yang, Q.; Hu, Q.Y.; Huang, C.; Chen, Y.; Liu, J.D.; Li, L.; Xiong, Z.L.; Tang, W. Hybrid electric bus SCR system operation and NOx emission characteristics based on remote communication technology. Environ. Sci. 2018, 39, 4463–4471, (In Chinese with English Abstract). [Google Scholar] [CrossRef]
- Ren, S.; Li, T.; Li, G.; Liu, X.; Liu, H.; Wang, X.; Gao, D.; Liu, Z. Investigation of Heavy-Duty Vehicle Chassis Dynamometer Fuel Consumption and CO2 Emissions Based on a Binning-Reconstruction Model Using Real-Road Data. Atmosphere 2023, 14, 528. [Google Scholar] [CrossRef]
- Zhou, H.; Zhao, H.; Feng, Q.; Yin, Z.; Li, J.; Qin, K.; Li, M.; Cao, L. Effects of Environmental Parameters on Real-World Nox Emissions and Fuel Consumption for Heavy-Duty Diesel Trucks Using an OBD Approach; SAE Technical Paper 2018-01-1817; SAE: Warrendale, PA, USA, 2018; Volume 1, p. 1817. [Google Scholar] [CrossRef]
- Hao, L.; Ren, Y.; Lu, W.; Jiang, N.; Ge, Y.; Wang, Y. Assessment of Heavy-Duty Diesel Vehicle NOx and CO2 Emissions Based on OBD Data. Atmosphere 2023, 14, 1417. [Google Scholar] [CrossRef]
- Yang, L.; Zhang, S.; Wu, Y.; Chen, Q.; Niu, T.; Huang, X.; Zhang, S.; Zhang, L.; Zhou, Y.; Hao, J. Evaluating real world CO2 and NOx emissions for public transit buses using a remote wireless on board diagnostic (OBD) approach. Environ. Pollut. 2016, 218, 453–462. [Google Scholar] [CrossRef]
- Anenberg, S.C.; Miller, J.; Minjares, R.; Du, L.; Henze, D.K.; Lacey, F.; Malley, C.S.; Emberson, L.; Franco, V.; Klimont, Z.; et al. Impacts and mitigation of excess diesel-related NOx emissions in 11 major vehicle markets. Nature 2017, 545, 467–471. [Google Scholar] [CrossRef]
- Rosero, F.; Fonseca, N.; López, J.-M.; Casanova, J. Effects of passenger load, road grade, and congestion level on real-world fuel consumption and emissions from compressed natural gas and diesel urban buses. Appl. Energy 2021, 282, 116195. [Google Scholar] [CrossRef]
- Ng, E.C.; Huang, Y.; Hong, G.; Zhou, J.L.; Surawski, N.C. Reducing vehicle fuel consumption and exhaust emissions from the application of a green-safety device under real driving. Sci. Total Environ. 2021, 793, 148602. [Google Scholar] [CrossRef]
- Dalla Chiara, B.; Deflorio, F.; Eid, M. Analysis of real driving data to explore travelling needs in relation to hybrid–electric vehicle solutions. Transp. Policy 2018, 80, 97–116. [Google Scholar] [CrossRef]
- Pan, Y.; Chen, S.; Qiao, F.; Ukkusuri, S.V.; Tang, K. Estimation of real-driving emissions for buses fueled with liquefied natural gas based on gradient boosted regression trees. Sci. Total Environ. 2019, 660, 741–750. [Google Scholar] [CrossRef]
- Gabriel, N.R.; Martin, K.K.; Haslam, S.J.; Faile, J.C.; Kamens, R.M.; Gheewala, S.H. A comparative life cycle assessment of electric, compressed natural gas, and diesel buses in Thailand. J. Clean. Prod. 2021, 314, 128013. [Google Scholar] [CrossRef]
- Giechaskiel, B.; Clairotte, M.; Valverde-Morales, V.; Bonnel, P.; Kregar, Z.; Franco, V.; Dilara, P. Framework for the assessment of PEMS (Portable Emissions Measurement Systems) uncertainty. Environ. Res. 2018, 166, 251–260. [Google Scholar] [CrossRef] [PubMed]
- Su, S.; Hou, P.; Wang, X.; Lyu, L.; Ge, Y.; Lyu, T.; Lai, Y.; Luo, W.; Wang, Y. Evaluating the Measurement Uncertainty of On-Road NOx Using a Portable Emission Measurement System (PEMS) Based on Real Testing Data in China. Atmosphere 2023, 14, 702. [Google Scholar] [CrossRef]
- Ma, R.; He, X.; Zheng, Y.; Zhou, B.; Lu, S.; Wu, Y. Real-world driving cycles and energy consumption informed by large-sized vehicle trajectory data. J. Clean. Prod. 2019, 223, 564–574. [Google Scholar] [CrossRef]
- Khemri, N.; Supina, J.; Syed, F.; Ying, H. Developing a Real-World, Second-by-Second Driving Cycle Database through Public Vehicle Trip Surveys; SAE Technical Paper Series; SAE International: Warrendale, PA, USA, 2019. [Google Scholar] [CrossRef]
- Mahesh, S.; Ramadurai, G. Analysis of driving characteristics and estimation of pollutant emissions from intra-city buses. Transp. Res. Procedia 2017, 27, 1211–1218. [Google Scholar] [CrossRef]
- Gómez, A.; Fernández-Yáñez, P.; Soriano, J.A.; Sánchez-Rodríguez, L.; Mata, C.; García-Contreras, R.; Armas, O.; Cárdenas, M.D. Comparison of real driving emissions from Euro VI buses with diesel and compressed natural gas fuels. Fuel 2021, 289, 119836. [Google Scholar] [CrossRef]
- Özener, O.; Özkan, M. Fuel consumption and emission evaluation of a rapid bus transport system at different operating conditions. Fuel 2020, 265, 117016. [Google Scholar] [CrossRef]
- Smit, R.; Keramydas, C.; Ntziachristos, L.; Lo, T.-S.; Ng, K.-L.; Wong, H.-L.A.; Wong, C.K.-L. Evaluation of real-world gaseous emissions performance of selective catalytic reduction and diesel particulate filter bus retrofits. Environ. Sci. Technol. 2019, 53, 4440–4449. [Google Scholar] [CrossRef]
- Guo, J.; Ge, Y.; Hao, L.; Tan, J.; Peng, Z.; Zhang, C. Comparison of real-world fuel economy and emissions from parallel hybrid and conventional diesel buses fitted with selective catalytic reduction systems. Appl. Energy 2015, 159, 433–441. [Google Scholar] [CrossRef]
- Prati, M.V.; Costagliola, M.A.; Unich, A.; Mariani, A. Emission factors and fuel consumption of CNG buses in real driving conditions. Transp. Res. D Transp. Environ. 2022, 113, 103534. [Google Scholar] [CrossRef]
- McCaffery, C.; Zhu, H.; Tang, T.; Li, C.; Karavalakis, G.; Cao, S.; Oshinuga, A.; Burnette, A.; Johnson, K.C.; Durbin, T.D. Real-world NOx emissions from heavy-duty diesel, natural gas, and diesel hybrid electric vehicles of different vocations on California roadways. Sci. Total Environ. 2021, 784, 147224. [Google Scholar] [CrossRef] [PubMed]
- Lyu, M.; Li, Y.; Lyu, M.; Li, B.; Yang, Y.; Wang, Y.; Pan, M.; Wang, Y.; Wu, T.; Matthews, R. Investigation of real-world emissions of China III and China IV buses in a high-altitude city: A case study of Lhasa. Proc. Inst. Mech. Eng. D J. Automob. Eng. 2023, 09544070231163428. [Google Scholar] [CrossRef]
- Corazza, M.V.; Lizana, P.C.; Pascucci, M.; Petracci, E.; Vasari, D. iGREEN: An integrated emission model for mixed bus fleets. Energies 2021, 14, 1521. [Google Scholar] [CrossRef]
- Sun, Z.; Wang, C.; Ye, Z.; Bi, H. Long short-term memory network-based emission models for conventional and new energy buses. Int. J. Sustain. Transp. 2021, 15, 229–238. [Google Scholar] [CrossRef]
- Jinquan, G.; Hongwen, H.; Jianwei, L.; Qingwu, L. Driving information process system-based real-time energy management for the fuel cell bus to minimize fuel cell engine aging and energy consumption. Energy 2022, 248, 123474. [Google Scholar] [CrossRef]
- Jiguang, W.; Huaqiao, G.; Jin-Chao, C. Vehicle emission inventory and economic benefits of emission reduction in Tangshan. China Environ. Sci. 2021, 41, 5114–5124. [Google Scholar]
- Ministry of Ecology and Environment. Measurement Method and Technical Specification for PEMS Test of Exhaust Pollutants from Heavy-Duty Diesel and Gas Fuelled Vehicle; Ministry of Ecology and Environment of the People’s Republic of China: Beijing, China, 2017; HJ857-2017. Available online: https://www.mee.gov.cn/ywgz/fgbz/bz/bzwb/dqhjbh/dqydywrwpfbz/201709/t20170921_422035.shtml (accessed on 27 November 2023).
- Engelmann, D.; Zimmerli, Y.; Ruoss, F.; Frank, E. Real Driving Emissions of Diesel and LNG Euro VI Heavy-Duty Vehicles Measured with FTIR-PEMS; SAE Technical Paper 2021-24-0066; SAE International: Warrendale, PA, USA, 2021. [Google Scholar] [CrossRef]
- Liu, S.; Chen, J.; Li, M.; Qin, K.; Zhang, Y. A Study on the Application of Electrical Low Pressure Impactor to the On-board Measurement of Particulate Matter in Heavy Duty Vehicle. Automot. Eng. 2007, 7, 582–585. [Google Scholar] [CrossRef]
- Ministry of Ecology and Environment. Technical Specification for Emission Remote Supervision System of Heavy-Duty Vehicles PART 3 Communication Protocol and Data Format; Ministry of Ecology and Environment of the People’s Republic of China: Beijing, China, 2021; HJ1239.3-2021. Available online: https://www.mee.gov.cn/ywgz/fgbz/bz/bzwb/other/hjbhgc/202201/t20220119_967608.shtml (accessed on 27 November 2023).
- Jimenez-Palacios, J.L. Understanding and Quantifying Motor Vehicle Emissions with Vehicle Specific Power and TILDAS Remote Sensing; Massachusetts Institute of Technology: Cambridge, MA, USA, 1998; Available online: http://hdl.handle.net/1721.1/44505 (accessed on 27 November 2023).
- Liu, H.; Barth, M.; Scora, G.; Davis, N.; Lents, J. Using portable emission measurement systems for transportation emissions studies: Comparison with laboratory methods. Transp. Res. Rec. 2010, 2158, 54–60. [Google Scholar] [CrossRef]
- Qin, D.T.; Zhan, S.; Qi, Z.G.; Chen, S.J. Driving cycle construction using K-means clustering method. J. Jilin Univ. Eng. Technol. Ed. 2016, 46, 383–389. [Google Scholar] [CrossRef]
- Department of Equipment Industry. China Automotive Test Cycle—Part 2: Heavy-Duty Commercial Vehicles; Ministry of Industry and Information Technology: Beijing, China, 2019. Available online: https://kns.cnki.net/kcms2/article/abstract?v=lVku9qtM8H-qsy4_T5T2KQBfKzz47HSXqOOpMeBIRnIs4aTAMm6hxbzNrL3hRLK6uCcBDbQ1F5imprE21lGdCVx3KDt5aRsylyVykpTDVHRxNadlgchnDr7EjQClnL3CMeSU_J5ZM0k=&uniplatform=NZKPT&language=CHS (accessed on 27 November 2023).
- Wang, Z.H.; Huang, Y.K.; Zhang, Y.J.; Ding, Y.J.; Wang, L.; Wang, C.J. Study on Real Road Emission Characteristics of National VI Heavy Natural Gas Vehicle Based on Dynamic Parameters. J. East China Jiaotong Univ. 2022, 39, 32–40. (In Chinese) [Google Scholar] [CrossRef]
- Wang, S.; Tan, J.; Lv, L.; Hao, L.; Wang, X.; Ge, Y. Real Driving Emissions from China VI Heavy-Duty Diesel–Liquefied Natural Gas Vehicles. Chin. Intern. Combust. Engine Eng. 2022, 43, 61–67. (In Chinese) [Google Scholar] [CrossRef]
Disclaimer/Publisher’s Note: The statements, opinions and data contained in all publications are solely those of the individual author(s) and contributor(s) and not of MDPI and/or the editor(s). MDPI and/or the editor(s) disclaim responsibility for any injury to people or property resulting from any ideas, methods, instructions or products referred to in the content. |
© 2024 by the authors. Licensee MDPI, Basel, Switzerland. This article is an open access article distributed under the terms and conditions of the Creative Commons Attribution (CC BY) license (https://creativecommons.org/licenses/by/4.0/).