Article

MaxEnt SeismoSense Model: Ionospheric Earthquake Anomaly Detection Based on the Maximum Entropy Principle

1
National Institute of Nature Hazards, Ministry of Emergency Management of China, Beijing 100085, China
2
Key Laboratory of Landslide Risk Early-Warning and Control, Ministry of Emergency Management of China, Chengdu 610059, China
*
Author to whom correspondence should be addressed.
Atmosphere 2024, 15(4), 419; https://doi.org/10.3390/atmos15040419
Submission received: 22 February 2024 / Revised: 15 March 2024 / Accepted: 21 March 2024 / Published: 28 March 2024

Abstract

:
In our exploration, we aimed at identifying seismic anomalies using limited ionospheric data for earthquake forecasting and we meticulously compiled datasets under conditions of minimal geomagnetic disturbance. Our systematic evaluation affirmed the ITransformer as a potent tool for the feature extraction of ionospheric data, standing out within the domain of transformer-based time series prediction models. We integrated the maximum entropy principle to fully leverage the available information, while minimizing the influence of presuppositions on our predictions. This led to the creation of the MaxEnt SeismoSense Model, a novel composite model that combines the strengths of the transformer architecture with the maximum entropy principle to improve prediction accuracy. The application of this model demonstrated a proficient capability to detect seismic disturbances in the ionosphere, showcasing an improvement in both recall rate and accuracy to 71% and 69%, respectively, when compared to conventional baseline models. This indicates that the combined use of transformer technology and the maximum entropy principle could allow pre-seismic anomalies in the ionosphere to be sensed more efficiently and could offer a more reliable and precise approach to earthquake prediction.

1. Introduction

During the lead-up to a moderate or severe earthquake, there is typically a presence of electromagnetic abnormalities in close proximity to the earthquake’s epicenter [1,2], as evidenced by fluctuations in the total electron content (TEC). Extensive research has been conducted in order to understand the ionospheric response to seismic activity, offering promising insights into this phenomenon. However, the practical implementation of earthquake prediction based on ionospheric anomalies is still in its infancy and requires further exploration [3,4]. Efforts directed towards studying TEC anomaly variations as earthquake precursors primarily rely on observed TEC data. Traditional anomaly detection methods include the mean and standard deviation method [5,6,7], the envelope method [8,9], the average method [10,11,12], quartile method, and sliding quartile method [13,14,15,16], among others.
These methods offer certain advantages; however, the subjective nature of threshold value selection persists [17]. Moreover, many existing studies are conducted within the context of specific earthquakes, lacking consistent analysis methods and anomaly evaluation metrics. This inconsistency may yield disparate analysis results for the same earthquakes [18]. However, deep learning can automatically learn feature representation without manual selection or extraction of features, so people try to establish appropriate and general methods through deep learning. Particularly, after the Global Navigation Satellite System (GNSS) provides a large amount of ionospheric data, continuous space–time attribute information regarding ionospheric data can be obtained and, thus, the application of long short-term memory (LSTM), gated recurrent unit (GRU), and other neural network technologies has been rapidly popularized. Specifically, these models entail the establishment of background field models aimed at predicting the structure and characteristics of the ionosphere. Subsequently, seismic anomalies are identified based on these studies. Notably, several well-established models already exist, predominantly comprising empirical models derived from statistical data. Examples include the International Reference Ionosphere (IRI) model [19], NeQuick model [20,21], Klobuchar model [22], Bent model [23], etc. The accuracy of such models has become inadequate to meet the growing demand as human exploration of ionospheric seismic anomalies deepens. Because these models, such as IRI and Nequick, are typical global models, they are good at predicting long-term ionospheric changes, but they cannot be expected to be sensitive to phenomena occurring on shorter time scales, such as rapid changes in the ionosphere caused by magnetic storms or earthquakes [24,25].
Artificial intelligence (AI) technology introduces a novel approach to TEC prediction and modeling by capturing the complexity inherent in various variables. It achieves this by establishing a functional mapping relationship between input vectors and output results through numerous neurons [26,27]. Given the pronounced temporal characteristics of ionospheric TEC and its highly nonlinear spatiotemporal variations [28,29,30,31]. neural networks excel in recognizing and capturing such intricate relationships. Consequently, they outperform traditional methods in TEC modeling and prediction [32,33,34].
The utilization of neural network models in ionospheric prediction has garnered increasing attention from researchers, as evidenced by successful applications documented in the recent literature [35,36,37,38]. Notably, many ionospheric grid point-prediction models have been developed using deep learning techniques, including recurrent neural networks (RNNs), LSTM, and GRU architectures [39,40,41,42,43,44], etc. These methods effectively capture the nonlinear characteristics of time series data, thereby enhancing prediction accuracy, as corroborated by various studies. LSTM has been the predominant and widely recognized model until 2022. The advent of the transformer neural network architecture, introduced by Google in 2017, has sparked considerable interest across diverse domains. Post-2022, research on ionospheric prediction leveraging improved transformer-based models has surged, yielding notable successes [45,46,47,48]. While LSTM and GRU, along with their respective optimizations, have demonstrated commendable performance and mitigated long-range dependencies in sequence tasks to a certain extent, their efficacy diminishes notably with increasing sequence lengths. Several studies have provided evidence that transformers outperform other time series prediction models, such as LSTMs and GRUs [49].
A transformer represents a pioneering transduction model that exclusively relies on self-attention mechanisms to compute representations, dispensing with sequence-aligned recurrent neural network (RNN) or convolutional neural network (CNN) structures [50]. Departing from the conventional CNN and RNN architectures, the transformer network is entirely composed of multi-head attention mechanisms. In contrast to CNN structures, transformers can handle sequences of variable lengths, optimize memory usage, conduct parallel computation for enhanced efficiency, and notably improve the model’s capacity to capture long-term dependencies compared to RNNs, LSTMs, GRUs, and other conventional methods. For tasks such as TEC prediction, the introduction of the self-attention mechanism dynamically assigns varying weights to features, thereby reinforcing the temporal dependencies crucial for accurate TEC prediction. Notably, the attention mechanism incorporates location information in order to effectively capture spatial characteristics.
In fact, the transformer is a highly versatile model, which has been successfully applied to text translation, sentiment analysis, question answering system, image processing, etc. In terms of time series data processing, there are many excellent improved models based on the transformer model. Because it can take into account the global information from all elements in the sequence, it is more effective than RNN-based models (LSTM, GRU) in extracting complex features and capturing dynamic relationships in the sequence. However, few studies have leveraged prediction results for seismic anomaly detection.
Therefore, from the perspective of ionospheric time series prediction, we use transformer architecture to model and sense seismic anomalies in the ionosphere. Specifically, we conducted a comparative analysis of an improved transformer commonly utilized in timing prediction, and Mean Squared Error (MSE), Mean Absolute Error (MAE), and Root mean square error (RMSE) were employed to evaluate the model’s performance. Our aim was to use the improved transformer model to perform timing predictions of ionospheric grid data and generate meaningful feature representations. Eventually, we selected ITransformer [51], a time series prediction model developed by Tsinghua University, as a feature extractor for TEC map data. In order to leverage the potent information extraction capabilities of transformers, we developed a combined model, termed the MaxEnt SeismoSense Model, which integrates the improved transformer model with the maximum entropy principle; the data we used were ionospheric grid datasets covering a comprehensive time and spatial scale before an earthquake. This combined model aims to effectively identify and perceive seismic anomalies in the ionosphere. The results show that the time series prediction regression based on the transformer has high accuracy when performing the ionospheric seismic anomaly-sensing task.

2. Data

The primary datasets utilized include the International GNSS Service (IGS) TEC Grid data product [52], the US Geological Survey Seismic Event Catalogue [53], and solar and geomagnetic activity indices. The data sources are summarized in Table 1.

2.1. TEC Grid Product

We used the Global Ionospheric Maps (GIM TEC) provided by the IGS, which is an authority for international academic cooperation and information services, founded in 1993 with the support of many government agencies, and its data and analysis center members are first-class research institutions in the field.
The ionospheric TEC grid products obtained by weighting the ionospheric TEC grid products of each analysis center are stored in the data-sharing center server in the form of IONEX files; each IONEX file contains 12 ionospheric maps of the day and the first ionospheric map of the next day, a total of 13. The global ionospheric TEC grid product included in each map is the result of modeling and interpolating the ionospheric total electron content (TEC) using GNSS data to reflect the spatial distribution and temporal variation of the ionosphere. Among them, the time resolution is 2 h, and the spatial resolution is 2.5° latitude and 5° longitude.

2.2. Earthquake Catalogue

The earthquake catalogue is sourced from the United States Geological Survey (USGS) and includes information such as earthquake date, magnitude, depth, and epicenter. In screening seismic data, previous studies were considered, which indicated that higher magnitude earthquakes are more likely to induce ionospheric anomalies [54,55,56]. Additionally, studies have shown that earthquakes with a source depth exceeding 50 km are less likely to cause ionospheric anomalies [57,58,59]. Therefore, thresholds for ionospheric sensitivity were set based on these findings. Specifically, seismic events with magnitudes greater than five and focal depths less than 50 km were screened from 2000 to 2023.

2.3. Other Disturbance Indicators

In addition to the unusual disturbances that may occur before an earthquake, the ionosphere is more commonly affected by solar and geomagnetic activity. Such as solar flares [60] and geomagnetic storms [61,62]. Solar flares are the result of a sudden release of magnetic energy from the sun, which releases a lot of radiation that causes changes in the degree of ionization in the upper layers of the Earth, known as sudden disturbances in the ionosphere. Geomagnetic storms are caused by the interaction of the solar wind with the Earth’s magnetic field, which also affects the ionospheric electron density and distribution. It is necessary to avoid confusing these phenomena with ionospheric pre-seismic anomalies in the study, so we introduce the factors that characterize solar activity and geomagnetic activity as F10.7, Kp, Dst, and AE.
According to the indicators commonly used in research to determine the calm of geomagnetic activity and solar activity. The criteria used for screening seismic events were as follows [18,63,64]: Kp < 3, F10.7 < 120, Dst > −30, and AE < 500.
These criteria yielded a total of 18,409 seismic events, as illustrated in Figure 1.
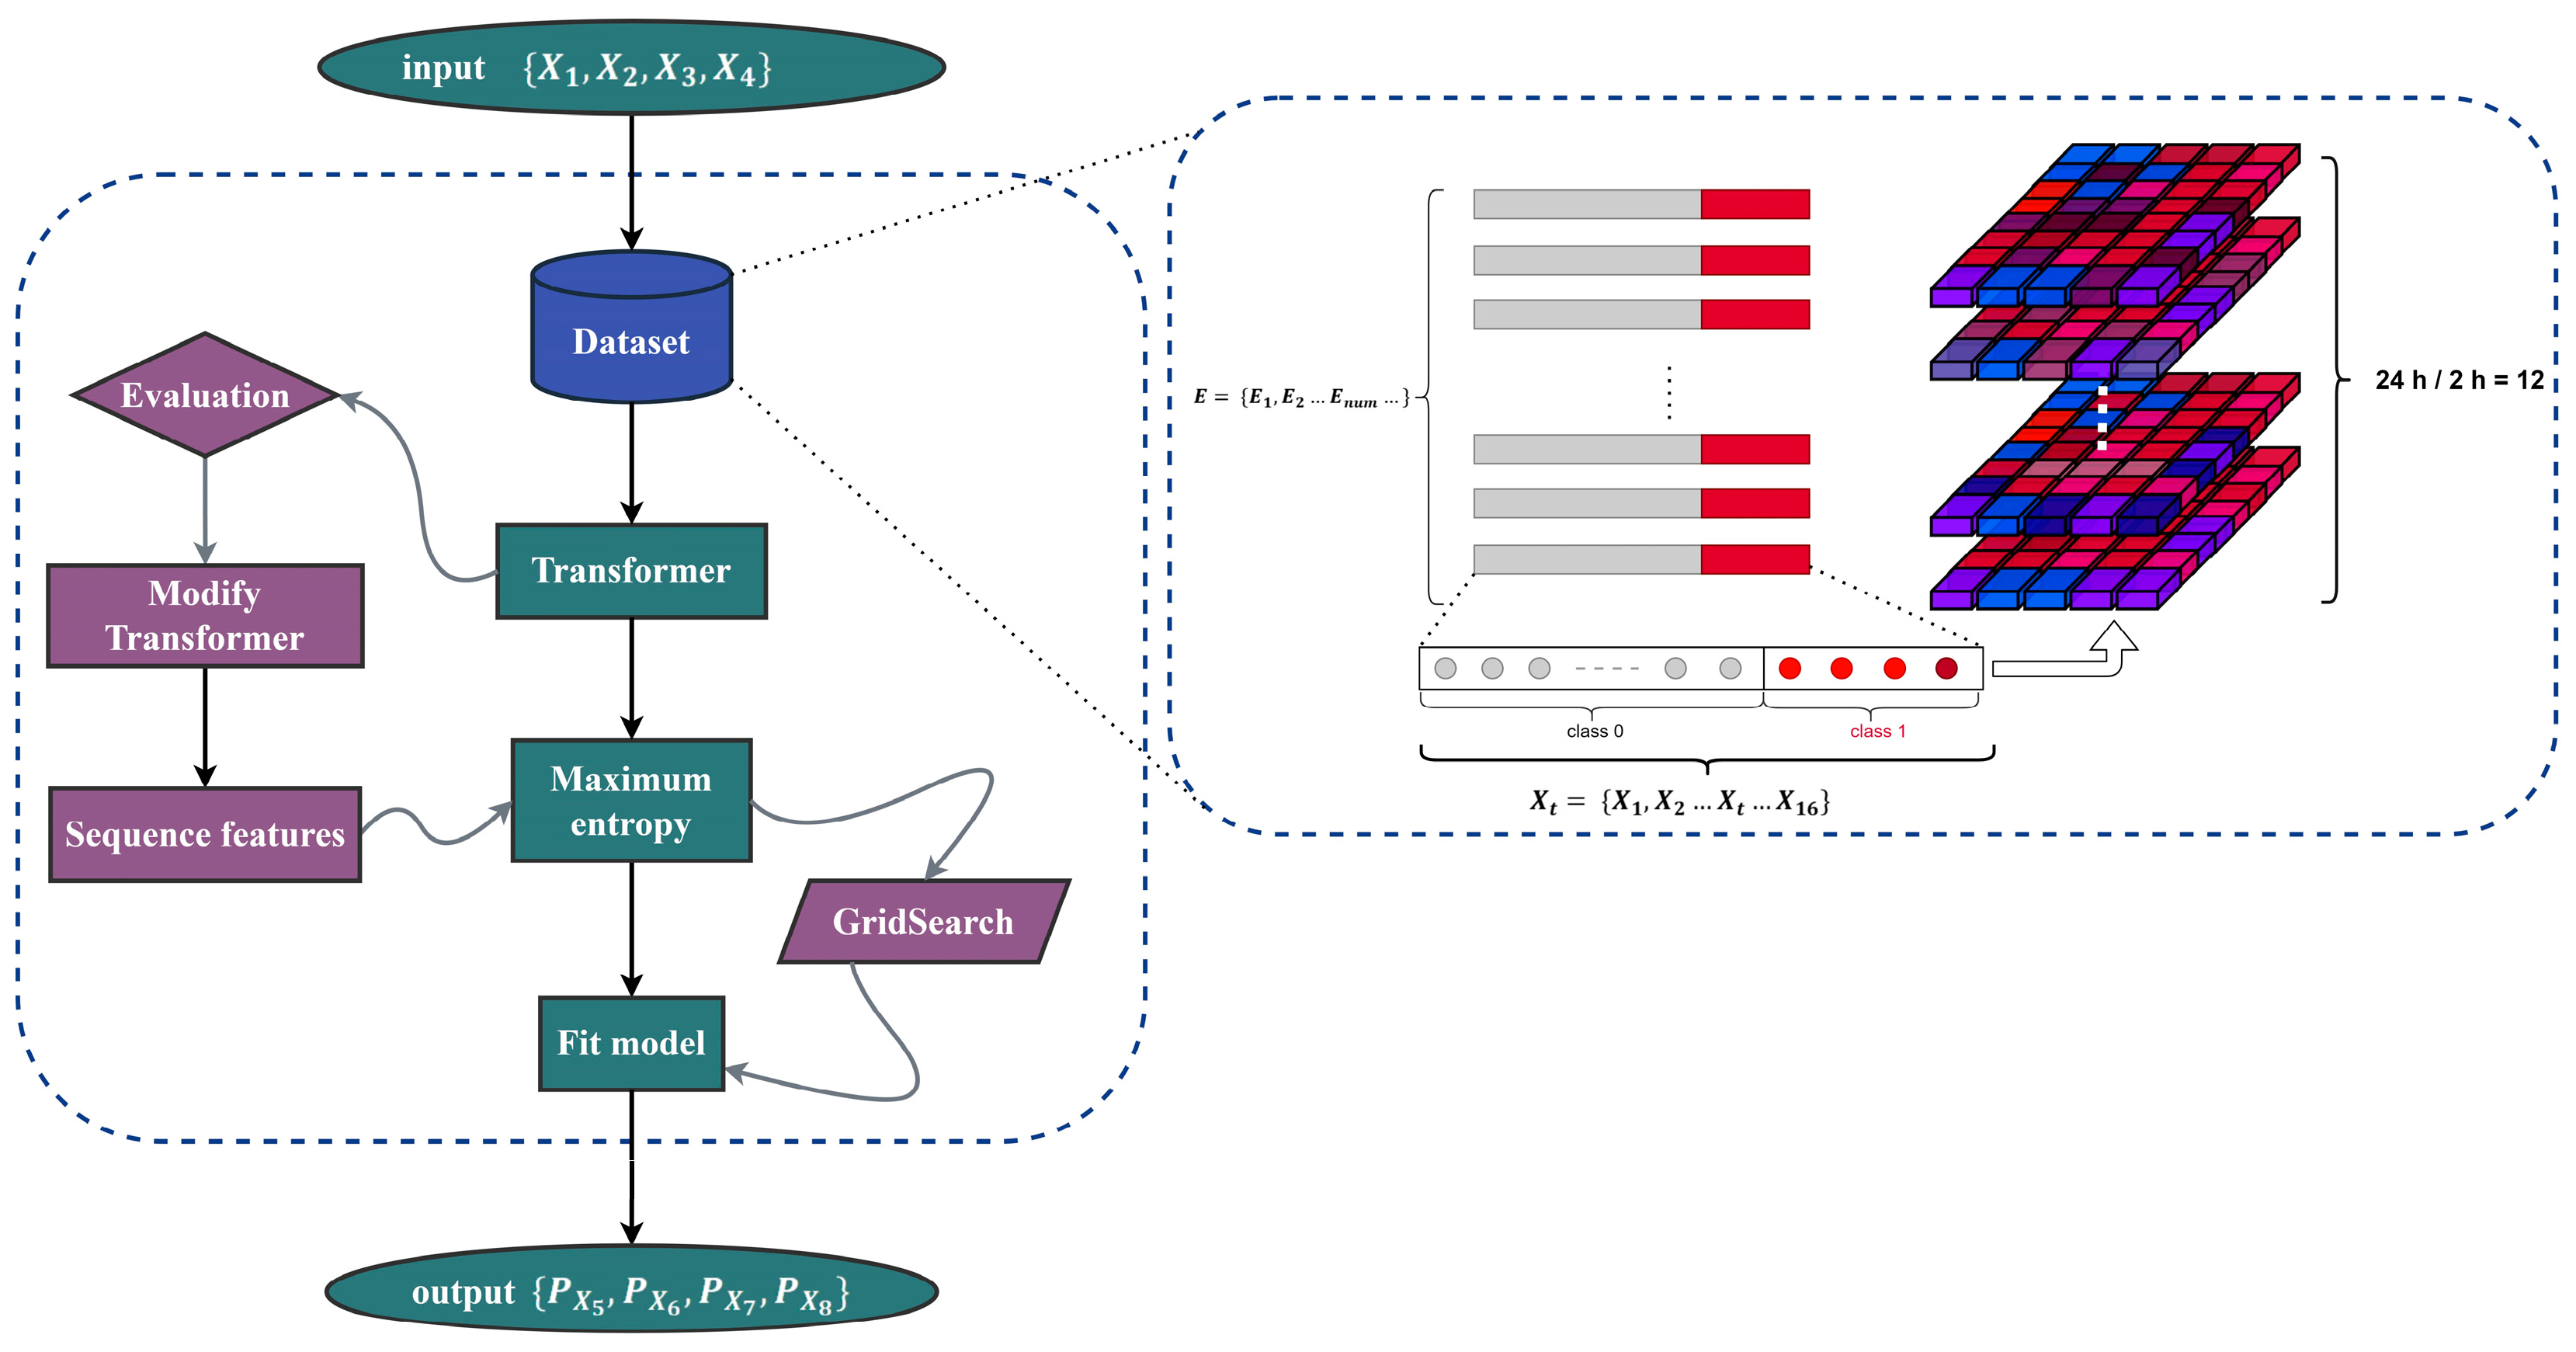
When constructing the dataset, we centered the space on the epicenter and defined a grid range of 20 × 20, with a height of 450 km determined by IGS data. The resolution of the TEC data is 2 h. We meticulously assessed the length of each event input sequence and the overall training data length to ensure compatibility with the model. Sequences of 16 days were selected to minimize noise introduction in positive samples.
Numerous scholars have conducted studies on a substantial dataset of earthquake events [65], revealing an increased likelihood of ionospheric anomalies in the week leading up to an earthquake. Despite these findings, various studies have identified differing anomaly periods associated with distinct spatiotemporal conditions and characteristics of earthquakes, including periods of one, three, and four days [66] per earthquake, as well as three [67,68] and five days [69,70] prior. To minimize the inclusion of noise in the positive sample set, our approach aims to narrow the anomaly period while preserving predictive relevance. Consequently, we have defined the critical period for seismic anomalies as spanning from three days before the earthquake to the day of the earthquake itself, assigning a label of one to these intervals. All other periods were assigned a label of 0. The design and functionality of the composite model we developed are illustrated in Figure 2.

3. Methods

3.1. Transformer

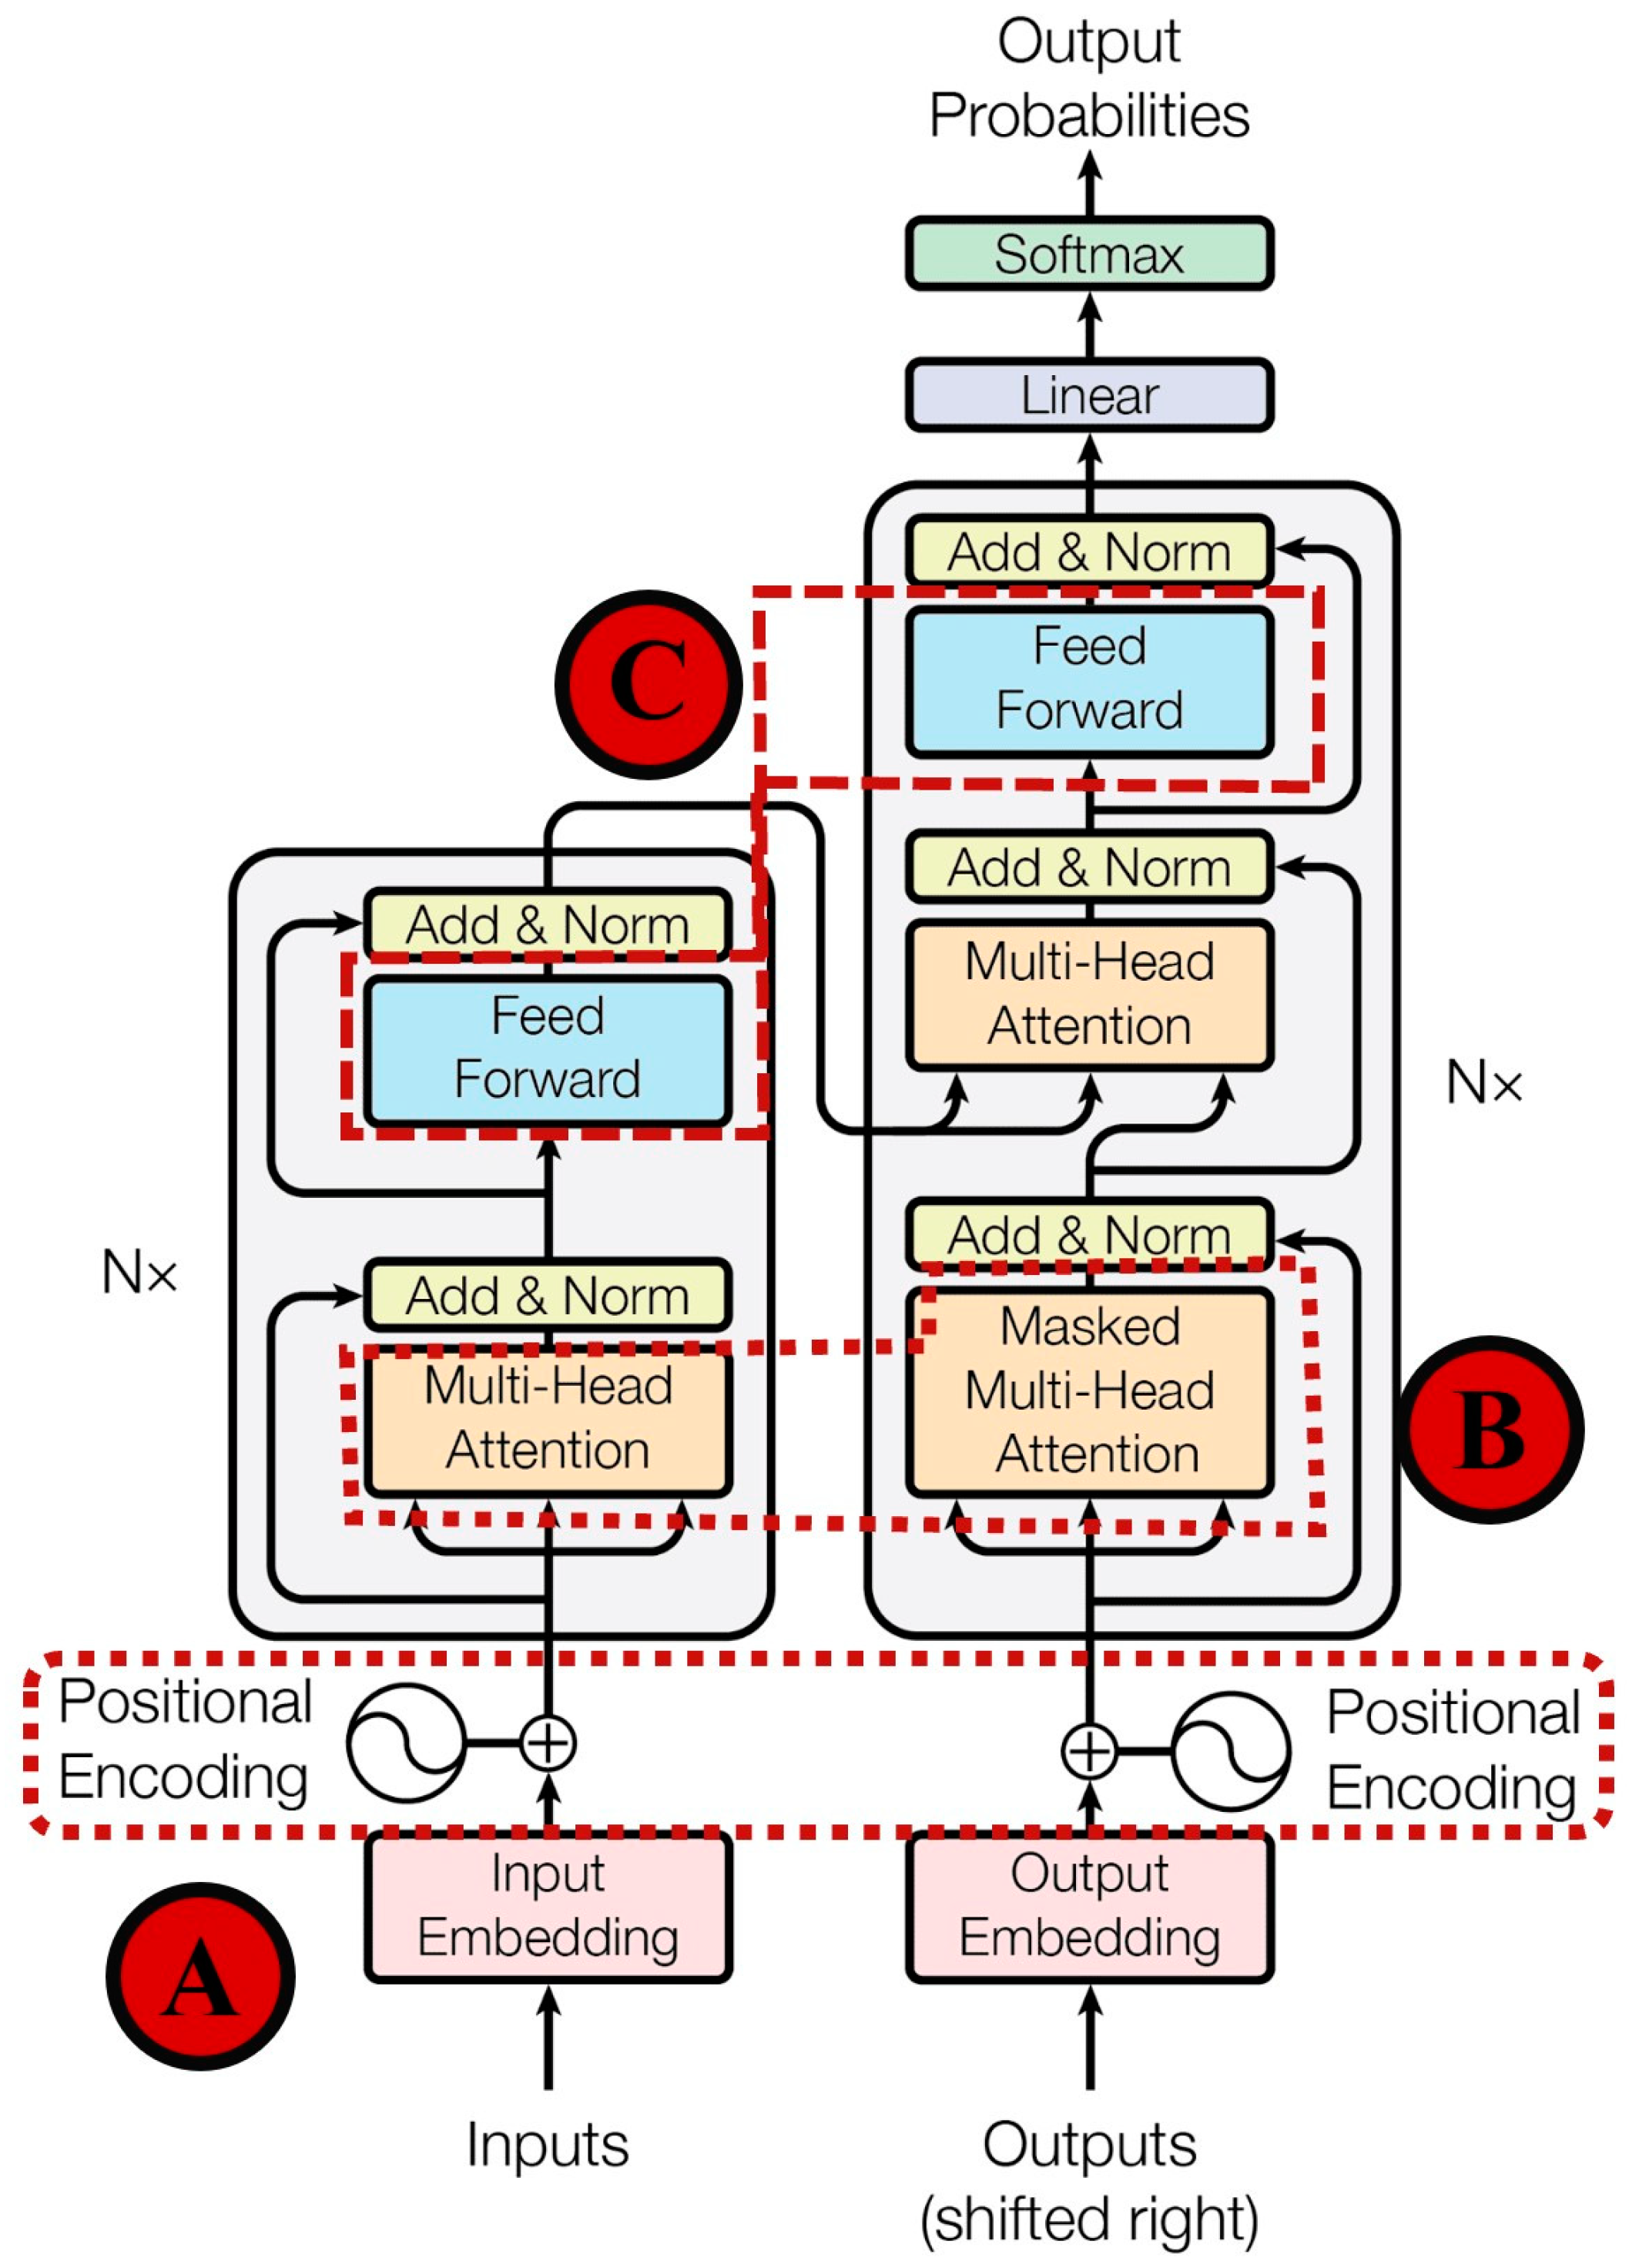
A transformer is mainly composed of input, encoder, decoder, and output. The advantage of the transformer’s structure is that the positional encoding in the input takes into account the order of sequence data, which is critical for data containing space–time continuity. As shown in Figure 3, the self-attention in the encoder and decoder enables the transformer to capture long distance dependencies more directly and with higher computational efficiency, and the multi-head attention mechanism allows the model to learn information from multiple representation spaces, improving the model’s ability to capture different types of dependencies. The Feed Forward Network (FFN) in the encoder and decoder allows the model to learn more complex representations at different levels, increasing the expressiveness of the model.
Based on the architecture of a standard transformer, the improvements of ITransformer, Flashformer, Reformer, Informer, and Flowformer are briefly described, and they will be used for subsequent feature extraction and model evaluation.
  • ITransformer
ITransformer’s improvement, based on a standard transformer, is the ability to embed the entire time series of each variable as a token, independently. As shown in Figure 4, self-attention and the FFN is employed for each variable token to learn nonlinear features within the TEC data. This focus on embedded variable tokens enhances interpretability, elucidating multivariable correlations and, particularly in this study, improving feature extraction of spatiotemporal correlations across TEC sequence data.
2.
Flashformer
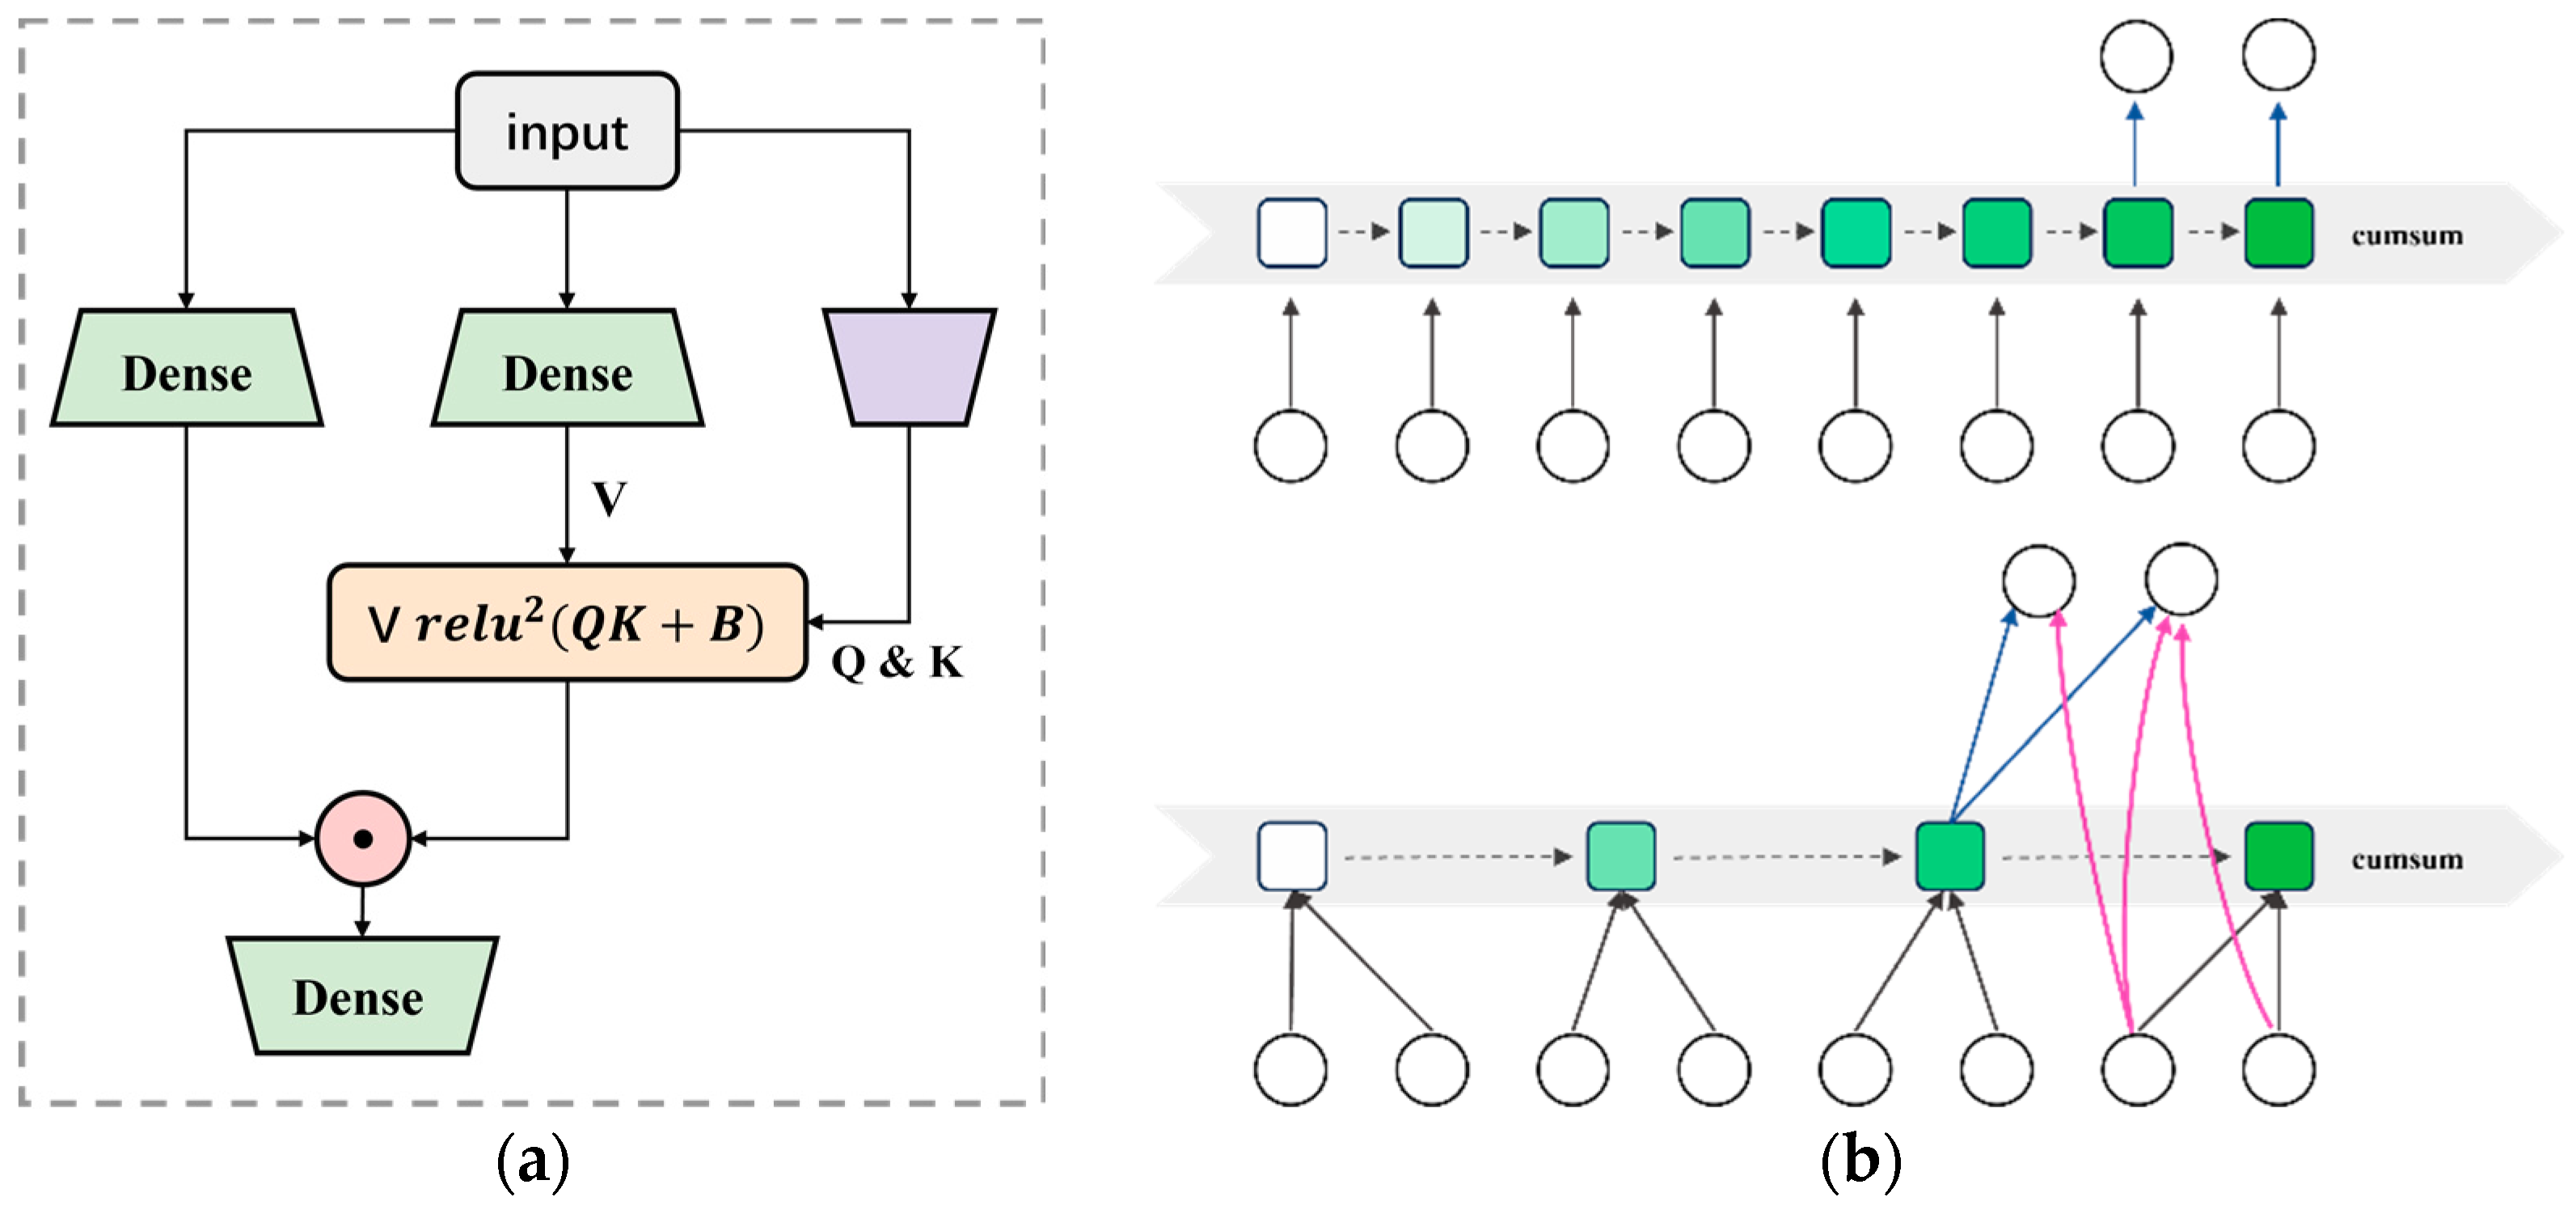
In the original transformer, there was a multi-head self-attention mechanism and FFN. In Flashformer, FFN is replaced by a Gated Attention Unit (GAU), and mixed-chunk attention is proposed as a fast method to calculate attention. As shown in Figure 5, this model’s architecture enables faster computation and less memory usage.
3.
Reformer
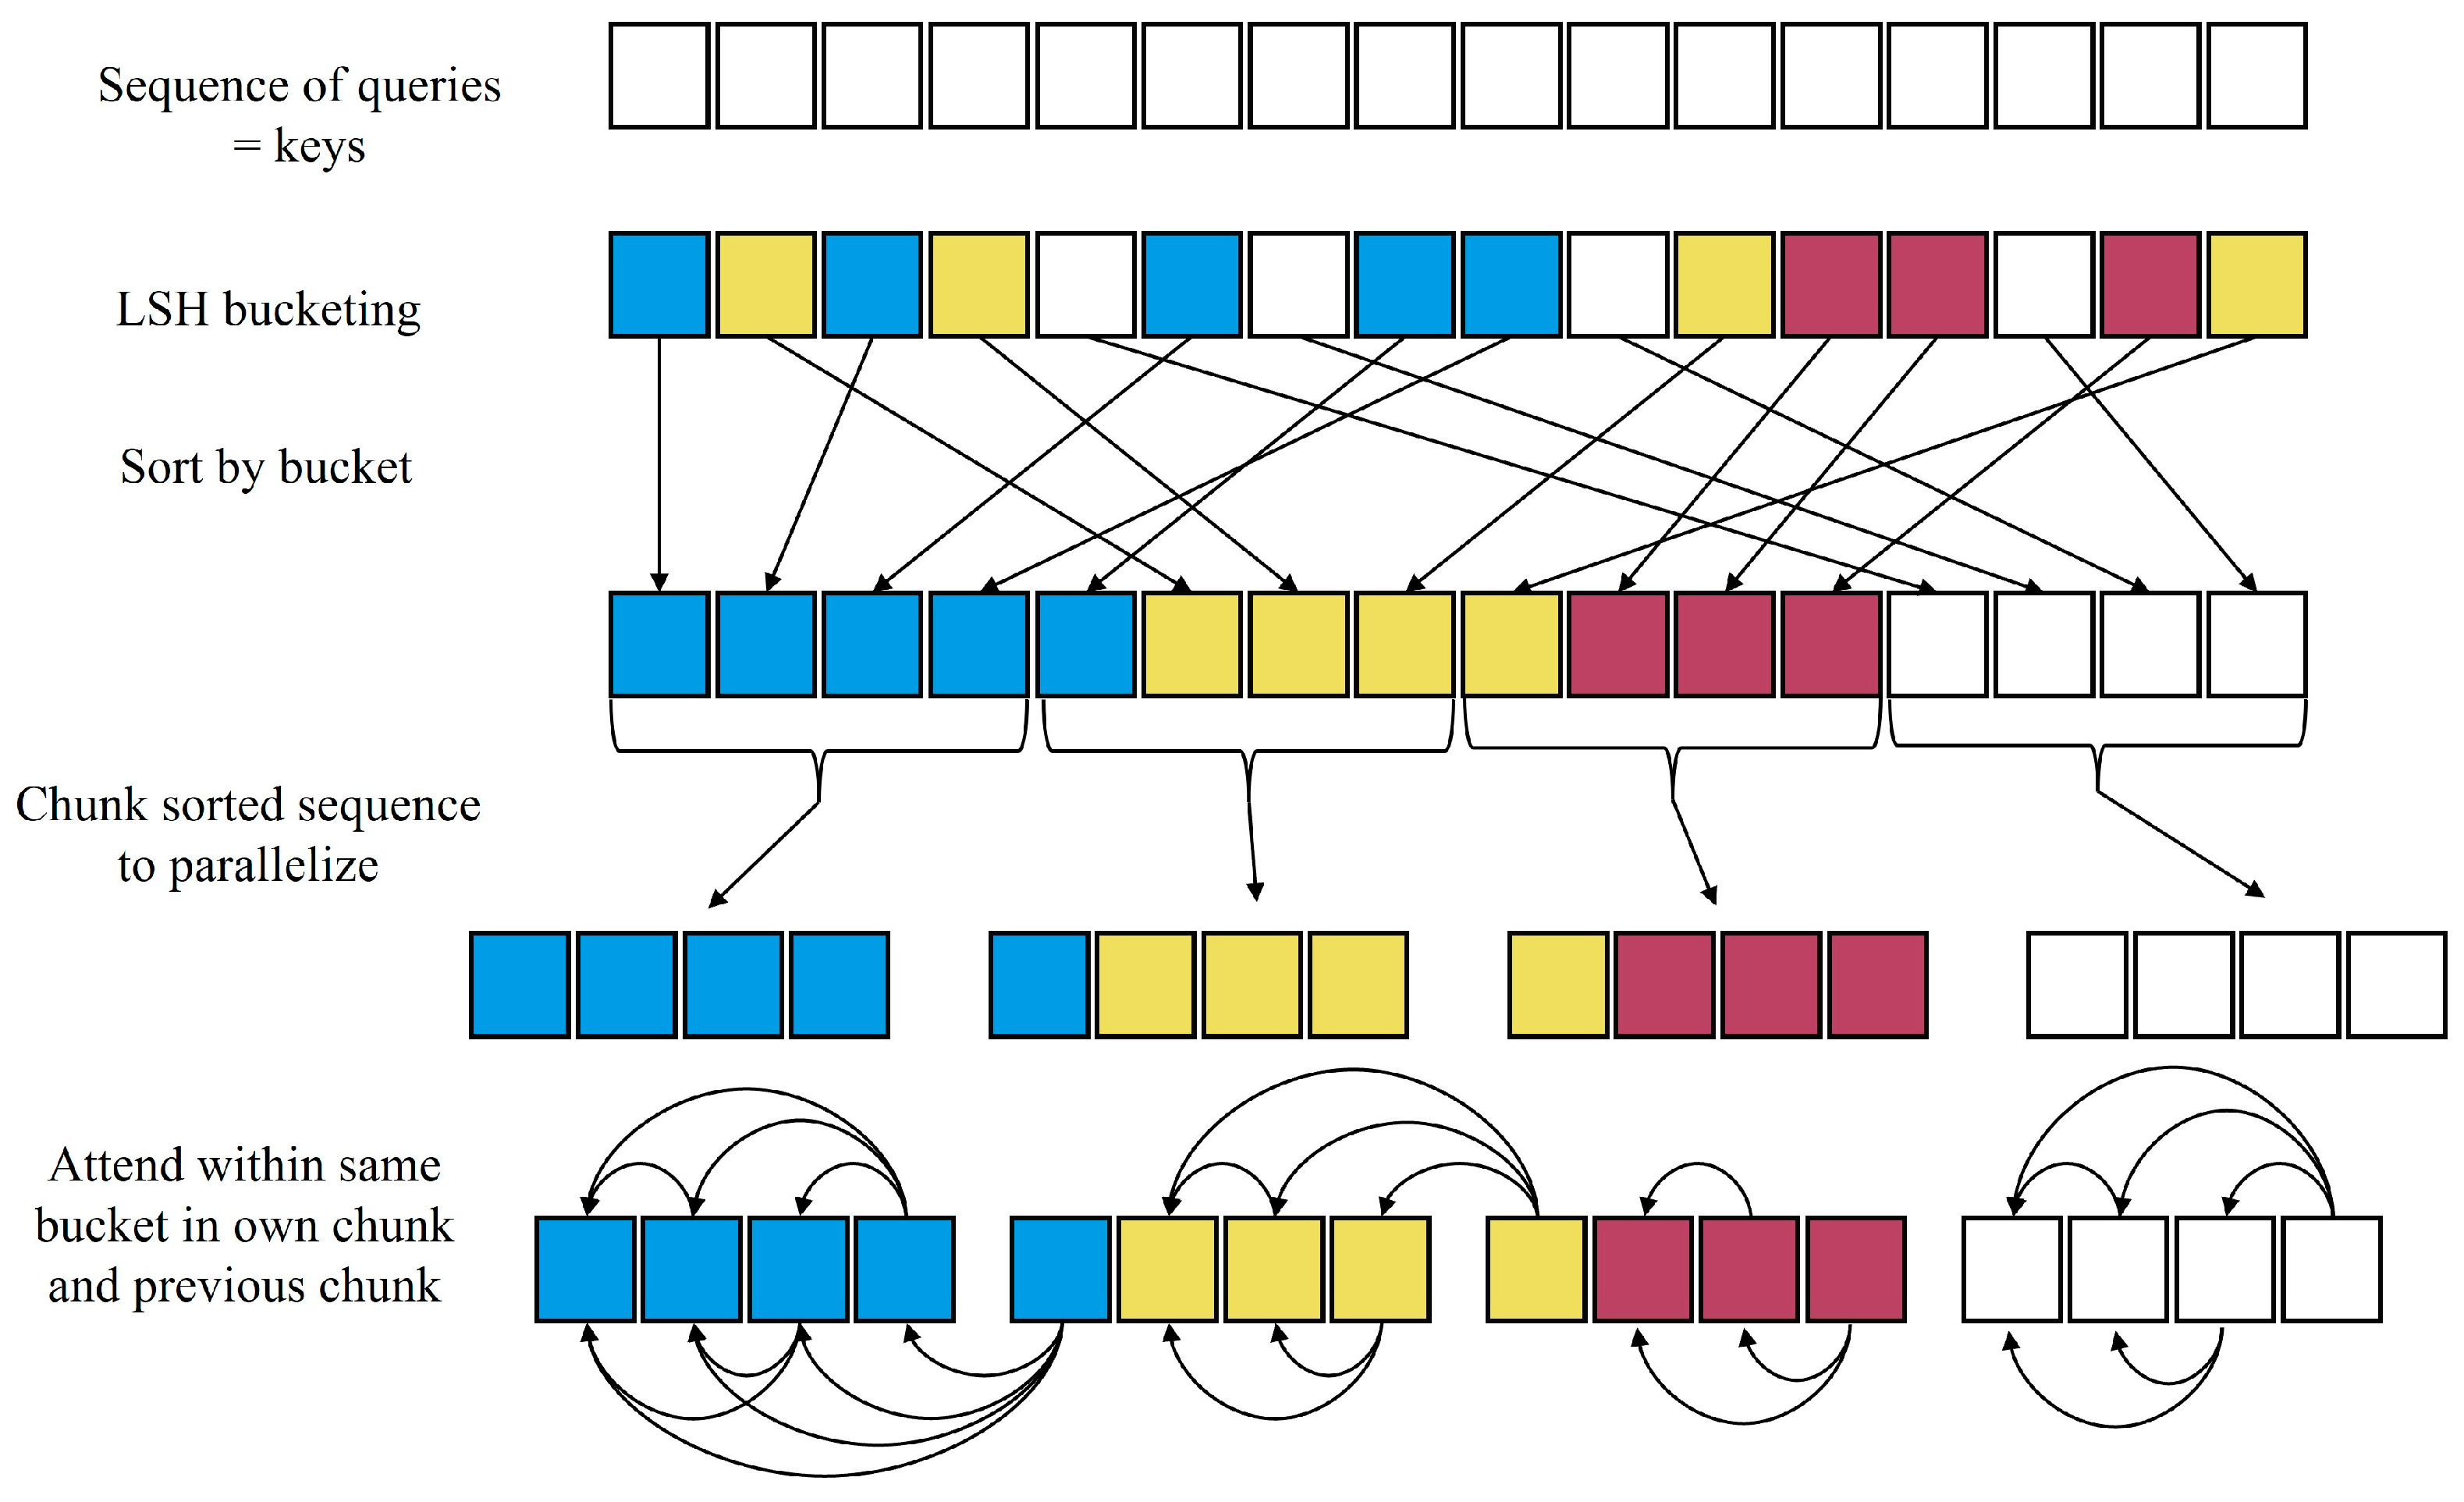
Reformer realized efficient processing of long sequences by introducing a Locality-Sensitive Hashing (LSH) attention mechanism. The standard transformer uses a fully self-attentional mechanism where each element interacts with every other element in the sequence, resulting in computational complexity and memory consumption growing over the square of the sequence length. Reformer introduces the LSH attention mechanism, as shown in Figure 6, by hashing input elements into LSH bucketing so that only elements in the same or similar bucket will perform attention calculations. This approach reduces the complexity from O( n 2 ) to close to O(n), greatly improving the efficiency of processing long sequences.
4.
Informer
The attention score of the self-attention mechanism in the standard transformer presents a long-tail distribution, that is, only a small number of points are directly and strongly related to other stores. Informer proposed a ProbSparse self-attention mechanism, which removes useless queries and reduces the computational amount in the process of calculating attention. In a standard transformer, the structure of the self-attention layer is usually flat, with no obvious hierarchical division when processing sequences. Informer adopted the self-attention layer of hierarchical structure and halved the shape of the sequence to gradually reduce the number of self-attention extraction layers and highlight the main attention, that is, the operation at red circle 2 in Figure 7. A generative decoder that obtains the result directly based on the input step is used. Compared with the step-by-step decoder in the original transformer, the inference speed of long sequence prediction is greatly improved.
5.
Flowformer
The advantages of Flowformer are as follows: First, the flow-based attention mechanism. The standard transformer model uses a fully self-attentional mechanism where each element interacts with all other elements in the sequence, causing computational complexity and memory consumption to grow over the square of the length of the sequence. Flowformer introduces a streaming attention mechanism that processes data through streams, as shown in Figure 8, which allows the model to focus only on the local context of the current element when processing a sequence, significantly reducing computational complexity and memory consumption. This approach allows Flowformer to efficiently handle very long sequences. Second, optimized memory management. When dealing with long sequences of data, the standard transformer needs to store a large number of intermediate states in its memory, which is very demanding on memory resources. Flowformer optimizes memory management through its streaming processing mechanism, reducing the need to store intermediate states and thus reducing memory consumption when processing long sequences.

3.2. Maximum Entropy

Several studies have investigated the entropy variation of seismic anomalies in the ionosphere [71,72,73]. Each anomaly observed across various geophysical domains (such as surface temperature, electromagnetic radiation, ionospheric variations, etc.) is perceived not as an isolated occurrence but as part of a self-organizing process aimed at reaching a state of maximum entropy [74]. The maximum entropy principle involves deriving the probability distribution of an unknown event based on the provided known information. It entails selecting the distribution with the highest entropy among those that conform to the specified constraints, thus eliminating subjective assumptions regarding the unknown data. This principle can be expressed mathematically as follows:
p y x = 1 Z ( x ) exp ( i n λ i ƒ i ( x , y )
p y x : the probability of earthquake anomaly under given TEC conditions.
Z ( x ) : normalized factor, ensure that the sum of probabilities is 1.
λ i : the weight parameter of the charateristic function ƒ i ( x , y ) .
As mentioned earlier, we input all precise known information into the transformer feature extractor. Subsequently, we employ the maximum entropy model for classification prediction. The Grid-search method is used to find the best parameter combination on the predefined hyperparameter space to improve the performance of the model.

3.3. Grid Search and Cross-Validation

Cross-validation is an essential technique for assessing model performance; it involves partitioning the dataset into training and validation sets multiple times, using different combinations of data in each iteration. The most prevalent form of this technique is K-fold cross-validation, where the dataset is split into K equal parts. Each part is used as a validation set once, with the remaining parts serving as the training set. The process iterates K times, with the average performance metric across all iterations serving as the model’s final evaluation. This method enhances model evaluation accuracy and mitigates randomness-induced errors by utilizing diverse training and validation sets.
Grid search is employed for hyperparameter tuning, aiming to identify the optimal set of parameters for model prediction. Unlike model parameters learned during training, hyperparameters are set manually at the model construction stage. Grid search performs an exhaustive search over a pre-defined range of hyperparameter values, evaluating each combination to determine the most effective one.
Integrating grid search with cross-validation for model tuning and evaluation ensures a comprehensive search for the optimal hyperparameters while rigorously assessing model performance. In our methodology, we adopt a 10-fold cross-validation approach, dividing the dataset into ten equal parts. For each iteration, nine parts are used for training, and one part is used for validation. This cycle repeats ten times, each with a unique validation subset, allowing for a thorough evaluation of model performance across various sets.

4. Results

In this section, first, a prediction task is performed on the dataset and model performance is evaluated using MAE, MSE, and RMSE. Subsequently, leveraging the best-performing model, ITransformer, we extract features from the dataset and design an ablation experiment. The aim of this experiment is to compare the performance of the maximum entropy model in classifying original TEC data with the performance of datasets based on feature extraction in classification prediction.

4.1. Evaluation of Improvement Model

Itransformer, Flashformer [75], Reformer [76], Informer [77], and Flowformer are selected to assess their performance on the dataset. Regarding the dataset, the IGS TEC map data from 2000 to 2023 are partitioned into training (70% of the total), testing (20% of the total), and validation (10% of the total) datasets. The input consists of four days’ worth of 48 TEC map data (with a time resolution of 2 h, totaling 12 map data for one day), while the output is the subsequent four days’ 48 TEC map data. The initial learning rate is set to lr = 0.0001, with a maximum of 30 training cycles. The model with the best training results is saved and updated during the iteration process.

Accuracy Evaluation

Mean absolute error (MAE), mean square error (MSE), root mean square error (RMSE), and mean square percentage error (MSPE) are selected for evaluation, and their equations are as follows. MAE is a robust evaluation measure that is insensitive to outliers, whereas MSE is greatly affected by outliers and can reflect the absolute size of the error. RMSE has the same units as the original data and is easier to interpret, but it is just as susceptible to outliers as MSE.
M S E = 1 n i = 1 n ( y ^ i y i ) 2
M A E = 1 n i = 1 n | y ^ i y i |
R M S E = 1 n i = 1 n ( y ^ i y i ) 2
The parameter settings for all models in the controlled experiment were consistent, as described in the Methods section. The forecasting results are listed in Table 2, with the best in bold. The lower MSE/MAE/RMSE indicates the more accurate prediction result.
Our analysis reveals that ITransformer excels in time series prediction tasks compared to other baseline models. To provide a visual representation of the model test results, we present a comparison of real input values and predicted values in Figure 9. Notably, ITransformer demonstrates superior performance compared to other models under identical input conditions.
We can observe that, except for ITransformer, other models exhibit notable errors in prediction. Specifically, model (4) tends to inaccurately predict high values, while models (3) and (5) tend to inaccurately predict low values. Models (2) and (5) show a tendency to predict with an advance, while model (3) tends to produce excessively smooth predictions. While these models are capable of handling long time series prediction tasks, they differ in their emphasis on improving the original model. Flashformer prioritizes optimizing computational efficiency, whereas Reformer excels in enhancing computing efficiency, reducing memory consumption, and processing long sequences effectively. While they may indirectly enhance the processing capacity of ionospheric data, they lack a targeted resolution mechanism for volatile nonlinear data.
We tried to analyze the reasons why ITransformer performed better in ionospheric sequence data. Figure 10 shows the training process of the data set in ITransformer. In Figure 10a, ITransformer aggregates changes across the entire sequence to create a comprehensive sequence representation [51], which enables it to better handle signal data with significant fluctuations. In Figure 10b, a self-attention mechanism is used to process the embedded variable tokens to enhance interpretability and reveal the correlation between the multiple variables. It is acknowledged that X t in the standard transformer may not precisely reflect the same actual event for all variables due to potential misalignment in time between events captured by different variables. Seismic anomalies in the ionosphere may manifest directionally and chronologically, even at the same altitude level. Therefore, ITransformer accounts for system lag and differing statistical properties among variables.

4.2. Ablation Experiments

In order to verify the rationality of the transformer’s information extraction capability to forecast tasks, we designed an ablation experiment to input the original time series data directly into the maximum entropy model for classification prediction, aiming to observe the impact of the feature extractor on prediction outcomes.
Because hyperparameters are very important for the training process and final performance of the model. For example, in the maximum entropy model, the regularization parameter can control the complexity of the model and increasing it can reduce the risk of overfitting. The maximum number of iterations and the iteration stop threshold can make the model converge in a limited time, so as to avoid premature fitting or premature stop, and so on. Therefore, regardless of whether the transformer is utilized, we identified the optimal hyperparameters for the model through a grid search employing the 10-fold cross-validation method. There was a minor disparity in the hyperparameters for the model with and without the transformer. However, after thorough testing, we concluded that this difference had no discernible effect on the final outcome. Therefore, the recommended hyperparameter settings are as follows: c = 0.07, max_iter = 800, solver = ‘lbfgs’. Here, c represents the regularization parameter, max_iter denotes the maximum number of iterations, and solver indicates the solver utilized.
Accuracy and recall rates were selected as evaluation metrics to assess changes in the model. The accuracy rate quantifies the proportion of predicted seismic anomalies that are true seismic anomalies, while the recall rate indicates the proportion of true seismic anomalies correctly identified by the model. The corresponding mathematical expression is as follows:
P r e c i s i o n = T P T P + F P
R e c a l l = T P T P + F N
TP (True Positive): correctly predicted positive class sample.
FP (False Positive): negative class sample incorrectly predicted as positive class.
FN (False Negative): positive class sample incorrectly predicted as negative class.
The confusion matrix diagram, as shown in Figure 11, depicts the test results for class zero and class one. It is evident that without the transformer as a feature extractor—when ionospheric data are directly input into the maximum entropy model—the model’s accuracy is lower compared to when the model is trained with features extracted using the transformer. This highlights a significant improvement in accuracy achieved by employing the transformer for feature extraction.
The accuracy has increased to 69%, and the recall rate has improved to 71%. Upon further scrutiny of the confusion matrix, it is evident that the miss probability has decreased from 34% to 29%, while the false probability has dropped from 43% to 32%. This underscores the significant enhancement in the prediction of seismic anomalies facilitated by ITransformer’s capability to extract information from ionospheric TEC data.

5. Discussion and Conclusions

Machine learning techniques have demonstrated a potential to analyze ionospheric anomalies for earthquake prediction, with advancements now encompassing deep learning methodologies [63]. Research by Chaplygina and Grafeeva [64], utilizing ionospheric sonde readings around earthquake zones, reported a prediction accuracy of 100% within 25% of the targeted region, albeit constrained by substantial data requirements. Similarly, Akyol et al. [66] achieved a commendable prediction accuracy of approximately 91.6% through the use of GPS-TEC data and geomagnetic indices for real-time earthquake precursor detection in an Italian locale, albeit with a false alarm rate of 54.2%.
This study advances the application of deep learning by employing transformer architecture, which exhibits superiority over LSTM and GRU models [49] from previous investigations. We demonstrate that transformers can efficiently process single-mode TEC spatiotemporal data, accurately identifying ionospheric seismic disturbances without prior errors when integrated with the maximum entropy model. This increase in accuracy comes from the transformer’s powerful information extraction and feature expression capabilities. The most obvious challenge lies in the uninterpretability of neural networks. It is mainly manifested in the following aspects: First, the implied nature of feature representation, which is not easy to feel and understand intuitively. Second, the complexity of weight parameters. Neural networks generate a large number of parameters in the training process and are constantly optimized, but the specific meaning of these parameters is often unclear, so it is difficult to infer the model decision process and logic from the model parameters. This unexplained mechanism prevents us from making targeted improvements. However, there may be another way to think about it. TEC variations are not the sole indicators of seismic activities. Research has also identified anomalies in radon gas emissions [12,68,69,70] and land surface temperatures [71,72,73,74] as precursors to earthquakes. Furthermore, a neural network does not need to fit a formula in advance in order to describe the relationship between input and output, and it can flexibly accept various input data of multiple modes, extract high-order and nonlinear features, and establish the mapping relationship between input and output, so as to carry out effective modeling and prediction.
The use of neural networks to establish a multi-modal ionospheric perception model is very worthy of discussion. For the abnormal disturbance caused by earthquakes, we may need more information to supplement TEC, such as ion temperature, O+ density, and other information, which can improve the accuracy of the model and reduce false positives. In addition, the parameters of geomagnetic activity and solar activity can also help to establish multi-classification models to judge whether ionospheric anomalies are caused by earthquakes. The realization of these visions requires more information with greater precision.

Author Contributions

Conceptualization, L.W. and Y.C.; methodology, L.W.; software, Z.L.; validation, Z.L., Y.C. and J.F.; formal analysis, J.W.; investigation, J.F.; resources, Z.L.; data curation, Y.C.; writing—original draft preparation, L.W.; writing—review and editing, L.W. and Z.L.; visualization, Y.C.; supervision, J.W.; project administration, Z.L. All authors have read and agreed to the published version of the manuscript.

Funding

This research was funded by the National Nature Science Foundation of China, grant number No. 41874019.

Institutional Review Board Statement

Not applicable.

Informed Consent Statement

Not applicable.

Data Availability Statement

The IGS TEC data products could be download at https://urs.earthdata.nasa.gov/, access on 20 October 2023. The earthquake catalogue could be download at https://earthquake.usgs.gov/earthquakes/, access on 10 September 2023.

Acknowledgments

The authors are grateful to the USGS for providing earthquake data and to GFZ and GUK for geomagnetic storm data. We also acknowledge the IGS for the availability of TEC data products.

Conflicts of Interest

The authors declare no conflicts of interest.

References

  1. Leonard, R.S.; Barnes, R., Jr. Observation of ionospheric disturbances following the Alaska earthquake. J. Geophys. Res. 1965, 70, 1250–1253. [Google Scholar] [CrossRef]
  2. Zhao, B.; Wang, M.; Yu, T.; Wan, W.; Lei, J.; Liu, L.; Ning, B. Is an unusual large enhancement of ionospheric electron density linked with the 2008 great Wenchuan earthquake? J. Geophys. Res. Space Phys. 2008, 113, 1–6. [Google Scholar] [CrossRef]
  3. Picozza, P.; Conti, L.; Sotgiu, A. Looking for earthquake precursors from space: A critical review. Front. Earth Sci. 2021, 9, 676775. [Google Scholar] [CrossRef]
  4. Jin, S.; Jin, R.; Liu, X. GNSS Atmospheric Seismology; Springer: Berlin/Heidelberg, Germany, 2019. [Google Scholar]
  5. Sharma, G.; Champati Ray, P.K.; Kannaujiya, S. Ionospheric Total Electron Content for Earthquake Precursor Detection. In Remote Sensing of Northwest Himalayan Ecosystems; Navalgund, R.R., Kumar, A.S., Nandy, S., Eds.; Springer: Singapore, 2019; pp. 57–66. [Google Scholar]
  6. Nayak, K.; López-Urías, C.; Romero-Andrade, R.; Sharma, G.; Guzmán-Acevedo, G.M.; Trejo-Soto, M.E. Ionospheric Total Electron Content (TEC) Anomalies as Earthquake Precursors: Unveiling the Geophysical Connection Leading to the 2023 Moroccan 6.8 Mw Earthquake. Geosciences 2023, 13, 319. [Google Scholar] [CrossRef]
  7. Nayak, K.; Romero-Andrade, R.; Sharma, G.; Zavala, J.L.C.; Urias, C.L.; Trejo Soto, M.E.; Aggarwal, S.P. A combined approach using b-value and ionospheric GPS-TEC for large earthquake precursor detection: A case study for the Colima earthquake of 7.7 Mw, Mexico. Acta Geod. Geophys. 2023, 58, 515–538. [Google Scholar] [CrossRef]
  8. Tsolis, G.; Xenos, T. Seismo-ionospheric coupling correlation analysis of earthquakes in Greece, using empirical mode decomposition. Nonlinear Process. Geophys. 2009, 16, 123–130. [Google Scholar] [CrossRef]
  9. Oikonomou, C.; Haralambous, H.; Muslim, B. Investigation of ionospheric precursors related to deep and intermediate earthquakes based on spectral and statistical analysis. Adv. Space Res. 2017, 59, 587–602. [Google Scholar] [CrossRef]
  10. Afraimovich, E.; Kiryushkin, V.; Perevalova, N. Determination of the characteristics of ionospheric perturbations in the near-field region of an earthquake epicenter. J. Commun. Technol. Electron. C/C Radiotekhnika I Elektron. 2002, 47, 739–747. [Google Scholar]
  11. Maekawa, S.; Horie, T.; Yamauchi, T.; Sawaya, T.; Ishikawa, M.; Hayakawa, M.; Sasaki, H. A statistical study on the effect of earthquakes on the ionosphere, based on the subionospheric LF propagation data in Japan. In Annales Geophysicae; Copernicus Publications: Göttingen, Germany, 2006; pp. 2219–2225. [Google Scholar]
  12. Liu, J.; Chen, Y.; Pulinets, S.; Tsai, Y.; Chuo, Y. Seismo-ionospheric signatures prior to M ≥ 6.0 Taiwan earthquakes. Geophys. Res. Lett. 2000, 27, 3113–3116. [Google Scholar] [CrossRef]
  13. Wang, X.; Jia, J.; Yue, D.; Ke, F. Analysis of ionospheric VTEC disturbances before and after the Yutian Ms7. 3 earthquake in the Xinjiang Uygur Autonomous Region. Geod. Geodyn. 2014, 5, 8–15. [Google Scholar]
  14. Liu, C.-Y.; Liu, J.-Y.; Chen, Y.-I.; Qin, F.; Chen, W.-S.; Xia, Y.-Q.; Bai, Z.-Q. Statistical analyses on the ionospheric total electron content related to M≥ 6.0 earthquakes in China during 1998–2015. Terr. Atmos. Ocean. Sci. 2018, 29, 485–498. [Google Scholar] [CrossRef]
  15. Thomas, J.; Huard, J.; Masci, F. A statistical study of global ionospheric map total electron content changes prior to occurrences of M ≥ 6.0 earthquakes during 2000–2014. J. Geophys. Res. Space Phys. 2017, 122, 2151–2161. [Google Scholar] [CrossRef]
  16. Chen, H.; Han, P.; Hattori, K. Recent Advances and Challenges in the Seismo-Electromagnetic Study: A Brief Review. Remote Sens. 2022, 14, 5893. [Google Scholar] [CrossRef]
  17. Xiong, P.; Long, C.; Zhou, H.; Battiston, R.; De Santis, A.; Ouzounov, D.; Zhang, X.; Shen, X. Pre-Earthquake Ionospheric Perturbation Identification Using CSES Data via Transfer Learning. Front. Environ. Sci. 2021, 9, 779255. [Google Scholar] [CrossRef]
  18. Bilitza, D. IRI the international standard for the ionosphere. Adv. Radio Sci. 2018, 16, 1–11. [Google Scholar] [CrossRef]
  19. Nava, B.; Coisson, P.; Radicella, S. A new version of the NeQuick ionosphere electron density model. J. Atmos. Sol.-Terr. Phys. 2008, 70, 1856–1862. [Google Scholar] [CrossRef]
  20. Wang, N.; Yuan, Y.; Li, Z.; Li, M.; Huo, X. Performance analysis of different NeQuick ionospheric model parameters. Acta Geod. Cartogr. Sin. 2017, 46, 421. [Google Scholar]
  21. Raymund, T.D.; Austen, J.R.; Franke, S.; Liu, C.; Klobuchar, J.; Stalker, J. Application of computerized tomography to the investigation of ionospheric structures. Radio Sci. 1990, 25, 771–789. [Google Scholar] [CrossRef]
  22. Llewellyn, S.K. Documentation and Description of the Bent Ionospheric Model; US Department of Commerce, National Technical Information Service: Alexandria, VA, USA, 1973.
  23. Pignalberi, A.; Pezzopane, M.; Rizzi, R.; Galkin, I. Effective solar indices for ionospheric modeling: A review and a proposal for a real-time regional IRI. Surv. Geophys. 2018, 39, 125–167. [Google Scholar] [CrossRef]
  24. Natras, R.; Goss, A.; Halilovic, D.; Magnet, N.; Mulic, M.; Schmidt, M.; Weber, R. Regional ionosphere delay models based on CORS data and machine learning. NAVIGATION J. Inst. Navig. 2023, 70, navi.577. [Google Scholar] [CrossRef]
  25. Ghaffari Razin, M.R.; Voosoghi, B. Ionosphere time series modeling using adaptive neuro-fuzzy inference system and principal component analysis. GPS Solut. 2020, 24, 51. [Google Scholar] [CrossRef]
  26. Sivavaraprasad, G.; Ratnam, D.V. Performance evaluation of ionospheric time delay forecasting models using GPS observations at a low-latitude station. Adv. Space Res. 2017, 60, 475–490. [Google Scholar] [CrossRef]
  27. Ogunsua, B.; Laoye, J.; Fuwape, I.; Rabiu, A. The comparative study of chaoticity and dynamical complexity of the low-latitude ionosphere, over Nigeria, during quiet and disturbed days. Nonlinear Process. Geophys. 2014, 21, 127–142. [Google Scholar] [CrossRef]
  28. Lin, J.-W. Ionospheric total electron content anomalies due to Typhoon Nakri on 29 May 2008: A nonlinear principal component analysis. Comput. Geosci. 2012, 46, 189–195. [Google Scholar] [CrossRef]
  29. Lin, X.; Wang, H.; Zhang, Q.; Yao, C.; Chen, C.; Cheng, L.; Li, Z. A spatiotemporal network model for global ionospheric TEC forecasting. Remote Sens. 2022, 14, 1717. [Google Scholar] [CrossRef]
  30. Xiao, Z.; Xiao, S.G.; Hao, Y.Q.; Zhang, D.H. Morphological features of ionospheric response to typhoon. J. Geophys. Res. Space Phys. 2007, 112. [Google Scholar] [CrossRef]
  31. Hernández-Pajares, M.; Juan, J.; Sanz, J. Neural network modeling of the ionospheric electron content at global scale using GPS data. Radio Sci. 1997, 32, 1081–1089. [Google Scholar] [CrossRef]
  32. Ji, E.Y.; Moon, Y.J.; Park, E. Improvement of IRI global TEC maps by deep learning based on conditional Generative Adversarial Networks. Space Weather 2020, 18, e2019SW002411. [Google Scholar] [CrossRef]
  33. Cesaroni, C.; Spogli, L.; Aragon-Angel, A.; Fiocca, M.; Dear, V.; De Franceschi, G.; Romano, V. Neural network based model for global Total Electron Content forecasting. J. Space Weather Space Clim. 2020, 10, 11. [Google Scholar] [CrossRef]
  34. Li, X.; Zhou, C.; Tang, Q.; Zhao, J.; Zhang, F.; Xia, G.; Liu, Y. Forecasting Ionospheric foF2 Based on Deep Learning Method. Remote Sens. 2021, 13, 3849. [Google Scholar] [CrossRef]
  35. Srivani, I.; Prasad, G.S.V.; Ratnam, D.V. A deep learning-based approach to forecast ionospheric delays for GPS signals. IEEE Geosci. Remote Sens. Lett. 2019, 16, 1180–1184. [Google Scholar] [CrossRef]
  36. Zhang, F.; Zhou, C.; Wang, C.; Zhao, J.; Liu, Y.; Xia, G.; Zhao, Y. Global ionospheric TEC prediction based on deep learning. Chin. J. Radio Sci. 2021, 36, 553–561. [Google Scholar]
  37. Chen, Z.; Liao, W.; Li, H.; Wang, J.; Deng, X.; Hong, S. Prediction of global ionospheric TEC based on deep learning. Space Weather 2022, 20, e2021SW002854. [Google Scholar] [CrossRef]
  38. Tang, J.; Li, Y.; Ding, M.; Liu, H.; Yang, D.; Wu, X. An ionospheric TEC forecasting model based on a CNN-LSTM-attention mechanism neural network. Remote Sens. 2022, 14, 2433. [Google Scholar] [CrossRef]
  39. Zewdie, G.K.; Valladares, C.; Cohen, M.B.; Lary, D.J.; Ramani, D.; Tsidu, G.M. Data-driven forecasting of low-latitude ionospheric total electron content using the random forest and LSTM machine learning methods. Space Weather 2021, 19, e2020SW002639. [Google Scholar] [CrossRef]
  40. Wen, Z.; Li, S.; Li, L.; Wu, B.; Fu, J. Ionospheric TEC prediction using Long Short-Term Memory deep learning network. Astrophys. Space Sci. 2021, 366, 3. [Google Scholar] [CrossRef]
  41. Reddybattula, K.D.; Nelapudi, L.S.; Moses, M.; Devanaboyina, V.R.; Ali, M.A.; Jamjareegulgarn, P.; Panda, S.K. Ionospheric TEC forecasting over an Indian low latitude location using long short-term memory (LSTM) deep learning network. Universe 2022, 8, 562. [Google Scholar] [CrossRef]
  42. Tang, R.; Zeng, F.; Chen, Z.; Wang, J.-S.; Huang, C.-M.; Wu, Z. The comparison of predicting storm-time ionospheric TEC by three methods: ARIMA, LSTM, and Seq2Seq. Atmosphere 2020, 11, 316. [Google Scholar] [CrossRef]
  43. Iluore, K.; Lu, J. Long short-term memory and gated recurrent neural networks to predict the ionospheric vertical total electron content. Adv. Space Res. 2022, 70, 652–665. [Google Scholar] [CrossRef]
  44. Bi, C.; Ren, P.; Yin, T.; Zhang, Y.; Li, B.; Xiang, Z. An Informer Architecture-Based Ionospheric foF2 Model in the Middle Latitude Region. IEEE Geosci. Remote Sens. Lett. 2022, 19, 1–5. [Google Scholar] [CrossRef]
  45. Shih, C.Y.; Lin, C.Y.T.; Lin, S.Y.; Yeh, C.H.; Huang, Y.M.; Hwang, F.N.; Chang, C.H. Forecasting of Global Ionosphere Maps with Multi-Day Lead Time Using Transformer-Based Neural Networks. Space Weather 2024, 22, e2023SW003579. [Google Scholar] [CrossRef]
  46. Wu, X.; Fan, C.; Tang, J.; Cheng, Y. Forecast of global ionospheric TEC using an improved Transformer model. Adv. Space Res. 2024; in press. [Google Scholar]
  47. Xia, G.; Liu, M.; Zhang, F.; Zhou, C. CAiTST: Conv-attentional image time sequence transformer for ionospheric TEC maps forecast. Remote Sens. 2022, 14, 4223. [Google Scholar] [CrossRef]
  48. Lin, M.; Zhu, X.; Tu, G.; Chen, X. Optimal Transformer Modeling by Space Embedding for Ionospheric Total Electron Content Prediction. IEEE Trans. Instrum. Meas. 2022, 71, 1–14. [Google Scholar] [CrossRef]
  49. Vaswani, A.; Shazeer, N.; Parmar, N.; Uszkoreit, J.; Jones, L.; Gomez, A.N.; Kaiser, Ł.; Polosukhin, I. Attention is all you need. In Proceedings of the 31st Conference on Neural Information Processing Systems (NIPS 2017), Long Beach, CA, USA, 4–9 December 2017; Volume 30. [Google Scholar]
  50. Liu, Y.; Hu, T.; Zhang, H.; Wu, H.; Wang, S.; Ma, L.; Long, M. itransformer: Inverted transformers are effective for time series forecasting. arXiv 2023, arXiv:2310.06625. [Google Scholar]
  51. Feltens, J.; Schaer, S. IGS Products for the Ionosphere. In Proceedings of the 1998 IGS Analysis Center Workshop, Darmstadt, Germany, 9–11 February 1998; pp. 3–5. [Google Scholar]
  52. Kagan, Y.Y. Accuracy of modern global earthquake catalogs. Phys. Earth Planet. Inter. 2003, 135, 173–209. [Google Scholar] [CrossRef]
  53. Yu, T.; Mao, T.; Wang, Y.; Wang, J. Study of the ionospheric anomaly before the Wenchuan earthquake. Chin. Sci. Bull. 2009, 54, 1080–1086. [Google Scholar] [CrossRef]
  54. Astafyeva, E.; Shalimov, S.; Olshanskaya, E.; Lognonné, P. Ionospheric response to earthquakes of different magnitudes: Larger quakes perturb the ionosphere stronger and longer. Geophys. Res. Lett. 2013, 40, 1675–1681. [Google Scholar] [CrossRef]
  55. Pulinets, S.; Legen’Ka, A.; Gaivoronskaya, T.; Depuev, V.K. Main phenomenological features of ionospheric precursors of strong earthquakes. J. Atmos. Sol.-Terr. Phys. 2003, 65, 1337–1347. [Google Scholar] [CrossRef]
  56. Shah, M.; Jin, S. Statistical characteristics of seismo-ionospheric GPS TEC disturbances prior to global Mw ≥ 5.0 earthquakes (1998–2014). J. Geodyn. 2015, 92, 42–49. [Google Scholar] [CrossRef]
  57. Ulukavak, M.; Yalçınkaya, M.; Kayıkçı, E.T.; Öztürk, S.; Kandemir, R.; Karslı, H. Analysis of ionospheric TEC anomalies for global earthquakes during 2000-2019 with respect to earthquake magnitude (Mw ≥ 6.0). J. Geodyn. 2020, 135, 101721. [Google Scholar] [CrossRef]
  58. Colonna, R.; Filizzola, C.; Genzano, N.; Lisi, M.; Tramutoli, V. Optimal Setting of Earthquake-Related Ionospheric TEC (Total Electron Content) Anomalies Detection Methods: Long-Term Validation over the Italian Region. Geosciences 2023, 13, 150. [Google Scholar] [CrossRef]
  59. López-Urias, C.; Vazquez-Becerra, G.E.; Nayak, K.; López-Montes, R. Analysis of Ionospheric Disturbances during X-Class Solar Flares (2021–2022) Using GNSS Data and Wavelet Analysis. Remote Sens. 2023, 15, 4626. [Google Scholar] [CrossRef]
  60. Matzka, J.; Stolle, C.; Yamazaki, Y.; Bronkalla, O.; Morschhauser, A. The geomagnetic Kp index and derived indices of geomagnetic activity. Space Weather 2021, 19, e2020SW002641. [Google Scholar] [CrossRef]
  61. Pedatella, N.M.; Lei, J.; Thayer, J.P.; Forbes, J.M. Ionosphere response to recurrent geomagnetic activity: Local time dependency. J. Geophys. Res. Space Phys. 2010, 115. [Google Scholar] [CrossRef]
  62. Loewe, C.A.; Prölss, G.W. Classification and mean behavior of magnetic storms. J. Geophys. Res. Space Phys. 1997, 102, 14209–14213. [Google Scholar] [CrossRef]
  63. Angelopoulos, V.; Baumjohann, W.; Kennel, C.; Coroniti, F.V.; Kivelson, M.; Pellat, R.; Walker, R.; Lühr, H.; Paschmann, G. Bursty bulk flows in the inner central plasma sheet. J. Geophys. Res. Space Phys. 1992, 97, 4027–4039. [Google Scholar] [CrossRef]
  64. Pujol, S.; Bedirhanoglu, I.; Donmez, C.; Dowgala, J.D.; Eryilmaz-Yildirim, M.; Klaboe, K.; Koroglu, F.B.; Lequesne, R.D.; Ozturk, B.; Pledger, L. Quantitative evaluation of the damage to RC buildings caused by the 2023 southeast Turkey earthquake sequence. Earthq. Spectra 2024, 40, 505–530. [Google Scholar] [CrossRef]
  65. Liu, J.; Chen, Y.; Chuo, Y.; Tsai, H.F. Variations of ionospheric total electron content during the Chi-Chi earthquake. Geophys. Res. Lett. 2001, 28, 1383–1386. [Google Scholar] [CrossRef]
  66. Silina, A.; Liperovskaya, E.; Liperovsky, V.; Meister, C.-V. Ionospheric phenomena before strong earthquakes. Nat. Hazards Earth Syst. Sci. 2001, 1, 113–118. [Google Scholar] [CrossRef]
  67. Pulinets, S.; Contreras, A.L.; Bisiacchi-Giraldi, G.; Ciraolo, L. Total electron content variations in the ionosphere before the Colima, Mexico, earthquake of 21 January 2003. Geofísica Int. 2005, 44, 369–377. [Google Scholar] [CrossRef]
  68. Mehdi, S.; Shah, M.; Naqvi, N.A. Lithosphere atmosphere ionosphere coupling associated with the 2019 M w 7.1 California earthquake using GNSS and multiple satellites. Environ. Monit. Assess. 2021, 193, 501. [Google Scholar] [CrossRef]
  69. Krankowski, A.; Zakharenkova, I.E.; Shagimuratov, I.I. Response of the ionosphere to the Baltic Sea earthquake of 21 September 2004. Acta Geophys. 2006, 54, 90–101. [Google Scholar] [CrossRef]
  70. Potirakis, S.; Minadakis, G.; Eftaxias, K. Relation between seismicity and pre-earthquake electromagnetic emissions in terms of energy, information and entropy content. Nat. Hazards Earth Syst. Sci. 2012, 12, 1179–1183. [Google Scholar] [CrossRef]
  71. Potirakis, S.; Minadakis, G.; Nomicos, C.; Eftaxias, K. A multidisciplinary analysis for traces of the last state of earthquake generation in preseismic electromagnetic emissions. Nat. Hazards Earth Syst. Sci. 2011, 11, 2859–2879. [Google Scholar] [CrossRef]
  72. Donner, R.V.; Potirakis, S.M.; Balasis, G.; Eftaxias, K.; Kurths, J. Temporal correlation patterns in pre-seismic electromagnetic emissions reveal distinct complexity profiles prior to major earthquakes. Phys. Chem. Earth Parts A/B/C 2015, 85, 44–55. [Google Scholar] [CrossRef]
  73. Pulinets, S. The synergy of earthquake precursors. Earthq. Sci. 2011, 24, 535–548. [Google Scholar] [CrossRef]
  74. Hua, W.; Dai, Z.; Liu, H.; Le, Q. Transformer quality in linear time. In Proceedings of the International Conference on Machine Learning, Baltimore, MD, USA, 17–23 July 2022; pp. 9099–9117. [Google Scholar]
  75. Kitaev, N.; Kaiser, Ł.; Levskaya, A. Reformer: The efficient transformer. arXiv 2020, arXiv:2001.04451. [Google Scholar]
  76. Zhou, H.; Zhang, S.; Peng, J.; Zhang, S.; Li, J.; Xiong, H.; Zhang, W. Informer: Beyond efficient transformer for long sequence time-series forecasting. In Proceedings of the AAAI Conference on Artificial Intelligence, Virtually, 2–9 February 2021; pp. 11106–11115. [Google Scholar]
  77. Huang, Z.; Shi, X.; Zhang, C.; Wang, Q.; Cheung, K.C.; Qin, H.; Dai, J.; Li, H. Flowformer: A transformer architecture for optical flow. In Proceedings of the European Conference on Computer Vision, Tel Aviv, Israel, 23–27 October 2022; pp. 668–685. [Google Scholar]
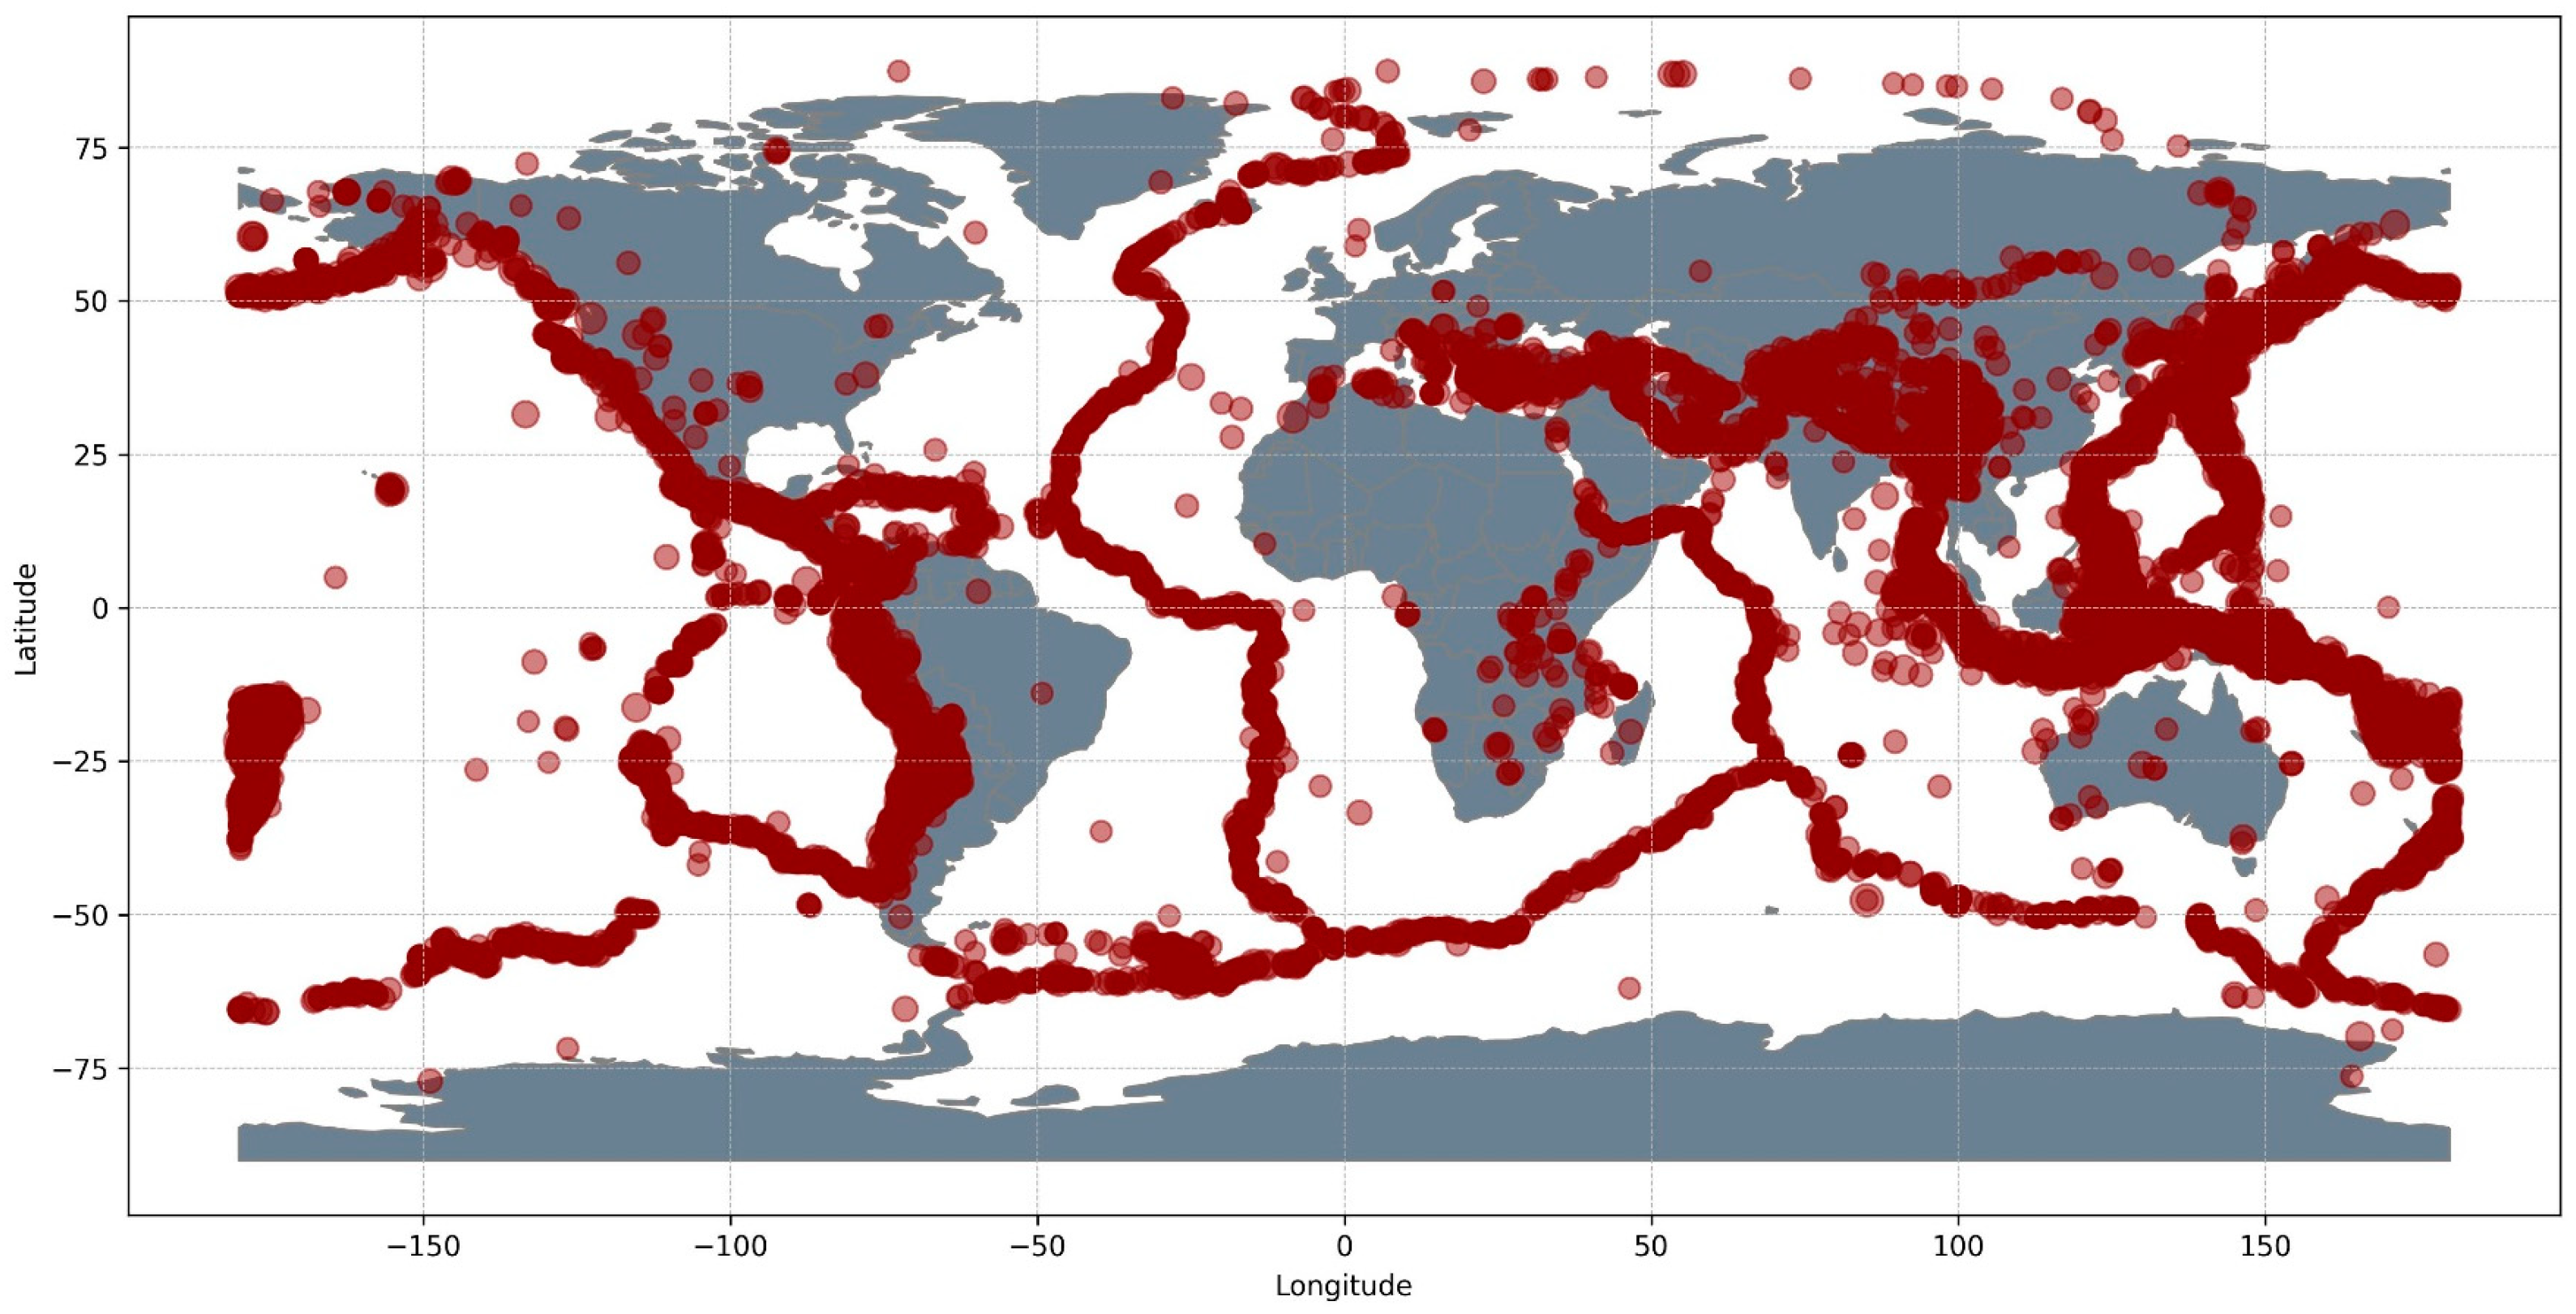
Figure 1. The red dots are all seismic events occurring between 2000 and 2023 under conditions of quiet geomagnetic and solar activity, with magnitude > 5 and depth < 50 km.
Atmosphere 15 00419 g001
Figure 2. The construction of the dataset and the architecture of MaxEnt SeismoSense Model. Here, X t represents the input time series data, with ‘t’ denoting consecutive days, while P represents the prediction of seismic anomalies.
Atmosphere 15 00419 g002
Figure 3. Standard transformer. Red circle A: positional encoding; red circle B: self-attention and multi-head attention; red circle C: feed forward network.
Atmosphere 15 00419 g003
Figure 4. Improvement mechanism of ITransformer. The original transformer view is at the top and the ITransformer view is at the bottom. Transformer embeds the temporal token, which contains the multivariate representation of each time step. ITransformer embeds each series independently to the variate token, so the attention module depicts the multivariate correlations and the feed-forward network encodes series representations.
Atmosphere 15 00419 g004
Figure 5. (a) The principal structure of GAU. (b) The top is the linear attention mechanism in the original transformer, and the bottom is the block-mixed attention mechanism proposed for Flashformer, which significantly reduces the compute in quadratic attention (red links), while requiring substantially less RNN-style steps (green squares).
Atmosphere 15 00419 g005
Figure 6. Simplified depiction of LSH attention showing the hash-bucketing, sorting, and chunking steps and the resulting causal attentions.
Atmosphere 15 00419 g006
Figure 7. The principal structure of Informer. Red circle 1: ProbSparse self-attention mechanism; red circle 2: distilling operation; red circle 3: one-step generative decoder.
Atmosphere 15 00419 g007
Figure 8. Streaming-attention mechanism of Flowformer.
Atmosphere 15 00419 g008
Figure 9. The horizontal axis: input sequence (length = 48); the vertical axis: normalized TEC value. The corresponding models (ae) are ITransformer (a), Flashformer (b), Reformer (c), Informer (d), and Flowformer (e), respectively.
Atmosphere 15 00419 g009
Figure 10. Overall structure of ITransformer. For the input and output: i = 1, 2, 3, …, m…42; j = 1, 2, 3, …, n; m = number of features, n = number of samples. (a) Temporal series data on latitude and longitude grid points are independently embedded as tokens. (b) Self-attention is applied to embedded variate tokens. (c) Series representations of each token are extracted by the shared FFN. (d) Layer normalization is adopted to reduce discrepancies among variates.
Atmosphere 15 00419 g010
Figure 11. Confusion matrix indicating the distribution of the predicted and true values. (a) The prediction results obtained directly using the maximum entropy model. (b) The training results obtained using the output data from the transformer feature extractor.
Atmosphere 15 00419 g011
Table 1. Data for building the MaxEnt SeismoSense Model.
DataTimespanSource
TEC grid product2000–2023Ionosphere Associate Analysis Centers (IAACs) of the International
GNSS Service
Earthquake catalogue2000–2023US Geological Survey
Kp & F10.72000–2023GFZ
AE & Dst2000–2023Geomagnetism at the University of Kyoto
Table 2. The performance of all models on the data set.
ITransformerFlashformerReformerInformerFlowformer
MSE   ( / T E C U 2 ) 0.106 10.5873.5378.1220.756
MAE   ( / T E C U )0.221 10.6011.1921.8910.684
RMSE (/TECU)0.325 10.7661.8812.8490.869
1 Bold represents the best results.
Disclaimer/Publisher’s Note: The statements, opinions and data contained in all publications are solely those of the individual author(s) and contributor(s) and not of MDPI and/or the editor(s). MDPI and/or the editor(s) disclaim responsibility for any injury to people or property resulting from any ideas, methods, instructions or products referred to in the content.