Article

Improved Ionospheric Total Electron Content Maps over China Using Spatial Gridding Approach

1
Shandong Provincial Key Laboratory of Water and Soil Conservation and Environmental Protection, College of Resources and Environment, Linyi University, Linyi 276000, China
2
Jiangsu Key Laboratory of Resources and Environmental Information Engineering, China University of Mining and Technology, Xuzhou 221116, China
3
School of Environmental Science and Spatial Informatics, China University of Mining and Technology, Xuzhou 221116, China
*
Author to whom correspondence should be addressed.
Atmosphere 2024, 15(3), 351; https://doi.org/10.3390/atmos15030351
Submission received: 17 February 2024 / Revised: 7 March 2024 / Accepted: 8 March 2024 / Published: 13 March 2024

Abstract

:
Precise regional ionospheric total electron content (TEC) models play a crucial role in correcting ionospheric delays for single-frequency receivers and studying variations in the Earth’s space environment. A particle swarm optimization neural network (PSO-NN)-based model for ionospheric TEC over China has been developed using a long-term (2008–2021) ground-based global positioning system (GPS), COSMIC, and Fengyun data under geomagnetic quiet conditions. In this study, a spatial gridding approach is utilized to propose an improved version of the PSO-NN model, named the PSO-NN-GRID. The root-mean-square error (RMSE) and mean absolute error (MAE) of the TECs estimated from the PSO-NN-GRID model on the test data set are 3.614 and 2.257 TECU, respectively, which are 7.5% and 5.5% smaller than those of the PSO-NN model. The improvements of the PSO-NN-GRID model over the PSO-NN model during the equinox, summer, and winter of 2015 are 0.4–22.1%, 0.1–12.8%, and 0.2–26.2%, respectively. Similarly, in 2019, the corresponding improvements are 0.5–13.6%, 0–10.1%, and 0–16.1%, respectively. The performance of the PSO-NN-GRID model is also verified under different solar activity conditions. The results reveal that the RMSEs for the TECs estimated by the PSO-NN-GRID model, with F10.7 values ranging within [0, 80), [80, 100), [100, 130), [130, 160), [160, 190), [190, 220), and [220, +), are, respectively, 1.0%, 2.8%, 4.7%, 5.5%, 10.1%, 9.1%, and 28.4% smaller than those calculated by the PSO-NN model.

1. Introduction

The ionosphere is an ionized part of the Earth’s atmosphere, spanning an altitude range from approximately 50 km to 1000 km. The existence of electrons in the ionosphere is sufficient to affect the propagation of transionospheric radio waves, leading to signal delays in global navigation satellite system (GNSS) observations. The extent of signal delay relies on the total number of free electrons along the signal path between the satellite and the receiver. While this error in dual-frequency measurements can mostly be eliminated by a linear combination of the two observations, single-frequency measurements require additional information to mitigate ionospheric errors. It is widely recognized that the first-order ionospheric range error is proportional to the total electron content (TEC). Consequently, ionospheric corrections can be provided by models of TEC or by TEC maps. Accurate TEC models play an important role in correcting ionospheric delays in single-frequency receivers and studying variations in Earth’s space environment across various spatial and temporal scales.
Broadcast ionospheric delay correction models, e.g., the Klobuchar model [1,2], the NeQuick model [3,4], and the BeiDou global broadcast ionospheric delay correction model (BDGIM) [5] are commonly utilized in transionospheric propagation applications. These models are well-known for their computational efficiency and are considered as climate models that capture the average behavior of the ionosphere. Apart from the broadcast ionospheric delay correction models mentioned above, there are additional empirical models that describe the average variations in ionospheric parameters, e.g., the International Reference Ionosphere (IRI) model [6,7]. In addition, there exist physics-based ionospheric models that aim to characterize various ionospheric parameters. These models include the Global Ionosphere Thermosphere Model (GITM) [8], the Parameterized Ionospheric Model (PIM) [9], and the Utah State University (USU) Global Assimilation of Ionospheric Measurements (GAIMs) models [10]. Primarily designed to depict global ionospheric weather conditions, these models typically offer lower accuracy and lower spatial resolution when applied to local regions.
Ground-based GNSSs have become a powerful tool for monitoring the ionosphere and studying space weather effects due to its advantages of high accuracy, global coverage, and near real-time availability. As a result, researchers have been able to establish regional ionospheric TEC models using ground-based GNSS observations to meet the needs of regional GNSS applications. For instance, Bergeot et al. [11] utilized the dense EUREF Permanent GNSS Network (EPN) to monitor the ionosphere over Europe from the measured delays in the GNSS signals, and provided ionospheric vertical TEC maps over Europe. Aa et al. [12] used the data assimilation method based on the Kalman filter technique to assimilate GNSS observations from the Crustal Movement Observation Network of China (CMONOC) and the International GNSS Service (IGS) networks into the background IRI model, and generated regional TEC maps over China and adjacent areas. Li et al. [13] compared several widely used interpolation algorithms, i.e., Ordinary Kriging (OrK), Universal Kriging (UnK), planar fit and Inverse Distance Weighting (IDW), and they found that, for the China region, it was more suitable to use OrK and UnK in place of the planar fit and IDW model to estimate ionospheric delay and complete positioning. Li et al. [14] proposed a regional ionospheric TEC model based on a two-layer approximation and two spherical harmonic (SH) functions and validated its performance over Australian and Chinese areas; the results showed that the performance of the new model was relatively better than the traditional one-layer model in estimating ionospheric TEC and positioning.
GNSS radio occultation is an innovative remote-sensing technique that enables the retrieval of ionospheric electron density profiles with high accuracy and high vertical resolution. These space-borne measurements can be effectively employed for ionospheric monitoring in the same way as ground-based observations. Consequently, the robustness of ionospheric observations, as well as their spatial and temporal resolution, improve with the rapid growth in the number of ground-based and space-borne radio links. Moreover, with recent advancements in artificial intelligence and the continuous improvement of computer performance, artificial neural networks (ANNs) have emerged as a widely utilized tool for ionospheric modeling. ANNs have shown promise in establishing empirical models for ionospheric parameters, including ionospheric peak electron density (NmF2), critical frequency (foF2), and TEC [15,16,17,18,19,20]. Researchers have extensively explored the use of multi-source data and ANNs to develop high-quality high-resolution regional ionospheric TEC models [21,22,23,24,25,26,27]. For example, Maruyama [28] constructed a regional reference model of TEC over Japan using a neural network technique and long-term data from the Global Positioning System (GPS) Earth Observation Network (GEONET). Razin et al. [29] compared the performance of ANN, polynomial fitting, and kriging interpolation, and the results showed that the ANN method outperformed other methods in modeling TEC over Iran using data from the Iranian permanent GPS network. Song et al. [20] used the observations from 43 permanent GPS stations in CMONOC along with a genetic algorithm (GA)-optimized NN to develop a regional TEC model over China, and the result showed that the GA-NN model outperformed the BP-NN and IRI2012 models. Okoh et al. [30] developed a neural network-based TEC model over the African region using ground-based and space-borne observations; the results showed that the model offers opportunities to conduct high spatial resolution investigations over the African region.
Recently, a comprehensive ionospheric TEC model over China has been developed using long-term observations from 257 GPS stations and space-borne GNSS radio occultation systems (COSMIC and Fengyun) by Shi et al. [31]. This model, named PSO-NN, was developed based on a hybrid method composed of the particle swarm optimization (PSO) and ANN. The PSO-NN model demonstrated the successful prediction of TEC variations in relation to solar activity, location, and season, and effectively captured large-scale ionospheric anomalies, i.e., the mid-latitude summer nighttime anomaly over China. However, the accuracy of the PSO-NN model was not evenly distributed across China due to its vast geographical extent, particularly exhibiting lower accuracy in the low latitude regions.
In this paper, we introduce an improved version of the PSO-NN model, developed by incorporating a “gridded neural networks” method. This improved model is referred to as PSO-NN-GRID. The materials and methods used in the development of the PSO-NN-GRID model are described in Section 2. The performance of the PSO-NN-GRID model is evaluated by comparing it with out-of-sample ground-based GPS measurements and the PSO-NN model in Section 3. A brief discussion is given in Section 4, and the conclusions are drawn in Section 5.

2. Materials and Methods

2.1. Materials

The CMONOC, operated primarily by the China Earthquake Administration, is recognized as one of the most advanced crustal movement observation networks in the world. In this work, dual-frequency observations obtained from 257 permanent GPS stations were used to build the new model. The geographic location of the 257 GNSS receivers is shown in Figure 1, and data from the 12 (red) and 245 (blue) stations were used to test and construct the new model, respectively. A small spatial grid, as shown in the inset of Figure 1, is described in detail in Section 2.2.
The pseudo-range observations of the signals transmitted at frequencies f 1 and f 2 , as recorded by GPS receivers at these stations, can be expressed as follows:
P 1 , r s = ρ r s + c ( δ t r δ t s ) + d i o n 1 , r s + d t r o p , r s + c ( ε 1 s + ε 1 , r ) + Δ
P 2 , r s = ρ r s + c ( δ t r δ t s ) + d i o n 2 , r s + d t r o p , r s + c ( ε 2 s + ε 2 , r ) + Δ
where the subscript r and superscript s denote the receiver and satellite index, respectively; ρ r s is the actual range between the receiver r and satellite s ; δ t r is the clock error for the receiver; δ t s is the clock error for the satellite; c is the speed of light in a vacuum; d i o n is the ionosphere delay; d t r o p is the troposphere delay; ε s and ε r are the biases for the satellite and receiver, respectively; and Δ denotes other sources of error, e.g., antenna, multipath, and noise errors.
The linear combination of pseudo-range can be expressed as follows:
P 2 , r s P 1 , r s = d i o n 2 , r s d i o n 1 , r s c ( D C B s + D C B r )
where D C B r and D C B s represent the differential code biases for the receiver and satellite, respectively. These biases are estimated as a daily constant using the least-squares method [32].
In Equation (3), d i o n , r s can be approximated as
d i o n , r s = 40.28 × S T E C r s f 2
where S T E C r s represents the slant TEC along the path of the GPS signal propagated between the satellite s and receiver r .
The S T E C r s can be extracted as follows:
S T E C r s = f 1 2 f 2 2 40.28 ( f 1 2 f 2 2 ) [ P 2 , r s P 1 , r s + c ( D C B s + D C B r ) ]
Once the S T E C is obtained, the vertical TEC (VTEC) can be calculated from it based on the assumption that all the electrons condensed to a thin shell:
V T E C r s = S T E C r s / m f
where m f is the mapping function, and it can be expressed as 1 R R + H cos e 2 1 2 ; H is the height of the ionospheric thin shell; R is the earth radius; and e is the satellite elevation angle.
Observations from the GNSS radio occultation systems (COSMIC and Fengyun) were also used in this work. The Constellation Observing System for Meteorology, Ionosphere, and Climate (COSMIC) is a joint project sponsored by the National Space Program Office (NSPO) of Taiwan and the University Corporation for Atmospheric Research (UCAR) of the United States. COSMIC has demonstrated its effectiveness as a valuable tool for global space weather monitoring and ionospheric research [33,34]. The first generation of COSMIC (COSMIC-1) consisted of six satellites launched into a circular low-Earth orbit from the Vandenberg Air Force Base on 15 April 2006 and was decommissioned in 2020. COSMIC-1 operated at an orbit altitude of approximately 800 km with an inclination of 72°, providing approximately 1500–2000 electron density profiles (EDPs) per day. As a subsequent operational mission, COSMIC-2, the second generation of COSMIC, was successfully launched on 25 June 2019. The six COSMIC-2 satellites were launched into orbit with an inclination of 24° and an initial orbit altitude of about 700 km. When the Tri-GNSS Radio-Occultation Receiver System (TGRS) operates stably, COSMIC-2 can provide about 4000 EDPs daily over middle and low latitudes. The vast quantity of observations provided by the COSMIC-2 mission is of great significance for ionospheric research [35,36]. Numerous researchers have conducted validations of these COSMIC observations, with the results indicating good agreement between COSMIC data and measurements from ionosondes and incoherent scatter radars [37,38,39].
Feng-Yun 3C (FY-3C), the first operational satellite for the second generation of Chinese polar-orbiting meteorological satellites, was launched on 23 September 2013 from the Taiyuan Launch Center in China. It was equipped with the Global Navigation Occultation Sounder (GNOS) and deployed into an orbit with an inclination of 98.75° and an orbit altitude of 836 km. The GNOS carried by FY-3C was the first occultation sounder designed to receive signals from the Beidou and GPS systems. As part of the subsequent FY-3 series of operational meteorological satellites, Feng-Yun 3D (FY-3D) was an afternoon-orbiting satellite launched on 14 November 2017, with an average orbit altitude of 830.73 km and an inclination angle of 98.66°. FY-3C and FY-3D provided 150–200 and 400–500 globally distributed EDPs per day, respectively.
The COSMIC EDPs can be obtained from the second level data accessible at the COSMIC Data Analysis and Archive Centre (CDAAC) website https://www.cosmic.ucar.edu/ (accessed on 10 February 2023). The FY-3 EDPs can be downloaded from the National Satellite Meteorological Center website http://satellite.nsmc.org.cn/portalsite/Data (accessed on 10 February 2023). For a given radio occultation event, the VTEC obtained is assigned to the geographic location with the maximum electron density. However, it is important to note that the methods for obtaining VTEC from COSMIC and FY-3 observations are different. In the case of COSMIC, the VTEC includes both the region below and above the satellite’s orbit. On the other hand, the VTECs derived from FY-3 are obtained through the integration of EDPs. In this study, EDPs with a longitude span above 15° and a latitude span above 10° or/and the peak height of the F2-layer below 200 km or above 500 km are removed [40]; only EDPs with tangent points for peak densities falling within the rectangular region bounded by geographic longitudes 70° to 140° E and geographic latitudes 15° to 55° N are utilized to develop the new model.
In the development of the PSO-NN-GRID model, indices of solar and geomagnetic activities are also used. The solar radio flux at a wavelength of 10.7 cm (F10.7) and the disturbance storm time (Dst) index are selected to represent the level of solar and geomagnetic activities. The F10.7 data are obtained from the Goddard Space Flight Center via the website https://omniweb.gsfc.nasa.gov/ (accessed on 10 February 2023). The Dst indices are obtained from the World Data Center for Geomagnetism, Kyoto, from the website http://wdc.kugi.kyoto-u.ac.jp/ (accessed on 10 February 2023).

2.2. Methods

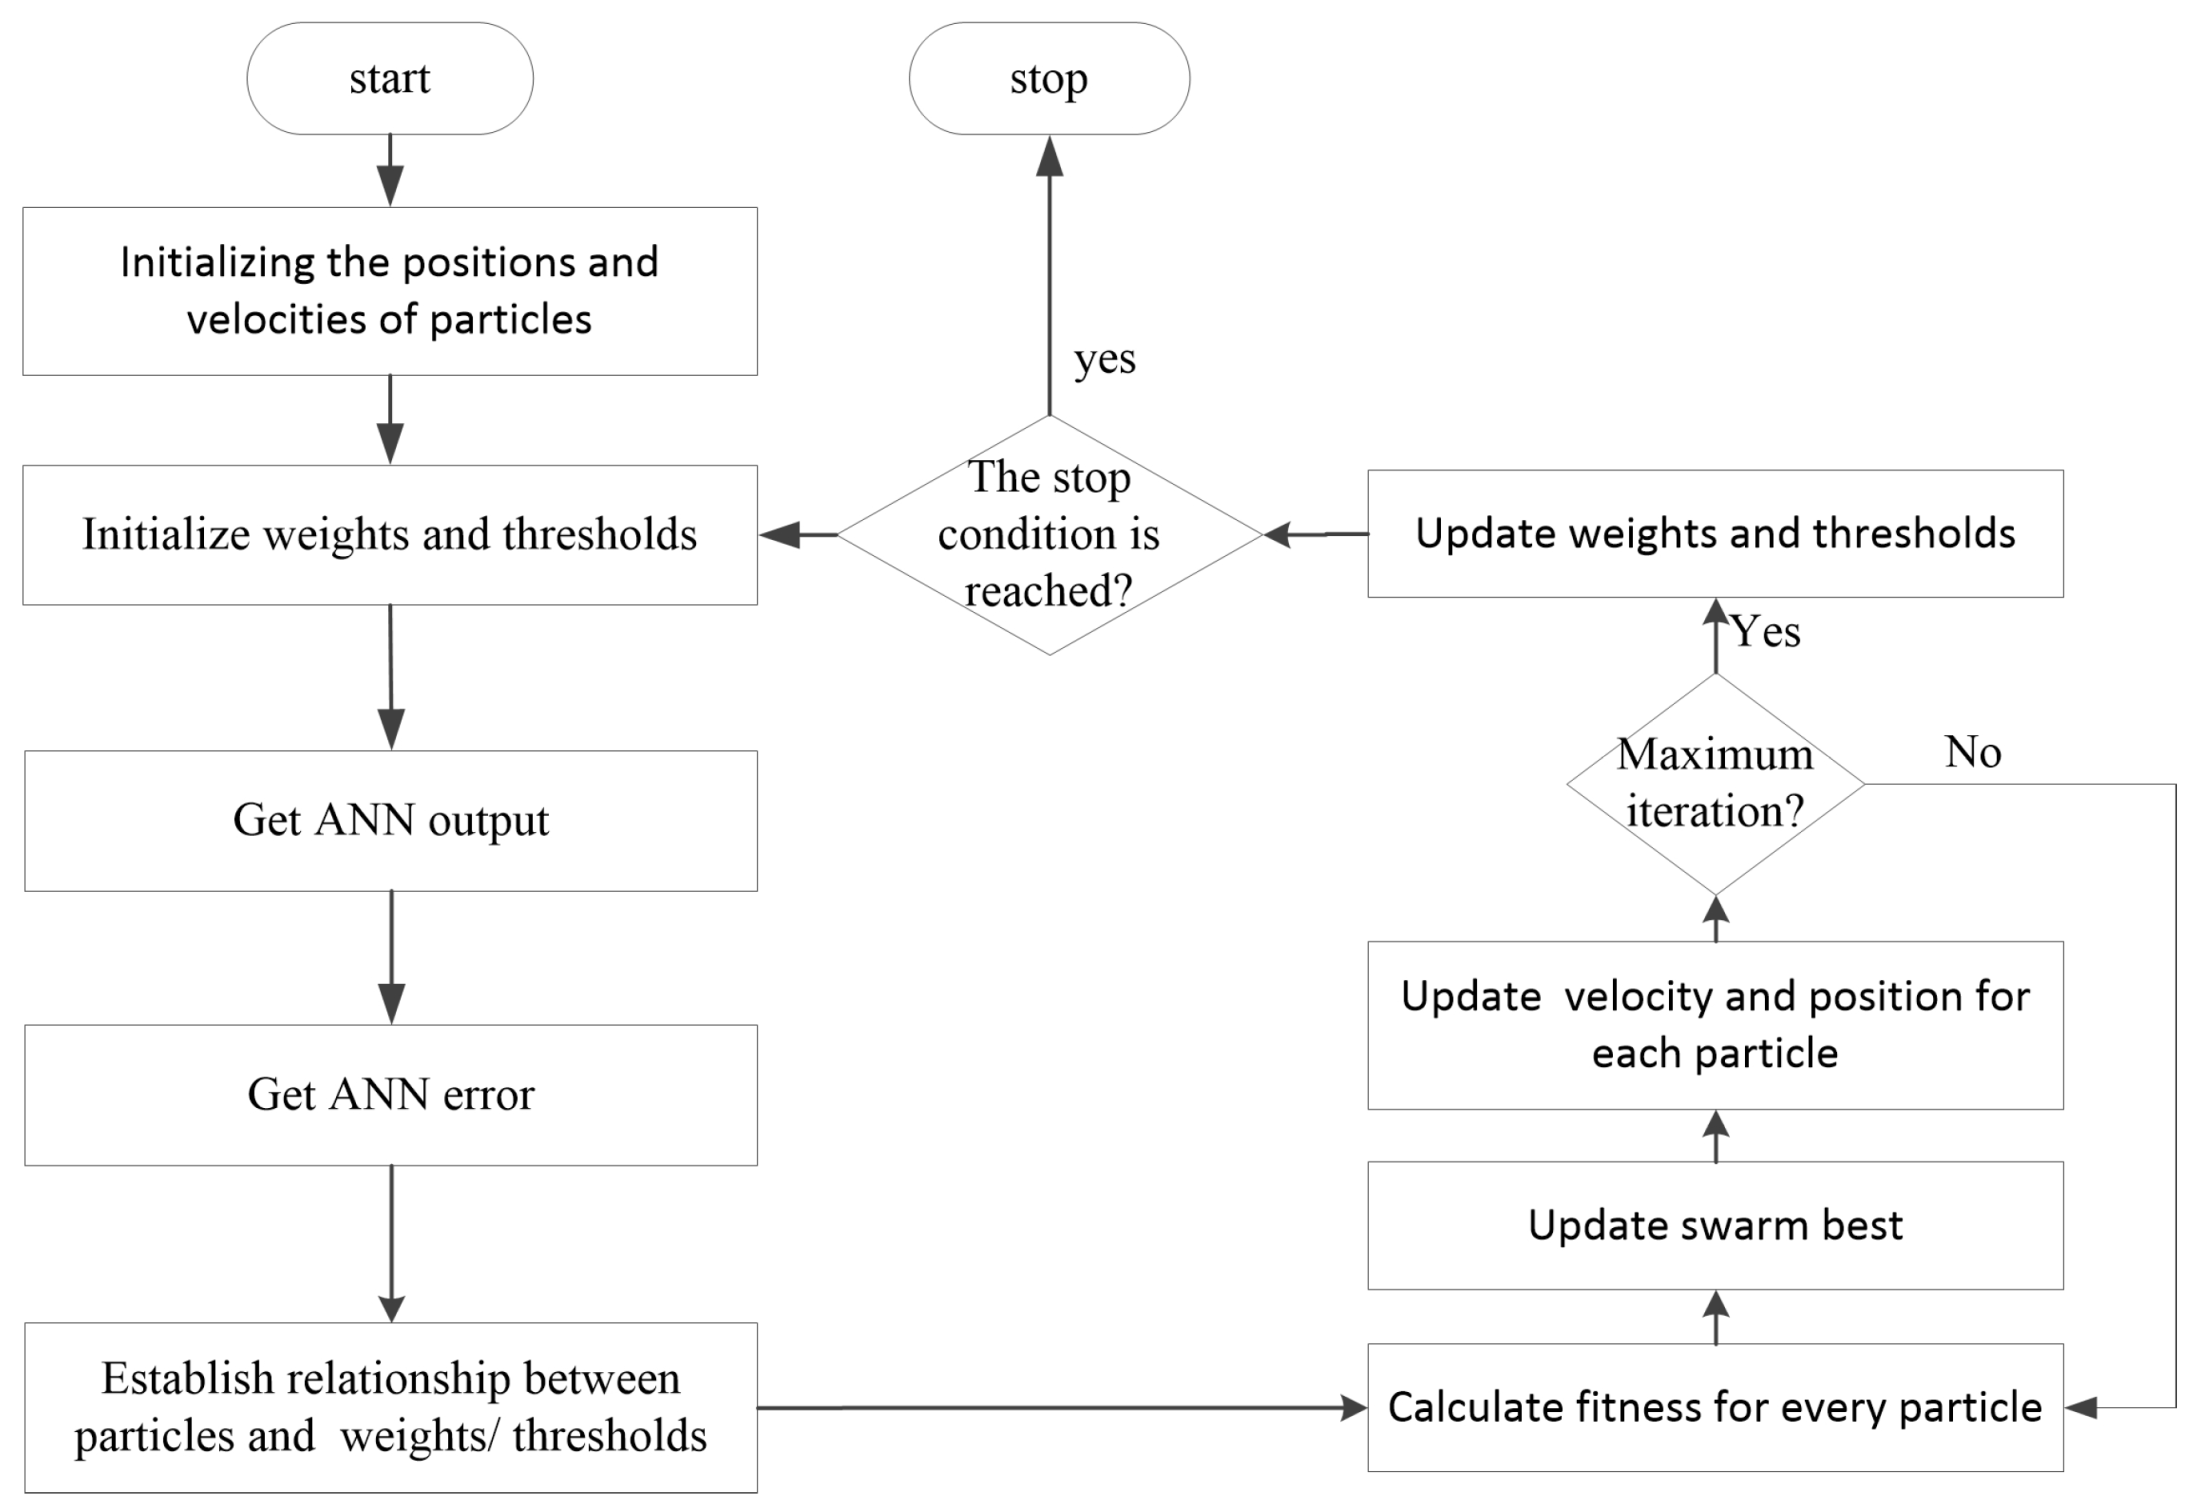
In this work, data obtained from both ground-based and space-borne techniques within China and adjacent areas are divided into 25 smaller spatial grids. These grids have dimensions of 18° in geographic longitude and 10° in geographic latitude, and are located within the geographic boundaries of 70° to 140° E in longitude and 15° to 55° N in latitude. For smoother transitions between these grids, an overlap of 5° in longitude and 2.5° in latitude are introduced. Within the overlapping area, the model value at each point is determined by taking the average of the model values from all the spatial grids in which the point is located. In each individual spatial grid, a model based on particle swarm optimization neural networks is established using the data in that spatial grid. Then, the 25 trained networks are combined using a front-end code to construct the PSO-NN-GRID model. The flow chart depicting the particle swarm optimization neural networks algorithm is shown in Figure 2. To train the data within each spatial grid, neural networks are used with the same set of input and output parameters as the PSO-NN model [31]. The input parameters consist of sine and cosine components of the day of year (DOYs and DOYc), sine and cosine components of local time (HODs and HODc), geographic longitude, geographic latitude, F10.7, and Dst. The output parameter is VTEC.
Neural networks (NNs) are computational models inspired by biological nervous systems and find extensive use in tasks involving pattern recognition, classification, and prediction. NNs obtain empirical knowledge from its environment and improve its performance through learning. During this learning process, the weights and biases are continuously optimized until predetermined conditions are met. The back propagation (BP) algorithm is the most commonly utilized algorithm for NN learning. The formula of the forward propagation is as follows:
h i = f i ( W i h i 1 + b i ) , 1 i L , h 0 = x , h L = y
where h i is the output of the i th layer; f i is the activation function; W i and b i are the model’s weight and threshold values; and x is the raw input variable.
The function of learning error is as follows:
E = 1 2 j = 1 J ( y j O j )
where J is the number of neurons in the output layer; and O is the output dataset.
The gradient descent method is employed to adjust the weight values of all layers during back propagation. The formulas for the modification of the weight and threshold values are as follows:
W i j ( k + 1 ) = W i j ( k ) + η E W i j
θ j ( k + 1 ) = θ j ( k ) + η E θ j
where k represents the number of iterations; η is the learning rate; and E W i j and E θ j represent the negative gradient of the error with respect to the weight and threshold, respectively.
However, the BP algorithm suffers from drawbacks of a slow convergence rate and local minima problem. To address these challenges, researchers have proposed many algorithms, such as the genetic algorithm (GA) and PSO algorithm. Research results indicate that the performance of the PSO algorithm is better than GA [41], and the implementation of PSO is relatively simple. Hence, in this work, the PSO algorithm is used to optimize the NN by refining the weights. The PSO algorithm is inspired by observations of social behavior among flocks of birds searching for food. Each particle within the swarm represents a potential solution, where its position signifies a particular set of weights for the ongoing iteration. As can be seen from Figure 2, the position and velocity for each particle in the particle swarm are randomly initialized first. In each epoch, particles compute new velocities to update their positions, moving through the weight space to minimize learning errors. The change in particle position corresponds to weight updates in the network. Every particle keeps track of its previous best position and corresponding fitness value. This iterative process continues until either a satisfactory error is achieved by the best particle globally or the maximum iteration limit is exceeded. In this research, the neural network training is implemented using functions available in MATLAB’s neural network toolbox.
Before the establishment of the PSO-NN-GRID model, the calibration of space-borne RO observations to the ground-based GNSS observation level was achieved using particle swarm optimization and neural network techniques [31]. The data in each spatial grid are randomly divided into three data sets: a training data set (70%), a validation data set (15%), and a test data set (15%). The training data set is used to obtain the functional relationship between the input and output parameters and estimate the weights. The validation data set is used to verify the performance of the network, while the test data set is used to evaluate the learning efficiency of the network by comparing the actual target values with the model output values. Following multiple training iterations, the structures of the 25 neural networks are determined, and these 25 trained networks are combined to form the PSO-NN-GRID model.

3. Results

3.1. Analysis on Different Sample Data Sets

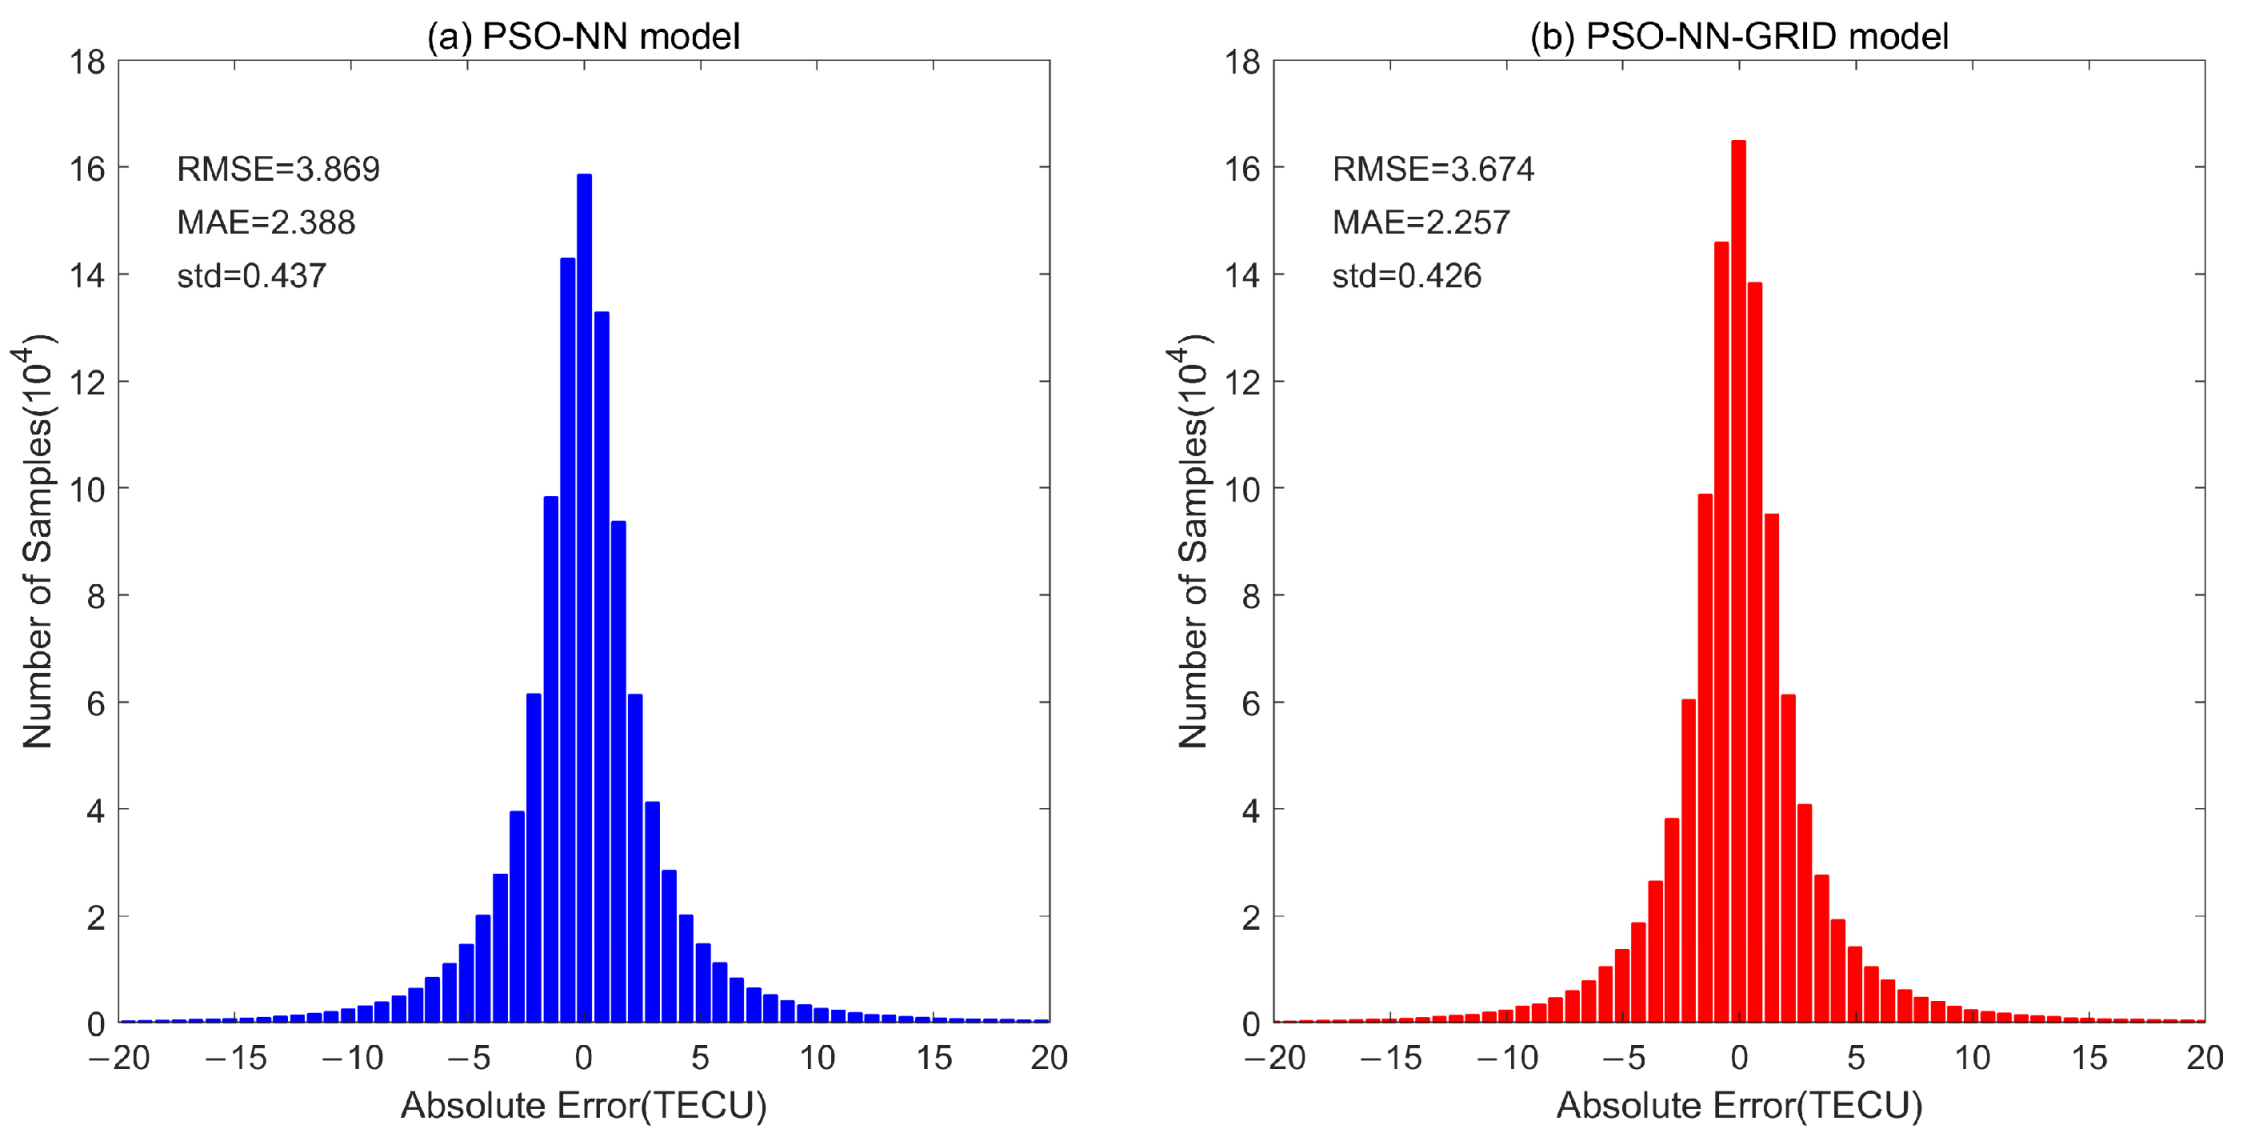
In this study, ground-based GPS observations from CMONOC and the space-borne RO measurements from COSMIC, FY-3C, and FY-3D from 2008 to 2021 are used to develop the PSO-NN-GRID model. It is important to note that only data collected during quiet geomagnetic conditions (−20 nT ≤ Dst ≤ 20 nT) are considered for this study. Therefore, this model cannot be used for analyzing TEC variations under geomagnetic storm conditions. In future investigations, we will conduct a comprehensive analysis to examine the effects of geomagnetic storms on TEC. Figure 3 shows the error distribution histogram of TEC estimated from the PSO-NN and PSO-NN-GRID models for the test data set.
As depicted in Figure 3, the errors of TEC estimated from both the PSO-NN model and the PSO-NN-GRID model exhibit characteristics of a normal distribution. Furthermore, the majority of errors for both models are concentrated within the range of ±5 TECU. Specifically, for the PSO-NN model, the root-mean-square error (RMSE) is 3.906 TECU, the mean absolute error (MAE) is 2.388 TECU, and the standard deviation (std) is 0.437 TECU. Comparatively, the PSO-NN-GRID model demonstrates better performance with an RMSE value of 3.614 TECU, a MAE value of 2.257 TECU, and a std value of 0.426 TECU.
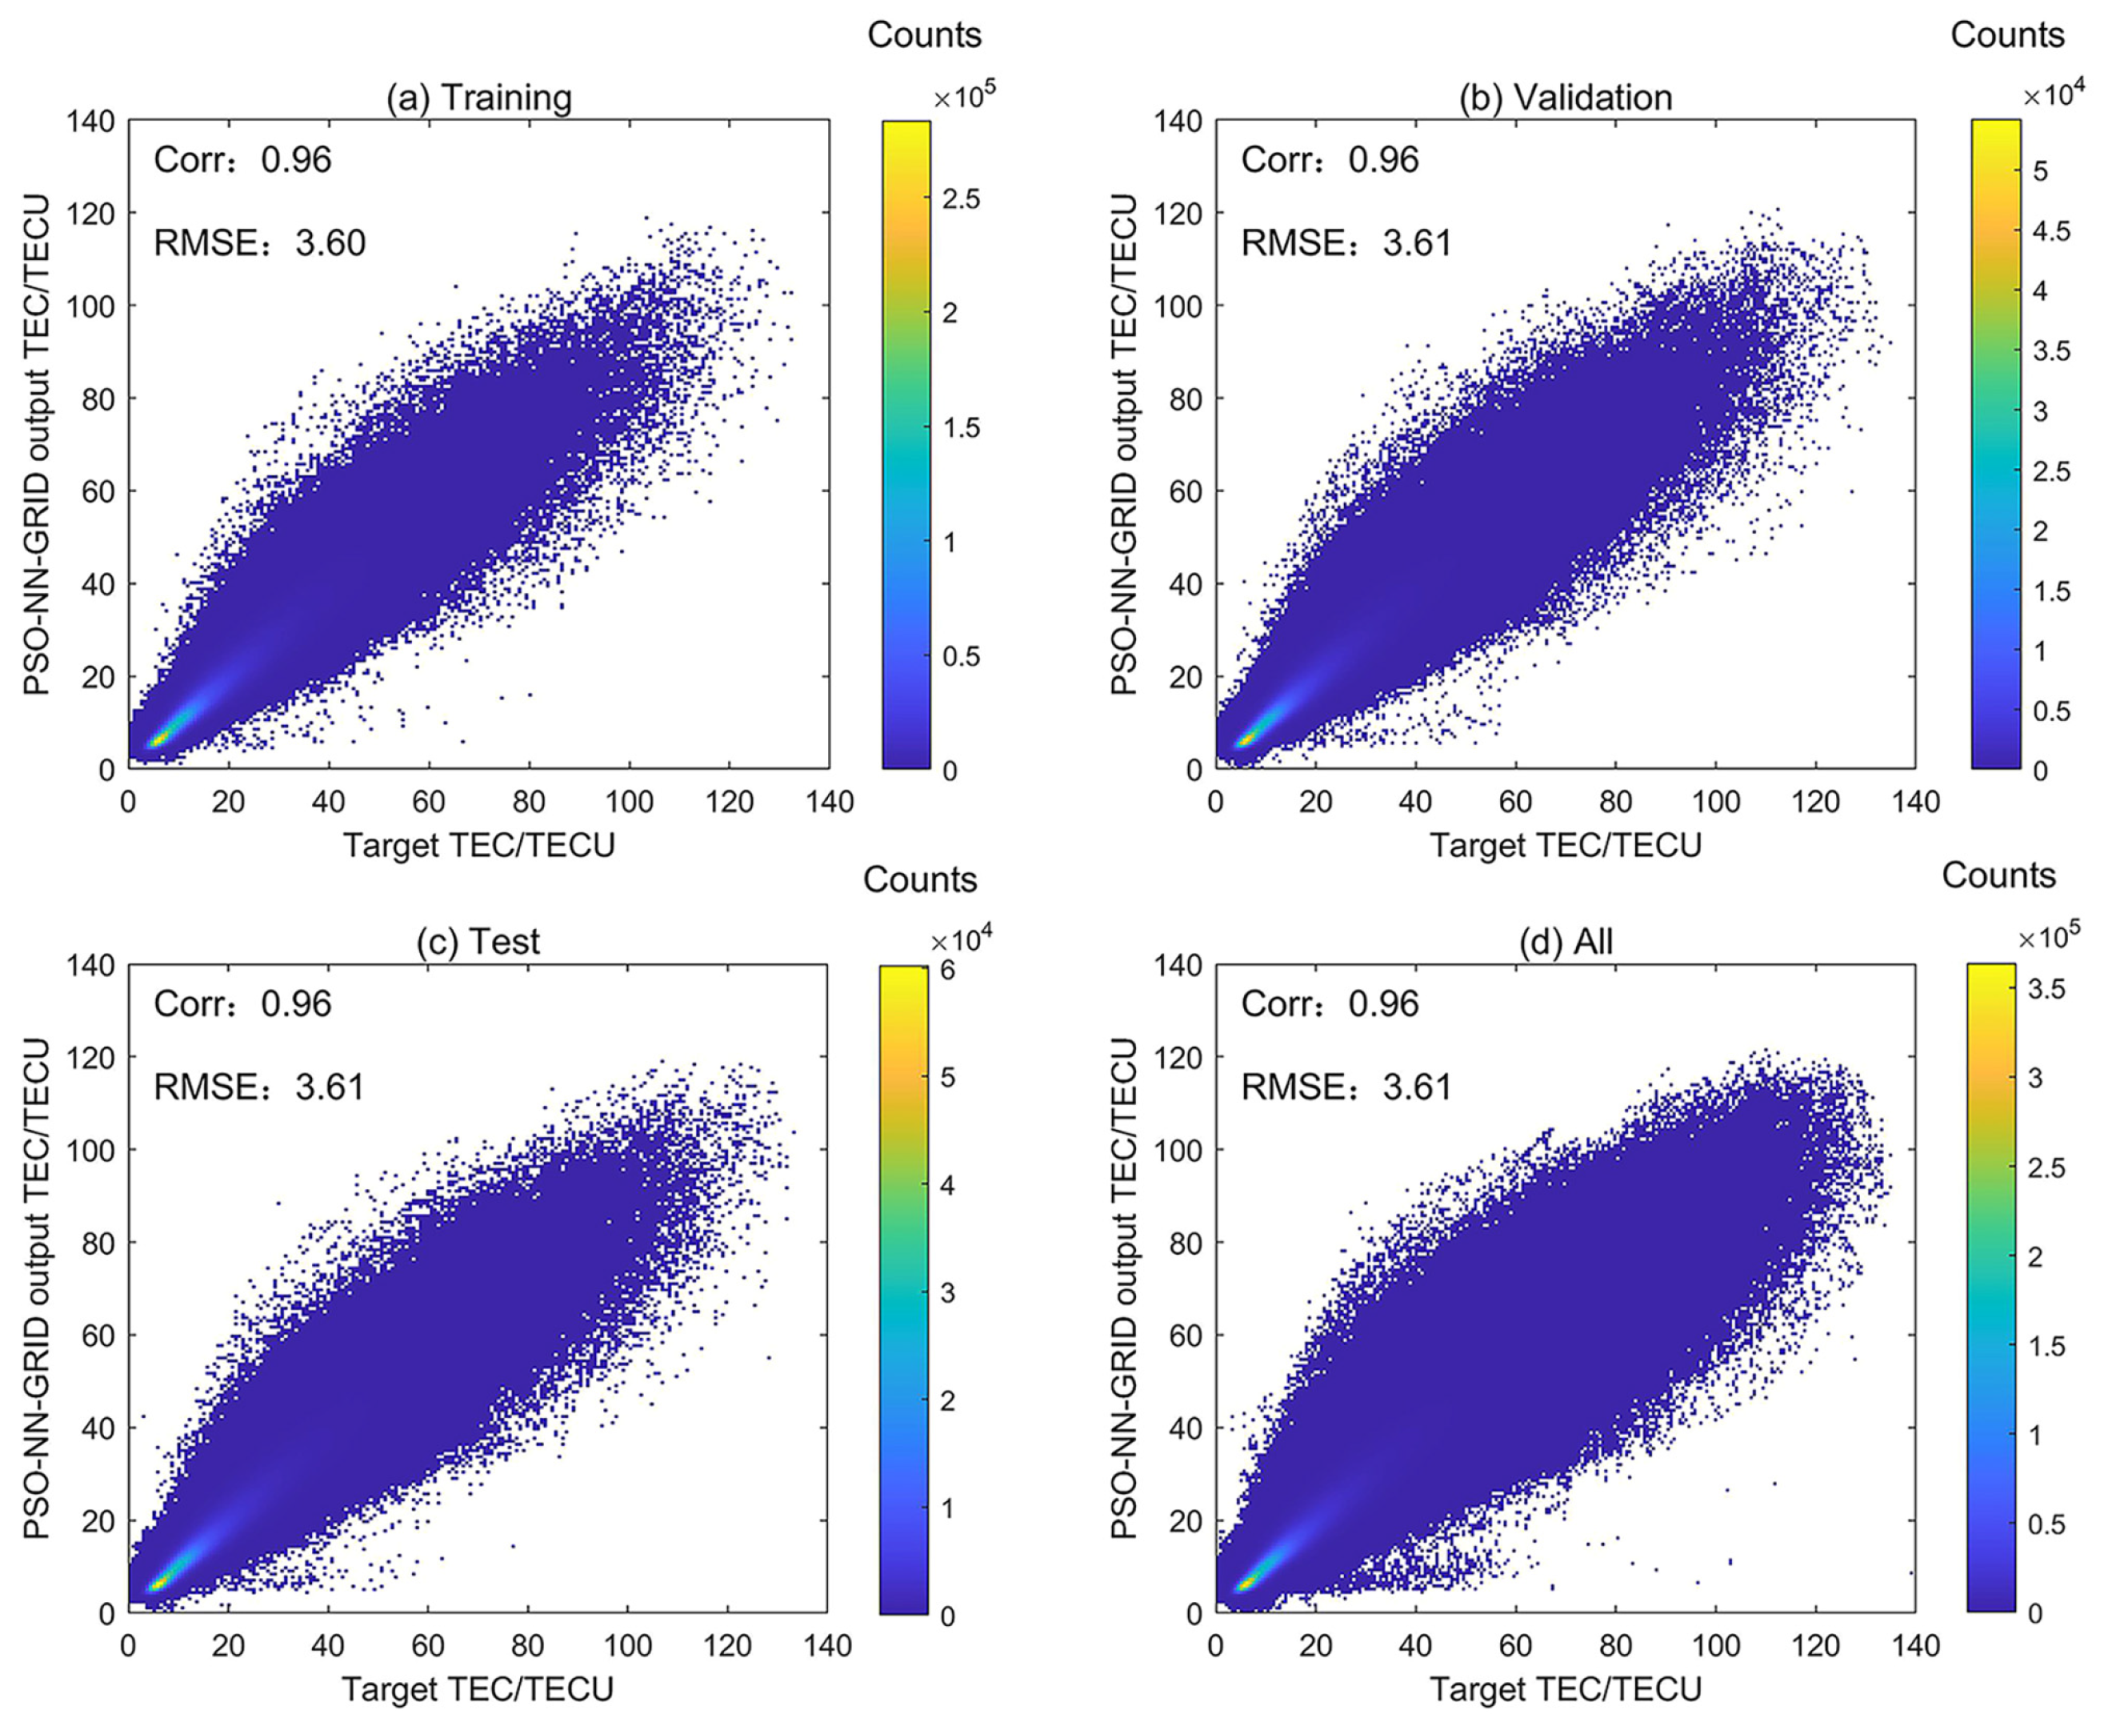
The performance of the PSO-NN-GRID model is evaluated under geomagnetic quiet conditions on different sample data sets, and the results are presented in Figure 4. In Figure 4, the color scale represents the bin counts; the horizontal and vertical axes indicate the measured and forecasted TEC values, respectively. It can be seen from Figure 4 that the correlation coefficients for the PSO-NN-GRID model on the training, validation, test, and all data sets are all 0.96, and the corresponding RMSEs for the PSO-NN-GRID model are 3.60, 3.61, 3.61, and 3.61, respectively. These results indicate that the PSO-NN-GRID model demonstrates promising performance and robustness in ionospheric TEC prediction. The results of Shi et al. [31] indicate that the correlation coefficients of the PSO-NN-GRID model on the four sets are 0.9537, 0.9539, 0.9538, and 0.9538, respectively, and the corresponding RMSEs are 3.91, 3.92, 3.91, and 3.91 TECU, respectively. Notably, the PSO-NN-GRID model outperforms the PSO-NN model, exhibiting higher correlation coefficients and lower RMSE values across these four data sets.

3.2. Analysis at Different Hours

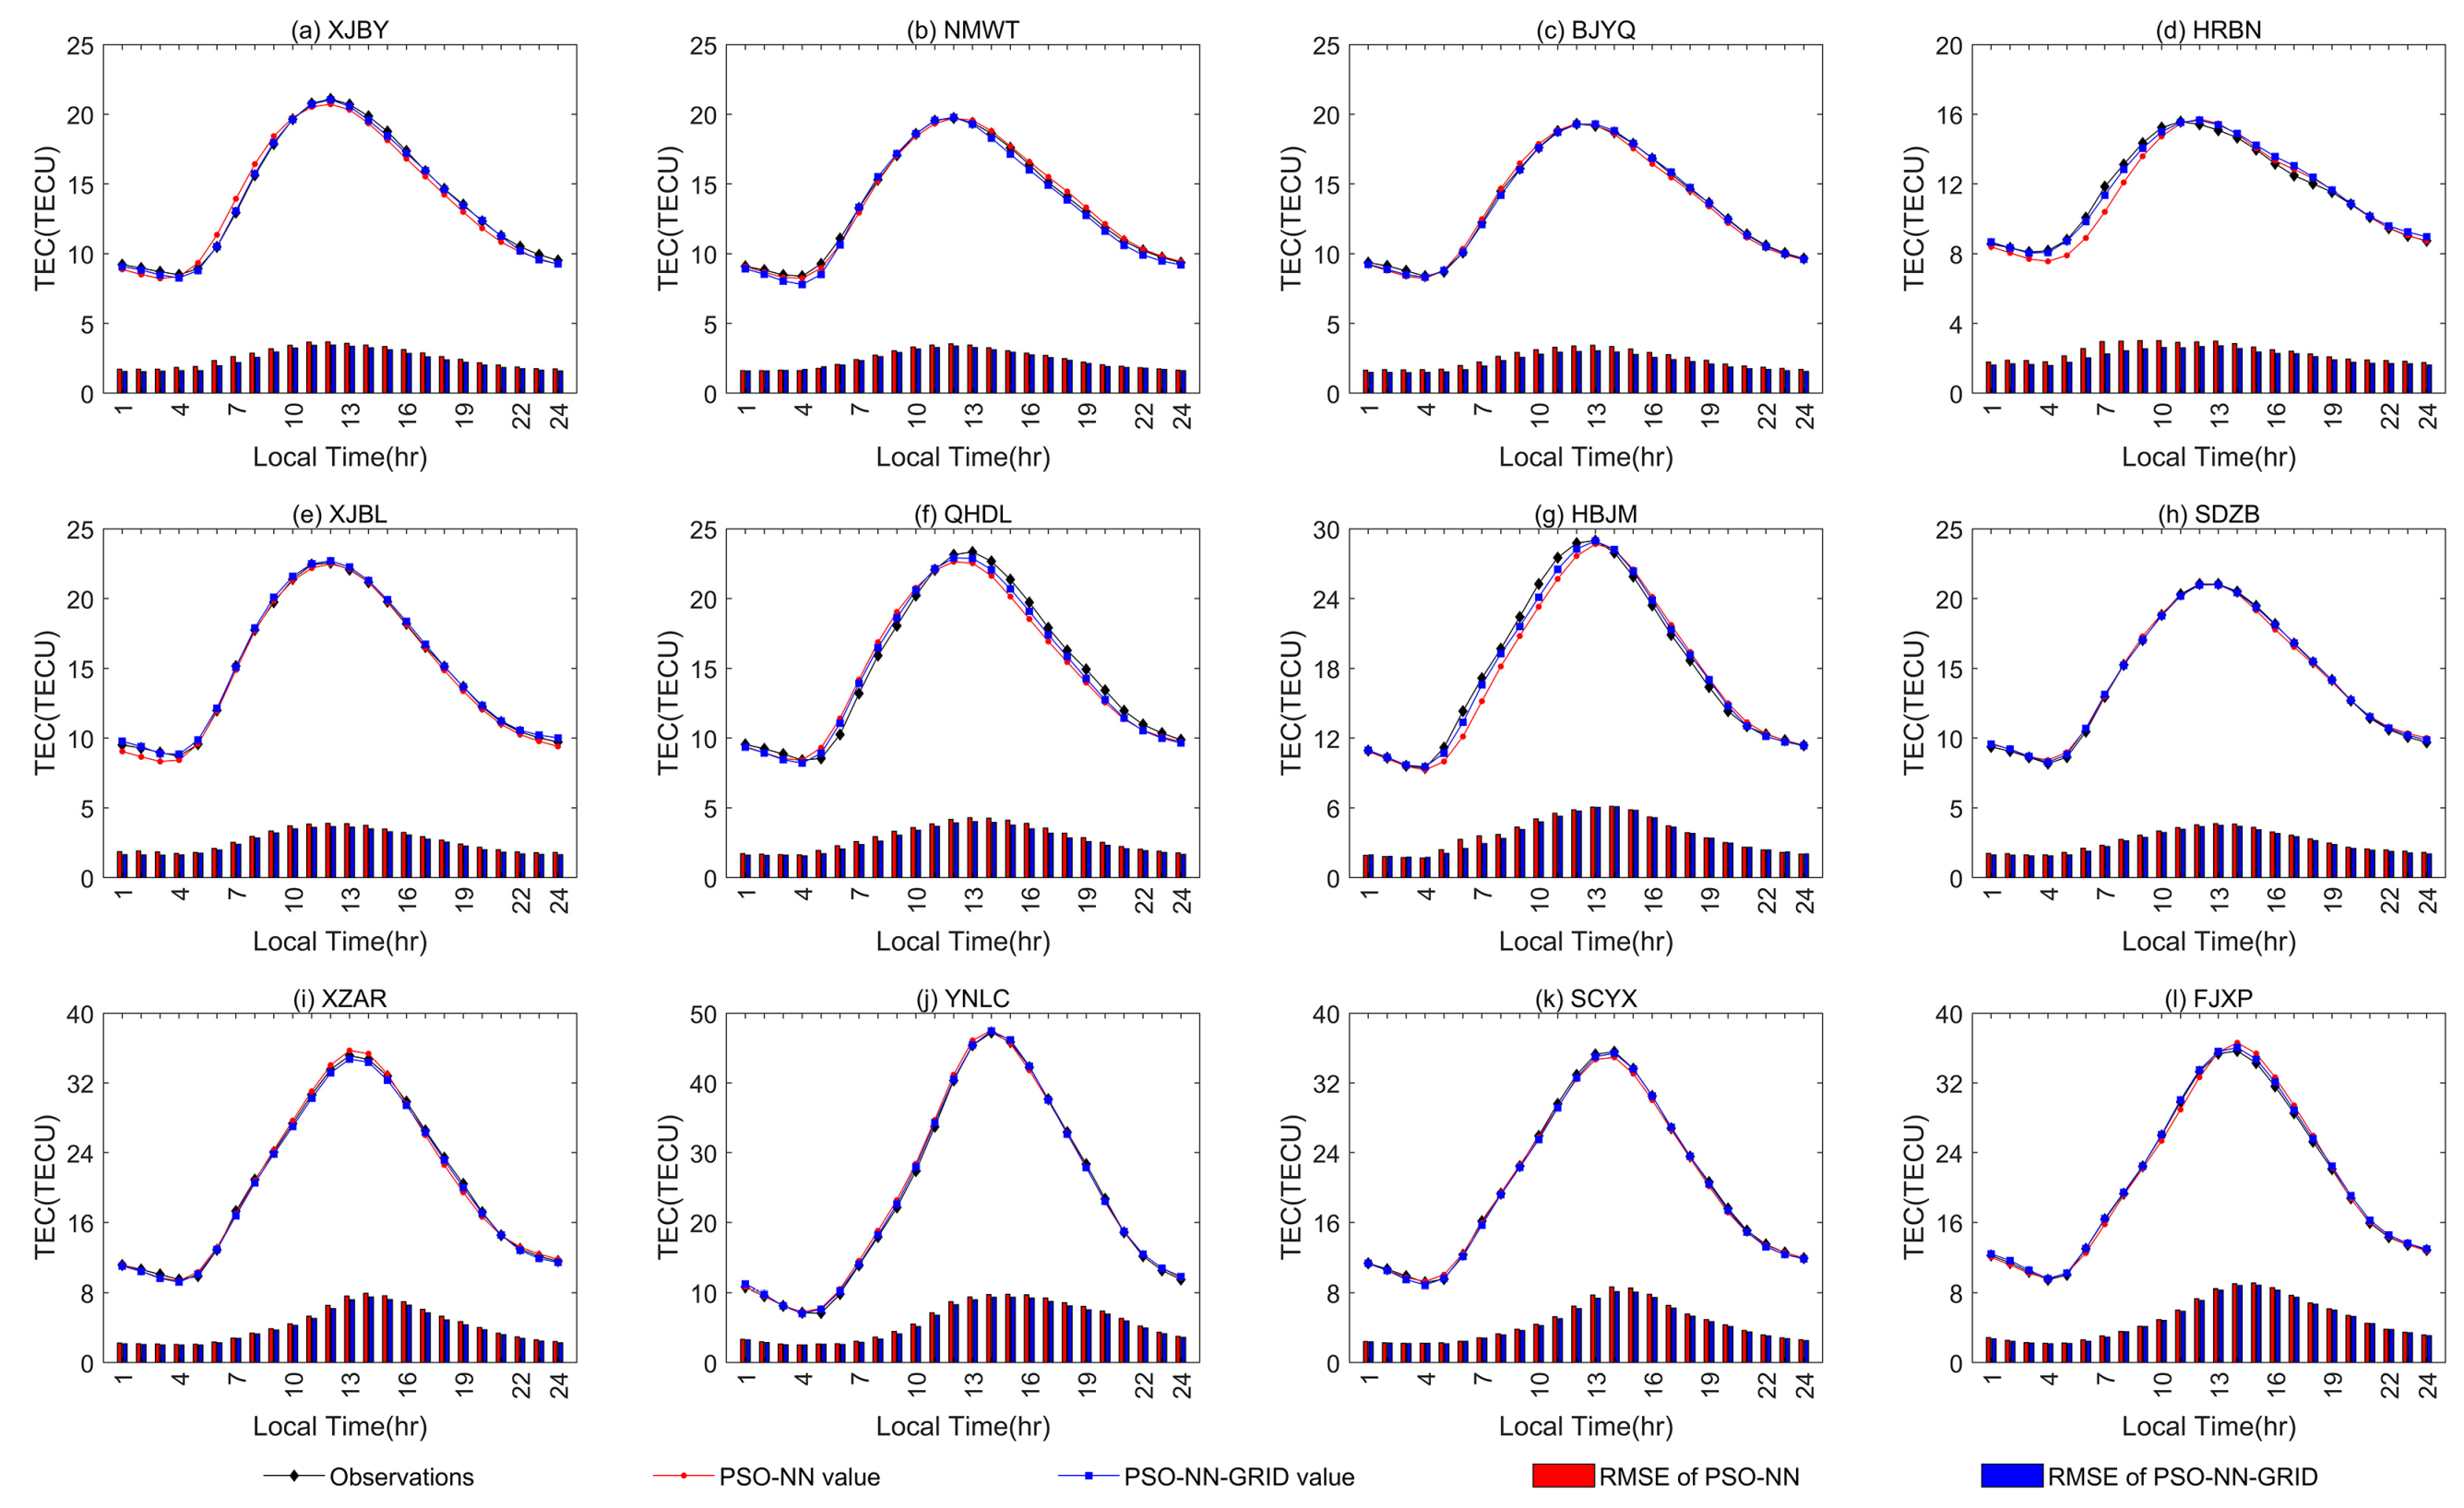
To investigate the variation in the prediction accuracy for the PSO-NN-GRID model with local time, Figure 5 illustrates the average diurnal variation in the VTECs estimated from the PSO-NN and PSO-NN-GRID models at the 12 test stations, along with the corresponding hourly RMSE values. In Figure 5, the average daily values of TEC observations, the TECs predicted by the PSO-NN model, and the TECs predicted by the PSO-NN-GRID model are represented by the black, red, and blue lines, respectively. Additionally, the red and blue columns display the hourly RMSE values for the PSO-NN and PSO-NN-GRID models, respectively.
Figure 5 reveals a temporal variation in the VTECs estimated from the PSO-NN and PSO-NN-GRID models, resulting from varying intensities of solar radiation throughout the day and night. The ionization takes place under the action of solar radiation and the hourly average TEC value reaches its peak at about 14:00 h local time. As the sunlight radiation decreases, the recombination of electrons and ions prevail, causing a decrease in the hourly average TEC value. The hourly average TEC value reaches its minimum at about 04:00 h local time. Importantly, the variation in the hourly average TEC estimated from the PSO-NN and PSO-NN-GRID models agrees well with that of the observed value. The PSO-NN-GRID model outperforms the PSO-NN model, which is evident from the fact that the values estimated from the PSO-NN-GRID model are closer to the observed ones. In addition, the smaller RMSE value of the PSO-NN-GRID model shown in Figure 5 also proves that the performance of the PSO-NN-GRID model is better than the PSO-NN model.
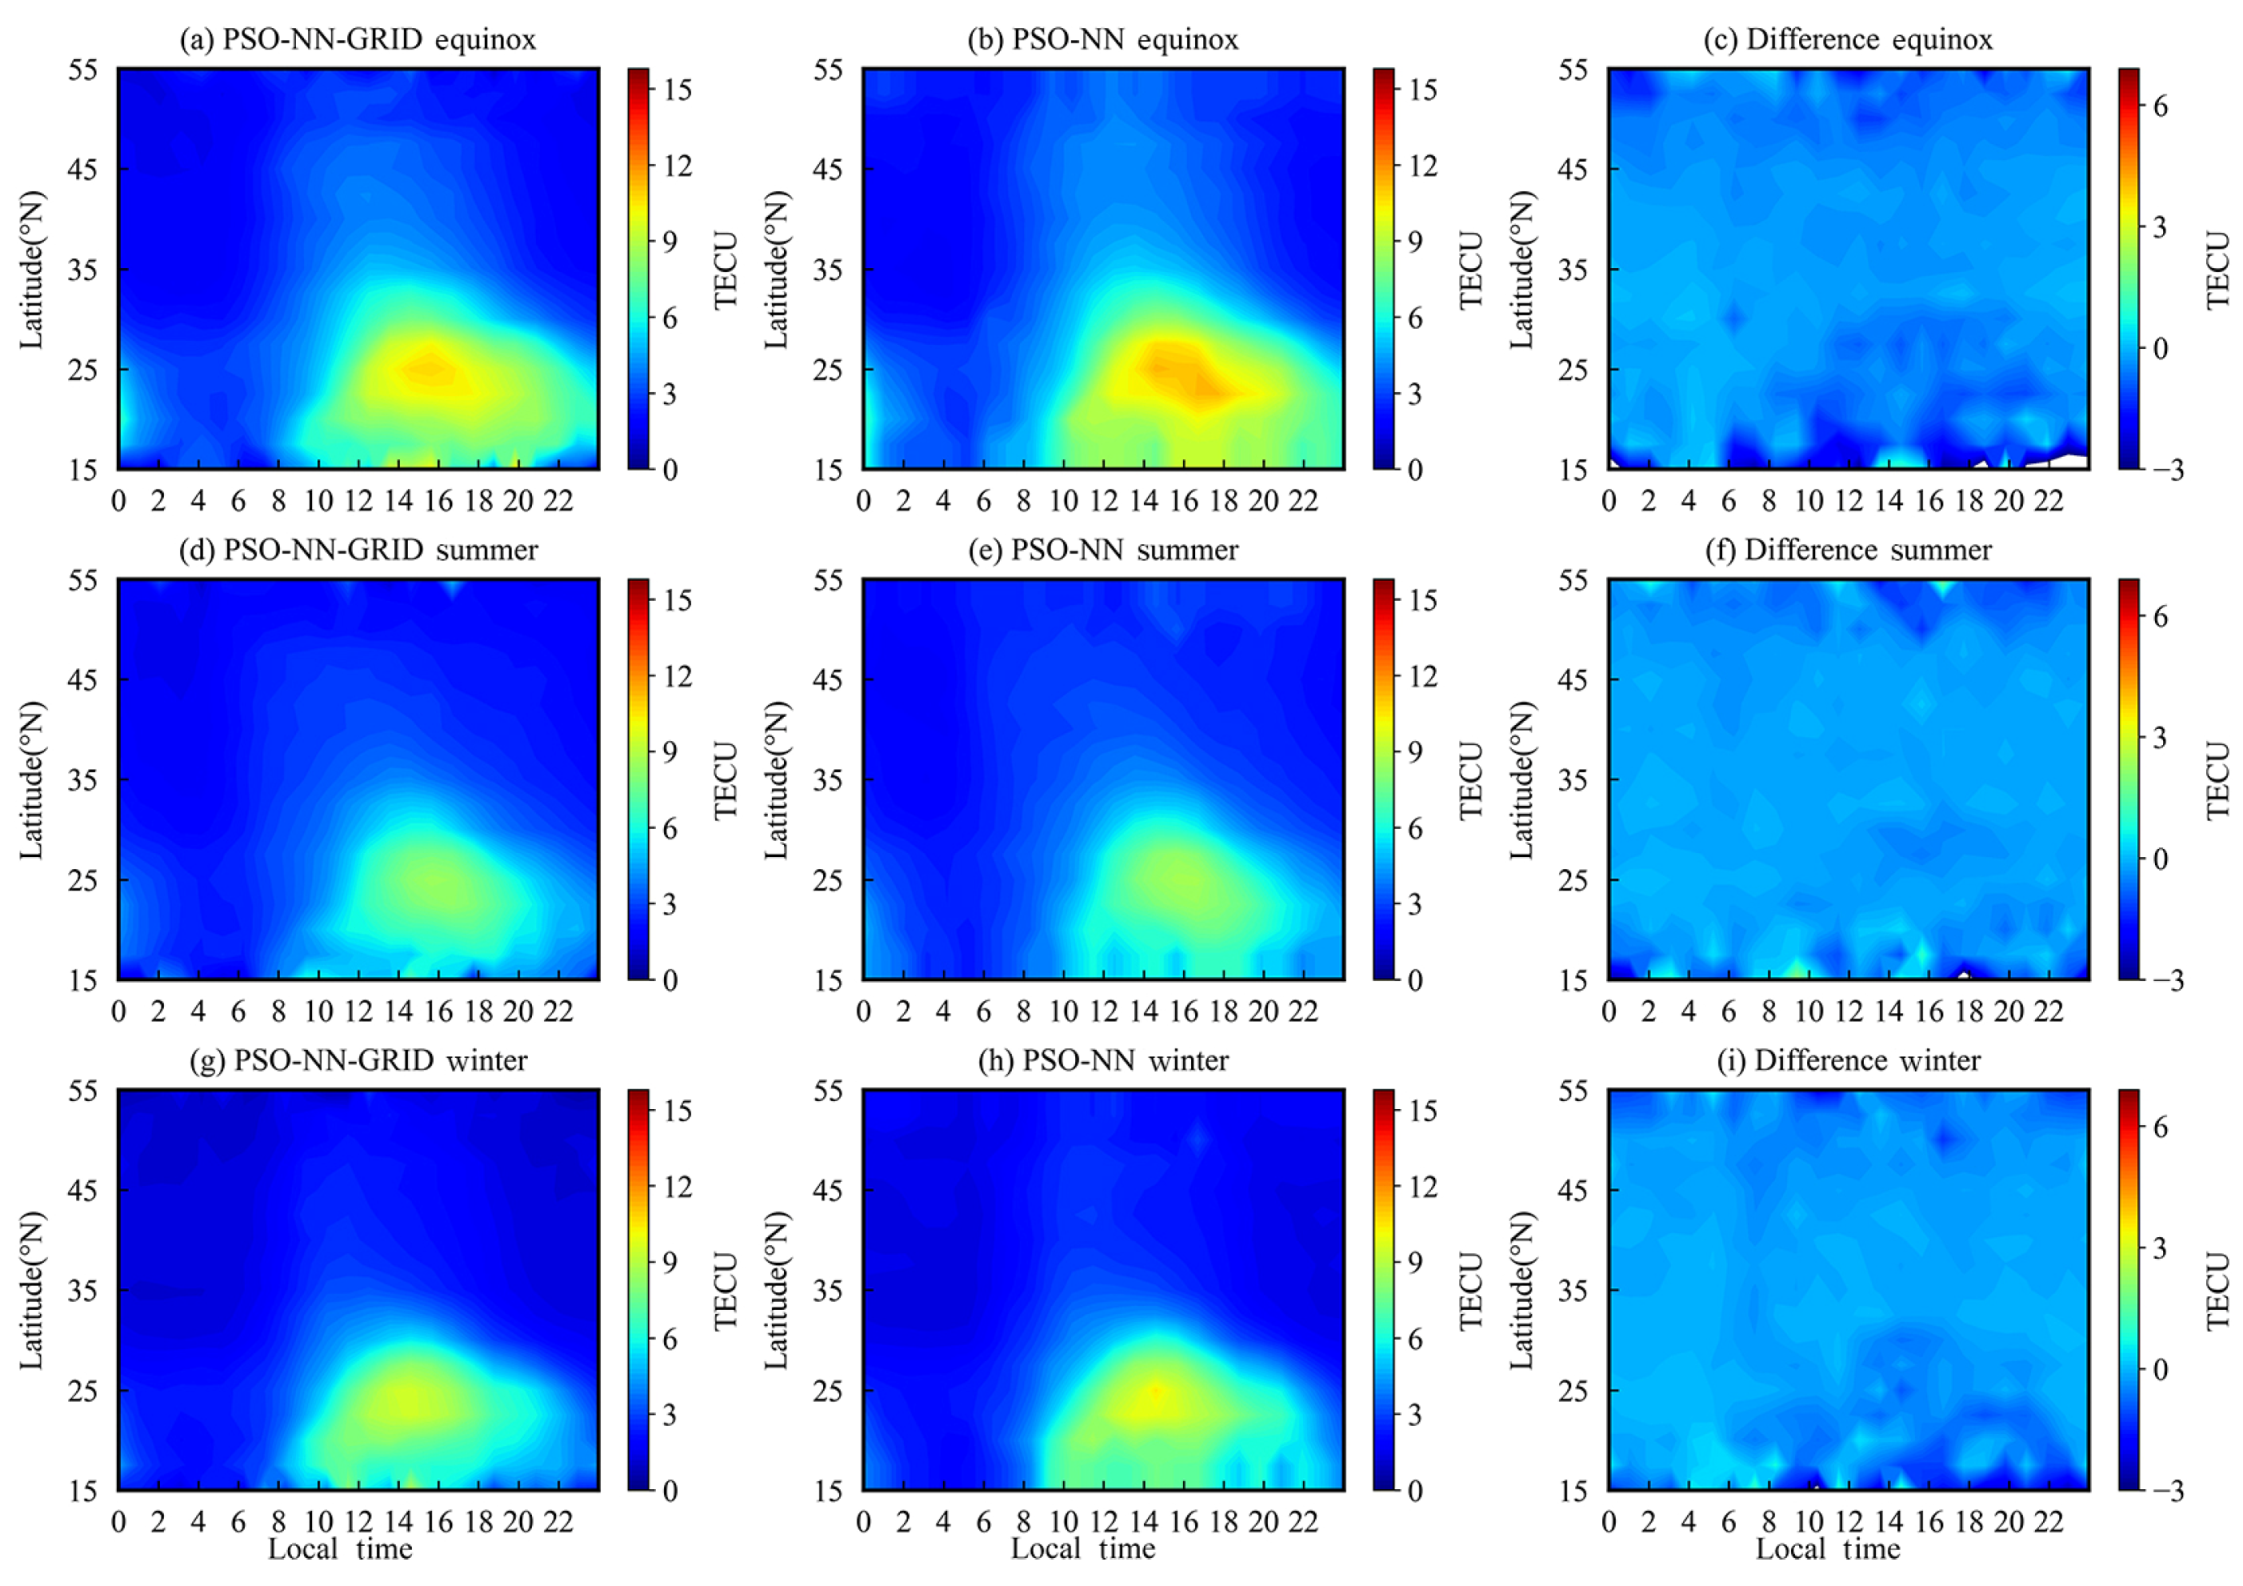
On the test data set, the ground-based GPS and space-borne RO observations are divided according to the latitude intervals of 2.5°, and the RMSE values of hourly observations within each latitude band are calculated. Figure 6 shows the hourly variation in the RMSE for the TECs estimated from the PSO-NN and PSO-NN-GRID models over different geographic latitude during the equinox (March, April, September, and October), summer (May, June, July, and August), and winter (January, February, November, and December) seasons. The first, second, and third columns are the results of the PSO-NN-GRID model, the PSO-NN model, and the difference between them (RMSE(PSO-NN-GRID)—RMSE(PSO-NN)), respectively. As can be seen from the first and second columns of Figure 6, there is an obvious hourly variation in the RMSE values of the TECs estimated from the PSO-NN-GRID and PSO-NN models for areas below latitude 35°. The RMSE values during 14:00–16:00 h local time are higher than those in the morning and evening. The RMSE values during the equinox season are larger than those during the solstice seasons. In Figure 6a, the RMSE value of the PSO-NN-GRID model remains at a low level (<4.5 TECU) before 08:00 h local time during the equinox season; after 08:00 h local time, the RMSE value gradually increases and reaches its maximum value at 15:00 h local time; after that, the RMSE value decreases. Figure 6b depicts that the RMSE value of the PSO-NN model during the equinox season follows a similar variation trend to that of the PSO-NN-GRID model, but with larger values. Figure 6c shows that most of the differences in RMSE are within the range of −1 to 0 TECU, with regions at low latitudes reaching −3 TECU. Modeling TEC over low latitudes is challenging due to the presence of significant TEC gradients and unique phenomena such as the equatorial ionization anomaly [30].
As can be seen from the second and third rows of Figure 6, the hourly variations of the RMSE during the solstice seasons follow a similar pattern to that of the equinox season, but the period of high RMSE is slightly shorter; the duration of high RMSE in the winter season is longer compared to the summer season; and in the solstice seasons, the latitude range with high RMSE values decreases from 35° to 30° in comparison to the equinox season. As can be seen from Figure 6f,i, during the summer and winter solstices, the differences in RMSE for TEC estimated from the PSO-NN-GRID and PSO-NN models are mostly negative, and the majority of these differences lie within the range of −0.5 to 0 TECU.

3.3. Analysis in Different Seasons

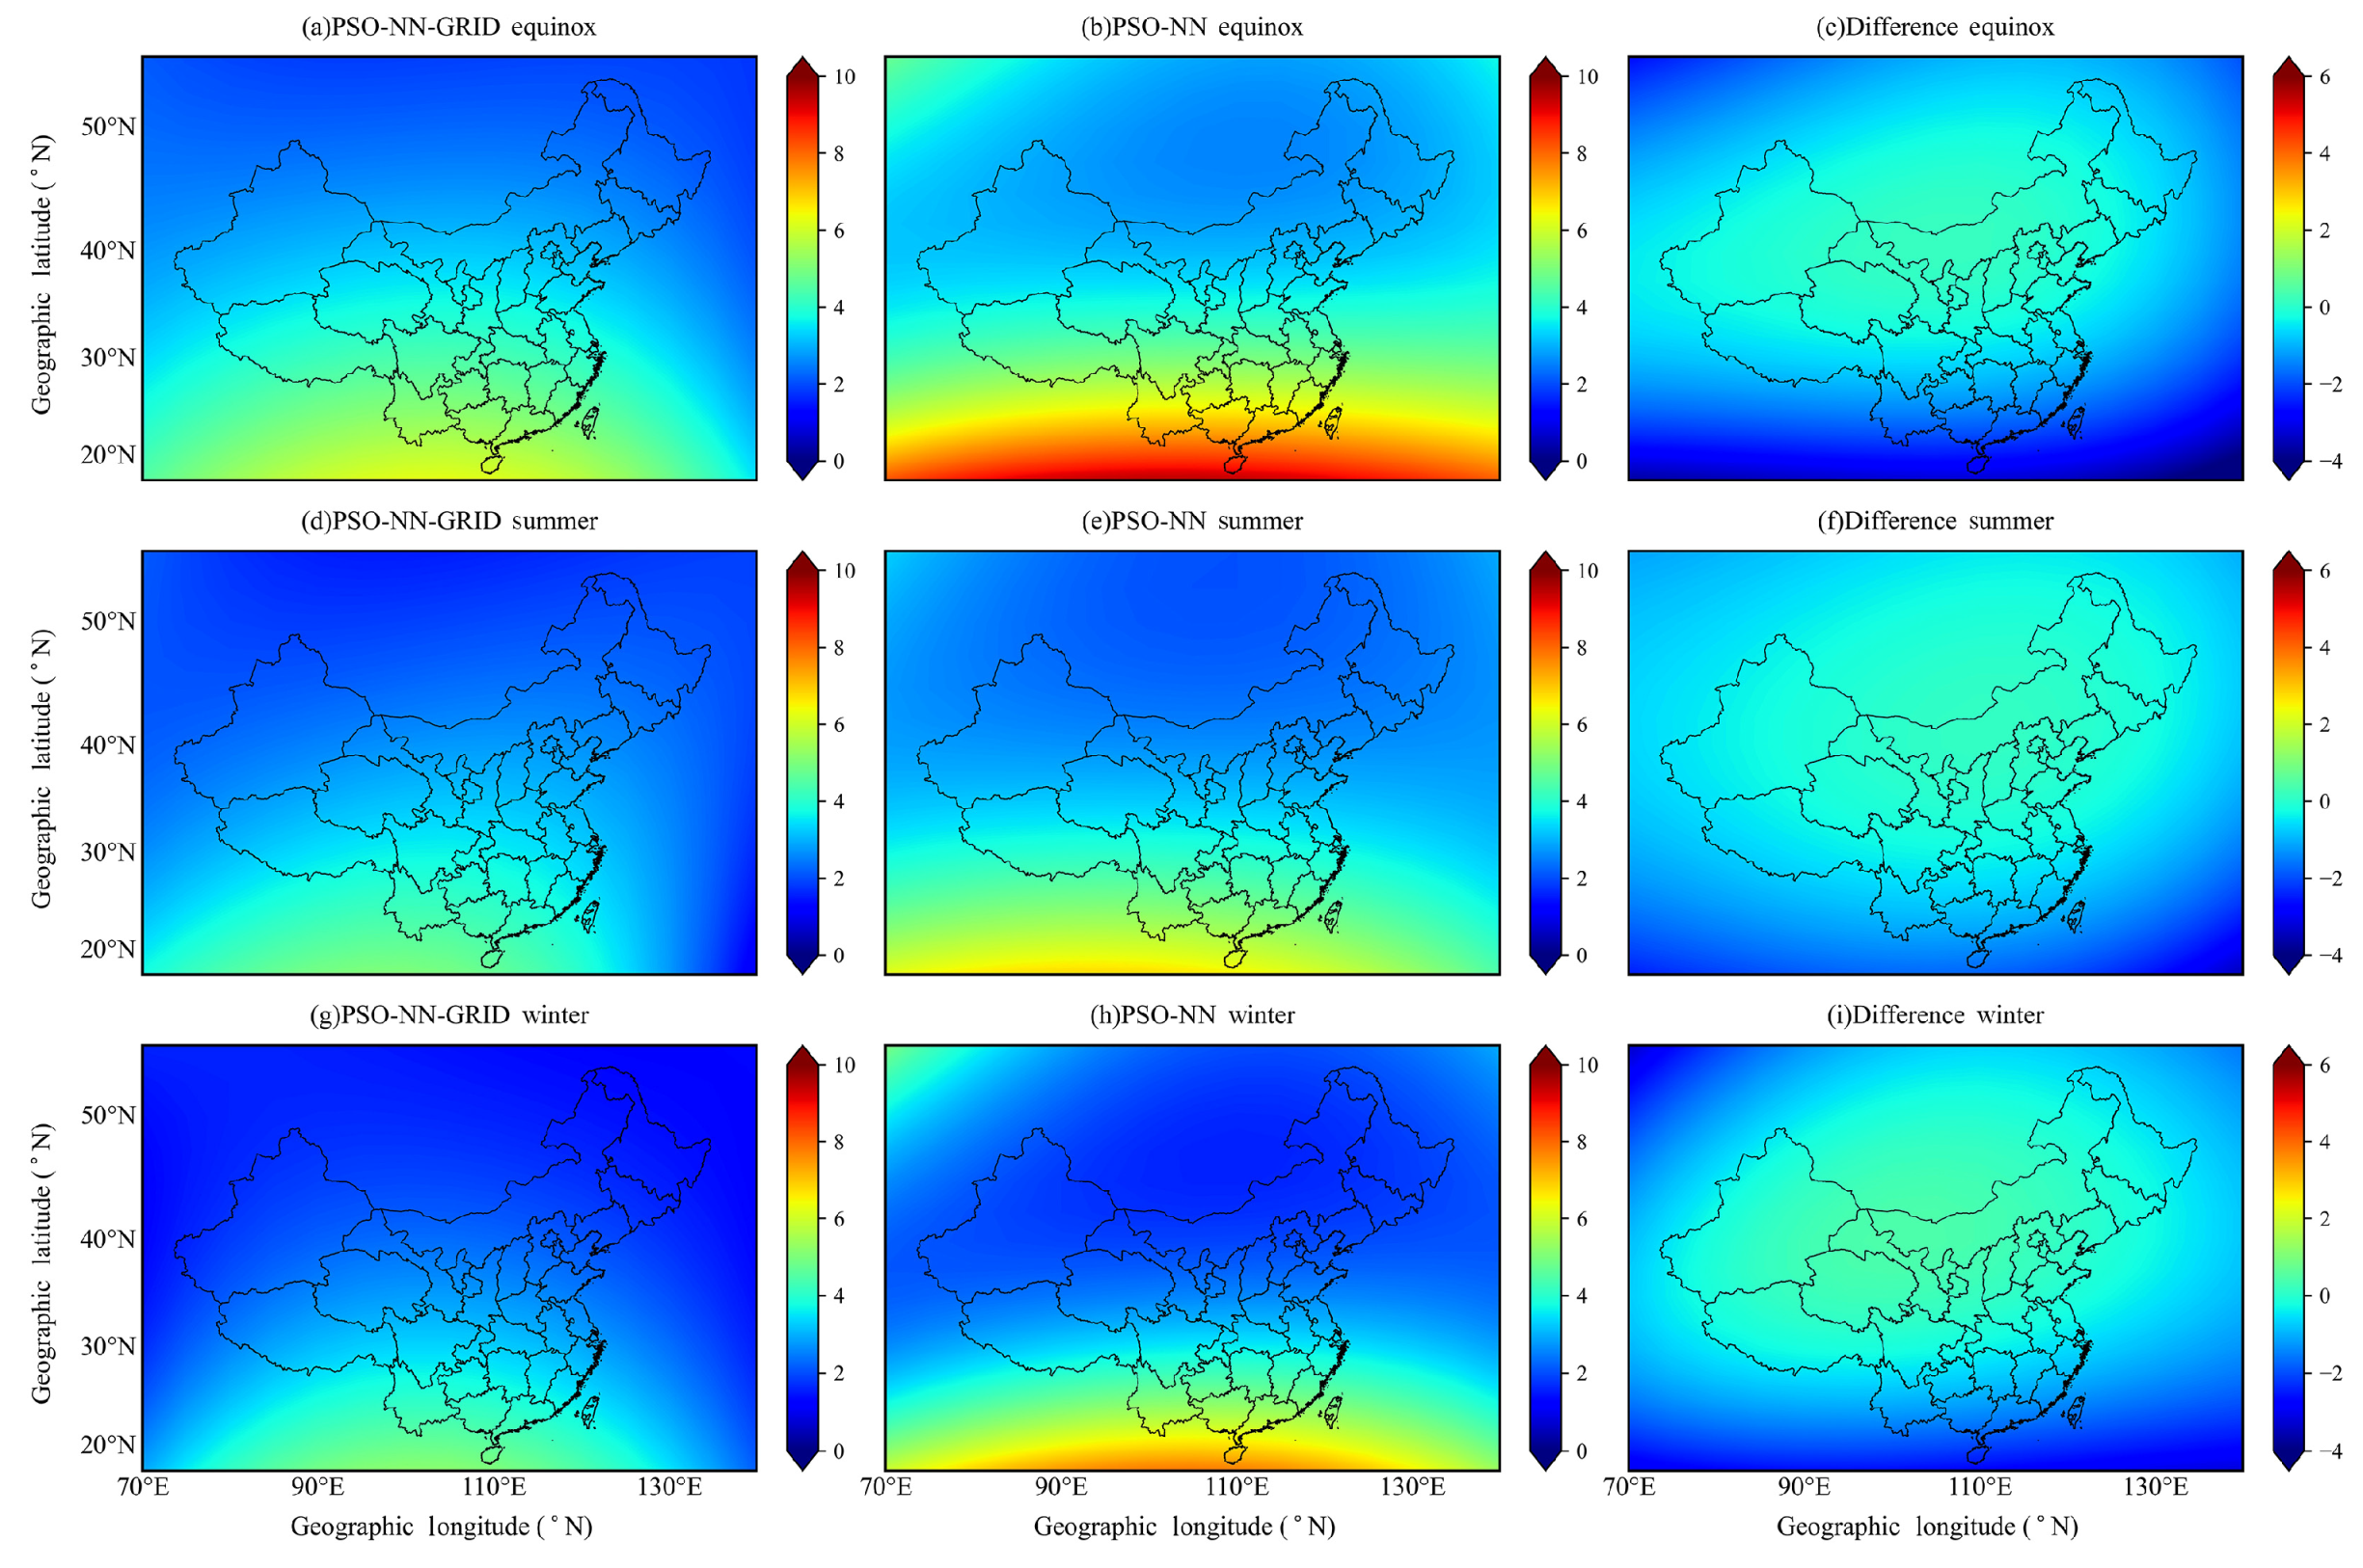
To evaluate the performance of the PSO-NN-GRID model in different seasons, RMSE maps are generated for TEC estimated from the PSO-NN and PSO-NN-GRID models over China during the equinox, summer, and winter seasons as illustrated in Figure 7. As can be seen from the first and second columns of Figure 7, it is evident that the RMSE maps of TEC estimated from the PSO-NN-GRID model agree well with those of the PSO-NN model in terms of latitude trends; RMSEs of TEC estimated from the PSO-NN and PSO-NN-GRID models exhibit smaller RMSE values over higher latitudes, with an increase as the latitude decreases; during the equinox, summer, and winter seasons, the RMSE value of the PSO-NN model is greater than that of the PSO-NN-GRID model, especially in low latitude areas. The third column of Figure 7 reveals that within the latitude range of 30° N to 45° N, the differences in RMSE values between the PSO-NN and PSO-NN-GRID models are relatively small, ranging between −0.5 and 0 TECU; however, over the low-latitude and high-latitude edge areas, a relatively larger negative difference is observed, with the difference values ranging between −3.5 and −1 TECU. It can be seen from the first to third rows that the RMSE values of the TEC estimated from the PSO-NN and PSO-NN-GRID models are greater in the equinox season compared to the values during the summer and winter seasons; the difference values during the equinox, summer, and winter seasons range from −4.6 to 0, −3.5 to 0, and −4.1 to 0 TECU, respectively.
Table 1 presents the RMSE values of the TECs estimated from the PSO-NN and PSO-NN-GRID models for the 12 test stations during the equinox, summer, and winter seasons of 2015 and 2019. The stations in Table 1 are listed in descending order based on latitude. As can be seen in Table 1, the PSO-NN-GRID model outperforms the PSO-NN model in all the seasons for 2015 and 2019; the performance of the PSO-NN-GRID model in 2019 is much better than that in 2015. At the low-latitude stations FJXP and YNLC, the PSO-NN-GRID and PSO-NN models perform better in the summer than in winter, and the worst in the equinox of 2015; at other stations except for FJXP and YNLC, the PSO-NN-GRID and PSO-NN models perform best in the winter and worst in the equinox. In the equinox, summer, and winter of 2015, the improvements of the PSO-NN-GRID model over the PSO-NN model are 0.4–22.1%, 0.1–12.8%, and 0.2–26.2%, respectively. In 2019, the corresponding improvements are 0.5–13.6%, 0–10.1%, and 0–16.1%, respectively.

3.4. Analysis at Different Geographical Locations

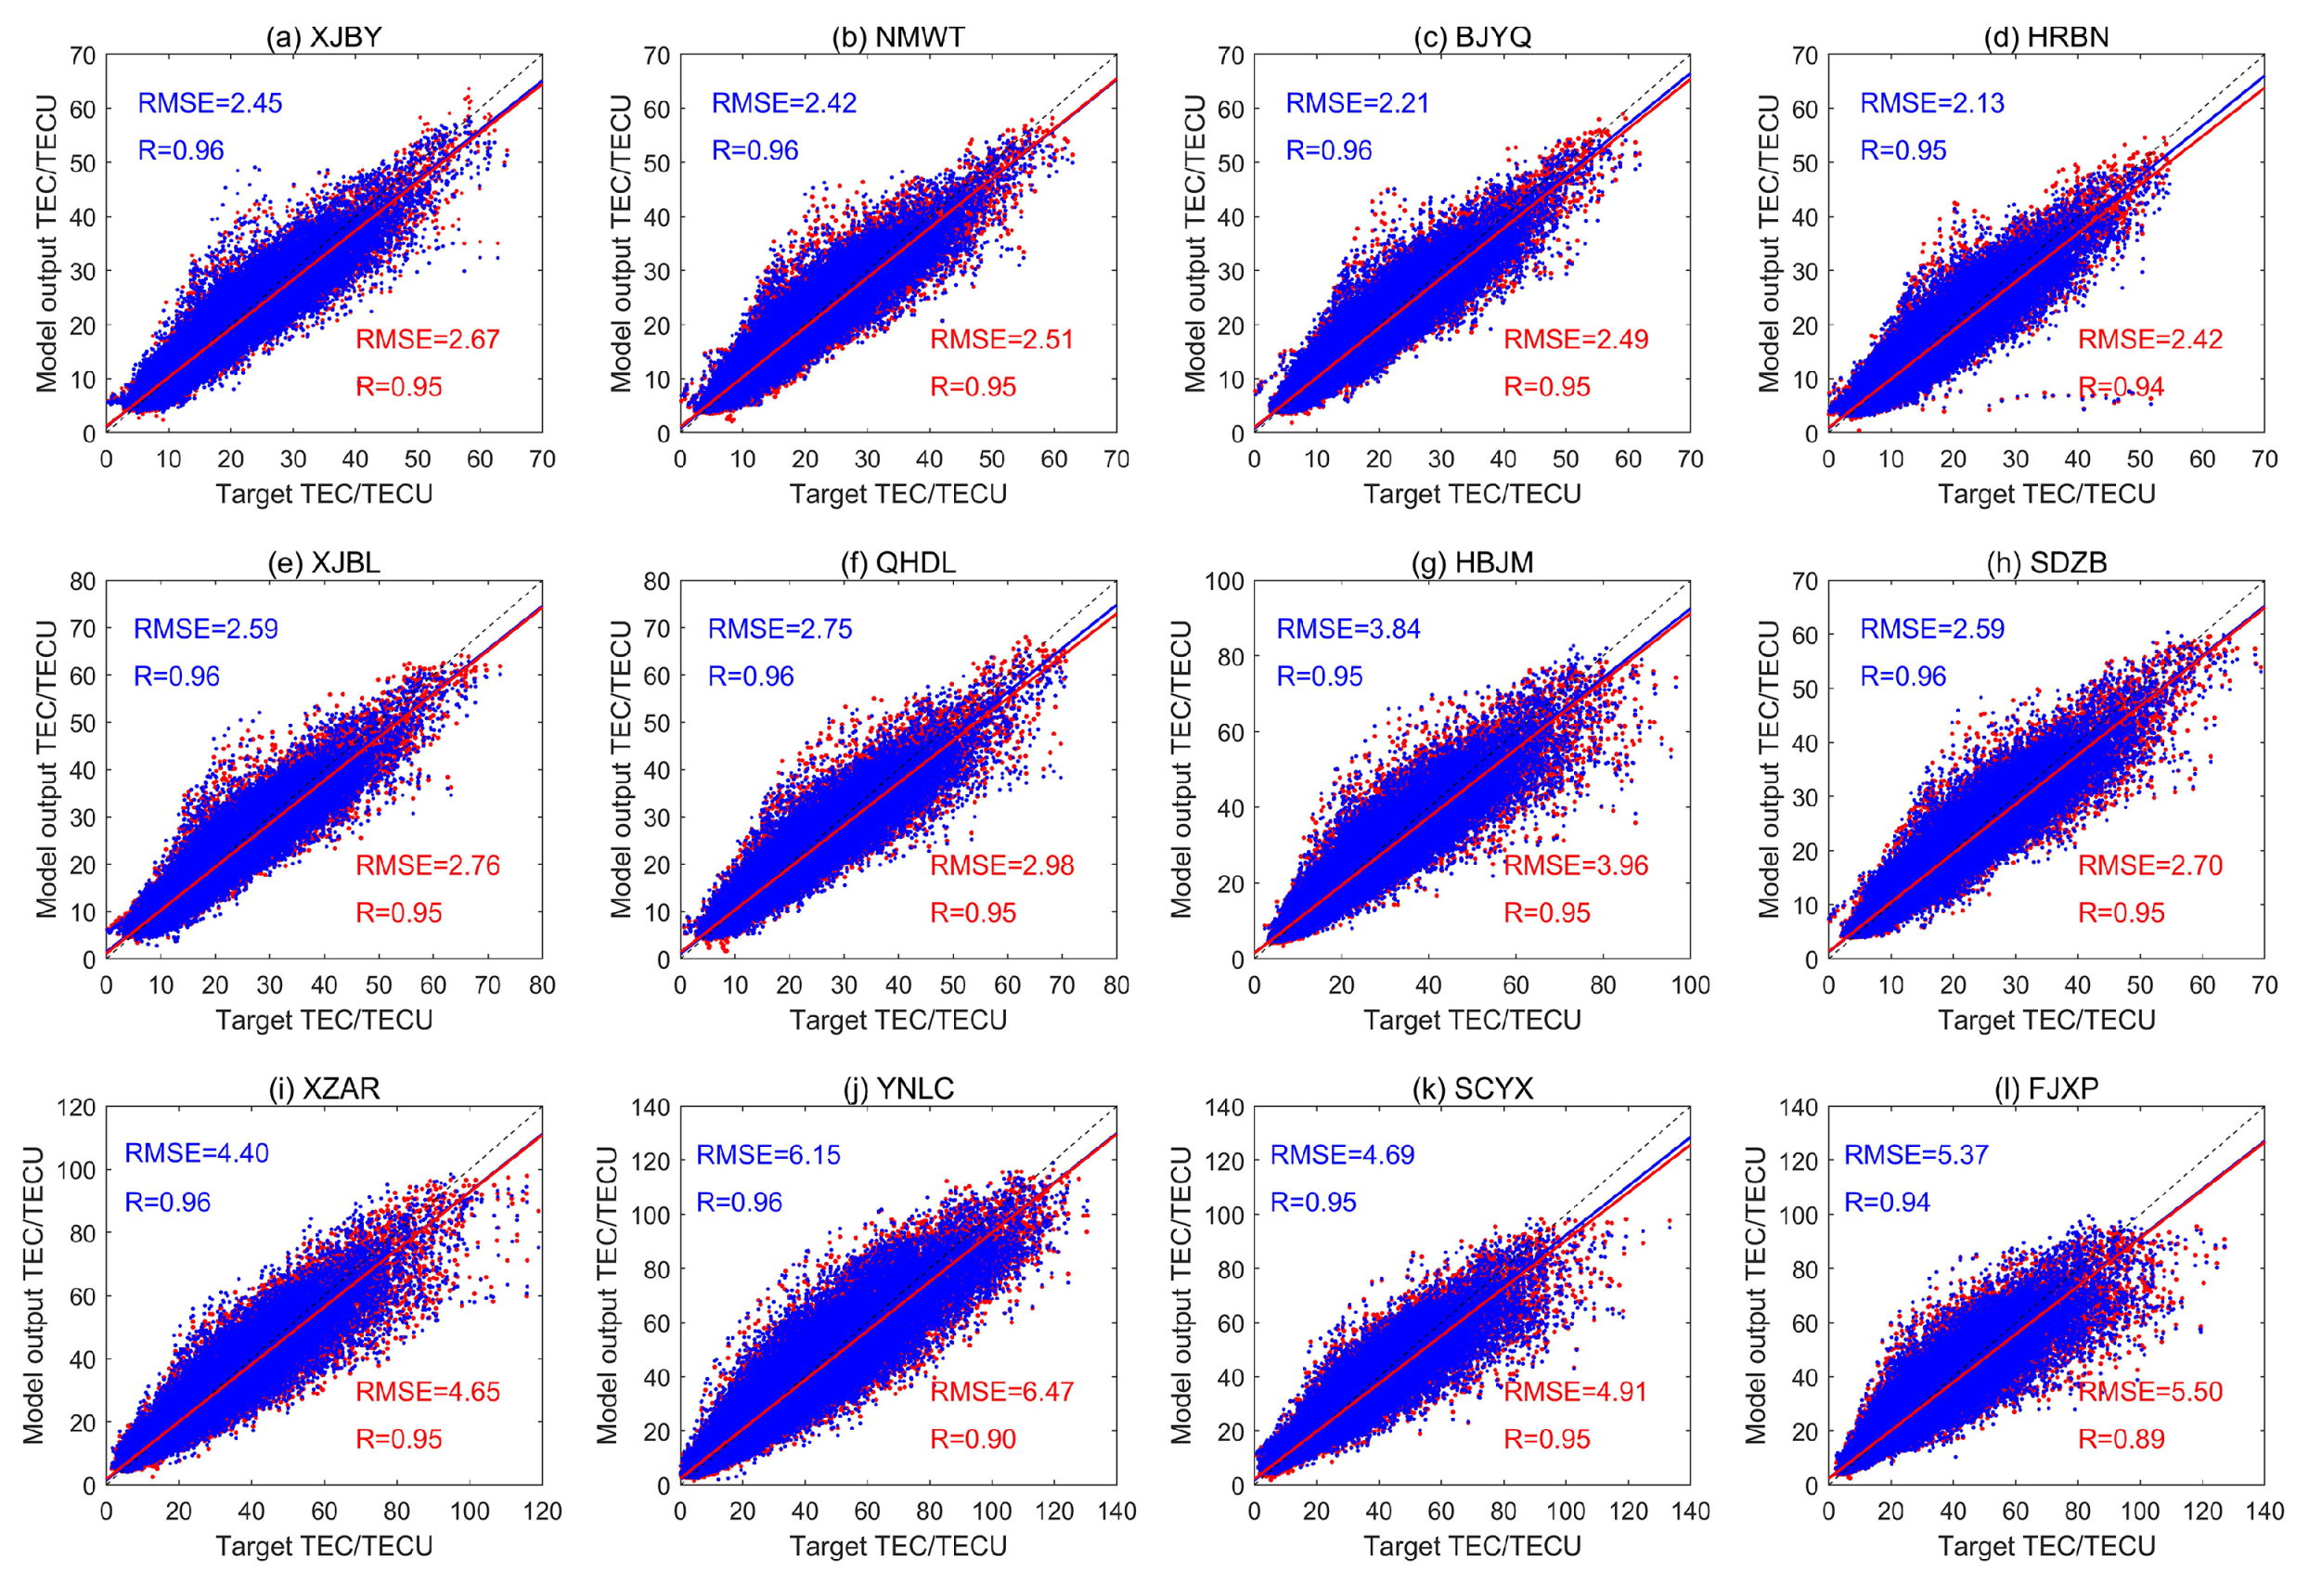
The accuracy and reliability of the PSO-NN-GRID model at various geographical locations are analyzed by comparing the VTECs estimated from the PSO-NN (red dots) and PSO-NN-GRID (blue dots) models with the observed values at the 12 test stations, as shown in Figure 8. The test stations in Figure 8 are divided into three rows based on their latitude bands: 40–50° N (the first row), 30–40° N (the second row), and 20–30° N (the third row). The RMSEs and correlation coefficients of the TECs estimated from the PSO-NN and PSO-NN-GRID models are indicated in Figure 8, represented by red and blue fonts, respectively. In each subfigure, the red and blue solid lines represent the fitting lines for the red and blue scatter points, respectively, while the black dashed line represents that the TEC estimated from the PSO-NN/PSO-NN-GRID model is equal to the observed value. It can be seen from Figure 8 that compared to the blue points, the distribution of the red points is relatively scattered; for all test stations, the RMSE of the TECs estimated from the PSO-NN-GRID model is smaller than that of the PSO-NN model, and the correlation coefficient of the PSO-NN-GRID model is higher. The RMSE values for the TECs estimated from the PSO-NN-GRID model for stations within the 40–50° N geographic latitude are smaller than those for stations within the 30–40° N geographic latitude, with the largest values observed within the 20–30° N geographic latitude. For the four stations within the 40–50° N geographic latitude, the RMSE values for the TECs estimated from the PSO-NN-GRID model are 2.45, 2.42, 2.21, and 2.13 TECU, respectively, which shows a respective improvement of 8.2%, 3.6%, 11.2%, and 12.0% compared to the values obtained from the PSO-NN model; for the four stations within the 30–40° N geographic latitude, the RMSE values for the TECs estimated from the PSO-NN-GRID model are 2.59, 2.75, 3.84, and 2.59 TECU, respectively, with the PSO-NN-GRID model showing improvements of 6.2%, 7.7%, 3.0%, and 4.1%, respectively; for the four stations located within the 20–30° N geographic latitude, the RMSE values are 4.40, 6.15, 4.69, and 5.37 TECU, respectively, with the PSO-NN-GRID model demonstrating improvements of 5.4%, 4.9%, 4.5%, and 2.4%, respectively.
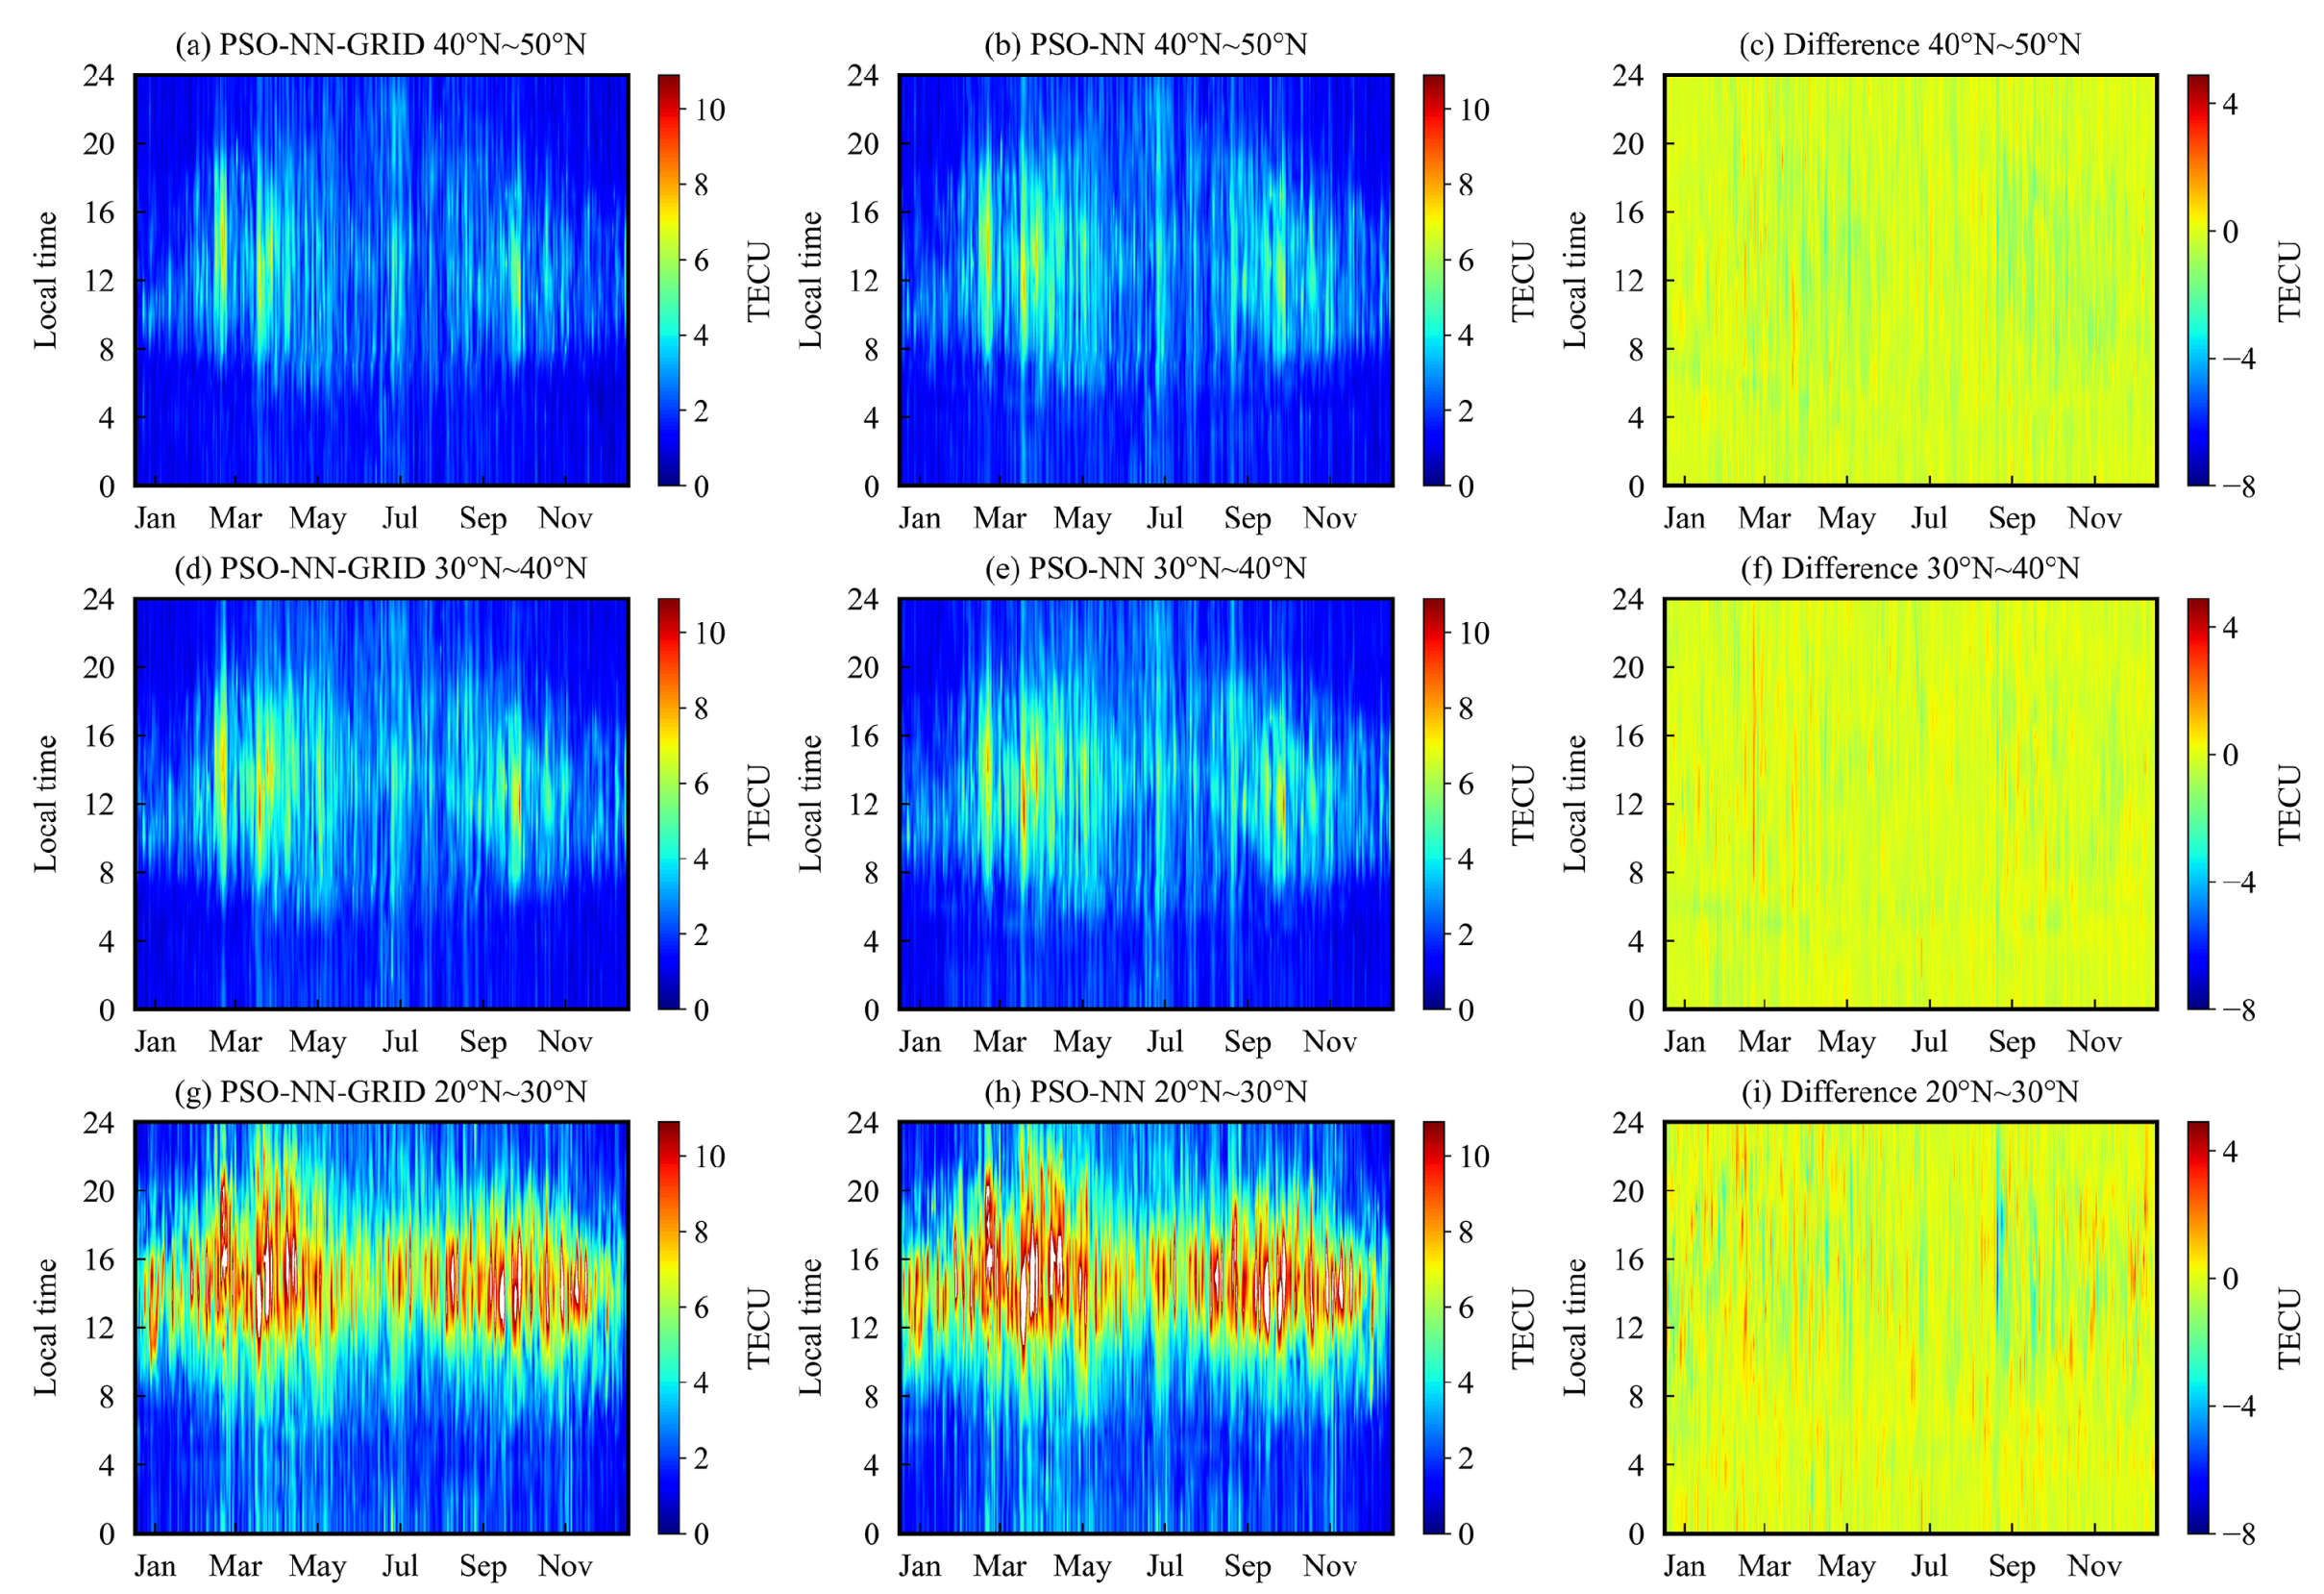
To further investigate the performance of the PSO-NN-GRID model at different geographical locations over an extended period, Figure 9 displays variations of the RMSE for the TECs estimated from the PSO-NN and PSO-NN-GRID models during one year. The first column is the results of the PSO-NN-GRID model, the second column is the results of the PSO-NN model, and the third column represents the differences between the two; the first, second, and third rows are the results within geographic latitudes of 40°–50° N, 30°–40° N, and 20°–30° N, respectively. As can be seen from Figure 9a,b, within the 40°–50° N geographic latitude range, the RMSE of the TECs estimated from both the PSO-NN and PSO-NN-GRID models is higher during the equinox seasons compared to the summer and winter; the diurnal variation is more pronounced during the equinox season; in March and April, the maximum RMSE value is usually observed at 14:00 h local time, with daily maximum values ranging between 2.1–8.7 TECU and 1.8–7.9 TECU for the PSO-NN and PSO-NN-GRID models, respectively; and in the remaining months, the maximum value is usually obtained at 12:00 h local time, with daily maximum values ranging between 1.8–7.5 TECU and 1.7–6.8 TECU for the PSO-NN and PSO-NN-GRID models, respectively. Figure 9c demonstrates that the RMSE residuals do not exhibit a daily variation trend, with most residuals ranging from −3.5 to 0 TECU, except for a few positive residuals. Figure 9d–f show similar variation trends as the results within the 40°–50° N latitude range, but with comparatively higher values within the 30°–40° N latitude range; in March and April, the daily maximum RMSEs for the PSO-NN and PSO-NN-GRID models range between 3.1–9.5 TECU and 2.5–9.2 TECU, respectively; and in other months, the daily maximum RMSE values vary between 2.0–9.4 TECU and 1.8–8.9 TECU for the PSO-NN and PSO-NN-GRID models, respectively. It can be seen from Figure 9g–i that the results within the 20°–30° N latitude range show a remarkable daily variation and significantly higher RMSEs compared to the 30°–40° N and 40°–50° N latitude ranges.

3.5. Analysis under Different Solar Activity Conditions

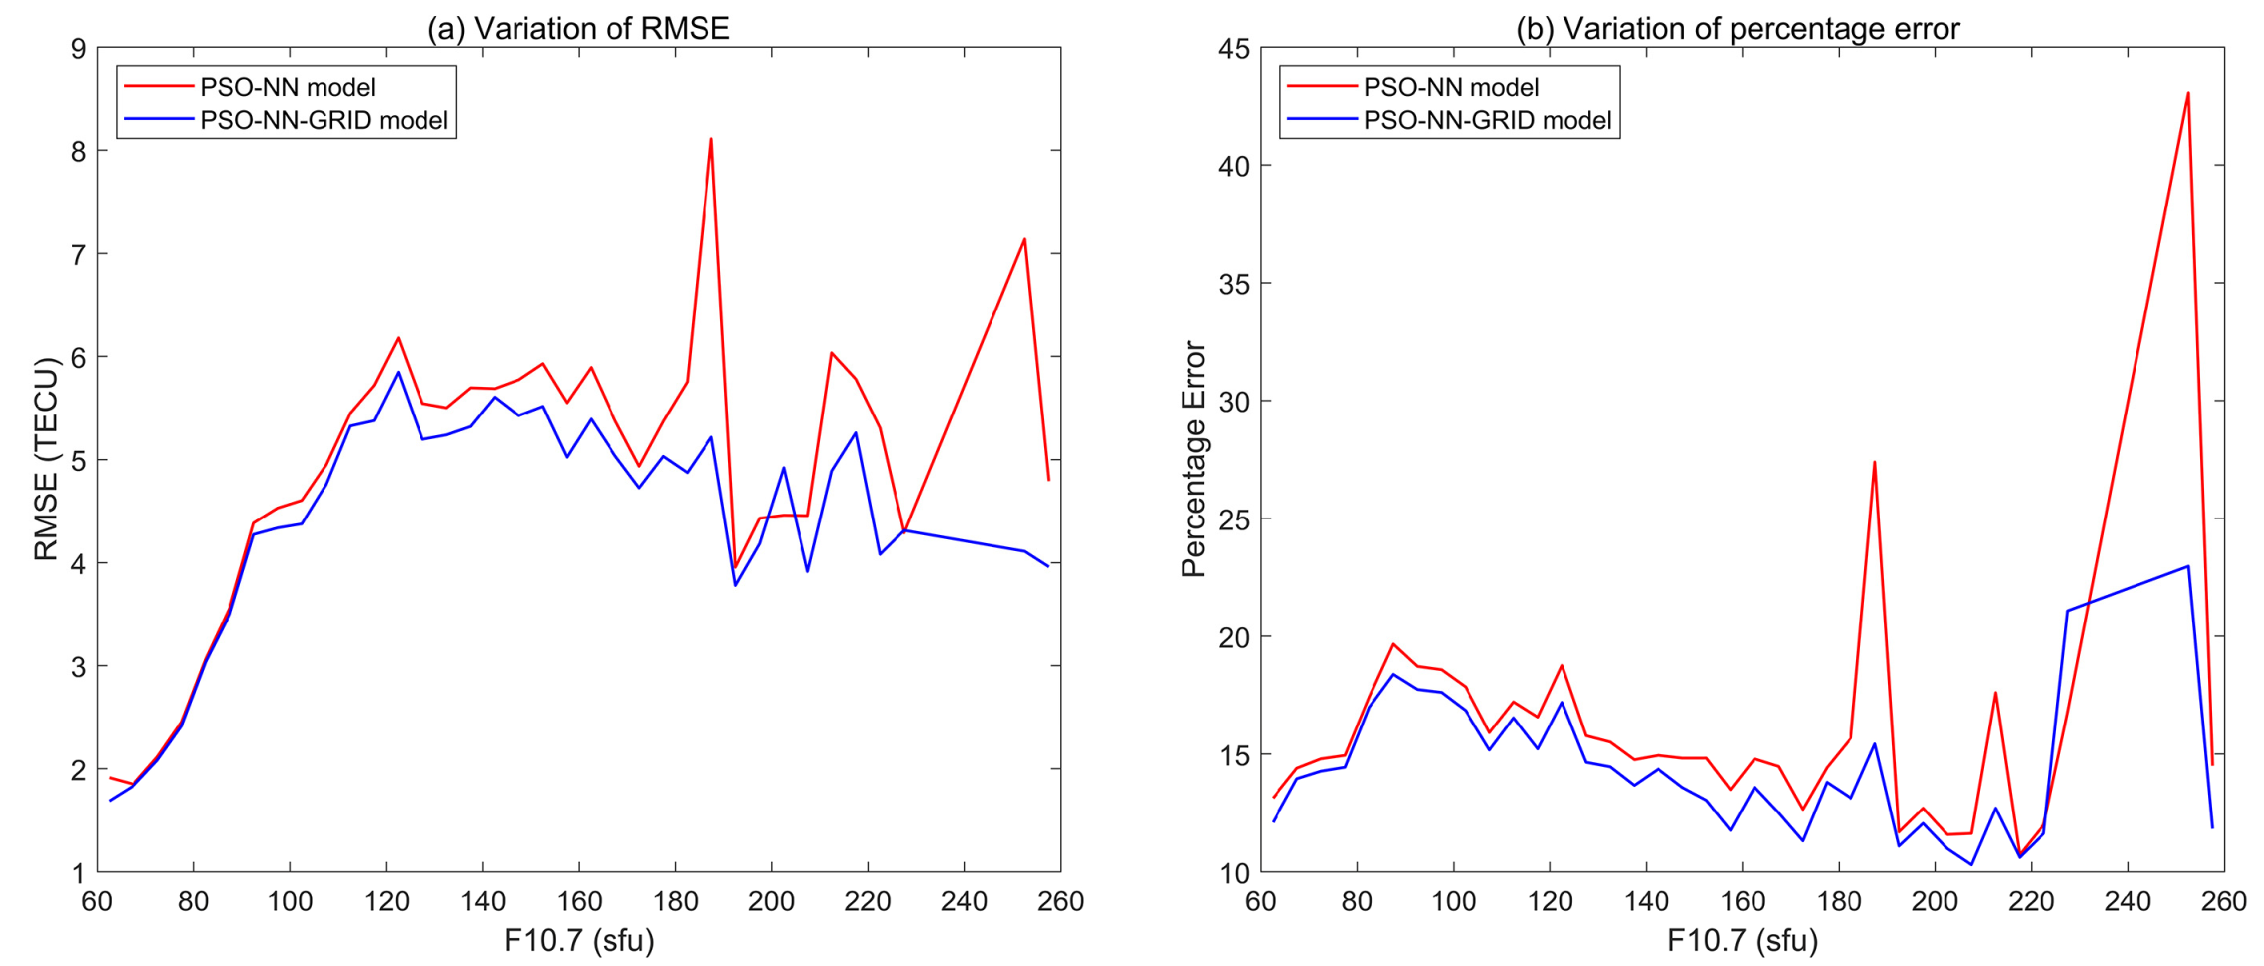
To further investigate the performance of the PSO-NN-GRID model under varying solar activity conditions, Figure 10 illustrates the variations in RMSE and percentage error for the TECs estimated from the PSO-NN and PSO-NN-GRID models under different solar activity conditions. In each subfigure, the blue and red lines represent the results for the PSO-NN and PSO-NN-GRID models, respectively. The percentage error is calculated using the following equation:
P e r c e n t a g e E r r o r = 1 N i = 1 N | M o d e l e d T E C i O b s e r v e d T E C i | O b s e r v e d T E C i × 100
where O b s e r v e d T E C i is the TEC obtained from the observations; M o d e l e d T E C i is the TEC estimated from the PSO-NN/PSO-NN-GRID model; and N is the number of data pairs.
Figure 10a indicates that when the F10.7 value is less than 120 sfu, the RMSE increases as solar activity level increases; the RMSE value for the TECs estimated from the PSO-NN-GRID model is generally smaller than that of the PSO-NN model; under low solar activity conditions, the RMSE for the PSO-NN-GRID model is as low as 1.7 TECU; and as solar activity increases, the RMSE value increases and reaches 5.8 TECU. Figure 10b indicates that in most cases, the percentage error for the TECs estimated from the PSO-NN model is greater than that of the PSO-NN-GRID model; the percentage errors for the TECs estimated from the PSO-NN-GRID model are typically less than 20%.
Table 2 shows the RMSEs of the TECs obtained from the PSO-NN and PSO-NN-GRID models at different intervals of the F10.7 value. The results indicate that the RMSEs for the TECs resulting from the PSO-NN and PSO-NN-GRID models are proportional to the intensity of solar activity when the F10.7 value is below 160 sfu, and the PSO-NN-GRID model performs much better than the PSO-NN model; when the F10.7 value exceeds 160 sfu, the RMSE value decreases as the F10.7 value increases. For example, the RMSEs for the TECs resulting from the PSO-NN-GRID model are, respectively, 2.05, 3.81, 5.10, 5.37, 5.08, 4.37, and 4.10 TECU during the intervals [0,80), [80,100), [100,130), [130,160), [160,190), [190,220), and [220,+), and these values are, respectively, 1.0%, 2.8%, 4.7%, 5.5%, 10.1%, 9.1%, and 28.4% smaller than the corresponding values for the PSO-NN model.

4. Discussion

The analysis results in Section 3 indicate that the PSO-NN-GRID model, constructed using the “gridded neural networks” method, outperforms the PSO-NN model. Generally, regional ionospheric TEC models are established based on mathematical functions. Mao et al. [42] developed a climatology model of TEC over China using the empirical orthogonal function (EOF) and ground-based GPS data from the IGS and CMONOC over China during 1996–2004. The results demonstrate good agreement between the observed monthly median TEC and the predictions from the EOF model. Liu et al. [43] established a regional model over China based on spherical cap harmonic analysis (SCHA) and observation data from 40 stations across China in 2004. The prediction accuracies of the SCHA model for 1-day, 2-day, 3-day, and 2-month latencies are 2.5 TECU, 3.5 TECU, 4.5TECU, and 4.5 TECU, respectively. Aa et al. [12] developed a regional TEC model over China and adjacent areas using the Kalman filter data assimilation method and GNSS data from CMONOC and IGS. The comparison results reveal significant improvements when data are assimilated into the background model, thereby demonstrating the effectiveness of data assimilation in enhancing the accuracy of the TEC model over China and adjacent areas. The investigation of these mathematical function-based models suggests that these regional TEC models lack long-term TEC predictability, which is crucial for positioning and space applications. To improve long-term TEC prediction capabilities, many researchers have attempted to utilize new modeling methods or increasing the amount of observational data. Song et al. [20] developed a regional TEC model over China using the GA-optimized NN method and data from 43 GPS stations in CMONOC. The results indicate the potential applications of the GA-NN method in ionospheric studies. Shi et al. [31] established a regional TEC model over China based on long-term ground-based and space-borne GNSS observations and the PSO-NN method. The results show that during the solar maximum year, the RMSE variation ranges for the PSO-NN-GRID model are 2.65–4.56 TECU, 2.73–6.02 TECU, and 4.71–9.54 TECU at geographic latitudes of 20°–30° N, 30°–40° N, and 40°–50° N, respectively. The corresponding variation ranges during the solar minimum year are 0.99–1.49 TECU, 1.03–1.87 TECU, and 1.39–3.71 TECU, respectively. It can be seen from the above results that the accuracy of the PSO-NN model differs across different geographical latitude zones. In addition, the ionospheric TEC in different regions exhibit distinct variation characteristics due to the vast expanse of China. Therefore, it is necessary to subdivide China and adjacent regions into smaller areas and model them separately to improve the accuracy of the model over China. In this study, 25 spatial grids are individually trained using the neural networks optimized by PSO to establish the PSO-NN-GRID model. The PSO-NN-GRID model is found to successfully predict the local time, latitude, longitude, and seasonal variations of TEC, as well as variations under different solar activities; the PSO-NN-GRID model shows better performance than the PSO-NN model in all aspects. But, it should be noted that only observations under quiet geomagnetic conditions are utilized in this study. In subsequent studies, observations under storm geomagnetic conditions will be exclusively used for TEC modeling to improve the predictive capability for TEC under complex space weather conditions. While this study solely utilizes observations under geomagnetic quiet conditions for modeling, the multiple training outcomes indicate that the model’s accuracy improves when incorporating the geomagnetic activity index. Figure A1 in Appendix A depicts the fluctuations of RMSE with the Dst index for TEC estimated from the PSO-NN and PSO-NN-GRID models on the test dataset. In Figure A1, it is observed that the RMSE value decreases as the Dst value increases when the Dst value is less than zero; conversely, when the Dst value exceeds zero, the RMSE value increases with the Dst index. Additionally, the RMSE value for the TECs estimated from the PSO-NN-GRID model is generally lower than that of the PSO-NN model.

5. Conclusions

In this paper, an improved version of the PSO-NN model, built using the “gridded neural networks” method and long-term (2008–2021) ground-based and space-borne observations, is proposed. The gridded neural networks are adopted to improve the regression ability of the neural network within the modeled region and reduce the spatial variability of observations within each grid. In this approach, China and adjacent areas are divided into small spatial grids with dimensions of 18° longitude × 10° latitude. The observations within each grid are separately trained using the neural networks. The input parameters of these models are the same with those of the PSO-NN model, incorporating seasonal information, diurnal information, geographic locations, solar activity, and geomagnetic activity. The 25 trained networks are combined using a front-end code to form the PSO-NN-GRID model. To verify the forecasting ability and performance of the PSO-NN-GRID model, the results of the PSO-NN-GRID model are compared with those of the PSO-NN model and the observed data. The results show that the PSO-NN-GRID model outperforms the PSO-NN model.
The comparison results of the PSO-NN and PSO-NN-GRID models on the test data set show that the PSO-NN-GRID model provides more accurate estimations of TEC, with an RMSE of 3.614 TECU, MAE of 2.257 TECU, and std of 0.426 TECU. These values are, respectively, 7.5%, 5.5%, and 2.5% smaller than those obtained by the PSO-NN model. Furthermore, the TECs estimated from the PSO-NN-GRID model exhibit a temporal variation that is closer to the observed values than those estimated by the PSO-NN model. The RMSE values for the PSO-NN-GRID and PSO-NN models show clear temporal variation in areas below a geographic latitude of 35°N, and the RMSE for the PSO-NN-GRID model is smaller than that of the PSO-NN model. The RMSE value for the PSO-NN-GRID model during the equinox season is larger compared to the summer and winter. In the equinox, summer, and winter of 2015, the PSO-NN-GRID model exhibits improvements over the PSO-NN model with ranges of 0.4–22.1%, 0.1–12.8%, and 0.2–26.2%, respectively; in the year 2019, these improvements are observed to be 0.5–13.6%, 0–10.1%, and 0–16.1%, respectively.
The results for the PSO-NN-GRID model at the 12 test stations show that the RMSE values for the TECs estimated from the PSO-NN-GRID model at the four stations within a 40–50° N geographic latitude are 2.45, 2.42, 2.21, and 2.13 TECU, respectively, which are 8.2%, 3.6%, 11.2%, and 12.0% smaller than the corresponding values for the PSO-NN model; for the four stations located between a 30° and 40° N geographic latitude, the RMSE values from the PSO-NN-GRID model are 2.59, 2.75, 3.84, and 2.59 TECU, respectively, manifesting improvements of 6.2%, 7.7%, 3.0%, and 4.1% over the PSO-NN model; for the four stations located within the 20–30° N geographic latitude, the RMSE values for the PSO-NN-GRID model are 4.40, 6.15, 4.69, and 5.37 TECU, respectively, demonstrating improvements of 5.4%, 4.9%, 4.5%, and 2.4%, respectively. In addition, the verification of the performance for the PSO-NN-GRID model under various solar activity conditions show that the RMSEs for the TECs resulting from the PSO-NN-GRID model, with F10.7 values categorized within the ranges of [0,80), [80,100), [100,130), [130,160), [160,190), [190,220), and [220,+), are 2.05, 3.81, 5.10, 5.37, 5.08, 4.37, and 4.10 TECU, respectively. These values exhibit reductions of 1.0%, 2.8%, 4.7%, 5.5%, 10.1%, 9.1%, and 28.4% in comparison to the corresponding values obtained from the PSO-NN model.

Author Contributions

Conceptualization, F.S. and S.S.; methodology, S.S.; software, F.S.; validation, F.S. and S.S.; formal analysis, F.S. and S.S.; investigation, F.S. and S.S.; resources, S.S.; data curation, F.S. and S.S.; writing—original draft preparation, F.S.; writing—review and editing, S.S.; visualization, F.S.; supervision, F.S.; project administration, F.S.; funding acquisition, F.S. All authors have read and agreed to the published version of the manuscript.

Funding

This research was funded by the National Natural Science Foundation of China (Grants 42171422, 42274021 and 41874040), the Research on Academician He (Grant 42361134583), the State Key Program of National Natural Science Foundation of China (Grant 41730109).

Institutional Review Board Statement

Not applicable.

Informed Consent Statement

Not applicable.

Data Availability Statement

The ground-based GPS data are available from the Crustal Movement Observation Network of China (CMONOC) through the link (http://www.shao.ac.cn/shao_gnss_ac) (accessed on 10 February 2023). The COSMIC data are available from the COSMIC Data Analysis and Archive Centre (CDAAC) via the link (https://www.cosmic.ucar.edu/) (accessed on 10 February 2023). The FY-3 data are available from the National Satellite Meteorological Center via the link (http://satellite.nsmc.org.cn/PortalSite/Data/Satellite.aspx) (accessed on 10 February 2023). The solar activity index F10.7 data are available from the Goddard Space Flight Center through the link (https://omniweb.gsfc.nasa.gov/) (accessed on 10 February 2023). The geomagnetic Dst index is available from the World Data Center for Geomagnetism, Kyoto, via the link (http://wdc.kugi.kyoto-u.ac.jp/) (accessed on 10 February 2023).

Conflicts of Interest

The authors declare no conflicts of interest.

Appendix A

Figure A1. Variations of RMSE for TECs estimated from the PSO-NN and PSO-NN-GRID models with the Dst index.
Atmosphere 15 00351 g0a1

References

  1. Klobuchar, J.A. Ionospheric time-delay algorithm for single-frequency GPS users. IEEE Trans. Aerosp. Electron. Syst. 1987, AES-23, 325–331. [Google Scholar] [CrossRef]
  2. Wang, N.; Yuan, Y.; Li, Z.; Huo, X. Improvement of Klobuchar model for GNSS single-frequency ionospheric delay corrections. Adv. Space Res. 2016, 57, 1555–1569. [Google Scholar] [CrossRef]
  3. Hochegger, G.; Nava, B.; Radicella, S.; Leitinger, R. A family of ionospheric models for different uses. Phys. Chem. Earth Part C Sol. Terr. Planet. Sci. 2000, 25, 307–310. [Google Scholar] [CrossRef]
  4. Nava, B.; Coïsson, P.; Radicella, S.M. A new version of the NeQuick ionosphere electron density model. J. Atmos. Sol.-Terr. Phys. 2008, 70, 1856–1862. [Google Scholar] [CrossRef]
  5. Yuan, Y.; Wang, N.; Li, Z.; Huo, X. The BeiDou global broadcast ionospheric delay correction model (BDGIM) and its preliminary performance evaluation results. Navigation 2019, 66, 55–69. [Google Scholar] [CrossRef]
  6. Bilitza, D.; Altadill, D.; Truhlik, V.; Shubin, V.; Galkin, I.; Reinisch, B.; Huang, X. International Reference Ionosphere 2016: From ionospheric climate to real-time weather predictions. Space Weather 2017, 15, 418–429. [Google Scholar] [CrossRef]
  7. Bilitza, D. IRI the international standard for the ionosphere. Adv. Radio Sci. 2018, 16, 1–11. [Google Scholar] [CrossRef]
  8. Ridley, A.J.; Deng, Y.; Tóth, G. The global ionosphere—Thermosphere model. J. Atmos. Sol.-Terr. Phys. 2006, 68, 839–864. [Google Scholar] [CrossRef]
  9. Daniell, R.E.; Brown, L.D.; Anderson, D.N.; Fox, M.W.; Doherty, P.H.; Decker, D.T.; Sojka, J.J.; Schunk, R.W. Parameterized ionospheric model: A global ionospheric parameterization based on first principles models. Radio Sci. 1995, 30, 1499–1510. [Google Scholar] [CrossRef]
  10. Schunk, R.W.; Scherliess, L.; Sojka, J.J.; Thompson, D.C.; Anderson, D.N.; Codrescu, M.; Minter, C.; Fuller-Rowell, T.J.; Heelis, R.A.; Hairston, M.; et al. Global assimilation of ionospheric measurements (GAIM). Radio Sci. 2004, 39, RS1S02. [Google Scholar] [CrossRef]
  11. Bergeot, N.; Chevalier, J.-M.; Bruyninx, C.; Pottiaux, E.; Aerts, W.; Baire, Q.; Legrand, J.; Defraigne, P.; Huang, W. Near real-time ionospheric monitoring over Europe at the Royal Observatory of Belgium using GNSS data. J. Space Weather Space Clim. 2014, 4, A31. [Google Scholar] [CrossRef]
  12. Aa, E.; Huang, W.; Yu, S.; Liu, S.; Shi, L.; Gong, J.; Chen, Y.; Shen, H. A regional ionospheric TEC mapping technique over China and adjacent areas on the basis of data assimilation. J. Geophys. Res. Space Phys. 2015, 120, 5049–5061. [Google Scholar] [CrossRef]
  13. Li, M.; Yuan, Y.; Wang, N.; Li, Z.; Liu, X.; Zhang, X. Statistical comparison of various interpolation algorithms for reconstructing regional grid ionospheric maps over China. J. Atmos. Sol.-Terr. Phys. 2018, 172, 129–137. [Google Scholar] [CrossRef]
  14. Li, Z.; Wang, N.; Wang, L.; Liu, A.; Yuan, H.; Zhang, K. Regional ionospheric TEC modeling based on a two-layer spherical harmonic approximation for real-time single-frequency PPP. J. Geod. 2019, 93, 1659–1671. [Google Scholar] [CrossRef]
  15. Adolfs, M.; Hoque, M.M. A neural network-based TEC model capable of reproducing nighttime winter anomaly. Remote Sens. 2021, 13, 4559–4573. [Google Scholar] [CrossRef]
  16. Li, W.; Zhao, D.; He, C.; Hu, A.; Zhang, K. Advanced machine learning optimized by the genetic algorithm in ionospheric models using long-term multi-instrument observations. Remote Sens. 2020, 12, 866. [Google Scholar] [CrossRef]
  17. Li, X.; Zhou, C.; Tang, Q.; Zhao, J.; Zhang, F.; Xia, G.; Liu, Y. Forecasting ionospheric foF2 based on deep learning method. Remote Sens. 2021, 13, 3849. [Google Scholar] [CrossRef]
  18. Poole, A.W.V.; McKinnell, L.-A. On the predictability of f0F2 using neural networks. Radio Sci. 2000, 35, 225–234. [Google Scholar] [CrossRef]
  19. Sai Gowtam, V.; Tulasi Ram, S. An artificial neural network-based ionospheric model to predict NmF2 and hmF2 using long-term data set of FORMOSAT-3/COSMIC radio occultation observations: Preliminary results. J. Geophys. Res. Space Phys. 2017, 122, 11,743–11,755. [Google Scholar] [CrossRef]
  20. Song, R.; Zhang, X.; Zhou, C.; Liu, J.; He, J. Predicting TEC in China based on the neural networks optimized by genetic algorithm. Adv. Space Res. 2018, 62, 745–759. [Google Scholar] [CrossRef]
  21. Habarulema, J.; McKinnell, L.-A.; Cilliers, P.; Opperman, B. Application of neural networks to South African GPS TEC modelling. Adv. Space Res. 2009, 43, 1711–1720. [Google Scholar] [CrossRef]
  22. Habarulema, J.B.; McKinnell, L.-A.; Opperman, B.D.L. Towards a GPS-based TEC prediction model for Southern Africa with feed forward networks. Adv. Space Res. 2009, 44, 82–92. [Google Scholar] [CrossRef]
  23. Li, W.; Wu, X. An ionospheric total electron content model with a storm option over Japan based on a multi-layer perceptron neural network. Atmosphere 2023, 14, 634. [Google Scholar] [CrossRef]
  24. Okoh, D.; Habarulema, J.B.; Rabiu, B.; Seemala, G.; Wisdom, J.B.; Olwendo, J.; Obrou, O.; Matamba, T.M. Storm-time modeling of the African regional ionospheric total electron content using artificial neural networks. Space Weather 2020, 18, e2020SW002525. [Google Scholar] [CrossRef]
  25. Sabzehee, F.; Farzaneh, S.; Sharifi, M.A.; Akhoondzadeh, M. TEC Regional Modeling and prediction using ANN method and single frequency receiver over IRAN. Ann. Geophys. 2018, 61, GM103. [Google Scholar] [CrossRef]
  26. Shi, S.; Wu, S.; Zhang, K.; Li, W.; Shi, J.; Song, F. An investigation of a new artificial neural network-based TEC model using ground-based GPS and COSMIC-2 measurements over low latitudes. Adv. Space Res. 2022, 70, 2522–2540. [Google Scholar] [CrossRef]
  27. Tulunay, E.; Senalp, E.T.; Radicella, S.M.; Tulunay, Y. Forecasting total electron content maps by neural network technique. Radio Sci. 2006, 41, RS4016. [Google Scholar] [CrossRef]
  28. Maruyama, T. Regional reference total electron content model over Japan based on neural network mapping techniques. Ann. Geophys 2007, 25, 2609–2614. [Google Scholar] [CrossRef]
  29. Razin, M.R.G.; Voosoghi, B.; Mohammadzadeh, A. Efficiency of artificial neural networks in map of total electron content over Iran. Acta Geod. Geophys. 2015, 51, 541–555. [Google Scholar] [CrossRef]
  30. Okoh, D.; Seemala, G.; Rabiu, B.; Habarulema, J.B.; Jin, S.; Shiokawa, K.; Otsuka, Y.; Aggarwal, M.; Uwamahoro, J.; Mungufeni, P.; et al. A neural network-based ionospheric model over Africa from Constellation Observing System for Meteorology, Ionosphere, and Climate and ground Global Positioning System observations. J. Geophys. Res. Space Phys. 2019, 124, 10512–10532. [Google Scholar] [CrossRef]
  31. Shi, S.; Zhang, K.; Shi, J.; Hu, A.; Zhao, D.; Shi, Z.; Sun, P.; Wu, H.; Wu, S. Modeling TEC maps over China using particle swarm optimization neural networks and long-term ground-based GPS, COSMIC, and Fengyun data. Space Weather 2023, 21, e2022SW003357. [Google Scholar] [CrossRef]
  32. Li, Z.; Yuan, Y.; Li, H.; Ou, J.; Huo, X. Two-step method for the determination of the differential code biases of COMPASS satellites. J. Geod. 2012, 86, 1059–1076. [Google Scholar] [CrossRef]
  33. Gowtam, V.S.; Tulasi Ram, S.; Reinisch, B.; Prajapati, A. A new artificial neural network-based global three-dimensional ionospheric model (ANNIM-3D) using long-term ionospheric observations: Preliminary results. J. Geophys. Res. Space Phys. 2019, 124, 4639–4657. [Google Scholar] [CrossRef]
  34. Prol, F.S.; Hoque, M.M. Topside ionosphere and plasmasphere modelling using GNSS radio occultation and POD data. Remote Sens. 2021, 13, 1559. [Google Scholar] [CrossRef]
  35. Liu, J.-Y.; Lin, C.-H.; Rajesh, P.K.; Lin, C.-Y.; Chang, F.-Y.; Lee, I.T.; Fang, T.-W.; Fuller-Rowell, D.; Chen, S.-P. Advances in ionospheric space weather by using FORMOSAT-7/COSMIC-2 GNSS radio occultations. Atmosphere 2022, 13, 858. [Google Scholar] [CrossRef]
  36. Ren, X.; Li, Y.; Mei, D.; Zhu, W.; Zhang, X. Improving topside ionospheric empirical model using FORMOSAT-7/COSMIC-2 data. J. Geod. 2023, 97, 30. [Google Scholar] [CrossRef]
  37. Cherniak, I.V.; Zakharenkova, I.E. Validation of FORMOSAT-3/COSMIC radio occultation electron density profiles by incoherent scatter radar data. Adv. Space Res. 2014, 53, 1304–1312. [Google Scholar] [CrossRef]
  38. McNamara, L.F.; Thompson, D.C. Validation of COSMIC values of foF2 and M(3000)F2 using ground-based ionosondes. Adv. Space Res. 2015, 55, 163–169. [Google Scholar] [CrossRef]
  39. Cherniak, I.; Zakharenkova, I.; Braun, J.; Wu, Q.; Pedatella, N.; Schreiner, W.; Weiss, J.-P.; Hunt, D. Accuracy assessment of the quiet-time ionospheric F2 peak parameters as derived from COSMIC-2 multi-GNSS radio occultation measurements. J. Space Weather Space Clim. 2021, 11, 18. [Google Scholar] [CrossRef]
  40. Potula, B.S.; Chu, Y.-H.; Uma, G.; Hsia, H.-P.; Wu, K.-H. A global comparative study on the ionospheric measurements between COSMIC radio occultation technique and IRI model. J. Geophys. Res. Space Phys. 2011, 116, A02310. [Google Scholar] [CrossRef]
  41. Lee, J.-S.; Lee, S.; Chang, S.; Ahn, B.-H. A comparison of GA and PSO for excess return evaluation in stock markets. In Proceedings of the Artificial Intelligence and Knowledge Engineering Applications: A Bioinspired Approach, Berlin/Heidelberg, Germany, 15–18 June 2005. [Google Scholar] [CrossRef]
  42. Mao, T.; Wan, W.; Yue, X.; Sun, L.; Zhao, B.; Guo, J. An empirical orthogonal function model of total electron content over China. Radio Sci. 2008, 43, 1–12. [Google Scholar] [CrossRef]
  43. Liu, J.; Chen, R.; Wang, Z.; Zhang, H. Spherical cap harmonic model for mapping and predicting regional TEC. GPS Solut. 2010, 15, 109–119. [Google Scholar] [CrossRef]
Figure 1. Geographic location of the 257 ground-based GPS stations in CMONOC.
Atmosphere 15 00351 g001
Figure 2. The flow chart of the particle swarm optimization neural networks algorithm.
Atmosphere 15 00351 g002
Figure 3. Error distribution of TEC estimated from the PSO-NN and PSO-NN-GRID models for the test data set.
Atmosphere 15 00351 g003
Figure 4. Performance of the PSO-NN-GRID model on different sample data sets.
Atmosphere 15 00351 g004
Figure 5. Average diurnal variation in the VTECs estimated from the PSO-NN and PSO-NN-GRID models at the 12 test stations.
Atmosphere 15 00351 g005
Figure 6. Hourly variation in RMSE for TEC estimated from the PSO-NN and PSO-NN-GRID models over different geographic latitudes during the equinox, summer, and winter seasons.
Atmosphere 15 00351 g006
Figure 7. RMSE maps for TEC estimated from the PSO-NN and PSO-NN-GRID models over China during the equinox, summer, and winter seasons.
Atmosphere 15 00351 g007
Figure 8. Scatter plots of VTECs estimated from the PSO-NN and PSO-NN-GRID models versus the observed ones at the 12 test stations.
Atmosphere 15 00351 g008
Figure 9. Comparations of the daily variations for RMSEs of TECs estimated from the PSO-NN and PSO-NN-GRID models over 20°–30° N, 30°–40° N, and 40°–50° N geographic latitude.
Atmosphere 15 00351 g009
Figure 10. Variations of RMSE and percentage error for TECs estimated from the PSO-NN and PSO-NN-GRID models with solar activity.
Atmosphere 15 00351 g010
Table 1. Seasonal RMSE of the TECs resulting from the PSO-NN and PSO-NN-GRID models at the 12 test stations during the equinox, summer, and winter seasons in 2015 and 2019.
Station Code20152019
EquinoxSummerWinterEquinoxSummerWinter
PSO-NN/PSO-NN-GRIDPSO-NN/PSO-NN-GRID
HRBN4.25/3.483.11/2.852.68/2.321.39/1.281.37/1.331.04/1.04
XJBY4.56/4.313.64/3.383.37/2.671.49/1.411.41/1.281.24/1.10
NMWT4.15/3.683.47/3.282.65/2.611.44/1.311.38/1.371.06/0.97
BJYQ4.09/3.423.43/3.042.59/2.301.34/1.181.29/1.190.99/0.92
XJBL4.71/4.693.93/3.582.78/2.641.53/1.511.42/1.401.17/1.09
SDZB4.41/4.213.84/3.612.73/2.681.57/1.441.34/1.321.03/0.99
QHDL5.08/4.354.17/3.913.41/3.281.54/1.441.49/1.461.03/0.95
HBJM7.02/6.764.97/4.864.28/4.231.87/1.861.81/1.801.15/1.15
XZAR7.12/6.695.54/5.384.71/4.692.55/2.372.01/2.001.66/1.43
SCYX7.88/7.645.75/5.615.72/5.412.41/2.342.19/2.181.39/1.36
FJXP8.99/8.695.97/5.926.50/6.492.74/2.612.06/2.001.71/1.70
YNLC9.54/9.036.62/6.618.63/8.273.71/3.643.01/3.012.67/2.53
Table 2. RMSEs of the TECs resulting from the PSO-NN and PSO-NN-GRID models under different solar activities.
F10.7[0, 80)[80, 100)[100, 130)[130, 160)[160, 190)[190, 220)≥220
PSO-NN2.073.925.355.685.654.815.73
PSO-NN-GRID2.053.815.105.375.084.374.10
Disclaimer/Publisher’s Note: The statements, opinions and data contained in all publications are solely those of the individual author(s) and contributor(s) and not of MDPI and/or the editor(s). MDPI and/or the editor(s) disclaim responsibility for any injury to people or property resulting from any ideas, methods, instructions or products referred to in the content.