A Short-Term Forecasting Method for High-Frequency Broadcast MUF Based on LSTM
Abstract
1. Introduction
2. Building Links and Collecting Data
2.1. Overall Approach
- (1)
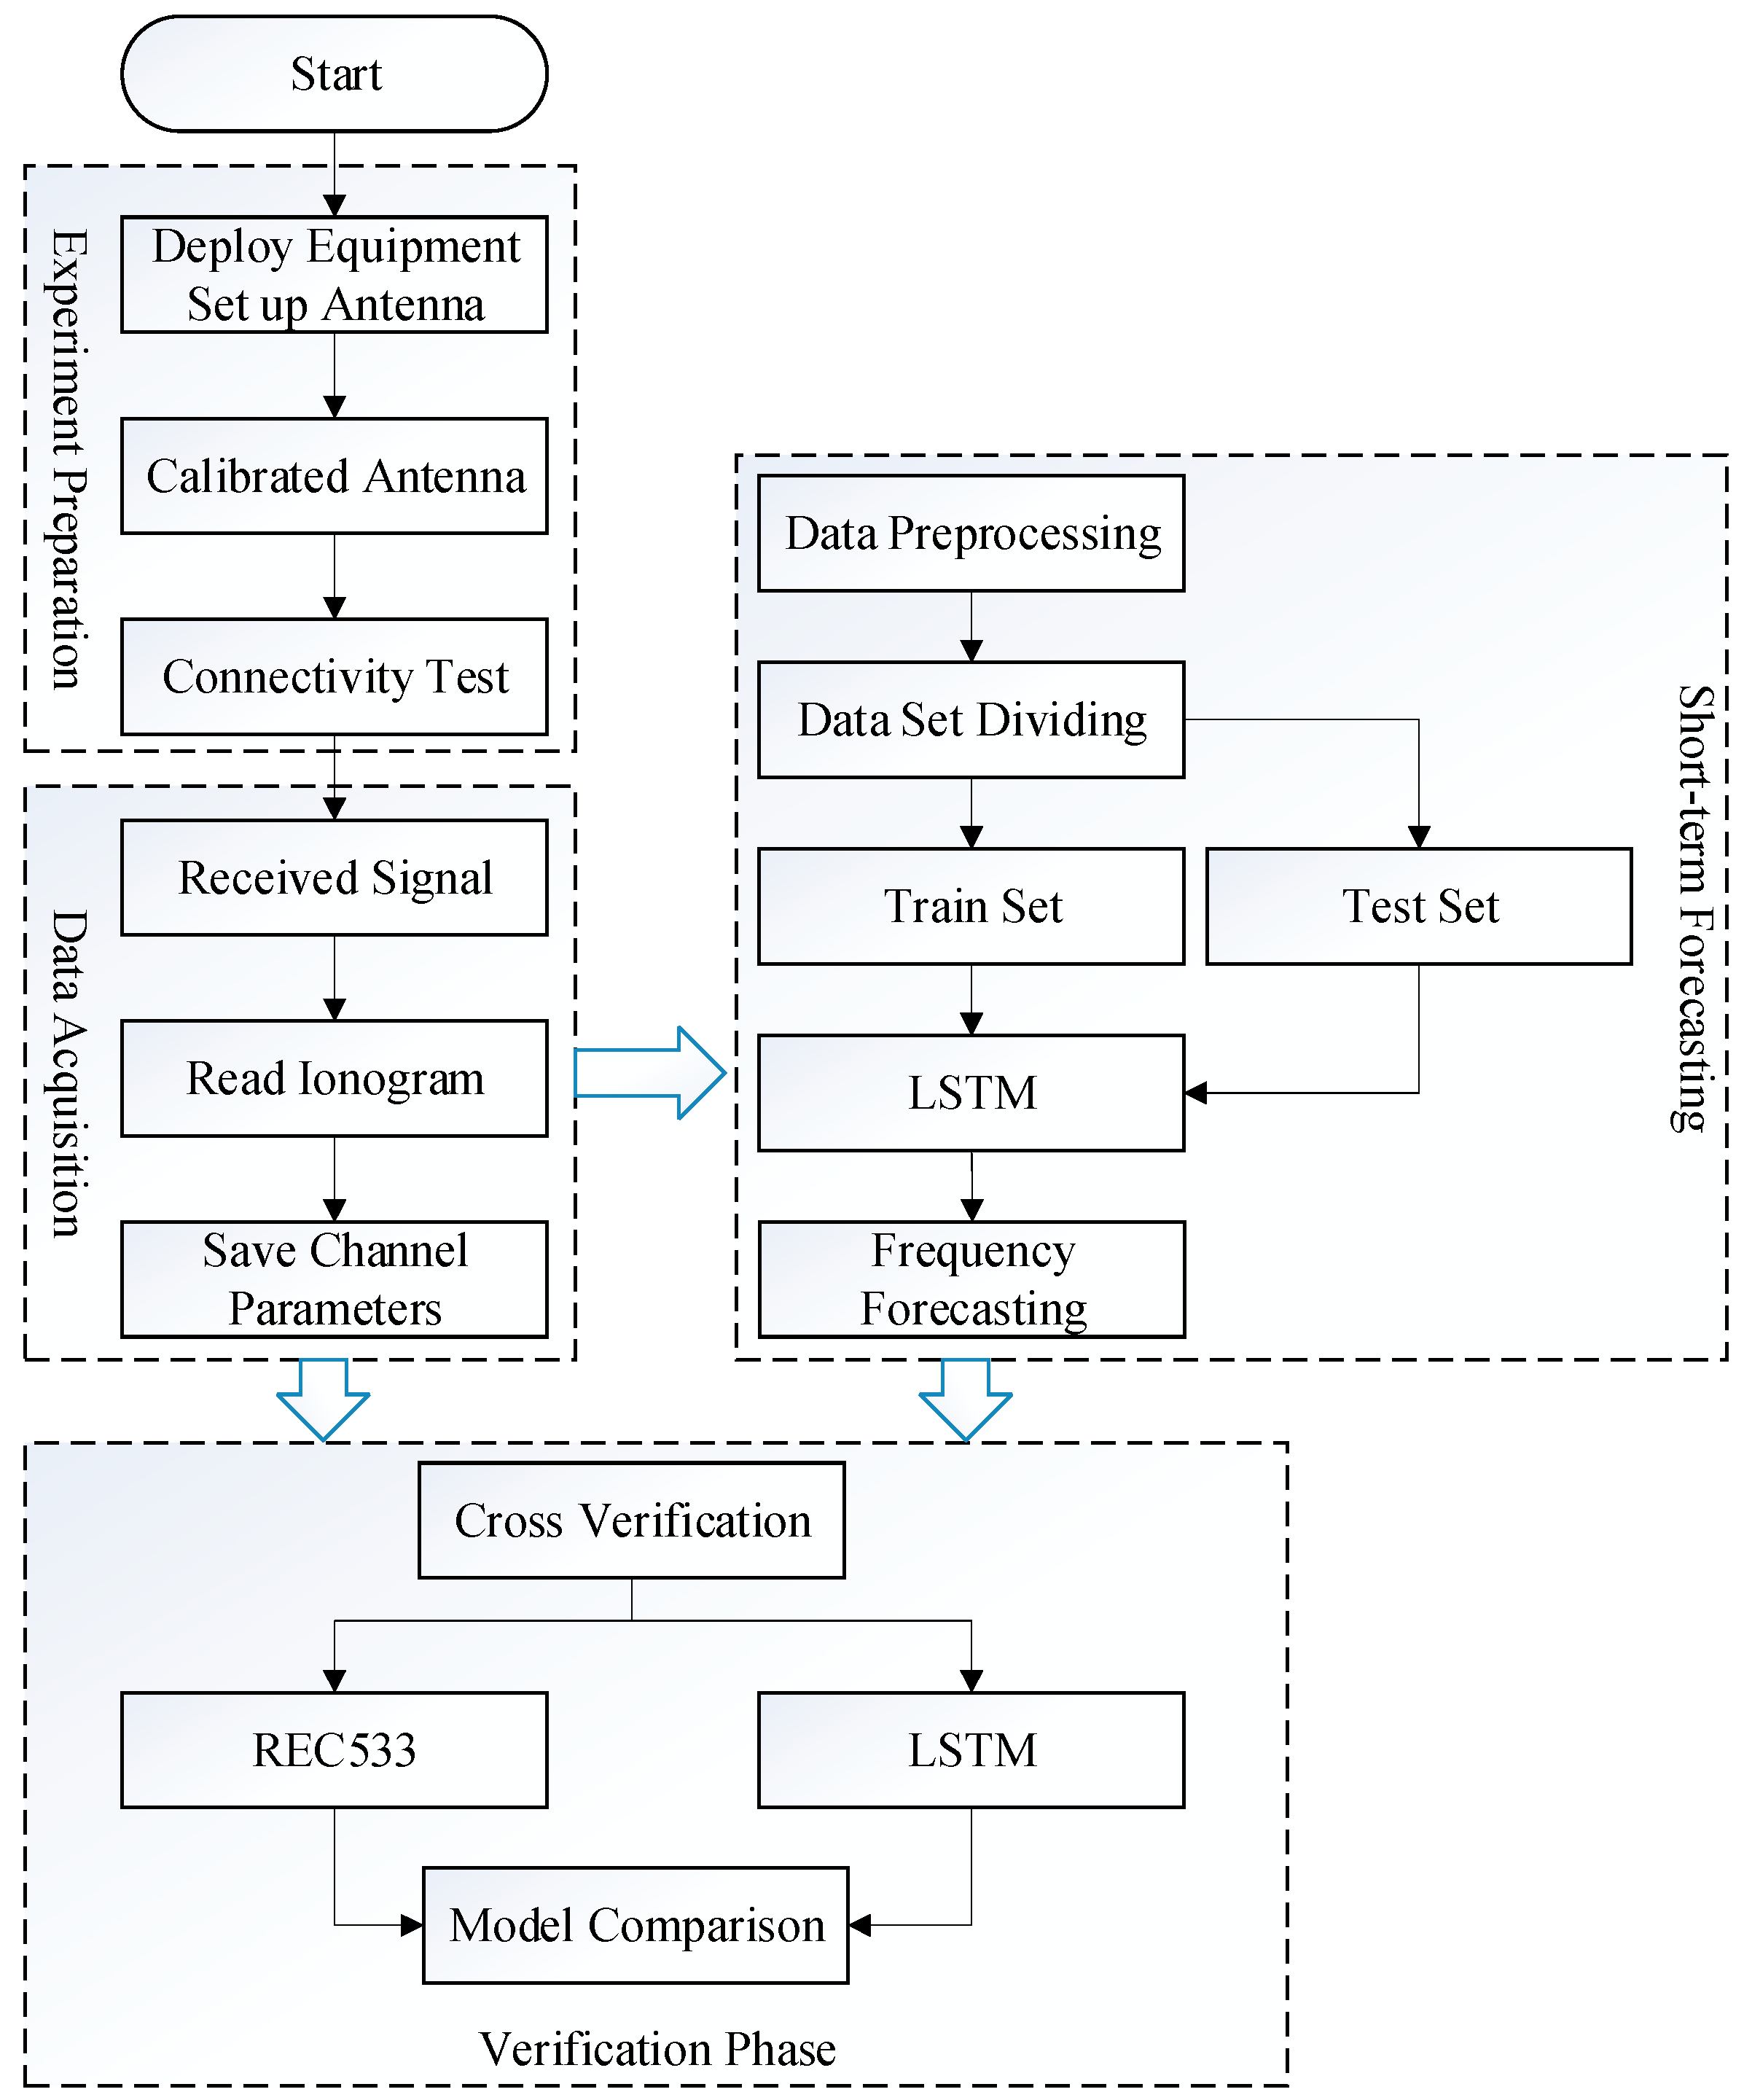
- Set up antennas, calibrate antennas, test connectivity, and carry out preparations for the test.
- (2)
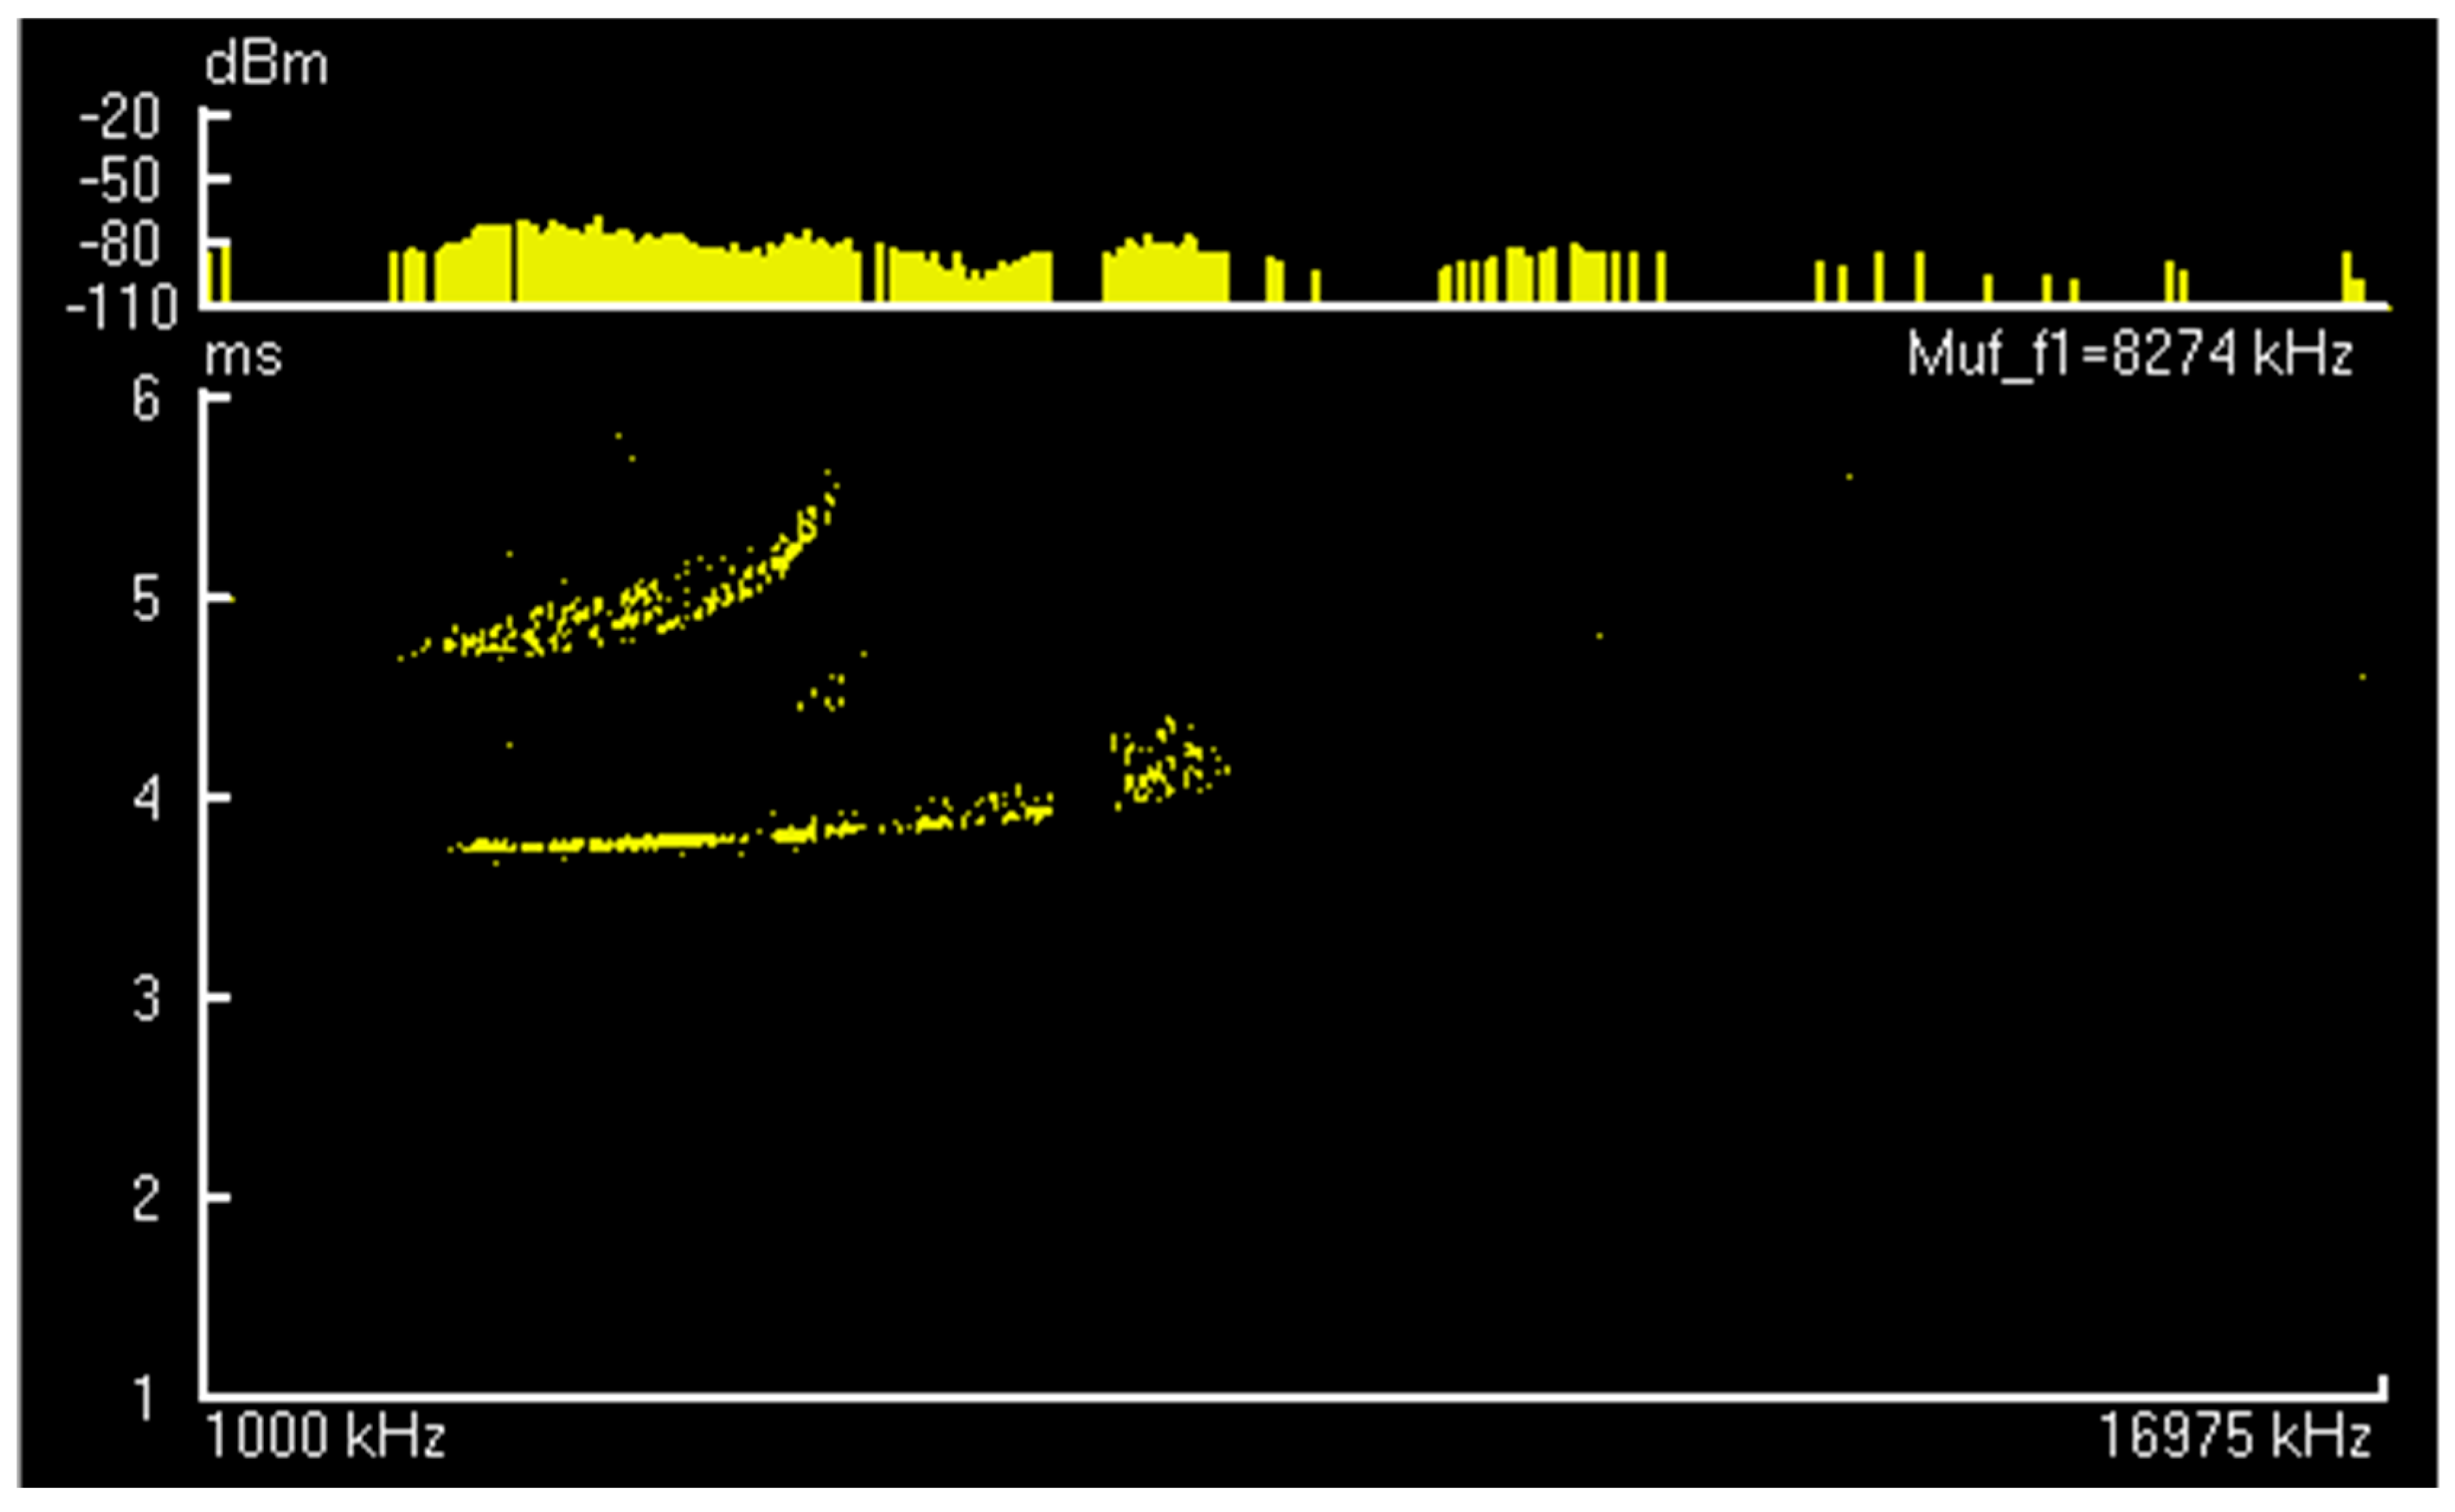
- Collect shortwave channel parameter data based on shortwave channel detection equipment, mainly including MUF, time, transmit link position, receive link position.
- (3)
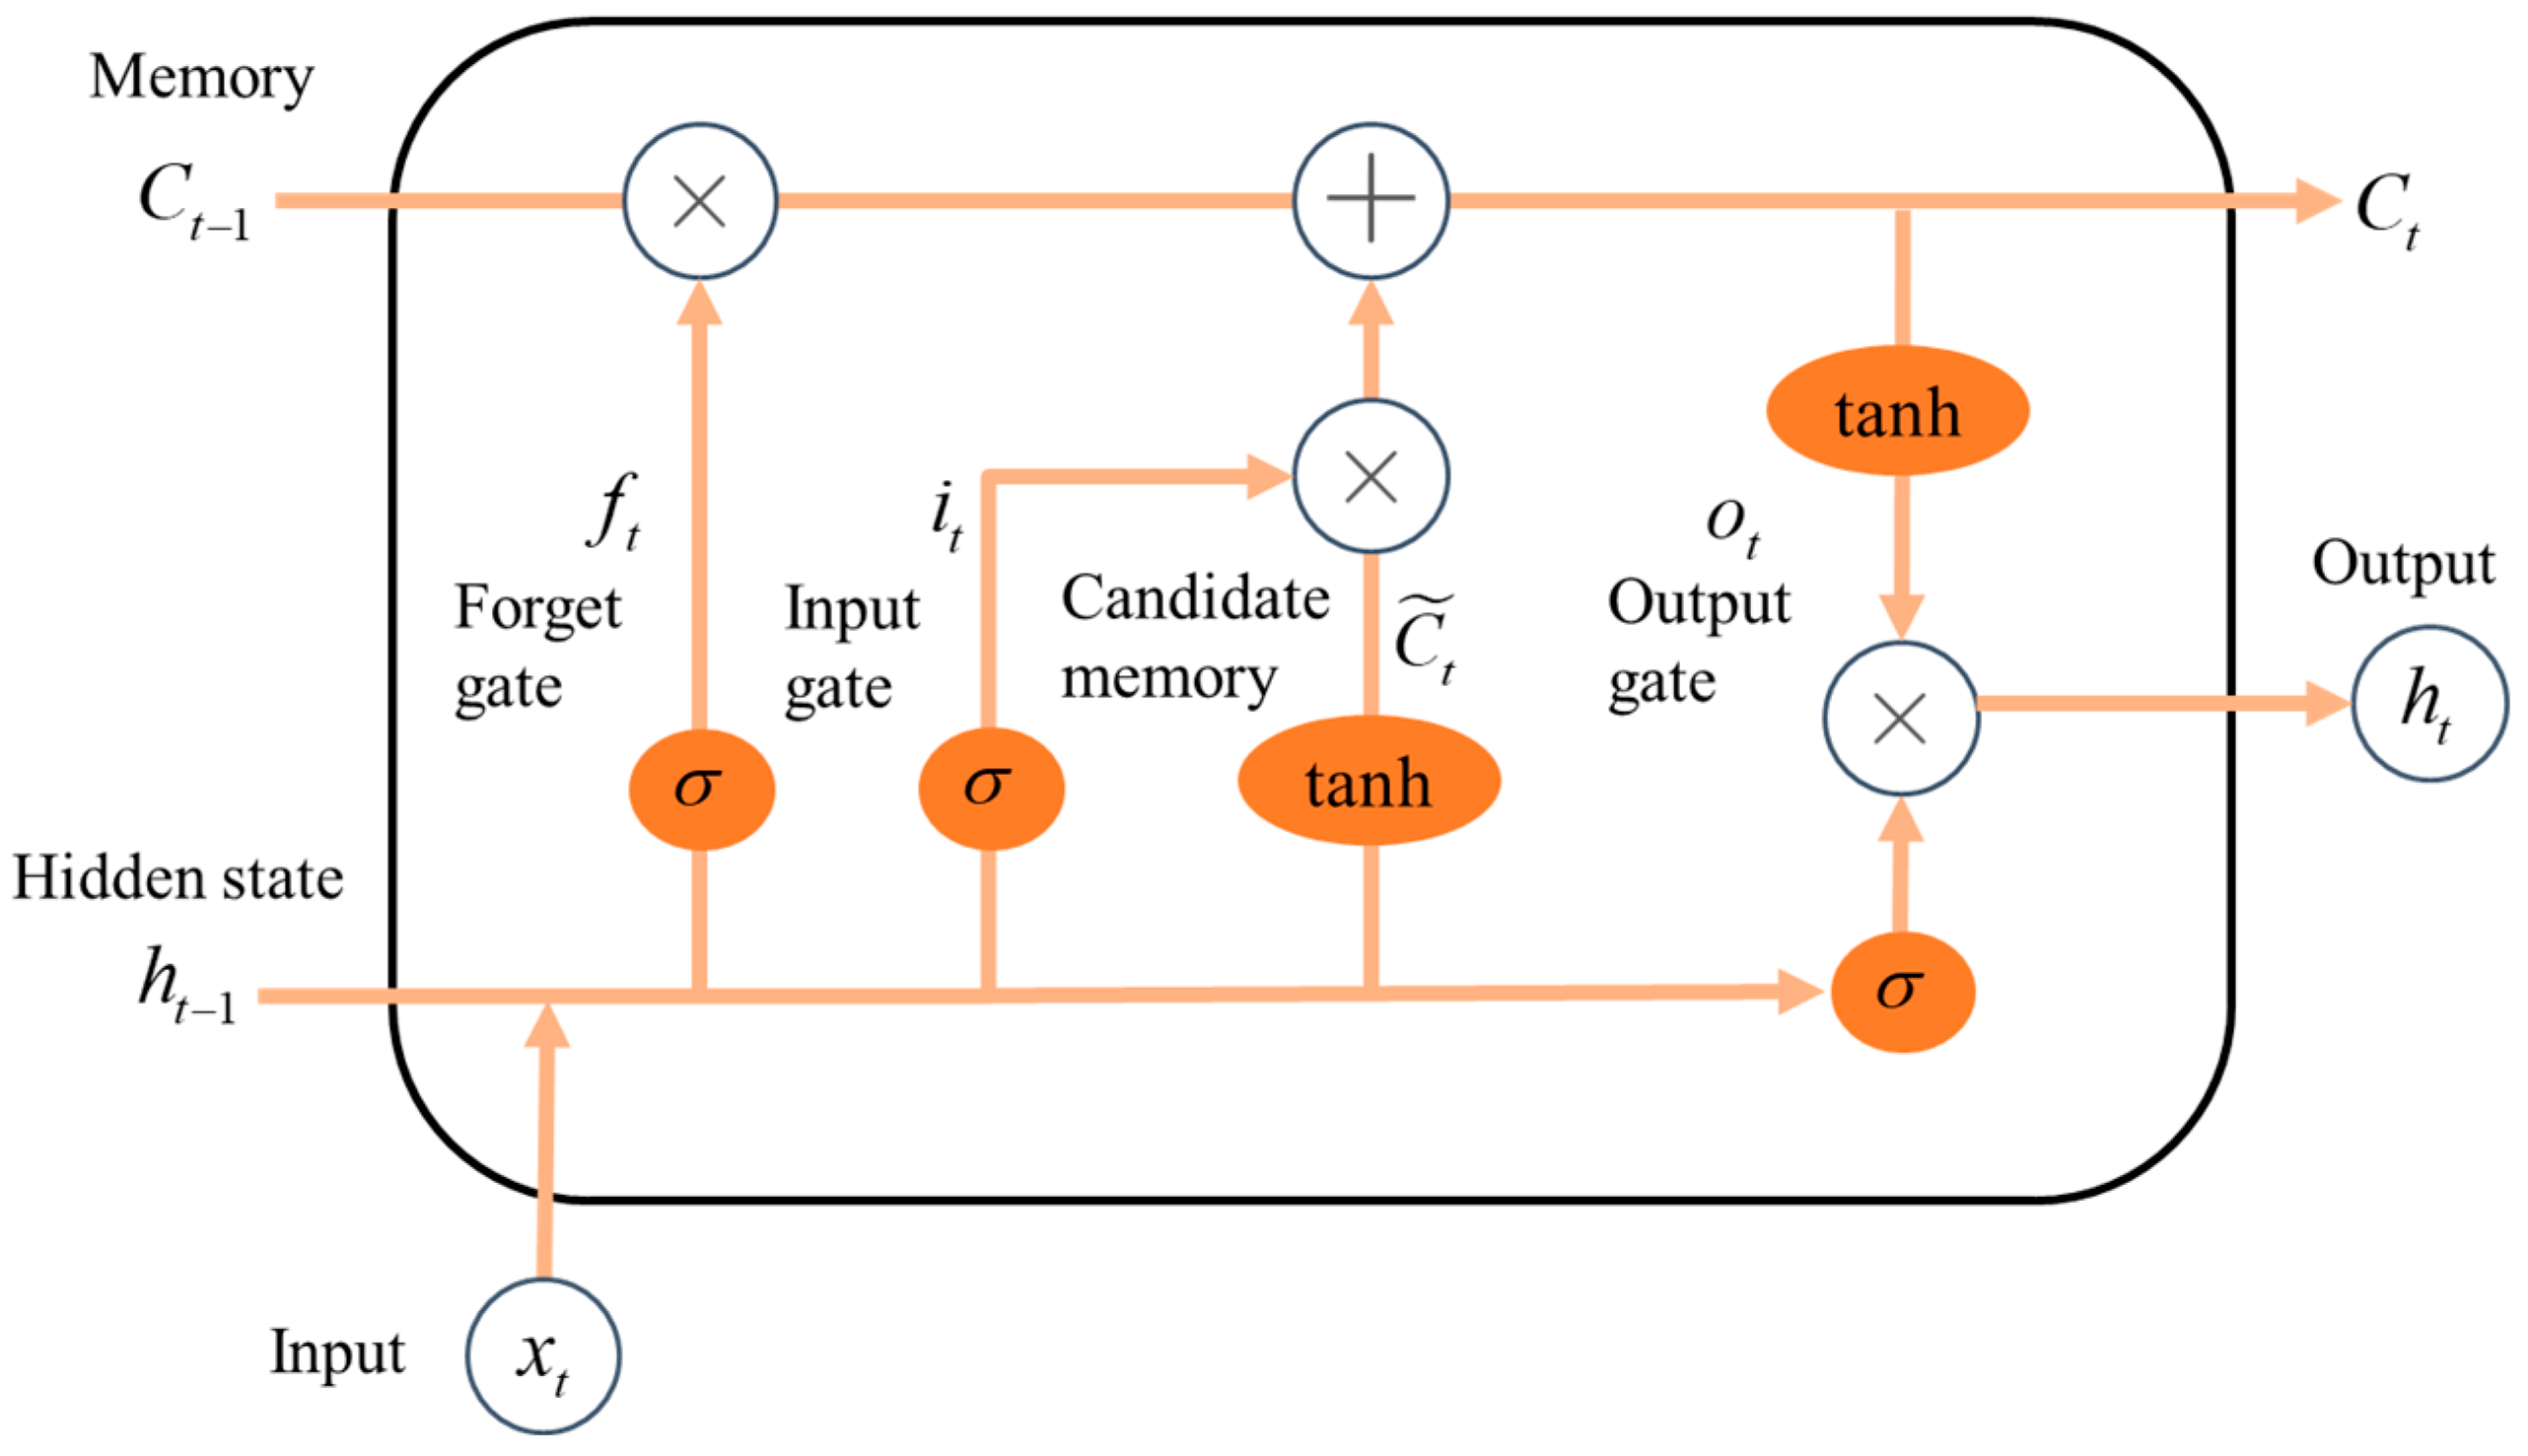
- Preprocess the channel parameter data to ensure the validity of the data, divide the training set and the test set, use the LSTM method to model based on the training set, and then make predictions based on the test set.
- (4)
- The forecast results adopt the cross-validation method and are compared with the forecast results of REC533 to verify the accuracy of this method. The process is shown in Figure 1 below:
2.2. Testing Time and Testing Location
2.3. Data Collection
- (1)
- fminE: the minimum frequency of the E layer; PminE: the group distance corresponding to the minimum frequency of the E layer;
- (2)
- mufE: the maximum usable frequency of the E layer; PmufE: the group distance corresponding to the maximum usable frequency of the E layer;
- (3)
- fminEs: the minimum frequency of the Es layer; PminEs: the group distance corresponding to the minimum frequency of the Es layer;
- (4)
- mufEs: the maximum usable frequency of the Es layer; PmufEs: the group distance corresponding to the maximum usable frequency of the Es layer;
- (5)
- fminF1: the minimum frequency of the ordinary wave in the F1 layer; PminF1: the group distance corresponding to the minimum frequency of the ordinary wave in the F1 layer;
- (6)
- mufF1: the maximum usable frequency of the ordinary wave in the F1 layer; PmufF1: the group distance corresponding to the maximum usable frequency of the ordinary wave in the F1 layer;
- (7)
- fminF2: the minimum frequency of the ordinary wave in the F2 layer; PminF2: the group distance corresponding to the minimum frequency of the ordinary wave in the F2 layer;
- (8)
- mufF2: the maximum usable frequency of the ordinary wave in the F2 layer; PmufF2: the group distance corresponding to the maximum usable frequency of the ordinary wave in the F2 layer;
- (9)
- fhminF2: the minimum frequency of the high-angle mode of the ordinary wave in the F2 layer; PhminF2: the group distance corresponding to the minimum frequency of the high-angle mode of the ordinary wave in the F2 layer.
2.4. Testing Data Information
3. Methodology
3.1. MUF Forecasting Method of REC533
3.2. Modeling Process
4. Results and Discussion
4.1. Validate Analysis Method
4.2. Analysis of Forecast Results Comparison
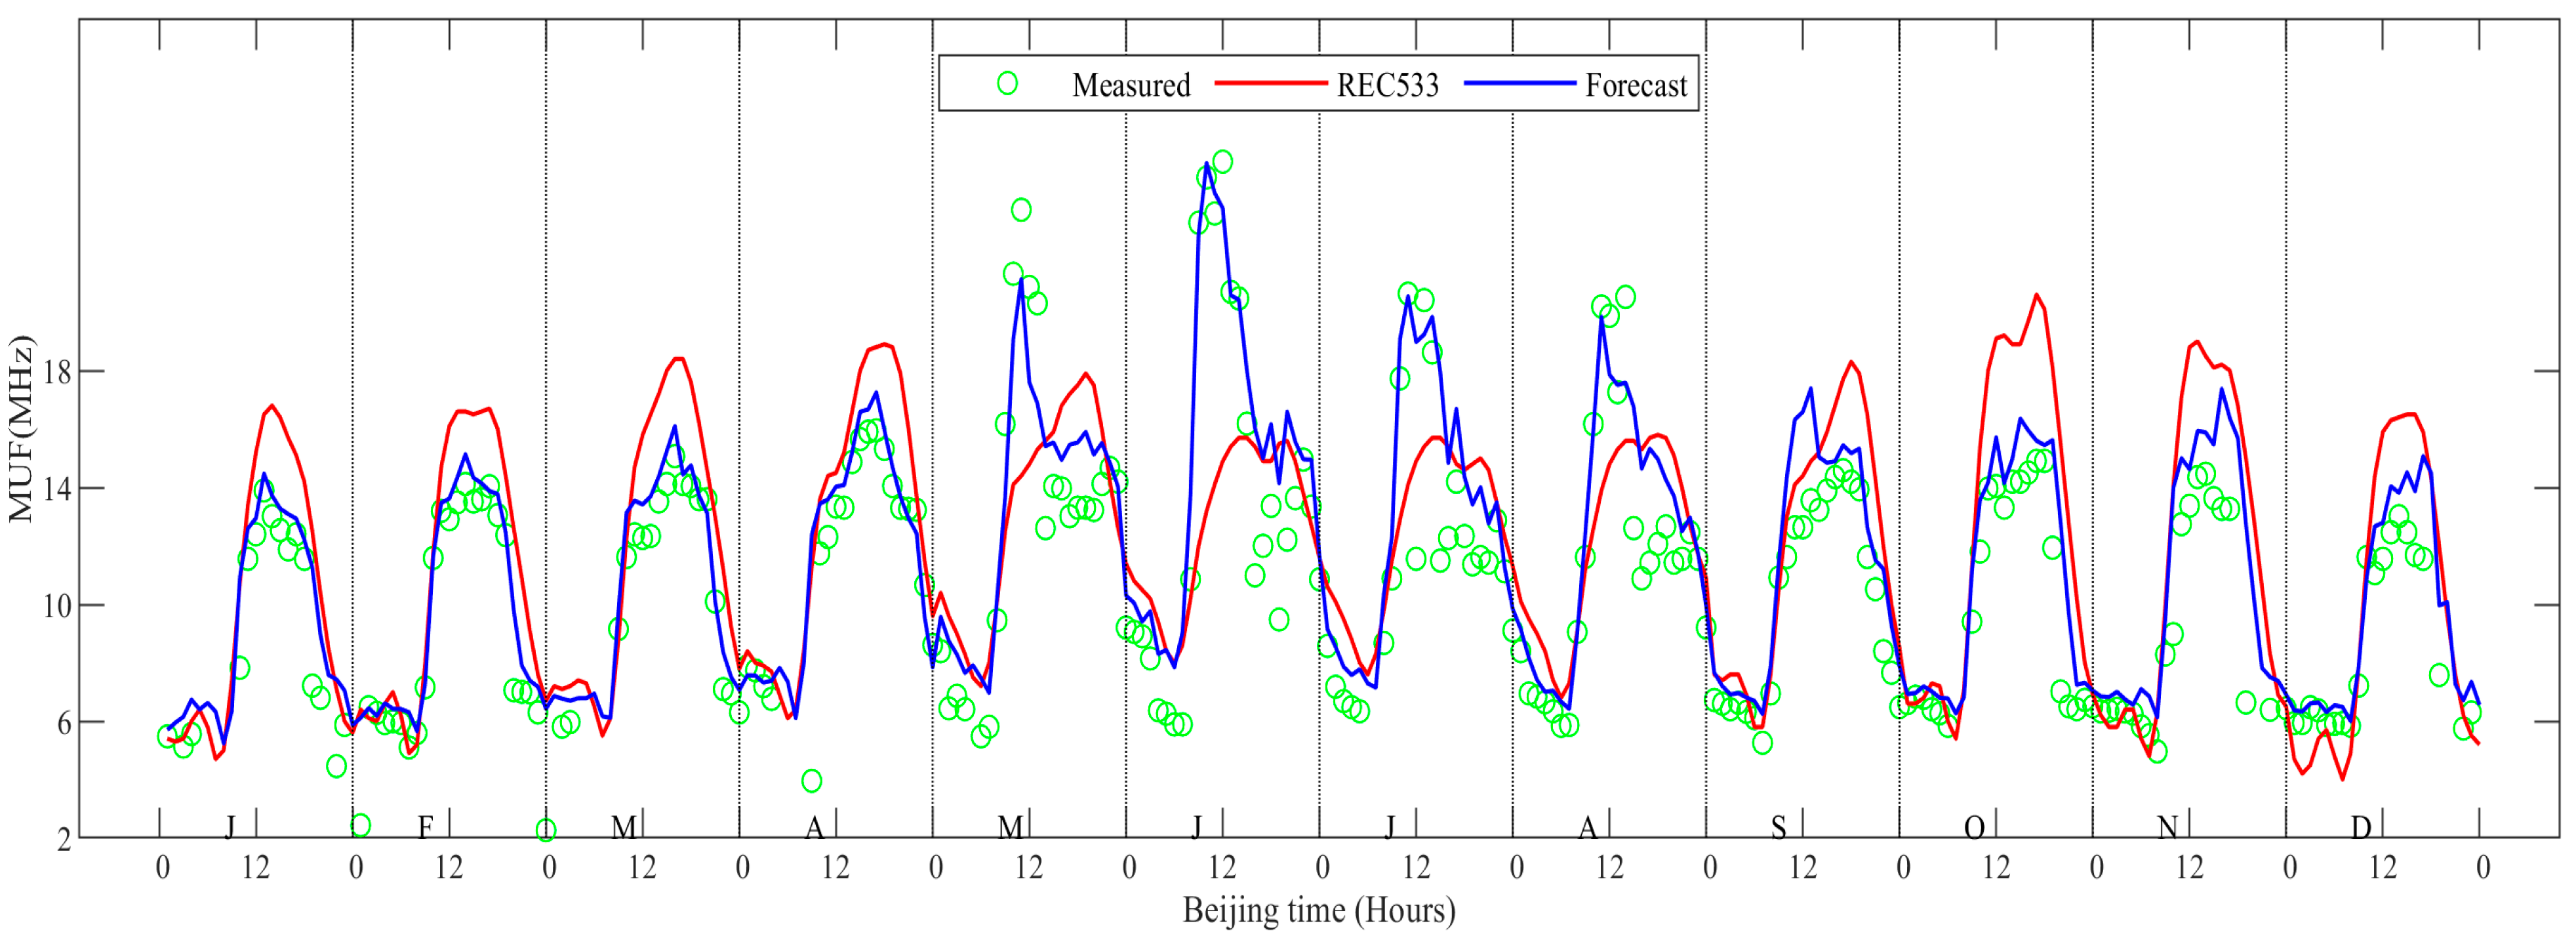
- The testing process adhered to the relevant standards and methods, such as GJB, demonstrating overall smooth test curves except for June, indicating the validity of the measurement results.
- The REC533-calculated results generally align with the overall trend of the actual measurement data. The prediction effect is better in the morning and evening, and the forecast error at noon is larger than that of the measured data, with the maximum root mean square error (RMSE) of 3.29 MHz, except for June.
- The improved core algorithm results closely match the overall curve of the actual measurement data, with a maximum monthly RMSE of 3.01 MHz. The overall calculated results show a reduction of 0.39 MHz in RMSE compared to the REC533 forecast results, with an accuracy improvement of 8.06%.
- The testing process adhered to the relevant standards and methods, such as GJB, demonstrating overall smooth test curves, indicating the validity of the measurement results.
- The REC533 calculation results generally align with the trends observed in the actual measurement data. The prediction effect is better in the morning and evening hours, and the statistical pattern at noon is larger than that of the measured data. Especially from May to August, the measured data fluctuates greatly at noon due to solar activity, and the REC533 method shows a large deviation, with a maximum monthly root mean square error of 6.34 MHz.
- The results obtained from the improved core algorithm model closely match the curves of the actual measurement data. The maximum root mean square error is 5.26 MHz. Overall, the calculated results exhibit a decrease of 0.93 MHz in root mean square error compared to the REC533 forecast results, with an increase in accuracy of 21.48%.
5. Conclusions
Author Contributions
Funding
Institutional Review Board Statement
Informed Consent Statement
Data Availability Statement
Conflicts of Interest
References
- Wang, J.; Ma, J.; Huang, X.; Bai, H.; Chen, Q.; Cheng, H. Modeling of the ionospheric critical frequency of the F2 layer over Asia based on modified temporal-spatial reconstruction. Radio Sci. 2019, 54, 680–691. [Google Scholar] [CrossRef]
- Yan, A.; Wang, G.; Tian, G.; Li, W.; Su, D.; Rahman, T. The HF channel EM parameters estimation under a complex environment using the modified IRI and IGRF model. IEEE Trans. Antennas Propag. 2011, 59, 1779–1783. [Google Scholar] [CrossRef]
- Wang, J.; Yang, C.; An, W. Regional Refined Long-Term Predictions Method of Usable Frequency for HF Communication Based on Machine Learning Over Asia. IEEE Trans. Antennas Propag. 2022, 70, 4040–4055. [Google Scholar] [CrossRef]
- Wang, J. Research and Practice of HF Digital Communication; Science Press: Beijing, China, 2013. [Google Scholar]
- Lin, F.; Chen, J.; Ding, G.; Jiao, Y. Short-Term Fine-Grained Regional MUF Prediction for HF Communication Based on Time-Series Decomposition. IEEE Trans. Antennas Propag. 2023, 71, 9890–9904. [Google Scholar] [CrossRef]
- Definitions of Maximum and Minimum Transmission Frequencies. 2013. Available online: https://www.itu.int/rec/RREC-P.373/en (accessed on 17 December 2023).
- ITU-R Methods of Basic MUF Operational MUF and Ray-Path Prediction. 2015. Available online: https://www.itu.int/rec/R-REC-P.1240/en (accessed on 17 December 2023).
- ITU-R Reference Ionospheric Characteristics. 2023. Available online: https://www.itu.int/rec/R-REC-P.1239/en (accessed on 17 December 2023).
- Wang, J.; Shi, Y.; Yang, C. A review and prospects of operational frequency selecting techniques for HF radio communication. Adv. Space Res. 2022, 69, 2989–2999. [Google Scholar] [CrossRef]
- ITU-R P.533 Method for the Prediction of the Performance of HF Circuits. 2019. Available online: https://www.itu.int/rec/R-REC-P.533-14-201908-I/en (accessed on 17 December 2023).
- Lane, G. Signal-to-Noise Predictions Using VOACAP—A User’s Guide; Rockwell Collins: Cedar Rapids, IA, USA, 2001. [Google Scholar]
- Fan, J.; Liu, C.; Lv, Y.; Han, J.; Wang, J. A Short-Term Forecast Model of foF2 Based on Elman Neural Network. Appl. Sci. 2019, 9, 2782. [Google Scholar] [CrossRef]
- Wichaipanich, N.; Hozumi, K.; Supnithi, P.; Tsugawa, T. A comparison of neural network-based predictions of foF2 with the IRI-2012 model at conjugate points in Southeast Asia. Adv. Space Res. 2017, 59, 2934–2950. [Google Scholar] [CrossRef]
- Li, W.; Zhao, D.; He, C.; Hu, A.; Zhang, K. Advanced Machine Learning Optimized by The Genetic Algorithm in Ionospheric Models Using Long-Term Multi-Instrument Observations. Remote Sens. 2020, 12, 866. [Google Scholar] [CrossRef]
- Wang, J.; Yu, Q.; Shi, Y.; Liu, Y.; Yang, C. An Explainable Dynamic Prediction Method for Ionospheric foF2 Based on Machine Learning. Remote Sens. 2023, 15, 1256. [Google Scholar] [CrossRef]
- Wang, J.; Bai, H.; Huang, X.; Cao, Y.; Chen, Q.; Ma, J. Simplified Regional Prediction Model of Long-Term Trend for Critical Frequency of Ionospheric F2 Region over East Asia. Appl. Sci. 2019, 9, 3219. [Google Scholar] [CrossRef]
- Wang, J.; Shi, Y.; Yang, C.; Zhang, Z.; Zhao, L. A short-term forecast method of maximum usable frequency for HF communication. IEEE Trans. Antennas Propag. 2023, 70, 4040–4055. [Google Scholar] [CrossRef]
- Zhou, Y.; Zhang, Y.; Jiang, C.; Zhao, Z.; Liu, J. Comparison of short term prediction of ionospheric foF2 by Kalman filtering and autocorrelation analysis. J. Space Sci. 2018, 38, 178–187. [Google Scholar] [CrossRef]
- Marin, D.; Miro, C.; Mikhailov, A. A method for foF2 short-term prediction. Phys. Chem. Earth Part C 2000, 25, 327–332. [Google Scholar] [CrossRef]
- Shi, Y.; Yang, C.; Wang, J.; Zhang, Z.; Meng, F.; Bai, H. A Forecasting Model of Ionospheric foF2 Using the LSTM Network Based on ICEEMDAN Decomposition. IEEE Trans. Geosci. Remote Sens. 2023, 61, 1–16. [Google Scholar] [CrossRef]
- Yu, Y.; Lin, F.; Jiao, Y.; Chen, J. Prediction of Maximum Usable Frequency for HF Communications Based on Federated Learning. In Proceedings of the 2022 IEEE/CIC International Conference on Communications in China (ICCC), Foshan, China, 11–13 August 2022; pp. 938–943. [Google Scholar]
- Li, G.; Zheng, G.; Ye, C.; Zhou, Y. Short term prediction method of ionospheric MUF based on robust Kalman filter for tilt detection. J. Commun. 2021, 42, 79–86. [Google Scholar]
- Tang, J.; Ji, S.; Wang, J.; Wang, X. Assimilation Methods of Ionospheric Short-term Forecast for Selecting Frequency in Short-wave Communication. Chin. J. Radio Sci. 2013, 28, 498–504. [Google Scholar]
- Kim, J.; Kwak, Y.; Kim, Y.; Su, I.; Se, H.; Jong, Y. Potential of regional ionosphere prediction using a long short-term memory (LSTM) deep-learning algorithm specialized for geomagnetic storm period. Space Weather 2021, 19, e2021SW002741. [Google Scholar] [CrossRef]
- GJB 2080; General Measurement Method of Field Strength for a Receive Site. Military Standard Publishing House of the National Defense Science and Technology Commission: Beijing, China, 2004.
- Hochreiter, S.; Schmidhuber, J. Long short-term memory. Neural Comput. 1997, 9, 1735–1780. [Google Scholar] [CrossRef] [PubMed]
- Zhang, H.; Xu, H.; Peng, G.; Qian, Y.; Zhang, X.; Yang, G.; Shen, C.; Li, Z.; Yang, J.; Wang, Z.; et al. A prediction model of relativistic electrons at geostationary orbit using the EMD-LSTM network and geomagnetic indices. Space Weather 2022, 20, e2022SW003126. [Google Scholar] [CrossRef]
- Wan, H.; Tian, X.; Liang, J.; Shen, X. Sequence-feature detection of small targets in sea clutter based on bi-LSTM. IEEE Trans. Geosci. Remote Sens. 2022, 60, 4208811. [Google Scholar] [CrossRef]

| Serial Number | Receiving Station Locations | Transmitting Station Locations |
|---|---|---|
| 1 | Shijiazhuang | Urumqi |
| 2 | Nanchang | Kashgar |
| 3 | Golmud | Yili |
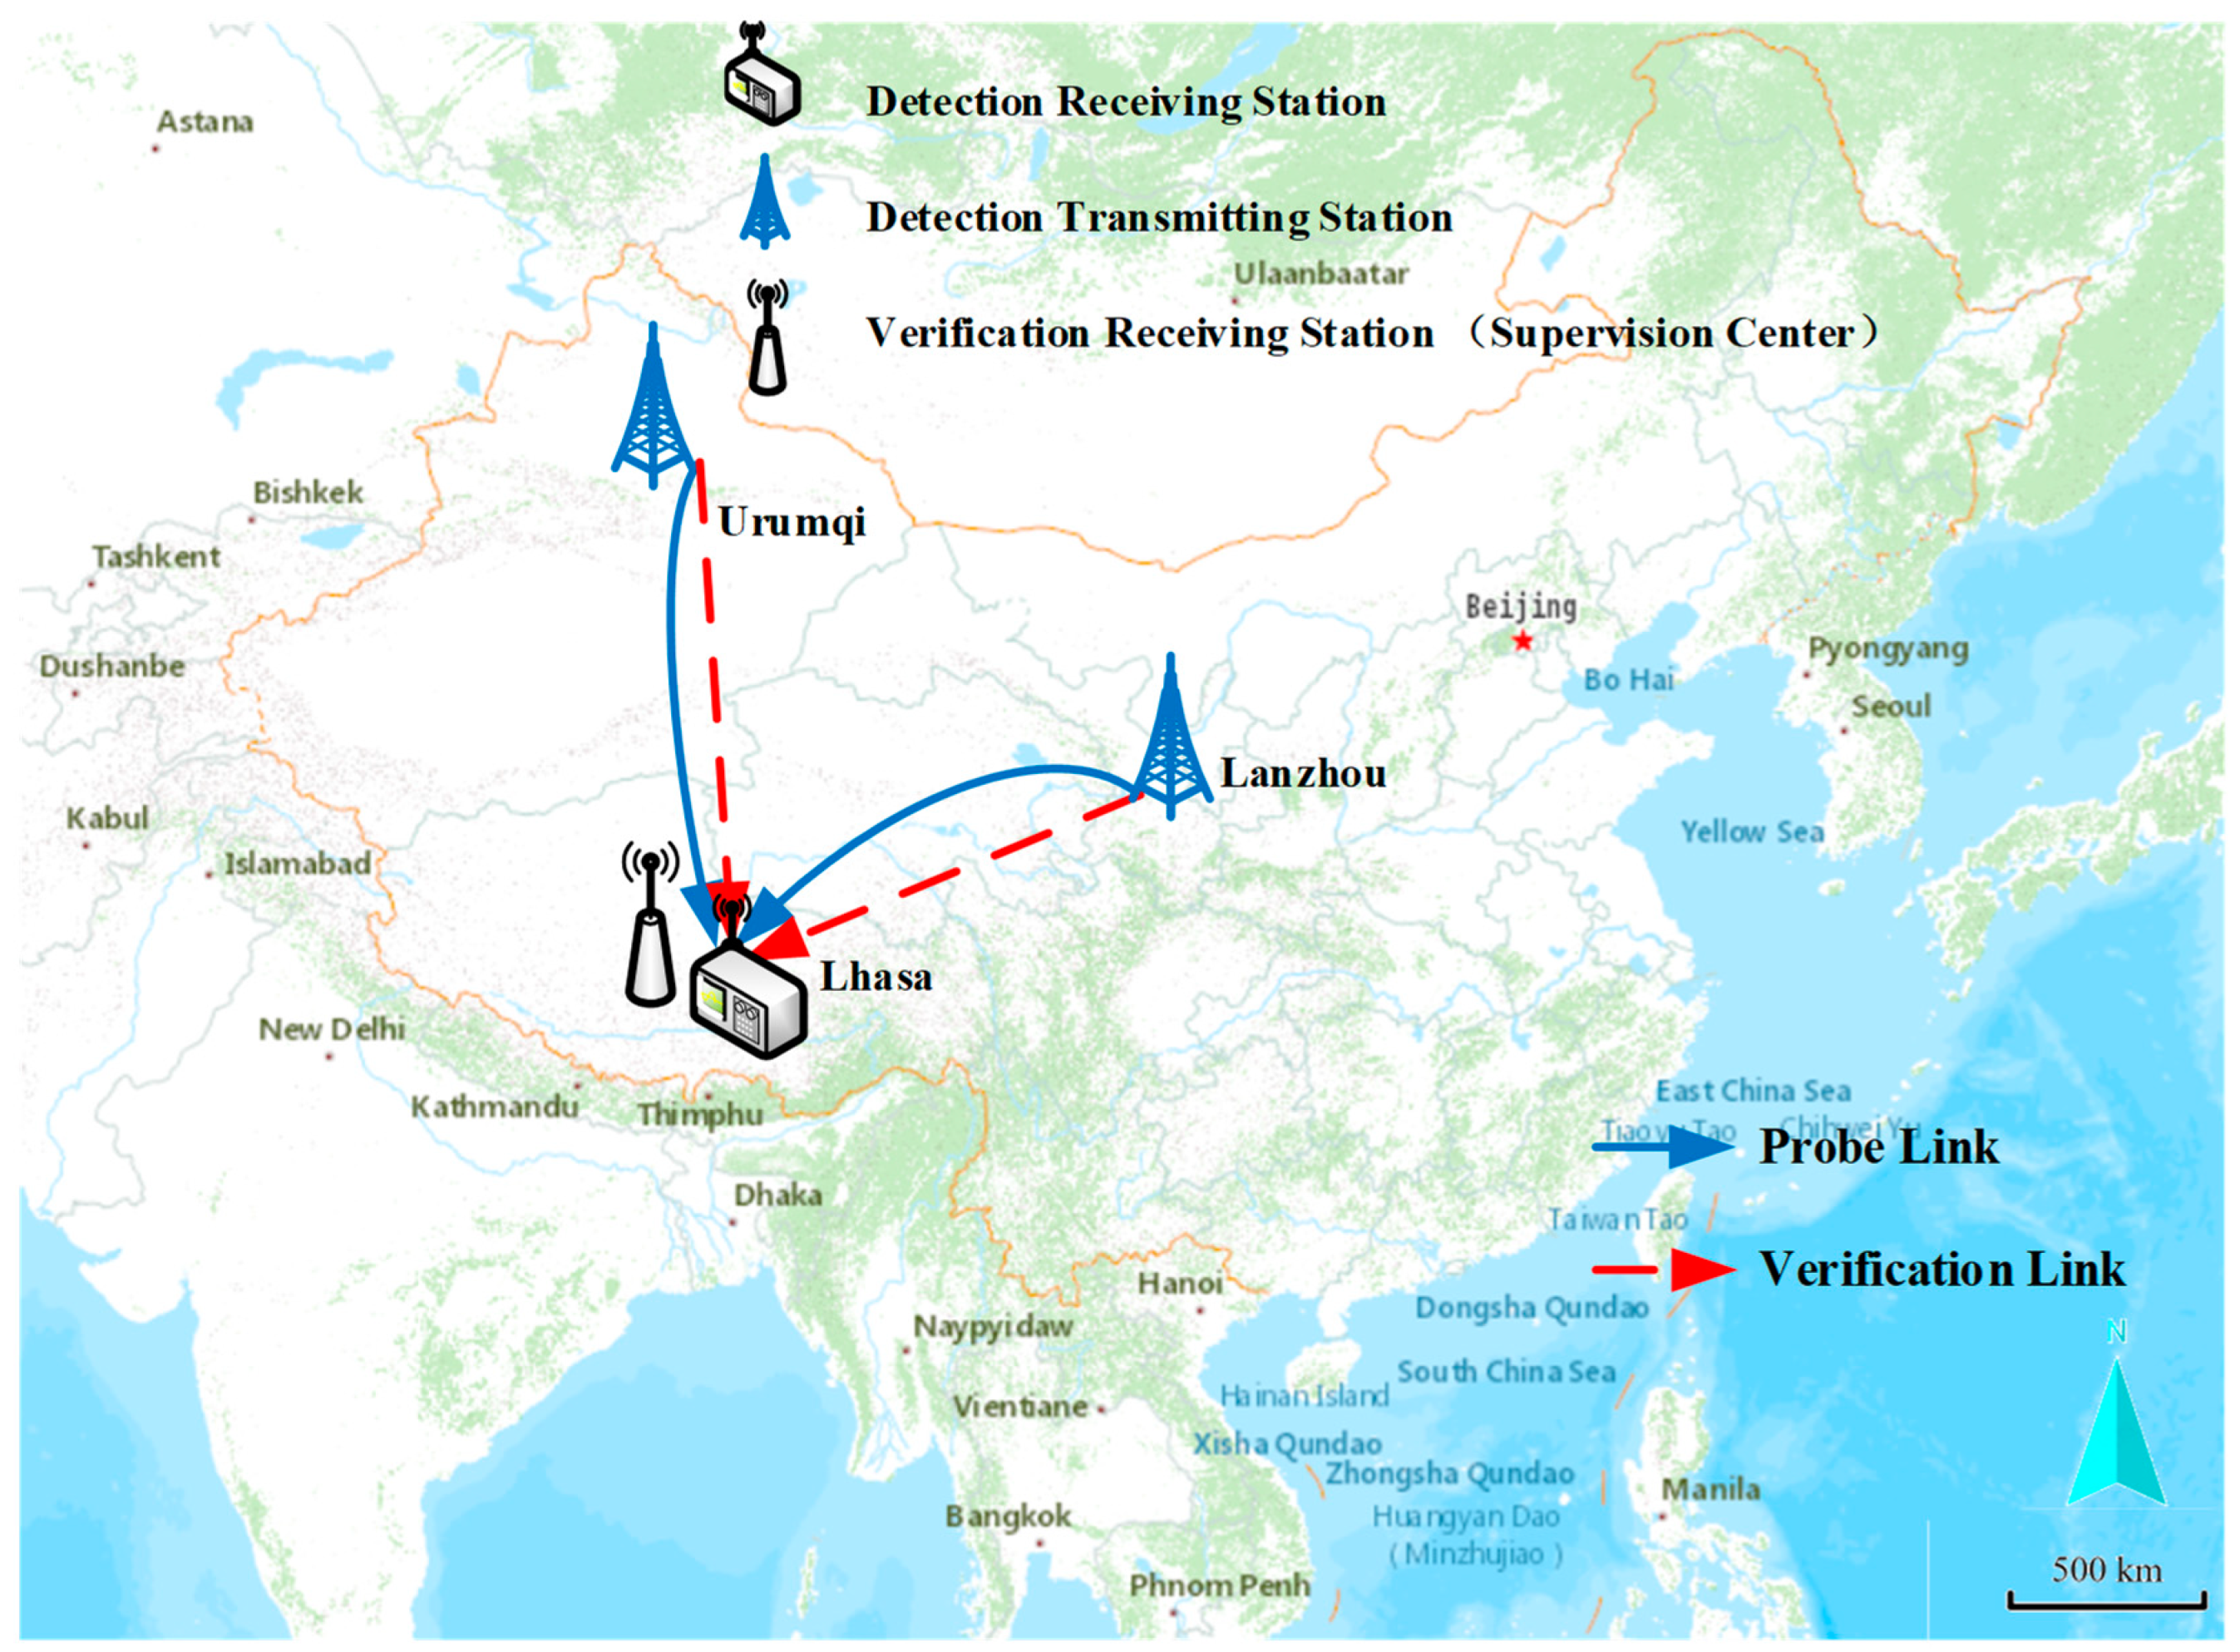
| 4 | Lhasa | Urumqi |
| 5 | Lhasa | Lanzhou |
| Serial Number | Test Links | Test Time | Volume of Valid Data |
|---|---|---|---|
| 1 | Lanzhou–Lhasa | 1 January 2019–12 December 2019 | 16,560 test data entries totally, with 9729 entries being valid |
| 2 | Urumqi–Lhasa | 1 January 2019–12 December 2019 | 16,560 test data entries totally, with 12,132 entries being valid |
| Serial Number | Month | RMSE (MHz) | δ | |
|---|---|---|---|---|
| REC533 | Improved Model | |||
| 1 | Jan. | 3.29 | 3.01 | 8.51 |
| 2 | Feb. | 1.60 | 0.39 | 75.63 |
| 3 | Mar. | 3.00 | 2.71 | 9.67 |
| 4 | Apr. | 2.65 | 2.51 | 5.28 |
| 5 | May | 1.71 | 0.69 | 59.65 |
| 6 | Jun. | 14.88 | 14.48 | 2.69 |
| 7 | Jul. | 2.26 | 1.67 | 26.11 |
| 8 | Aug. | 1.50 | 0.42 | 72.00 |
| 9 | Sep. | 2.08 | 0.65 | 68.75 |
| 10 | Oct. | 2.45 | 0.52 | 78.78 |
| 11 | Nov. | 2.49 | 0.78 | 68.67 |
| 12 | Dec. | 1.95 | 0.86 | 55.90 |
| Mean Value | 4.84 | 4.45 | 8.06 | |
| Serial Number | Month | RMSE (MHz) | δ | |
|---|---|---|---|---|
| REC533 | Improved Model | |||
| 1 | Jan. | 4.77 | 4.46 | 6.50 |
| 2 | Feb. | 2.55 | 1.39 | 45.49 |
| 3 | Mar. | 4.59 | 3.89 | 15.25 |
| 4 | Apr. | 3.93 | 3.66 | 6.87 |
| 5 | May | 4.17 | 2.67 | 35.97 |
| 6 | Jun. | 5.05 | 2.34 | 53.66 |
| 7 | Jul. | 3.95 | 3.40 | 13.92 |
| 8 | Aug. | 3.02 | 1.85 | 38.74 |
| 9 | Sep. | 2.33 | 1.80 | 22.75 |
| 10 | Oct. | 4.55 | 2.83 | 37.80 |
| 11 | Nov. | 6.34 | 5.26 | 17.03 |
| 12 | Dec. | 5.04 | 4.68 | 7.14 |
| Mean Value | 4.33 | 3.40 | 21.48 | |
Disclaimer/Publisher’s Note: The statements, opinions and data contained in all publications are solely those of the individual author(s) and contributor(s) and not of MDPI and/or the editor(s). MDPI and/or the editor(s) disclaim responsibility for any injury to people or property resulting from any ideas, methods, instructions or products referred to in the content. |
© 2024 by the authors. Licensee MDPI, Basel, Switzerland. This article is an open access article distributed under the terms and conditions of the Creative Commons Attribution (CC BY) license (https://creativecommons.org/licenses/by/4.0/).
Share and Cite
Ji, S.; He, G.; Yu, Q.; Shi, Y.; Hu, J.; Zhao, L. A Short-Term Forecasting Method for High-Frequency Broadcast MUF Based on LSTM. Atmosphere 2024, 15, 569. https://doi.org/10.3390/atmos15050569
Ji S, He G, Yu Q, Shi Y, Hu J, Zhao L. A Short-Term Forecasting Method for High-Frequency Broadcast MUF Based on LSTM. Atmosphere. 2024; 15(5):569. https://doi.org/10.3390/atmos15050569
Chicago/Turabian StyleJi, Shengyun, Guojin He, Qiao Yu, Yafei Shi, Jun Hu, and Lin Zhao. 2024. "A Short-Term Forecasting Method for High-Frequency Broadcast MUF Based on LSTM" Atmosphere 15, no. 5: 569. https://doi.org/10.3390/atmos15050569
APA StyleJi, S., He, G., Yu, Q., Shi, Y., Hu, J., & Zhao, L. (2024). A Short-Term Forecasting Method for High-Frequency Broadcast MUF Based on LSTM. Atmosphere, 15(5), 569. https://doi.org/10.3390/atmos15050569


