Article

An Index for Snowmelt-Induced Landslide Prediction for Zavoj Lake, Serbia

by
Rastko Marković
1,*,
Manfred Mudelsee
2,3,4,
Milica G. Radaković
5,
Aleksandar R. Radivojević
1,
Randall J. Schaetzl
6,
Biljana Basarin
5,
Jugoslav Nikolić
7,
Slobodan B. Marković
5,8,9,
Velibor Spalević
9,
Aleksandar Antić
5,10,
Miloš Marjanović
5 and
Tin Lukić
5,*
1
Department for Geography, Faculty of Sciences, University of Niš, Višegradska 33, 18000 Niš, Serbia
2
Climate Risk Analysis, Kreuzstrasse 27, 37581 Bad Gandersheim, Germany
3
Advanced Climate Risk Education gUG, Kreuzstrasse 27, 37581 Bad Gandersheim, Germany
4
Institute of Geosciences, University of Potsdam, Karl-Liebknecht-Str. 24-25, 14476 Potsdam, Germany
5
Department of Geography, Tourism and Hotel Management, Faculty of Sciences, University of Novi Sad, Trg Dositeja Obradovića 3, 21000 Novi Sad, Serbia
6
Department of Geography, Environment, and Spatial Sciences, Michigan State University, 673 Auditorium Drive, East Lansing, MI 48824, USA
7
Republic Hydrometeorological Service of Serbia, Kneza Višeslava 66, 11030 Belgrade, Serbia
8
Serbian Academy of Arts and Sciences, Knez Mihajlova 35, 11000 Belgrade, Serbia
9
Biotechnical Faculty, University of Montenegro, Mihaila Lalića 15, 81000 Podgorica, Montenegro
10
Institute of Geography and Sustainability, University of Lausanne, CH-1967 Sion, Switzerland
*
Authors to whom correspondence should be addressed.
Atmosphere 2024, 15(3), 256; https://doi.org/10.3390/atmos15030256
Submission received: 19 December 2023 / Revised: 9 February 2024 / Accepted: 17 February 2024 / Published: 21 February 2024
(This article belongs to the Section Biosphere/Hydrosphere/Land–Atmosphere Interactions)

Abstract

:
In February 1963, a huge landslide (ca. 1,950,000 m3) blocked the Visočica River and, thus, formed Zavoj Lake. The primary objective of this research was to investigate the importance of snowmelt in relation to landslide occurrence and to define the critical climatic conditions that may trigger massive winter landslides. We used monthly precipitation and average monthly maximum temperature data from meteorological and precipitation stations in the Visočica River basin (Dojkinci) and in the immediate proximity of Lake Zavoj (Pirot, Dimitrovgrad and Topli Do) as data inputs to the Snow-Melt Landslide (SML) index. It considers the summed monthly precipitation for previous months that continuously have an average maximum temperature below 0 °C. According to this method, the event at Zavoj Lake stands out among all other precipitation and snowmelt values for the past 72 years. After applying the SML index, all stations showed values of >300 mm for February 1963, which we consider as the threshold value for potential landslides appearance. In addition to meteorological data, we applied the SML index to data from the Coordinated Regional Downscaling Experiment (CORDEX) regional climate model outputs for the region from 2022 to 2100. As expected, climate change will have influenced the temperature values, especially during the winter. Conversely, the study area is experiencing drastic changes in land use caused by depopulation, leading to a reduced risk of winter landslides in the Visočica basin. We suggest that future climatic conditions in the area will make it more likely to experience extreme summer precipitation events, which might trigger large landslides. The SML method can be implemented for all landscapes that experience snowy winters, providing information in a timely manner so that local residents can react properly when the probability of landslide occurrence rises. The SML index, grounded in essential meteorological principles, provides a tailor-made, data-driven methodology applicable across varied geographical settings. Its utility extends to mitigating hydro-meteorological hazards on scales ranging from local to national scales, offering diverse and effective early warning solutions.

1. Introduction

A landslide is characterized by the swift movement of a mass of rock, residual soil, or adjacent sediments along a slope [1]. The primary triggers for landslide activation encompass fluctuations in underground water levels, changes in land use due to deforestation, heavy rainfall, prolonged periods of drought, snowmelt, inadequate drainage systems, unregulated surface water drainage, earthquakes, human activities, and more [2,3,4]. Among these factors, precipitation variability is of paramount importance, as its outcomes are largely responsible for soil erosion and, often, landslide events [5]. Thus, soil erosion can be regarded as a complex process influenced by the climatic regime, land cover, and landscape characteristics, which can be exacerbated by human activities. Landslides are prevalent in regions with intensive agricultural practices, as well as in areas affected by mining, construction, and extensive deforestation [6].
Economic losses due to landslides, in some places, are estimated at billions of US dollars. Besides financial damage, many landslides caused injury and death [7,8,9,10]. Hence, the prediction of landslide occurrence can be crucial in preventing major environmental and human consequences. Information, such as landslide susceptibility mapping [11], the formulation of various modeling techniques [12], and the use of indices [13,14], improves the chances of predicting landslides. The many papers that have dealt with this topic typically examine the relationship between climate, topographic, and pedological factors as triggering agents (e.g., [15,16]).
Effective planning involving soil conservation measures necessitates a deep understanding of the factors contributing to these hazardous events, such as sediment yield production [17] and landslides induced by snow melting. Contemporary research has primarily concentrated on examining the intricate interplay between various environmental factors, such as air temperature, humidity, wind, precipitation, and snowmelt and their impact on different economic sectors. For example, Habibi et al. (2021) [18] enhanced our understanding of the connections between the decreasing lake level within the Urmia Lake Basin and the evolving local drought conditions for the period 1981–2018. The authors employed the Standard Precipitation Index (SPI), the Standard Precipitation Evaporation Index (SPEI), and the Standardized Snow Melt and Rain Index (SMRI) to characterize environmental conditions in the catchment. Similarly, Yu et al. (2022) [19] assessed a predictive model for the suitability of ice–snow tourism under climate warming known as the Ice–Snow Tourism Suitability Index (ISTSI). This comprehensive index considered environmental factors such as air temperature, humidity, wind, and precipitation, along with subjective human initiatives. ISTSI effectively quantifies the comfort level of ice–snow tourism. Hultstrand et al. (2022) [20] estimated snow depths based on a winter season index for the West Glacier Lake watershed in Wyoming, US. The authors incorporated topographical, climatological, and winter season index inputs to gain insights into the quantity and distribution of snow, particularly for streamflow forecasting in mountainous regions. The prediction of snowmelt-induced landslides was calculated for Ottawa, Canada, by using the degree-day method. This method is based on multiplying the degree-day parameter (in units of mm per day and °C) with the mean daily temperature (°C), thus excluding days when the temperature was positive. The model’s validity was confirmed by historical landslide maps [21].
Several studies have analyzed landslides that were triggered by snowmelt [22,23,24,25]. Xian et al. (2022) [26] delved into the mechanisms governing deformation and failure processes leading to snowmelt-induced landslides in Yili, Xinjiang, China. The study revealed that the loess slope in question experienced two significant sliding failures, with varying degrees of pre-existing slope deformation observed between these failures. The early-stage formation and development of surface cracks on the slope were predominantly influenced by human grazing activities. The distinctive loess exhibited a strong sensitivity to water, contributing to the deterioration of soil strength in the slip zone. The research indicated that with the escalation of regional grazing activities and the heightened impact of global warming, the potential for resurgence of landslides is likely to increase. Gou et al. (2023) [27] examined the seasonal movement characteristics of the Cheyiping landslide in western Yunnan Province, China, using time-series InSAR technology. The authors observed a significant correlation between the movement of the landslide and seasonal rainfall. Water level changes in the Lancang River, attributed to the water storage of the hydropower station and seasonal rainfall, were identified as triggers for landslide deformation [27]. Another study from Japan [28] successfully produced a snowmelt-induced landslide susceptibility map by employing a probabilistic model based on multiple logistic regression analyses of data on hydraulic gradient, relief energy, and geology. In a recent study [29], the shallow landslides of Lombardy, Italy that occurred after snowfall events and rapid temperature increases were investigated. Applying the model to the Tartano basin in the Alps, the authors found that 26% of slopes exhibited unstable conditions; previous models that used only rainfall-based predictions suggested that only 19% of the slopes were unstable. Snowmelt water was also proposed as a trigger for the Ludoialm landslide in Tyrol, Austria as the groundwater levels increased [30].
The risk of soil erosion and landslides constitutes a major environmental concern in Southeastern Europe. Although predictions remain uncertain, changes in precipitation patterns stemming from future climate changes are anticipated for southeastern parts of Europe, including the Balkans [31,32]. The Western Balkans face a significant risk for increased erosion [33]. In certain regions, erosion has reached a critical, irreversible stage due to their limited soil cover. In areas with slow soil formation, any soil loss exceeding 1.0 t ha−1 yr−1 over 50–100 years is deemed irreversible [34]. Indeed, the tolerable soil erosion rate for southern Europe is ≈0.3 t ha−1 yr−1 [35].
Landslides in Serbia represent a significant environmental and economic problem [36,37,38]. In urban areas, many landslides are influenced by anthropogenic activities [36], but they can also be triggered by extreme climatic events [
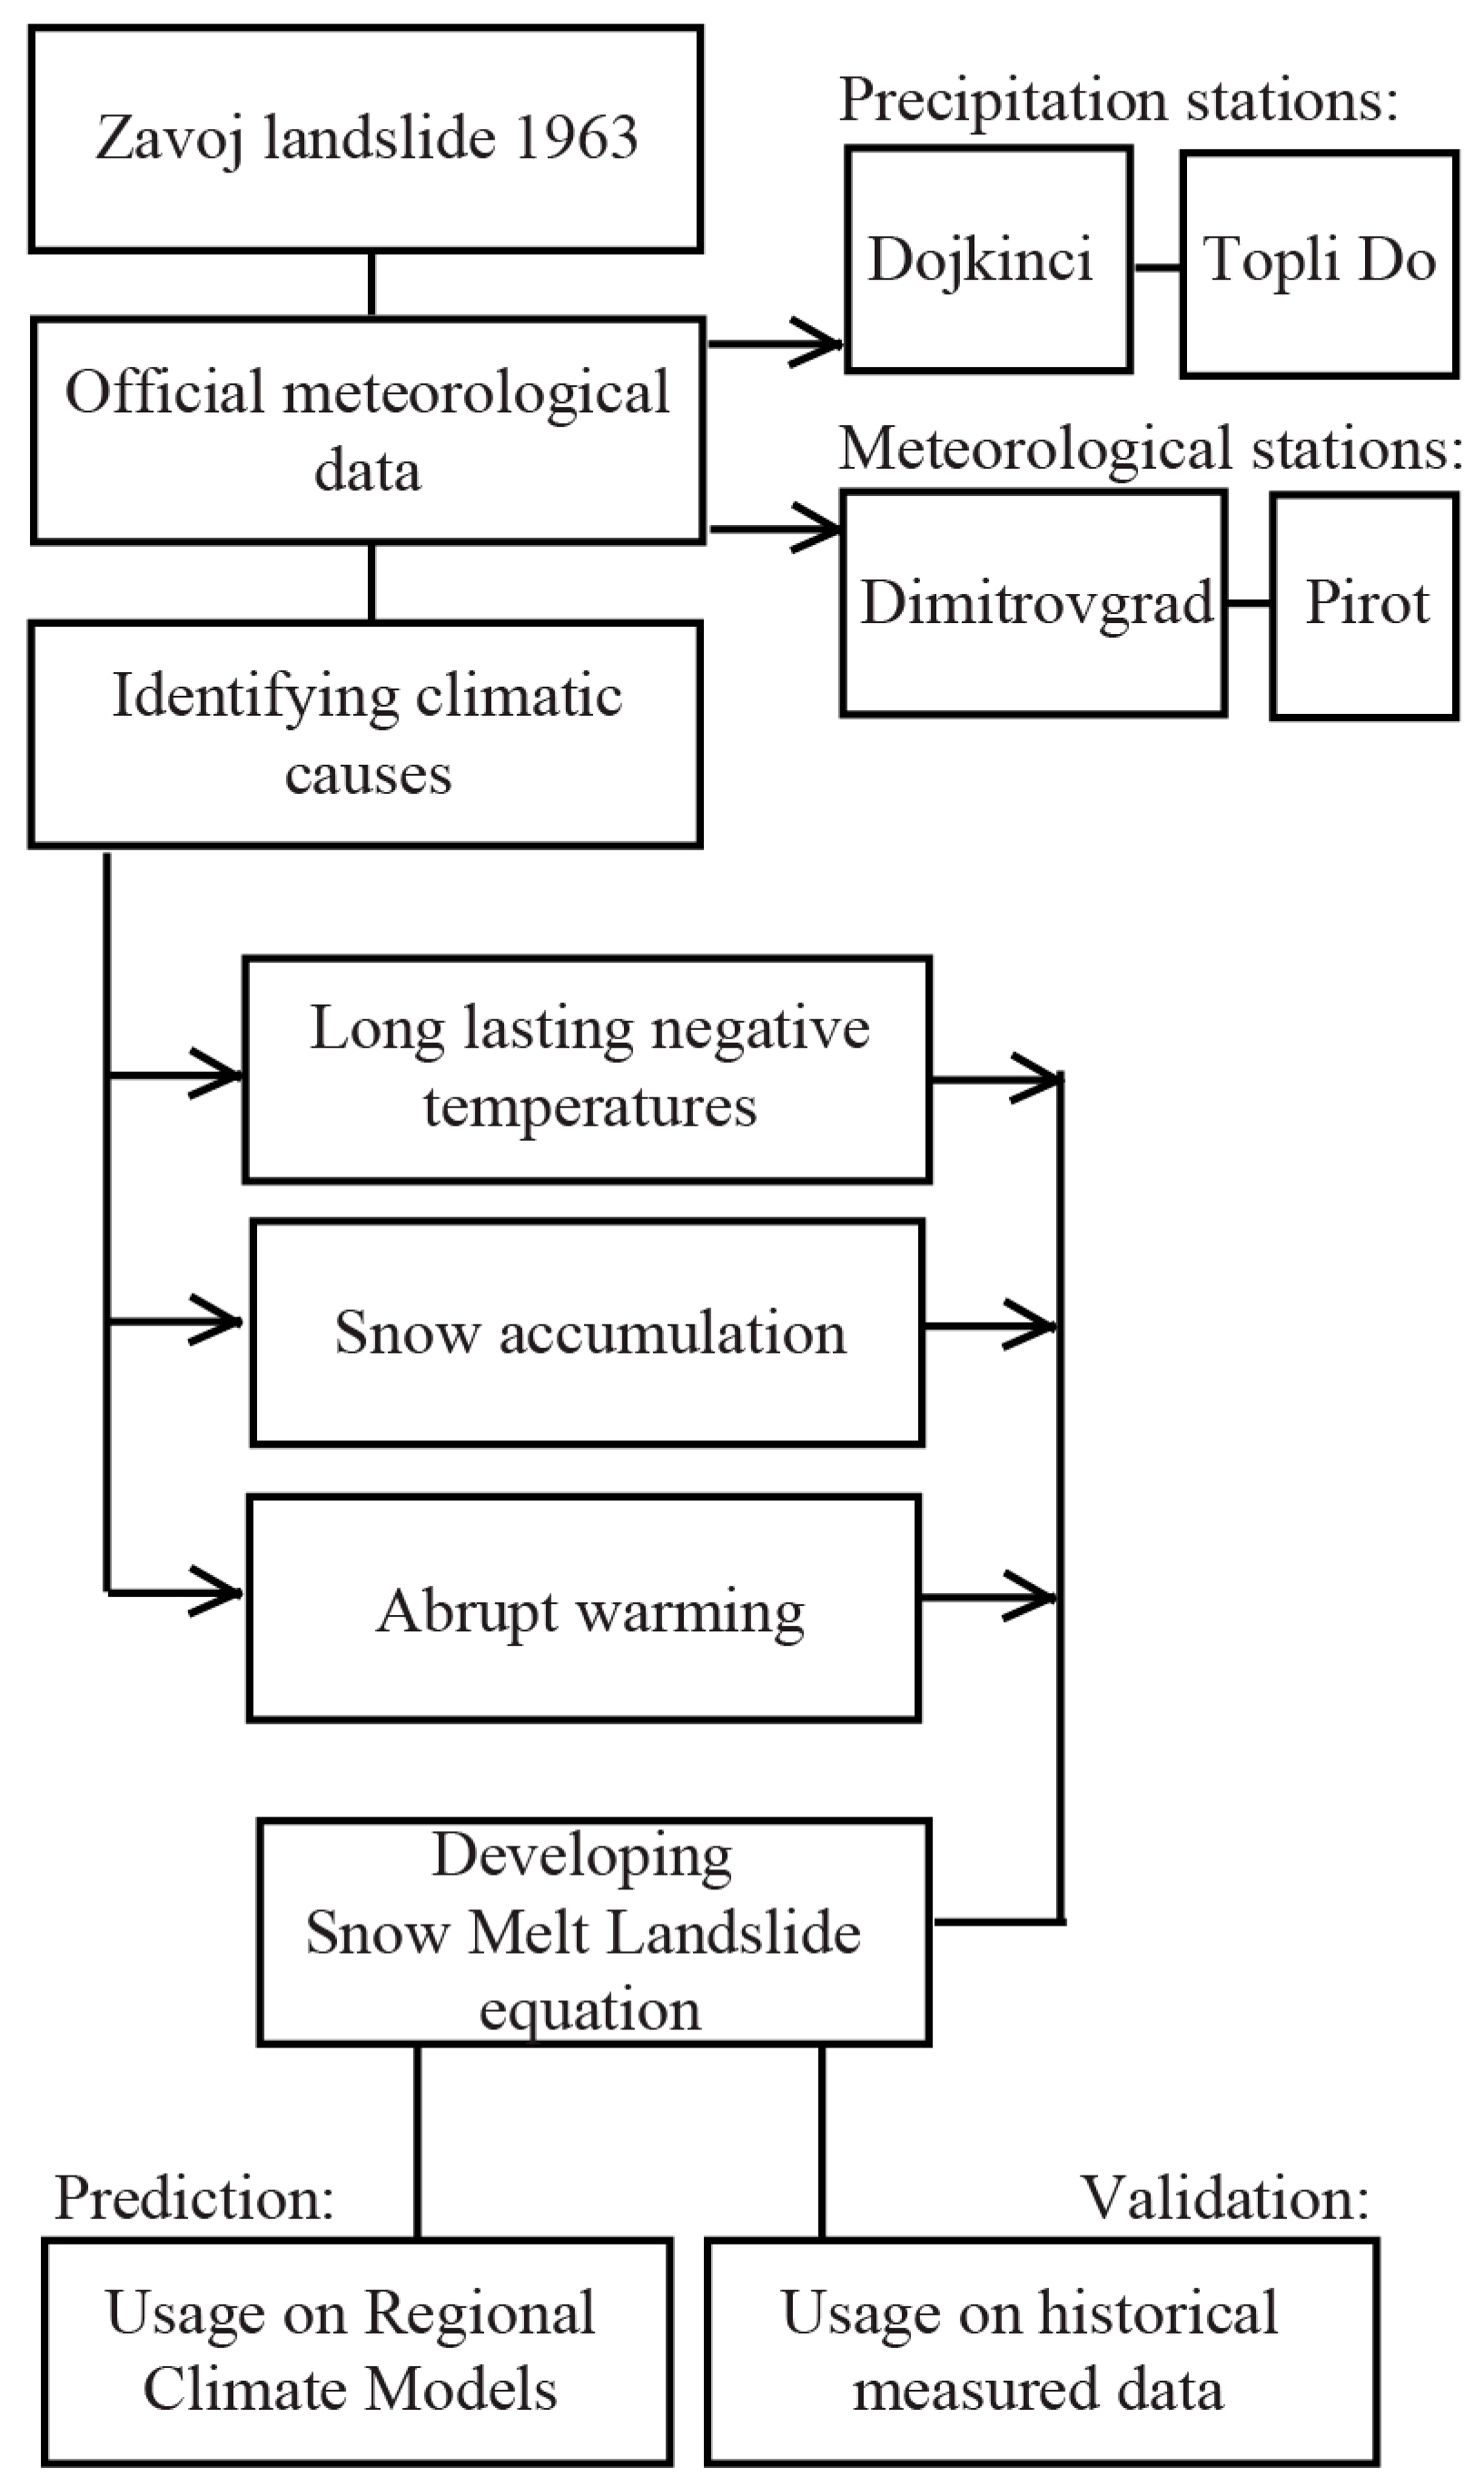
39]. In our study, we investigated one of the most catastrophic landslide events in recent Serbian history. This landslide occurred in February 1963 in the Visočica River valley in Southeastern Serbia. Previous authors indicated that the main factor responsible for this event was snowmelt [40,41]. However, there exists no detailed quantification of the climatic conditions responsible for the landslide. Therefore, the goal of this paper is to devise an indicator of landslide probability using the Snow-Melt Landslide (SML) index based on existing climatological data. The index can be calculated for most areas of the world, requiring only basic meteorological data (monthly precipitation and average monthly maximum temperatures). In addition to predicting winter landslides, the SML index helps define critical points in snow accumulation before catastrophic landslides occur.
Based on the assessment work by the Intergovernmental Panel on Climate Change (IPCC) and other publications [42,43], we are witnessing rapid changes in climate all over the world. These trends are expected to continue in the future and, thus, affect the landslide incidence around the globe [26]. In this study, we also implement the SML index, using data derived from regional climate prediction models from the CORDEX database (Copernicus Climate Change Service, Climate Data Store, 2019 [44]), thereby providing regional model projections up to the year 2100. In this way, the SML index data can be considered a prediction tool to alert us to critical future climate scenarios, thereby helping prevent some of the negative consequences of landslides.

2. Study Area

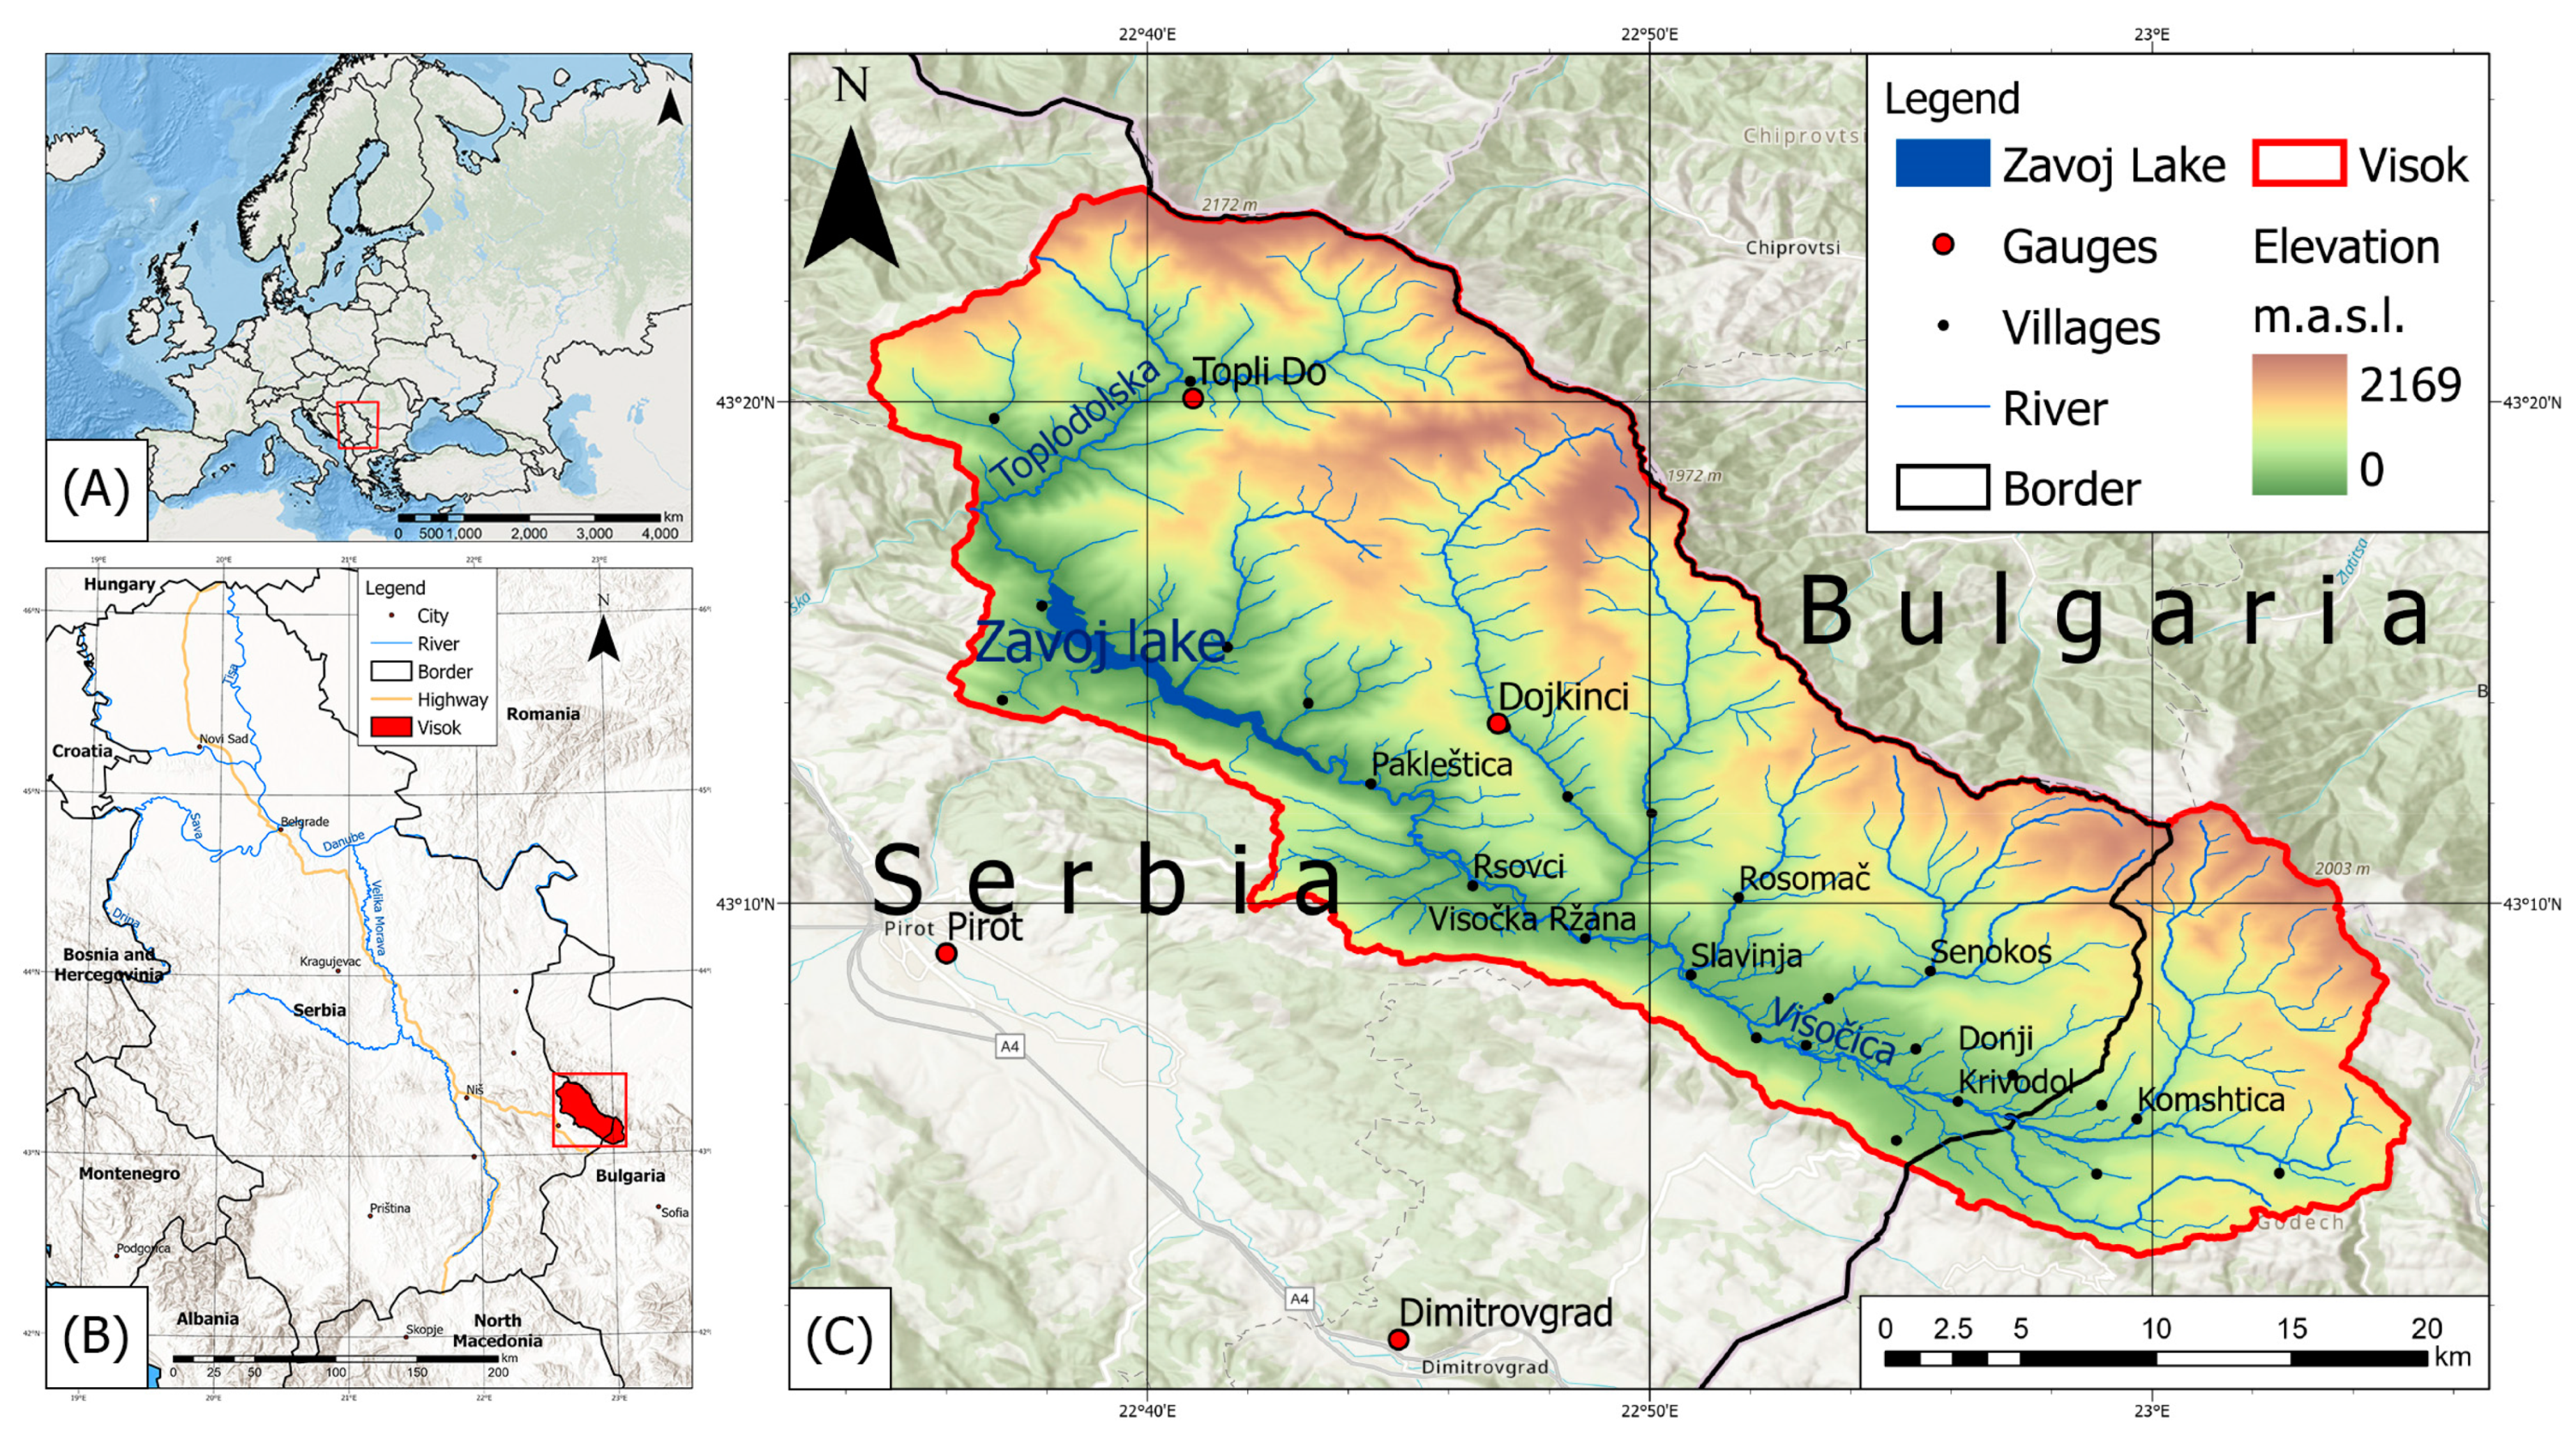
The Visočica and Toplodolska River basins in Serbia are also known as the Visok geographical region [45]. This area is one of the geomorphologically and hydrologically most interesting areas in Serbia. The Visok is located between Stara Planina and Vidlič Mountain in eastern Serbia, although the Visočica basin is also partially in Bulgaria (Figure 1). The Visočica River catchment exhibits significant asymmetry, with the Visočica River demarcating a substantially larger area of the slopes of Stara Planina (381.8 km2) and a comparatively smaller area on the slopes of Vidlič Mountain and in Bulgaria (178.1 km2). The Serbian part of the basin is located within the borders of the municipalities of Pirot and Dimitrovgrad. In the Visok microregion, there are 26 villages (22 in Serbia), all of which are losing population. No village has more than 100 inhabitants (Census, 2022 [46]).
The Stara Planina–Poreč geological unit, located in Eastern Serbia, is renowned for its Permian, Triassic, and Jurassic deposits, characterized by their unique paleontology and sedimentology. These deposits, predominantly on the southern Stara Planina Mountain, encompass marine sandstones and shallow marine ramp limestones. This geological phenomenon is set against the backdrop of the East Serbian Carpatho–Balkanides, a geological framework that constitutes a part of the Dacia megaunit [47]. According to Dimitrijević and Karamata (2003) [
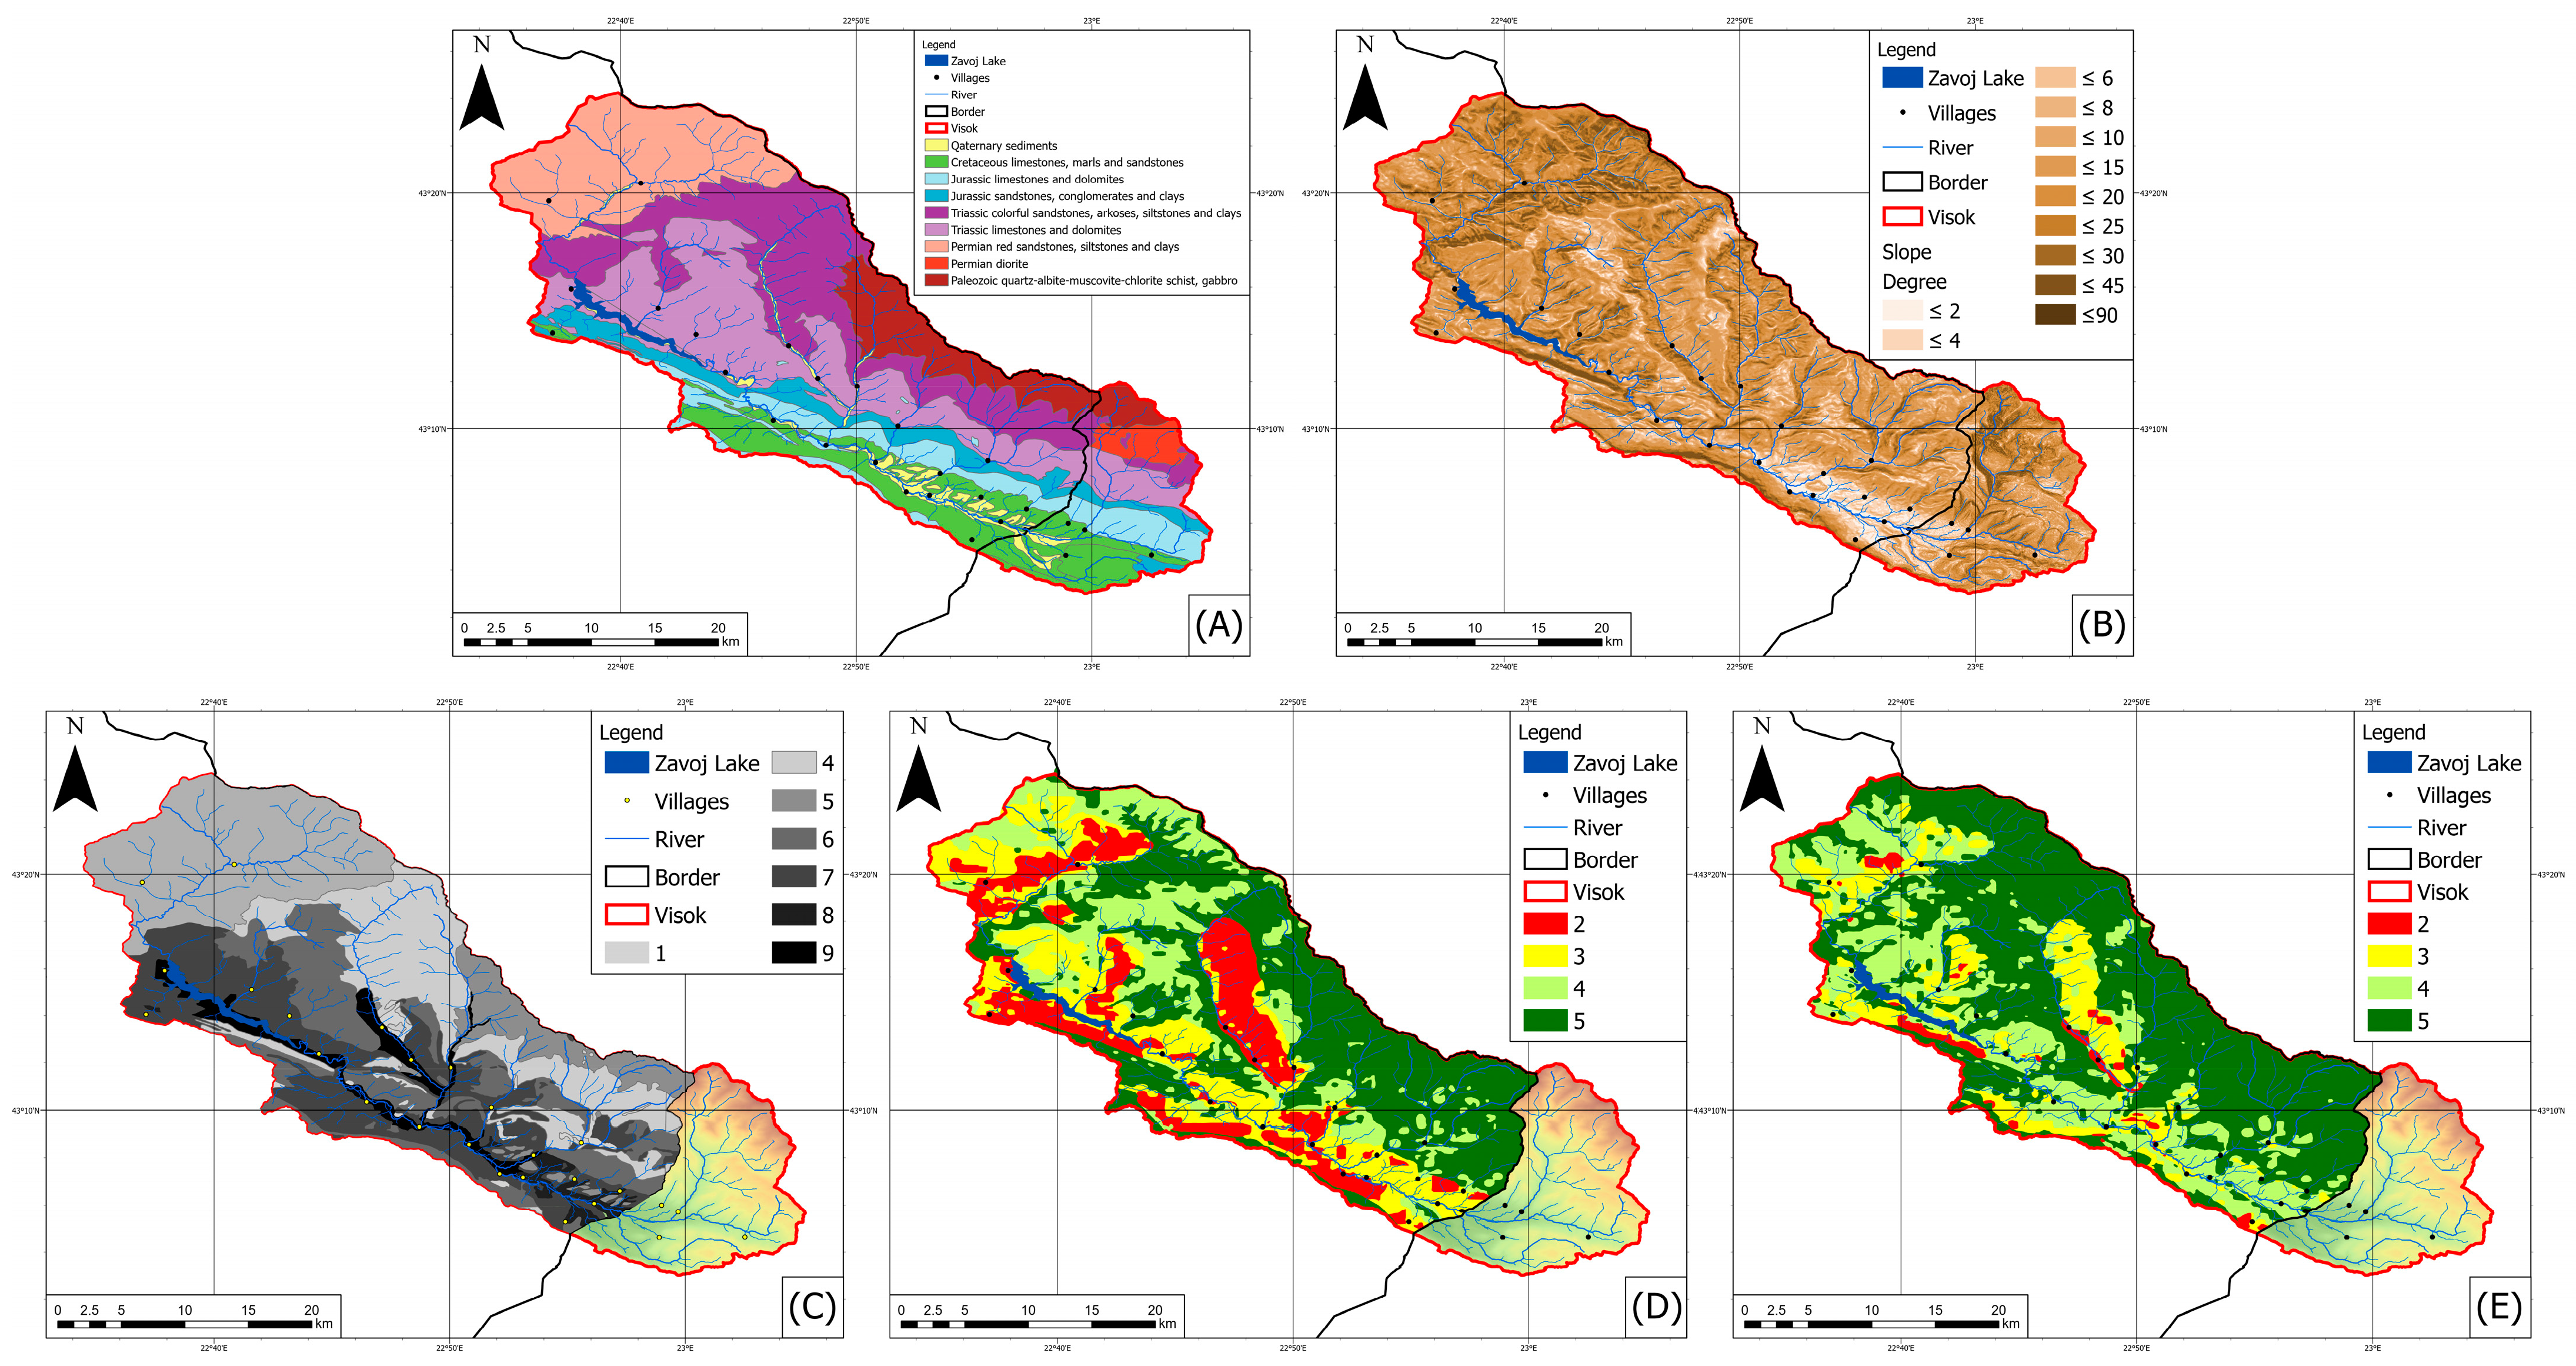
48] and as presented in Figure 2A, the bedrock geology of the basin above Zavoj Lake is primarily composed of Mesozoic-age rocks. Among the rock types, variegated sandstones and conglomerates prevail. Limestone and dolomitic limestone occupy significant portions of the Visok region, while siltstones and clays appear as layers in the Carboniferous rocks. The far northeastern part of the basin is characterized by Paleozoic-age shales with gabbro inclusions. Many of the rocks are regularly intermixed, often forming flysch. The geology of the Toplodolska River watershed is much more homogeneous than that of the Visočica River basin, characterized by Permian red sandstones with alternating silt and clay layers. Depending on location, the slope of the terrain changes, but in general, slopes of >10° dominate (Figure 2B). In the Visočica basin (Zavoj Lake), mostly red sandstones and limestone–dolomite have developed. The characteristic feature of all these soils is their shallow, sandy, skeletal nature, with low pH values and organic matter contents, typical of mountainous soils. Figure 2C illustrates the distribution of soils in the basin based on permeability. Given the mountainous nature of the terrain, the amount of forest cover in the basin is insufficient from the perspective of soil erosion protection (in such conditions, a forestation level above 50% is required). Additionally, it should be noted that a significant portion of the areas classified as forest consists of degraded forests and shrubs, which provide only minimal erosion protection (Figure 2D,E).
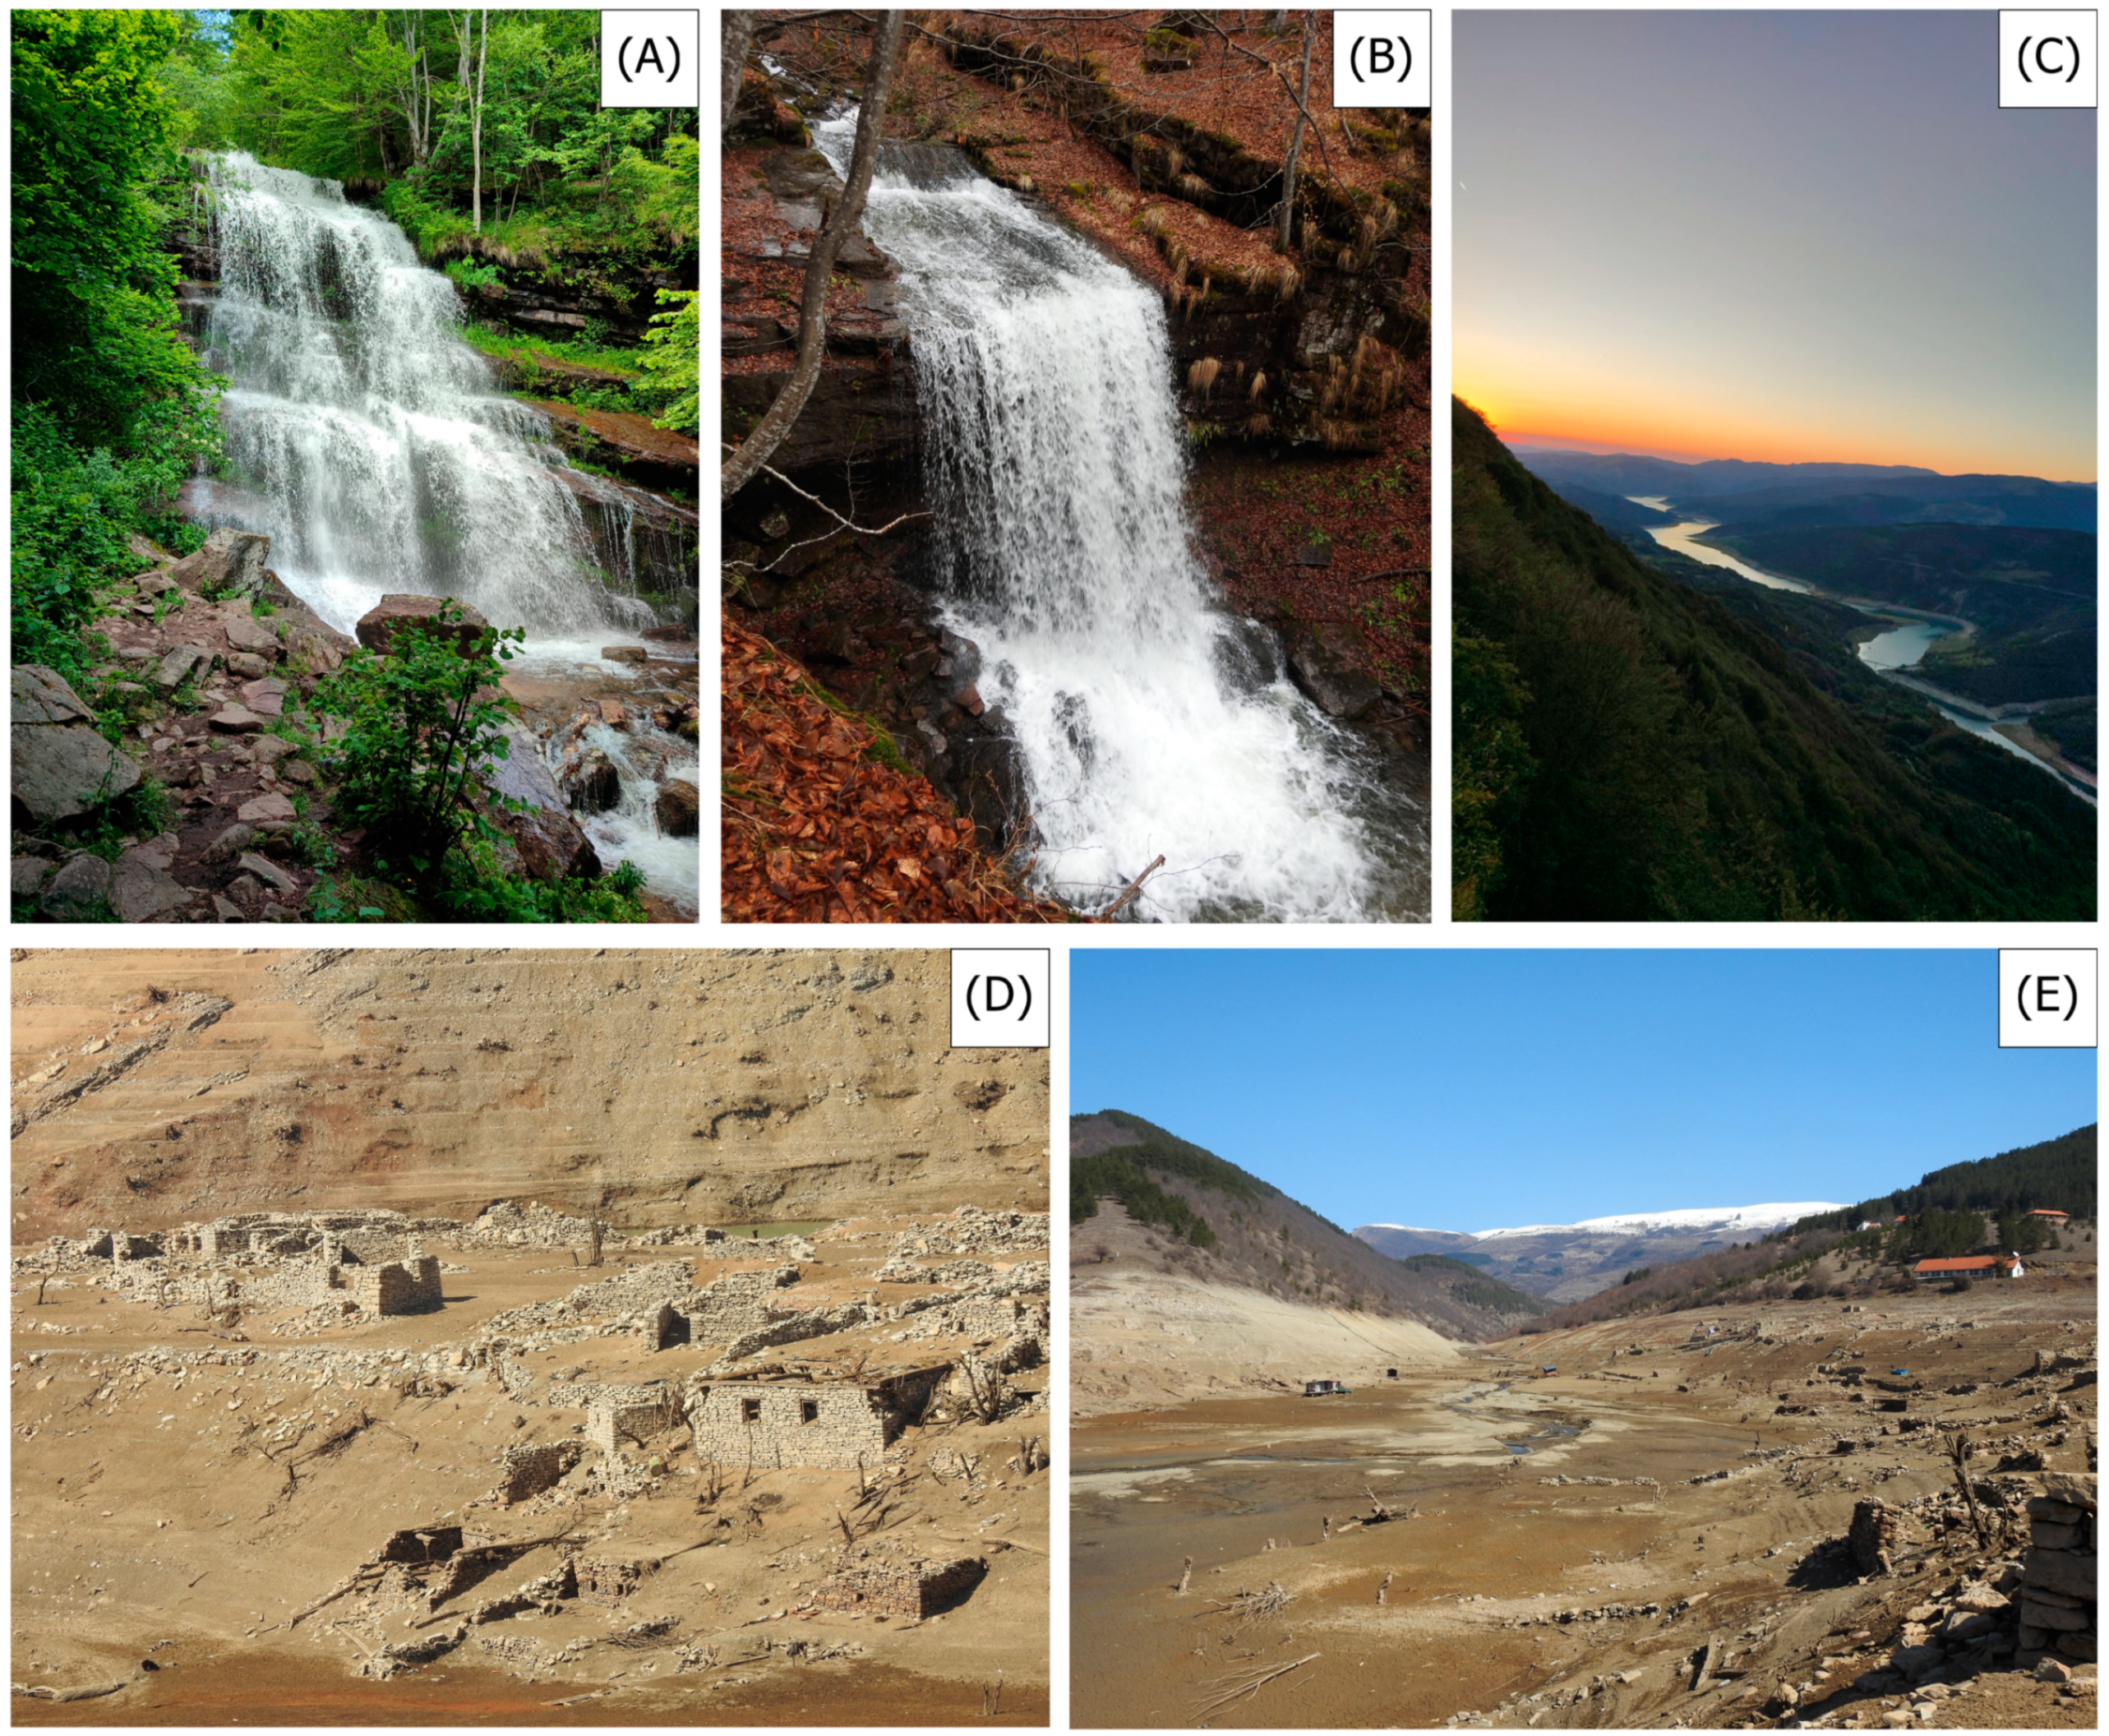
Evidence of intensive fluvial erosion on this landscape is indicated by >60 waterfalls in the Visok microregion (Figure 3A,B; [48]), not all of which have been described. Regardless of the enormous scientific and tourist potential, only a few papers have been published about this area [47,51,52,53].
The Lake Zavoj dam (22.64° E, 43.27° N), at 576 m.a.s.l., lies 18 km away from Pirot city, in the municipality of the same name. It received its name from the village Zavoj, which was completely submerged in the catastrophe that occurred in February, 1963, when it had roughly 1485 inhabitants (Census, 1961 [54]).
The case study for this paper is one of the largest landslides in Serbia’s modern history—the Zavoj Lake catastrophe of 25 February 1963. The landslide was triggered by saturated conditions caused by rapid snowmelt. The landslide was triggered at elevations between 790 and 960 m.a.s.l. The height difference from the landslide origin to the bottom of the Visočica bed was 426 m, with a horizontal distance of 1550 m. The slope of the terrain was as high as 17°. Regolith from the landslide blocked the Visočica River on 26 February, forming a rock–earth dam with a volume of 1,950,000 m3 and a width of 530 m. The height of the earthen dam was at maximum 140 m [40]. The speed of the landslide was 7 m/h. The total extent of the landslide measured 1.3 km in length, impacting an area spanning 240,000 m2 [41,55].
Due to the risk of dam failure, proactive measures were undertaken in 1964, when military authorities constructed a channel and initiated the controlled drainage of the reservoir. After the construction of the superimposed artificial dam, implemented in the year 1977, a consequence of this infrastructure development submerged two more villages: Velika Lukanja (Figure 3D) and Mala Lukanja. This artificial reservoir, established as a result, currently serves as a vital component in the operational framework of the Hydropower Plant “Pirot” [40]. The Zavoj accumulation, as of today, spans a length of 17 km, extending from the village of Gostuša to the site of the catastrophic event (Figure 3C). The lake serves as a reservoir for energy exploitation, and during this process, all water from the lake is occasionally utilized and remains of the villages Zavoj, Velika Lukanja, and Mala Lukanja can be seen [56]. Consequently, the submerged villages can be compared to the mythical villages of the “Serbian Atlantis” (Figure 3D,E). Furthermore, water extraction consistently occurs from the bottom of the lake, leading to a lower temperature in the Temštica River compared to its tributaries, the Toplodolska and Visočica Rivers. This temperature disparity impacts the stability of the ecosystem in the region.
The intensity of erosion in the Visočica watershed is currently being monitored with the aim of being better prepared for any future similar disasters. High erosion areas occur on the right side of the Visočica valley, upstream from the dam profile to the village of Rsovci. Land in the lower reaches of the Belska and Gostuška Rivers also have areas of medium and strong erosion [50,57]. Erosion in the Zavoj Lake basin has decreased in the last few decades, with the highest erosion occurring on the left bank of Visočica because of decreases in population and changes in land use [17,58].

3. Material and Methods

Climate data and data derived from regional climate models constitute the main inputs to our model. We first determined the weather conditions at the time of the landslide. Next, we examined modeled data on the future climate of this area (Figure 4).

3.1. Meteorological Stations

For this study, we used monthly precipitation data from four meteorological (Pirot, Dimitrovgrad) and precipitation (Topli Do and Dojkinci) stations and average monthly maximum temperature data from the two meteorological stations (Table S1 of Supplementary Material). Only the Dojkinci station is located in the Visočica River basin, but the other stations are in immediate proximity to Lake Zavoj (Figure 1). The data were obtained from the official statistics of the Republic Hydrometeorological Service of Serbia, using meteorological yearbooks from the year 1949 to 2021. The 32 years of data align with the standards set by the World Meteorological Organization (WMO).
Since all of these stations are relatively close to each other (Figure 1), we calculated Pearson’s correlation coefficient, r, with 95% calibrated bootstrap confidence intervals for precipitation and the average monthly maximum temperatures from all four stations (Table 1). This method is robust against the presence of (1) autocorrelation in the series and (2) non-normal distributions [59,60]. All seven combinations of monthly precipitation (P) and average monthly maximum temperatures (Tmax) showed very high Pearson’s r, 95% confidence interval for Tmax, and relatively high for P, indicating a strong correlation between the stations:
Because the Dimitrovgrad and Pirot meteorological stations are situated at significantly lower elevations than that of the basin, the meteorological data needed to be interpolated to align with their altitudes. The high correlation values gave us the confidence to interpolate the Tmax data to the average height of the basin. This number was obtained from open-source Digital Elevation Model (DEM) data with horizontal resolutions from 1 arc-second (30 m) (SRTM) to 12.5 m (ALOS PALSAR RT1) [61,62]. Observations indicated that ALOS-PALSAR images with optimal baseline parameters produced a high-resolution DEM with enhanced height accuracy. Subsequently, the validated DEM was employed for topographic correction of ALOS-PALSAR images within the same region, resulting in superior outcomes compared with those achieved with ASTER and SRTM-DEM [61]. The program used for this analysis was ArcGIS Pro 2.5.0. The DEM was used to define percentages of land area along every 100 m step, except for the lowest area, which is defined as between 588 and 600 m.a.s.l., and the highest (between 2000 and 2003 m.a.s.l.). The average height of the investigated area then was calculated to be ~1146.47 m.a.s.l. Thus, height correlations to the hypsometric center of the basin could be performed. Topli Do had an active meteorological station but lacked continuous measurements from 1954 to 1985. For this reason, Tmax data for Topli Do are not presented and cannot be used for the calculation of the SML index. However, its data were used to calculate the temperature gradient. The difference between the average temperature of Dimitrovgrad and Topli Do is ~1.073 °C. The Topli Do station is located 250 m higher than the Dimitrovgrad station; therefore, the temperature gradient between these two stations is ~0.43 °C per 100 m altitude. The same calculation yielded a temperature gradient between Topli Do and Pirot station of ~0.57 °C per 100 m altitude.
The SML index was developed to determine the likely conditions for landslide activation in the Visočica basin by providing a threshold number. Before constructing this index, we considered historical data from the years 1962 and 1963. For three months prior to the Zavoj Lake formation, temperatures at the level of the landslide were <0 °C, allowing the accumulation of precipitations in the form of snow. Temperatures increased in the February of 1963, which triggered the snowmelt and the landslide. Equation (1), used for the calculation of the SML index, is as follows:
P(SML)n+2 = Pn+2 if (Tmaxn+2 > 0) + (Pn+1 if (Tmaxn+2 > 0) and (Tmaxn+1 < 0)) + (Pn if (Tmaxn+2 > 0) and (Tmaxn+1 < 0) and (Tmaxn < 0)),
where P is total monthly precipitation (units: mm), Tmax is the average monthly maximum temperature (units: °C), and n is the number of months.
The mathematical explanation of the formula is as follows. Let n + 2 denote the current month for which the SML index (denoted by P(SML)n+2) is to be calculated. If the current maximum temperature (Tmaxn+2) is positive, then the current precipitation (Pn+2) contributes to the index. If, additionally, the maximum temperature in the preceding month (Tmaxn+1) is negative (i.e., no melting occurred), then the precipitation in the preceding month (Pn+1) also contributes to the index (i.e., is added). Finally, if, additionally, the maximum temperature in the penultimate month (Tmaxn) is negative, then the precipitation in the penultimate month (Pn) also contributes to the index.
This formula used data from the above-mentioned meteorological and precipitation stations (Figure 4), for which we imposed the magnitude classification theme of Table 2. On all graphs, this threshold represents February of 1963. Table 2 shows the proposed classification of the SML index values, which were obtained by observing the historical data from meteorological stations and based on the SML value from February 1963 when the landslide occurred.

3.2. Regional Climate Models

Global Climate Models (GCMs) provide projections of potential future changes in climate. The consequences of this changing climate and the required adaptation strategies tend to manifest on regional and national scales. To address this issue, regional climate models (RCMs) and Empirical Statistical Downscaling (ESD), applied to specific areas and driven by GCMs, can provide information for smaller areas. The downscaled data supports more detailed assessments and planning for impacts and adaptation, especially crucial in vulnerable regions. Therefore, Regional Climate Downscaling (RCD) data play a vital role in this context, offering projections with greater detail and more accurate representations of localized extreme events [63]. To determine how likely such events would occur in the future, we used data from regional climate models (RCMs). Several RCMs were analyzed (for the model output grid centers, see Table 3), both with and without corrected bias (Table 4 and Table 5). The choice of the bias-corrected RCMs was based on a previous assessment by McSweeney et al. (2015) [64] of RCMs in the European area. In their summary of CMIP5 model performance, the CNRM-CM5, HadGEM2-ES, MPI-ESM-LR, and MPI-ESM-ES models were viewed as “satisfactory” for the region. Representative Concentration Pathways (RCP) 2.6, 4.5, and 8.5 were considered for the bias-corrected models but only RCP 8.5 for non-bias-corrected models. The temporal resolution is monthly, and the selected variables were the maximum 2 m temperature for the last 24 h, as well as the mean precipitation flux. The horizontal resolution is 0.11 degrees, meaning that estimates for the 12 coordinates in the Visočica catchment were derived for the following RCM grid (Table 3).
Next, the ensemble mean value for the entire basin was calculated as the average value from these coordinates. The SML, as defined in Equation (1), incorporates precipitation amounts from the preceding two months. Prior to opting for the inclusion of only two consecutive months with negative temperatures in Equation (1), we also experimented with one and three months. However, when employing these alternative approaches, the 1963 landslide catastrophe did not manifest as prominently as it did when using data for two months (Equation (1)).

4. Results

4.1. Historical Data

The presentation of results for the historical measurement period focuses on the Dimitrovgrad station because the Pirot station exhibits a considerable number (17) of missing values. Figure 5 shows the average monthly temperature (Tavg), average maximum monthly temperature (Tmax), precipitation (P), and the constructed SML index series for Dimitrovgrad from January 1949 to December 2021.
The SML index was applied to Topli Do and Dojkinci precipitation data, as well as to historical data on average monthly maximum temperatures from Dimitrovgrad, as interpolated to the mean elevation of the basin. All graphs clearly indicate that February 1963 had the most precipitation and snowmelt (combined into the SML index) over the investigated period. Based on Topli Do data, during February 1963, precipitation and snowmelt totaled ≈399 mm of water. No other peaks above 300 mm occurred during the study period, although there are six values of >250 mm. Based on data from the Dojkinci gauge, the precipitation event peak at Zavoj is represented with SML = 416.3 mm. The second SML peak exceeds 300 mm, and there are three more peaks greater than 250 mm (Figure 6). The observed event exceeds a threshold value of SML = 300 mm in all cases, and for this reason, the critical value for the landslide appears to be 300 mm. The Zavoj Lake event peak is at least ≈20% higher than all the other values in all three cases.
Because the SML index also includes snowmelt, it is important to analyze regular summer and winter monthly precipitation values as well. The summer months in hydrology are from May to October, while the winter months are from November to April. As an archive with no missing values, we analyzed Dimitrovgrad station data. Based on these data, the summer months average more precipitation (59.6 mm) than the winter months (48 mm) (Table 6). Also, the maximum monthly summer precipitation totals are higher on average (165.9 mm) than during the winter months (148.4 mm). Interestingly, the highest value during the investigated period appeared in January (Table 6).
We also examined maximum daily precipitation totals by month, as it may be a proxy for summer landslide appearance. When it comes to maximum values for maximum daily precipitation per month, summer months (73.98 mm) are larger than winter months (51.1 mm). July had one extreme precipitation value of 123.3 mm (Table 7).
These data show that if the SML index is not taken into account, summers will be more likely to have landslides. However, when the SML index is implemented, it becomes evident that the three highest peaks occur in the winter months (Figure 7).
For all the variables (Tmax, Tavg, and P), the slope is significantly positive. Tmax increases nearly three times as much as Tavg (0.0305 versus 0.0125; see Table 8). Precipitation (P) increases significantly as well (Figure 5).

4.2. CORDEX Climate Model Data

In Figure 8, historical data are presented on the left, while bias-corrected CORDEX climate model data are shown on the right. Among the seven models, all run until the year 2100, only three values exceed an SML value of 300 mm.
Initially, non-bias-corrected CORDEX climate model data were downloaded, but values included precipitation values larger than 700 mm in one summer month for one grid. Due to this, we present this data with caution. When the average values for the Visočica basin are calculated, the results look more representative. Figure 8 shows SML values applied to historical and RMC data (both bias and non-bias-corrected). Given that the threshold for landslide occurrence is set to SML = 300 mm, three such peaks indicating potential events are evident in the model output data (Figure 8).

5. Discussion and Concluding Remarks

Fine-scale meteorological data, particularly pertaining to air temperature and precipitation, are imperative for comprehending and forecasting climate-induced effects on landscape structure and function. Nevertheless, the spatial resolution of climate reanalysis data, as well as outputs from climate models, frequently prove inadequate for investigations conducted at local or landscape scales [
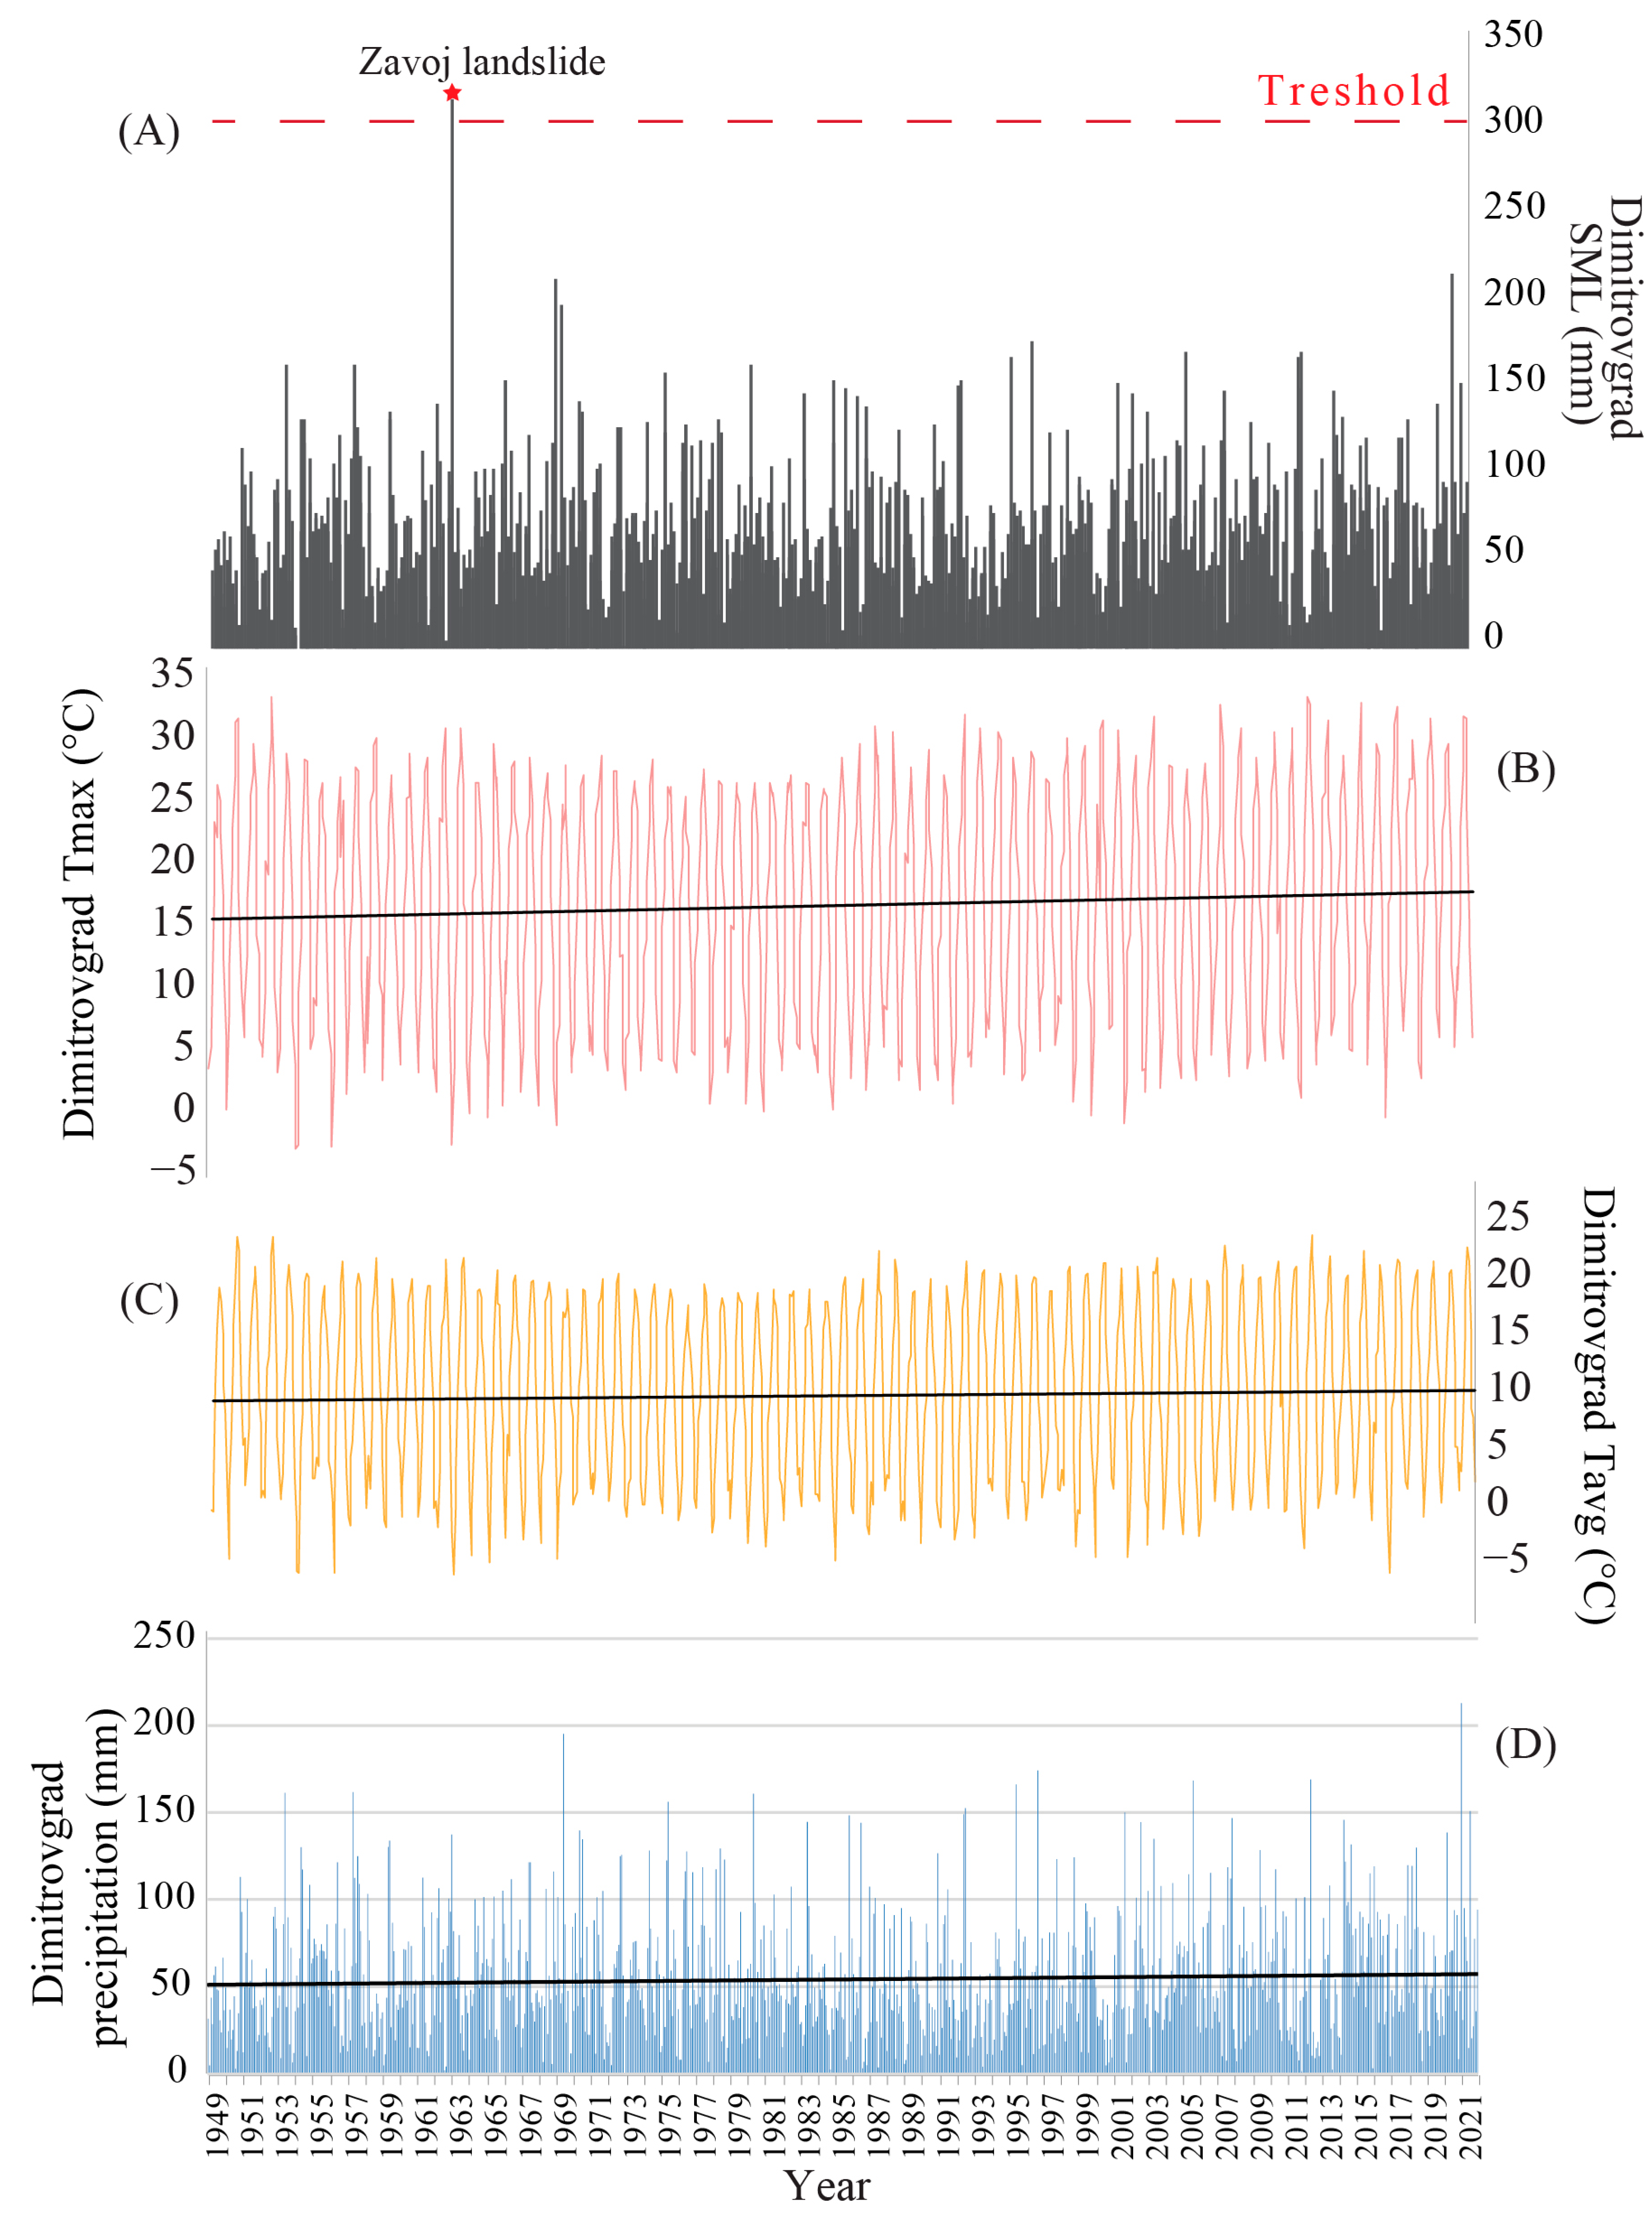
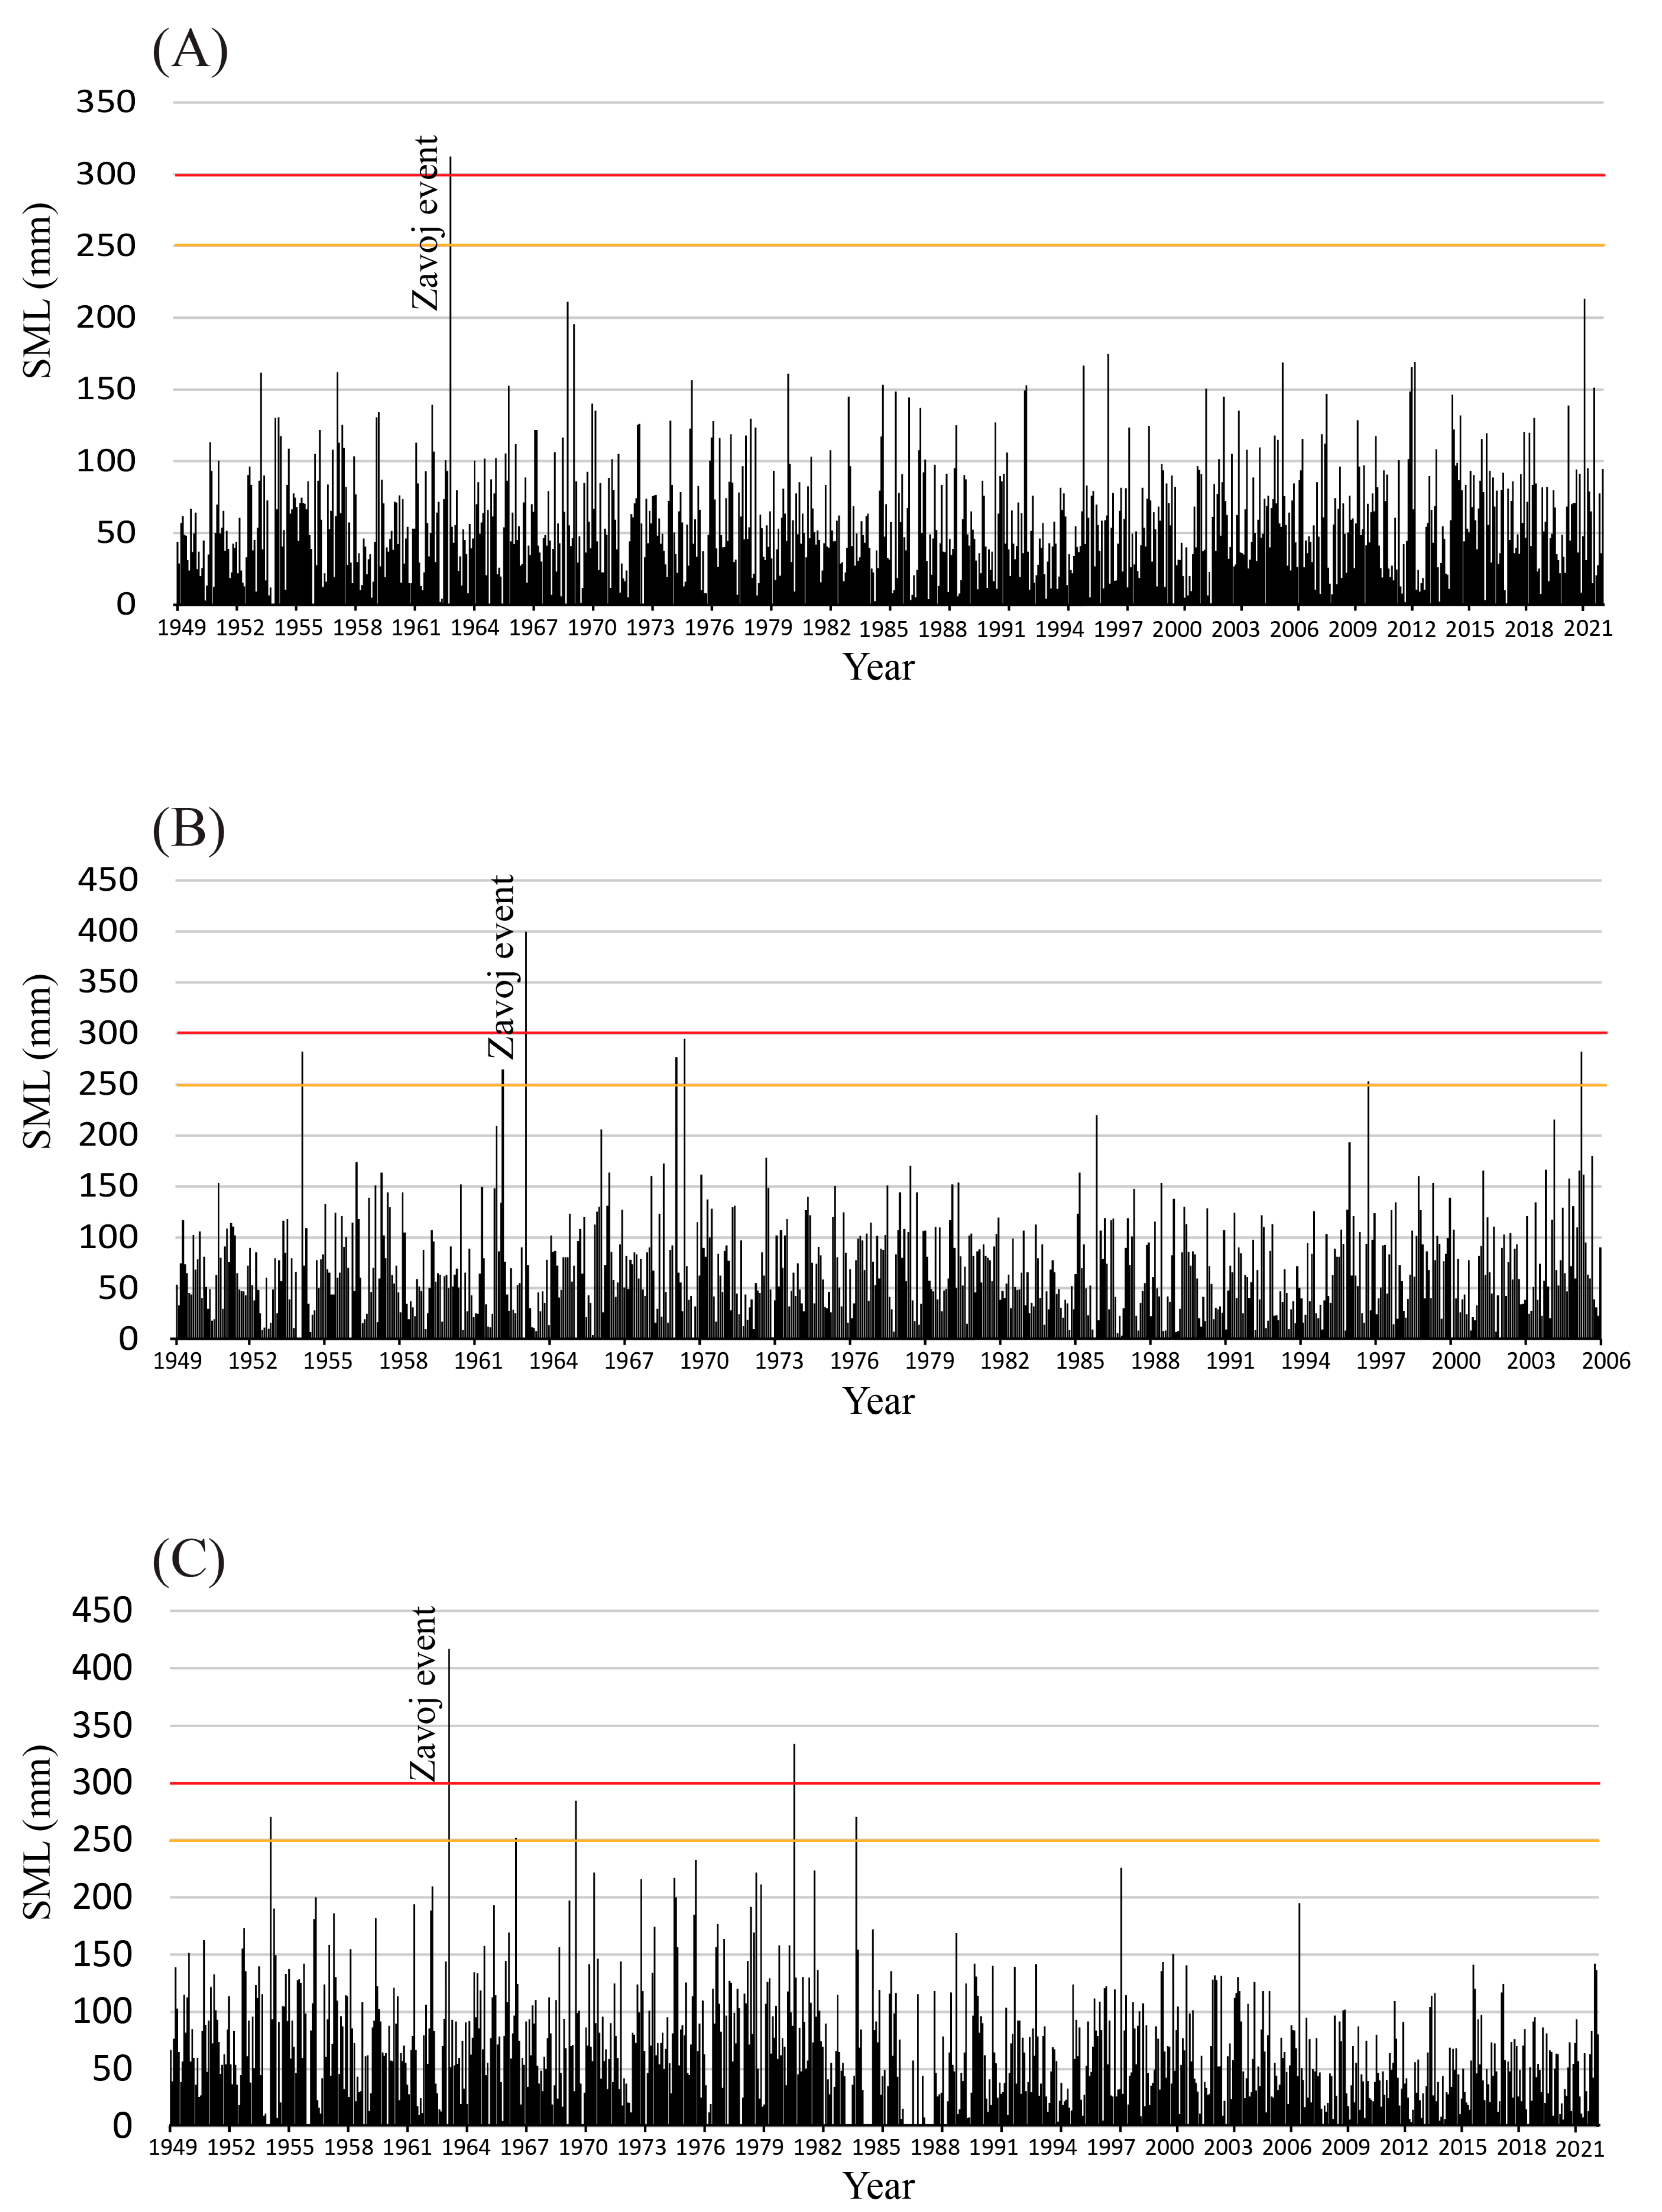
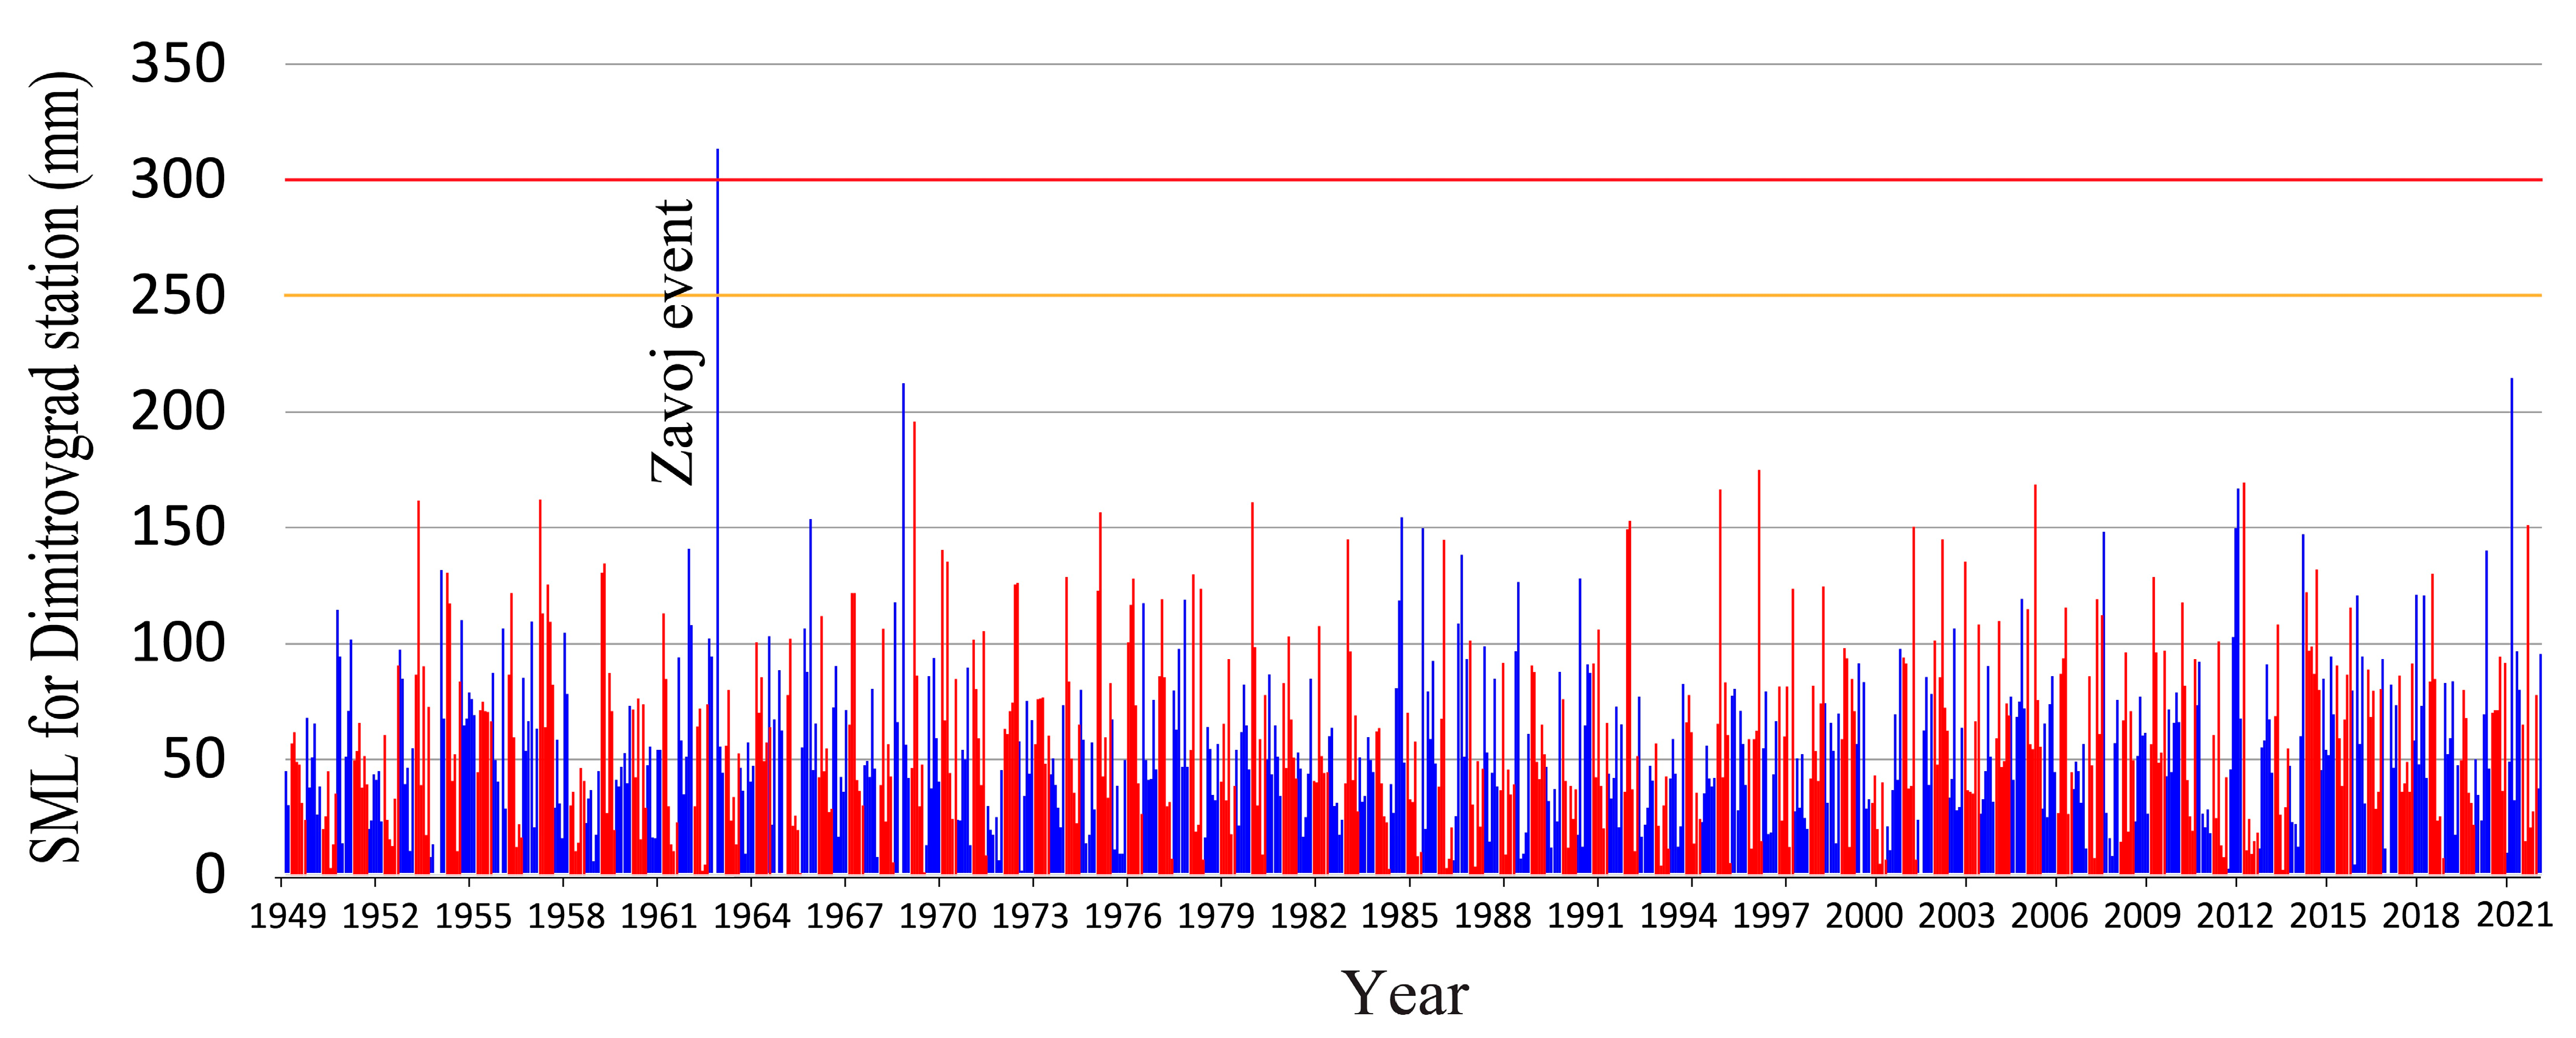
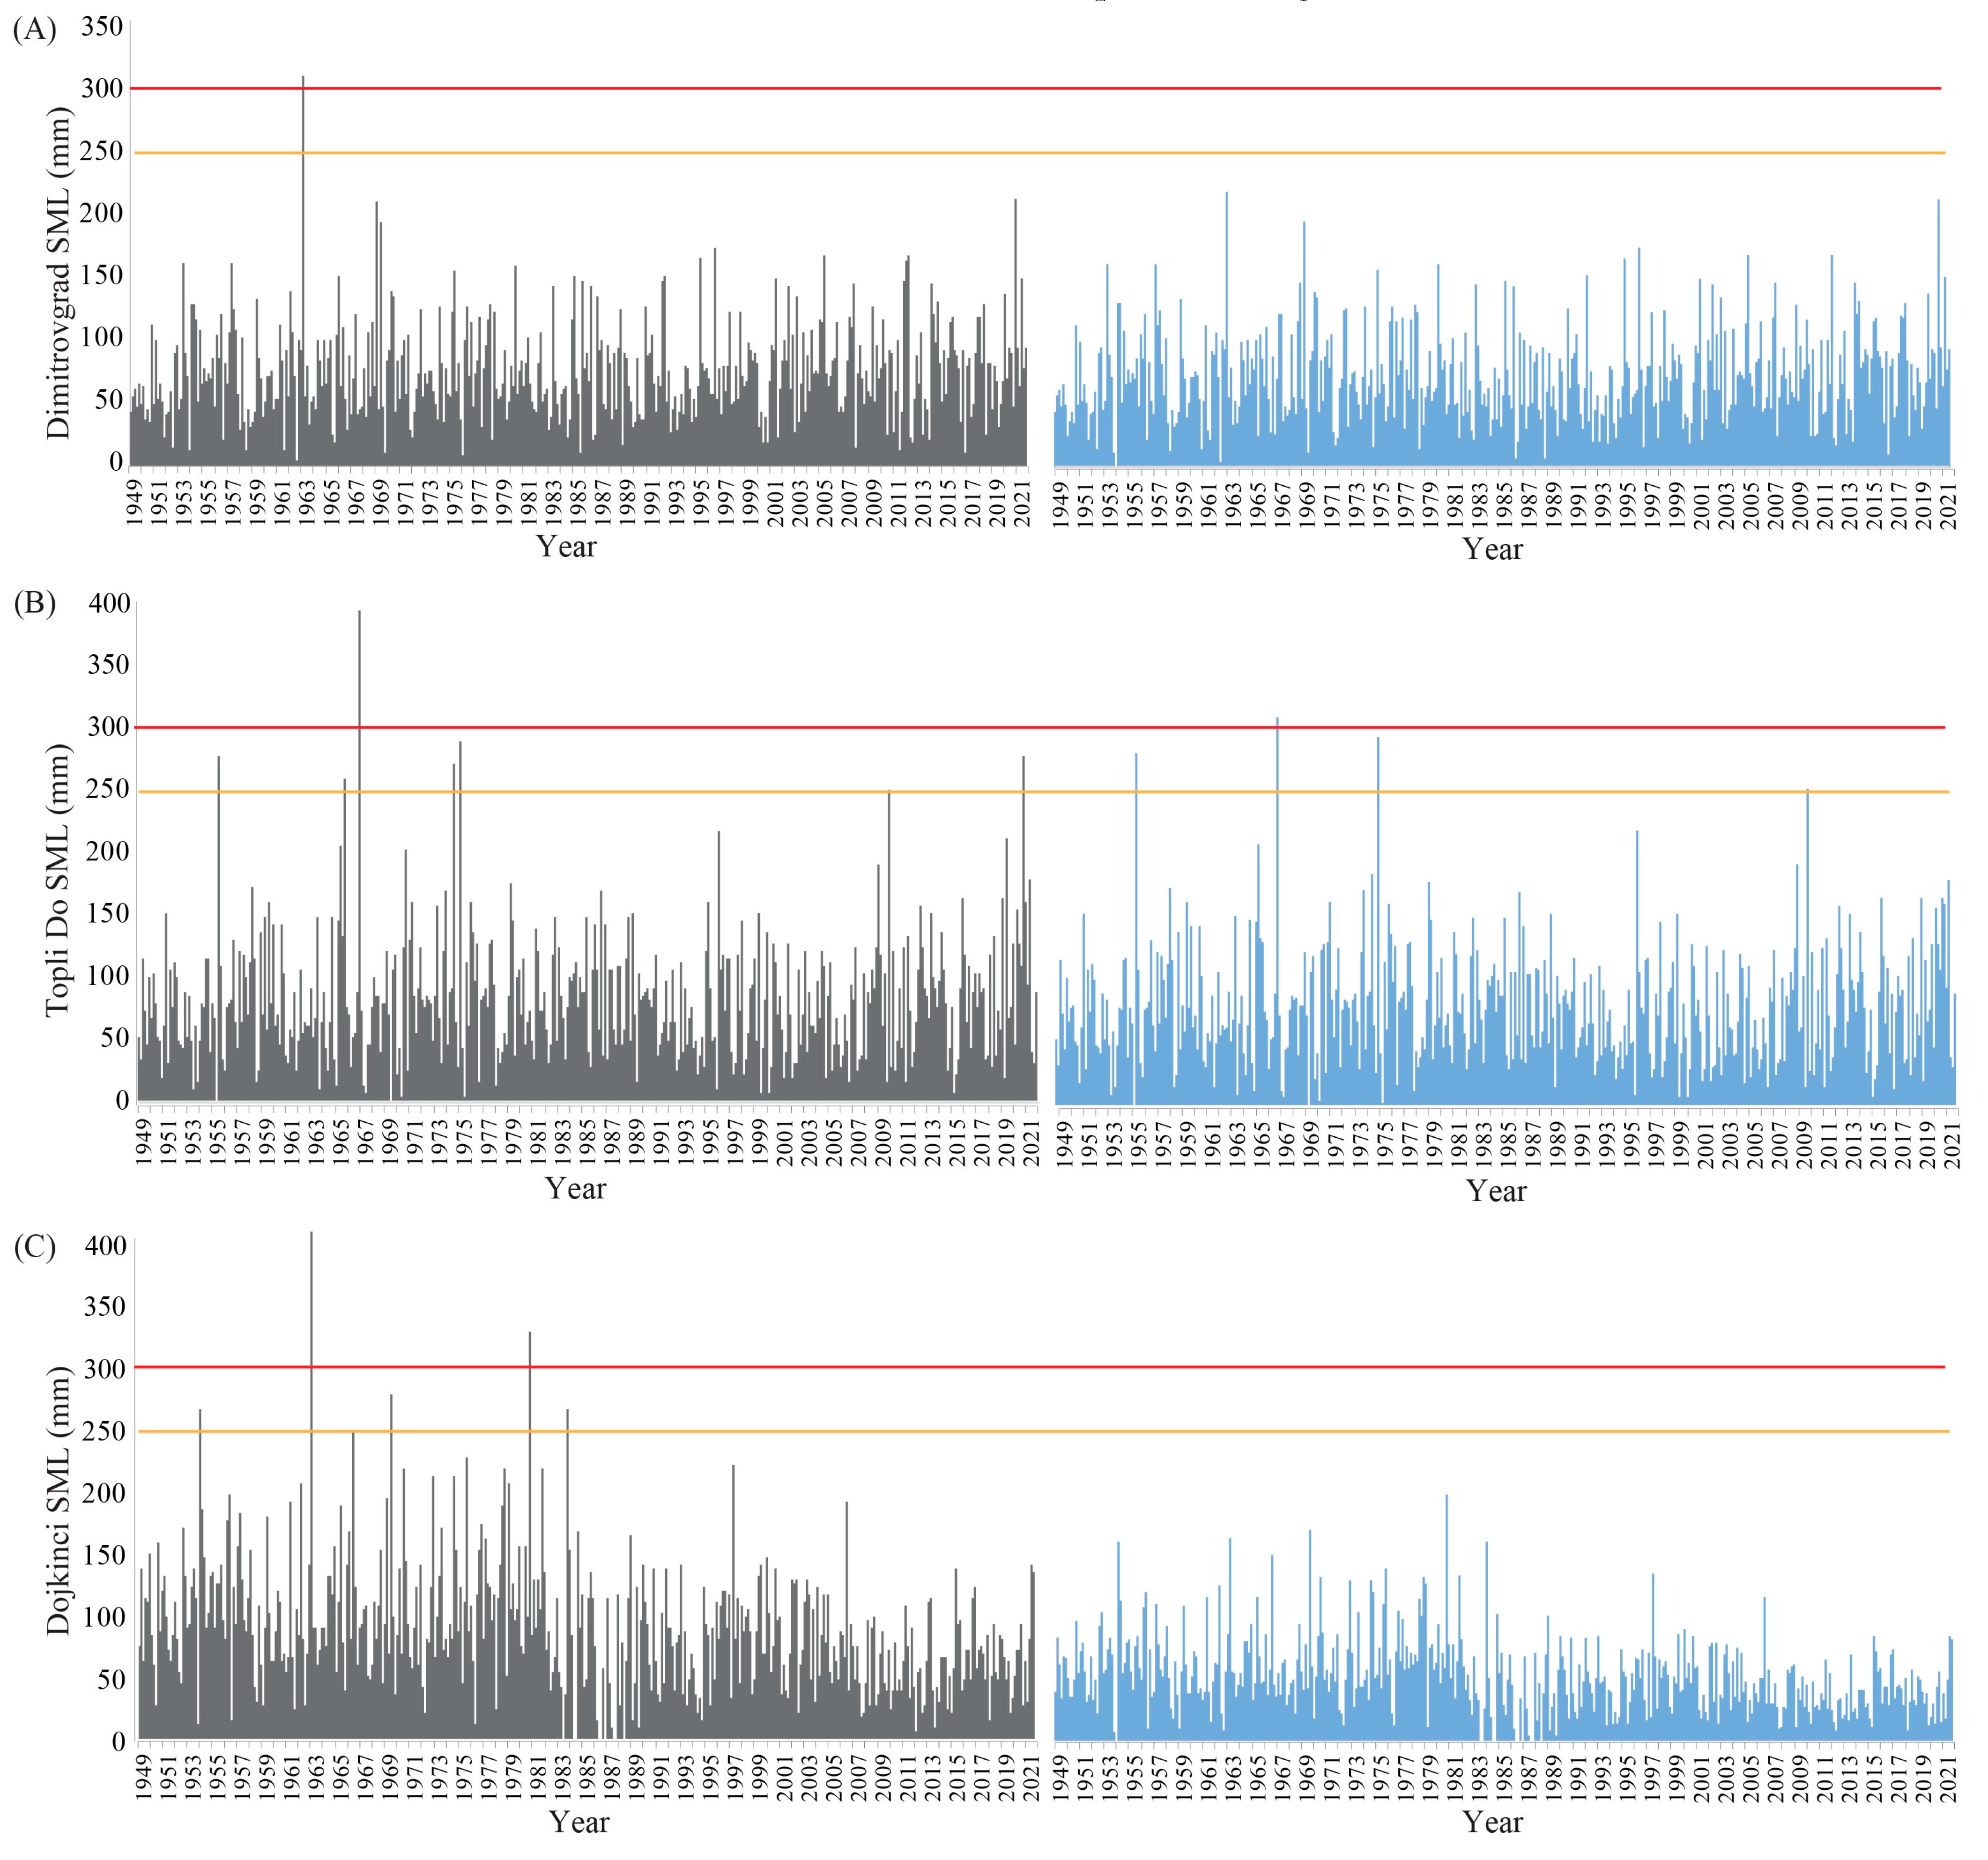
65]. When analyzing the historical climate data for the 72-year interval from January 1949 to December 2021, February 1963 is shown as the most hazardous month in terms of the SML index value. Based on precipitation data alone, the likelihood of an extreme landslide might have been missed. However, the SML index provides new insights into the likelihood of extreme events using a mix of data. The analysis also demonstrates that the climate variable Tmax in urban and low-elevation areas, such as Pirot and Dimitrovgrad, is not representative, as evidence by the SML data without Tmax interpolation (Figure 9).
Based on studies by Handwerger et al. (2013) [66] and Pfeiffer et al. (2021) [25], it is noticeable that snowmelt yields a more rapid response to potential land sliding than rainfall precipitation. This observation implies that the observed snowmelt either happens in closer proximity to the landslide area or infiltrates more efficiently than rainfall. This phenomenon could be linked to the greater variability in the duration and intensity of rainfall as compared to the more consistent and prolonged snowmelt event, which also happens during a season of low vegetative demand for water. Earman et al. (2006) [67] found that in their study sites, 40–70% of groundwater recharge is associated with snowmelt despite only 25–50% of the average annual precipitation falls as snow. Crosta et al. (2014) [68] made similar observations regarding the rapid response of landslides to snowmelt.
Historical data indicate that there is a significant gap between the Zavoj event and other SML peaks (by at least 20%, see Section 4.1). The predictive SML values also heavily depend on different terrain, pedology, geology, and other properties that influence landslides. Thus, a value of 300 mm can be considered as a potential threshold for this region but may not apply elsewhere. Therefore, for the calibration of potential threshold values in other regions, an intersection between the identified critical points and field-observed landslide processes is needed, as shown by Mustafić et al. (2008) [57] and Manojlović et al. (2018) [50].
Loss of population is prevalent across southeastern Serbia, especially in the study area [69,70]. Currently, the investigated area has no village with more than 100 inhabitants (Census, 2022 [46]). The population decreased from 13,914 (Census, 1953 [71]) to 504 (Census, 2022 [46]) inhabitants in the Serbian part of the Visok microregion (22 villages). The depopulation and the associated decline in agricultural activities have allowed forests and other types of vegetation to recover, reducing the likelihood of mass movements [50,57]. This means that for the occurrence of any future event, climatic values would probably need to exceed those reported here.
Global temperature trends point to worldwide warming [42,72]. Data from our meteorological stations also showed increasing temperatures and significant increases in precipitation (Figure 5; 
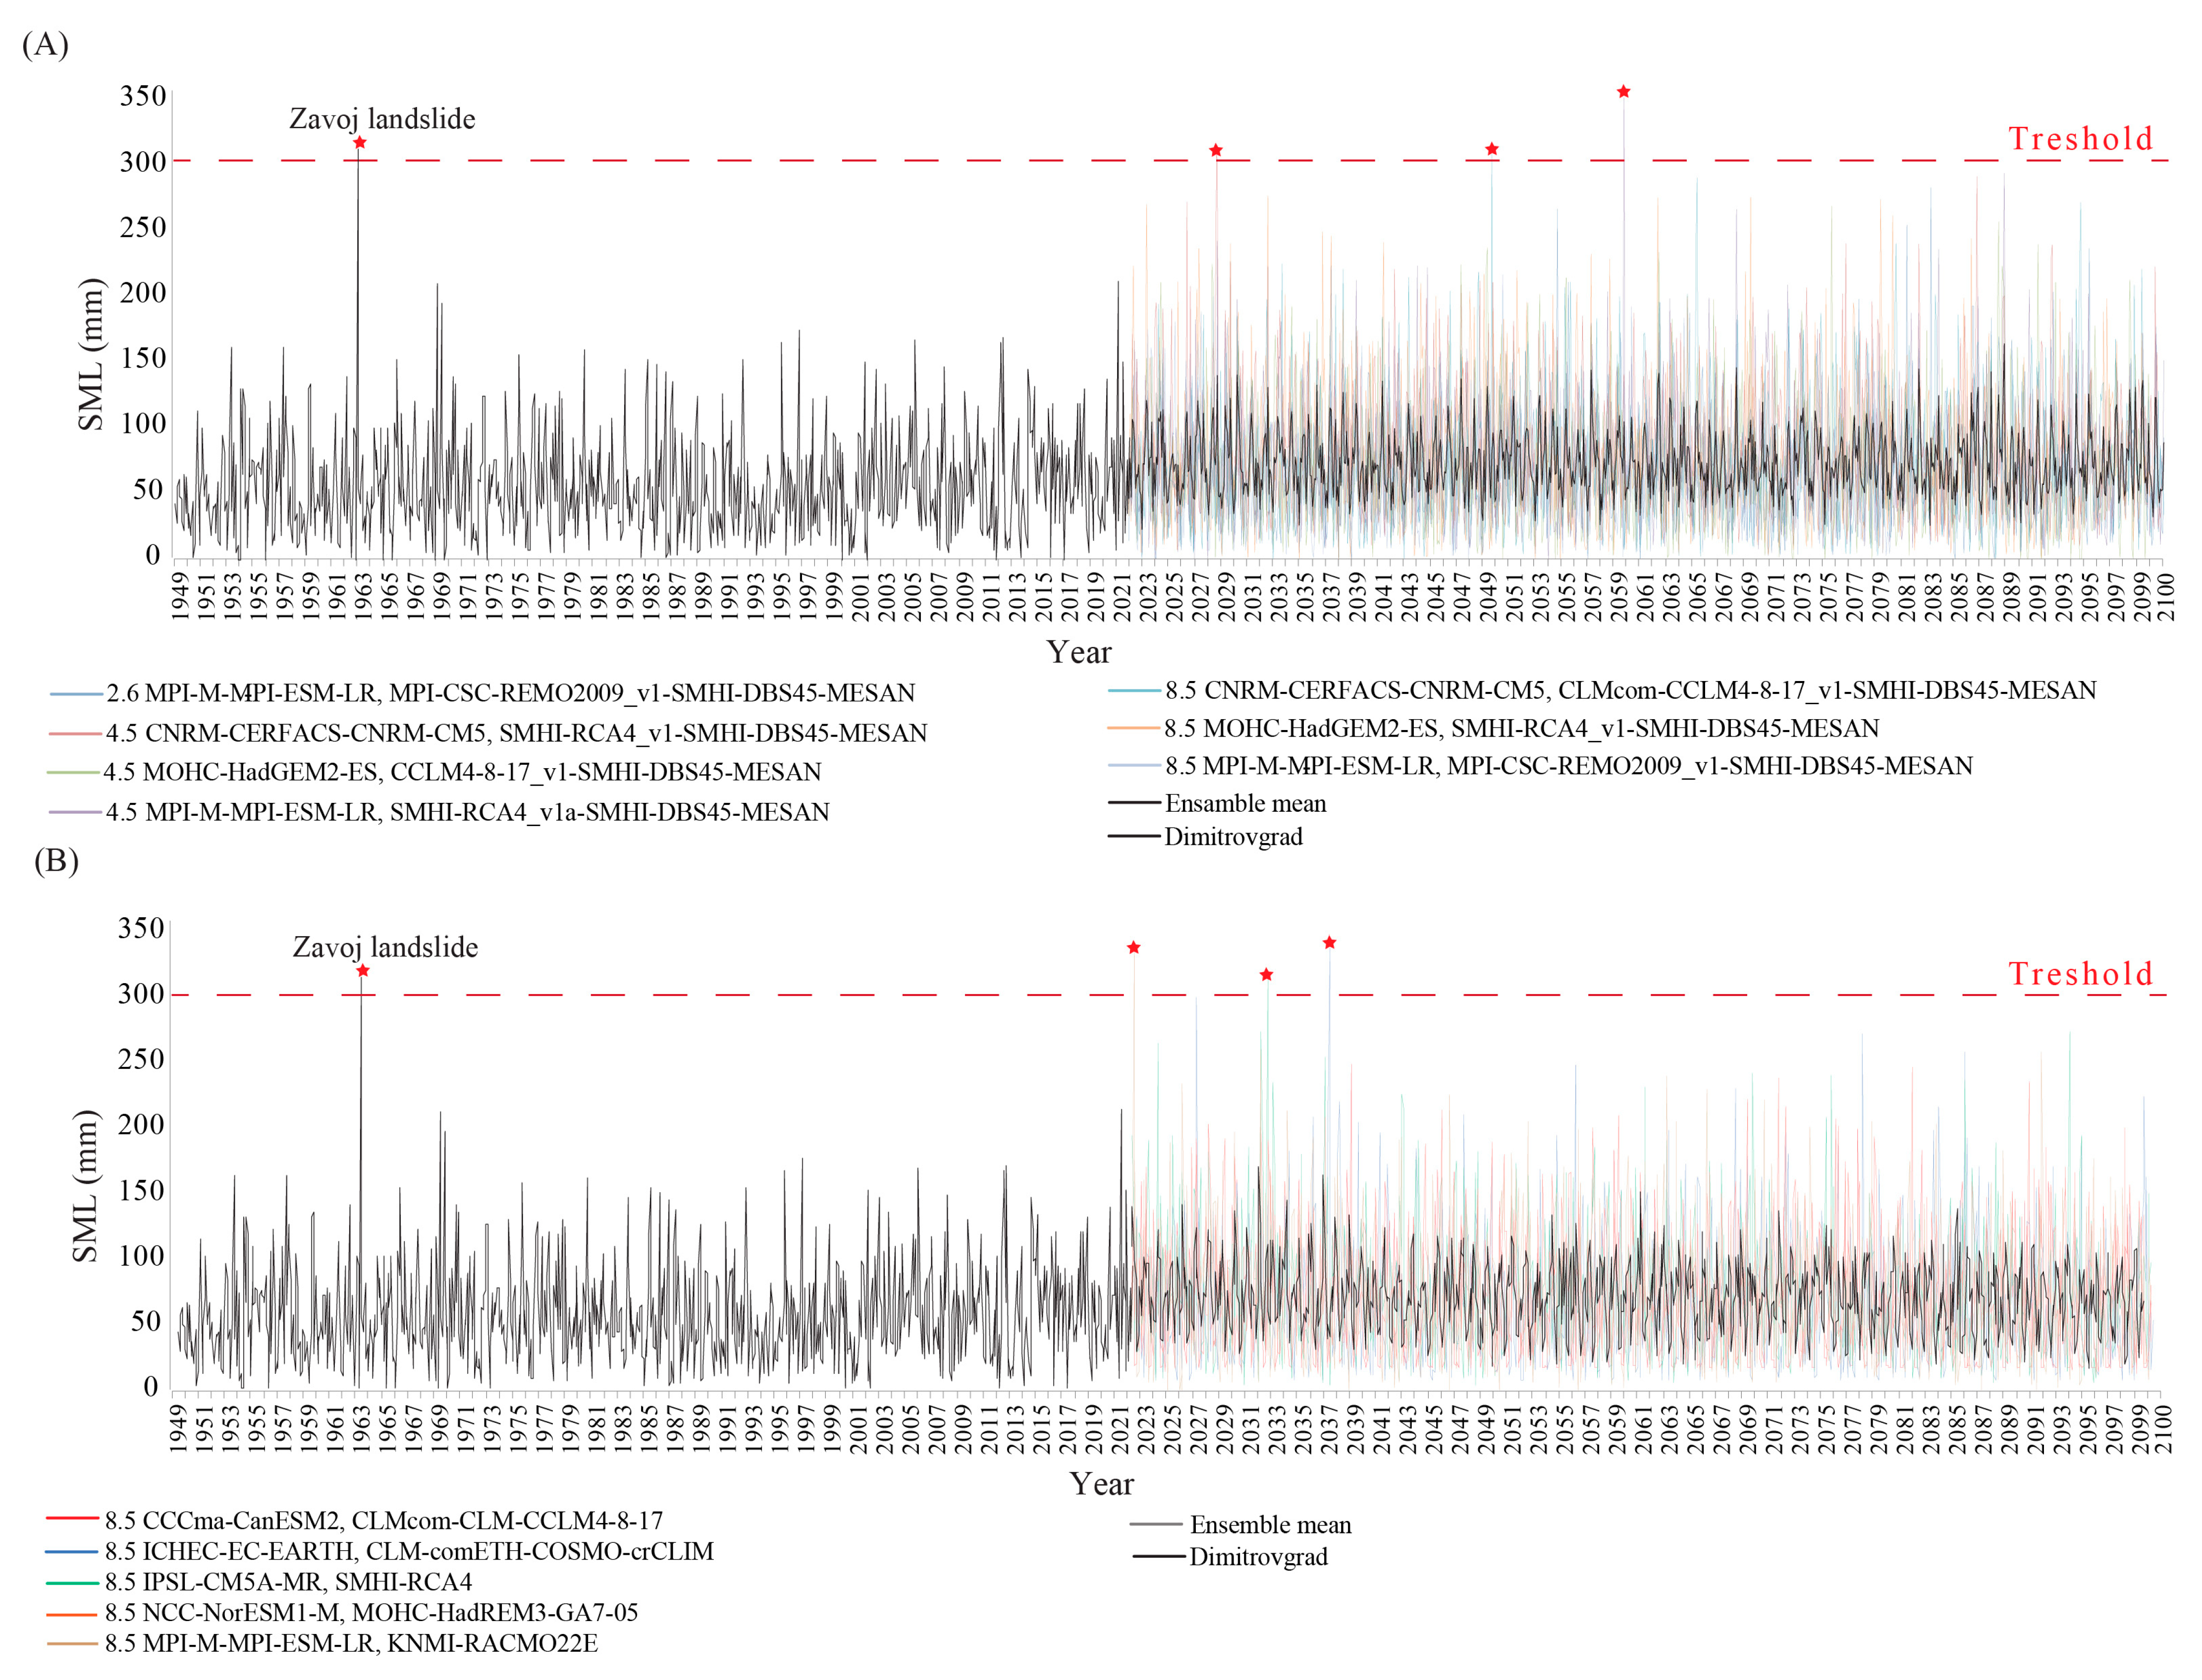
Table 7). Our results can be associated with the work of Georgoulias et al. (2022) [63]. Indeed, statistically significant increases in daily mean, daily minimum, and daily maximum near-surface air temperatures (°C) are occurring in southeastern Serbia both for the investigated periods (2021–2050 and 2071–2100) and across all examined RCPs (2.6, 4.5, and 8.5). By the end of the century, models predict additional increases in precipitation for southeastern Serbia. RCP 8.5 shows a somewhat similar change pattern, with slight increases in precipitation during winter (December to February) and spring (March to May). Thus, for future predictions, due to the presence of very high and rapid precipitation values, non-bias-corrected data should not be used for the implementation of the SML index. Most of the bias-corrected CORDEX climate models indicate the highest values during summer months and winter values that are not influenced by the SML index. In some models, there is almost no negative Tmax, that means, the SML index is not influenced at all. We did not need to interpolate temperature (as in historical data) because CORDEX climate models calculate grid cell temperature data that have taken into account the elevation. Therefore, we conclude that, for this region, there is a relatively small chance for a landslide event in the future that would rival the February 1963 event. However, should one occur, it would be driven by excessive precipitation episodes rather than rapid snowmelt.
Predicting the weather remains one of the foremost challenges in contemporary science, especially as our current forecasting capabilities struggle to extend beyond a 10-day period [73]. Our study employs climate models to assess the likelihood of landslide events for this area up to the year 2100. Future research should consider applying the SML index in colder regions, where the anticipated trends of warmer winters and early springs are expected to accelerate snowmelt, particularly in the high latitudes and in areas of higher elevation [25]. The proposed SML index, rooted in fundamental meteorological properties, offers a data-driven approach that can be applied across diverse geographical locations and for mitigation of hydro-meteorological hazards at local to national scale.
The majority of official meteorological stations in Serbia commenced operations in 1949, including those in our study area. However, there are some very sporadic data points before the year 1949. Nevertheless, meaningful calculation of the SML index, which necessitates knowledge about consecutive months, would not have been feasible with such sporadic data (therefore, we opted to avoid using it). Furthermore, missing data add difficulties to the successful implementation of the SML index. In our study, only the Dimitrovgrad station operated continuously without missing values, while other stations had missing data. Filling in such a series can be achieved through interpolation, as well as the application of other statistical-mathematical methods and models. It would also be beneficial for future research to establish a landslide cadaster. Also, the limitation of the SML index is presented in the variable threshold.
Landslides are a threat for damage to agriculture, water management, and other economic and social anthropogenic activities [50,57]. Therefore, studying phenomena of this magnitude is essential. For this purpose, the SML index primarily serves as an alarm system after critical snow accumulations, while CORDEX climate data provide information about the probability of future landslides using data from current trends and physical models. Future research procedures aimed at improving the SML index should move toward comparing thresholds in different basins and watersheds as well as correlating SML values with changes in geographical, demographic, and socioeconomic aspects of the area.

Supplementary Materials

The following supporting information can be downloaded at: https://www.mdpi.com/article/10.3390/atmos15030256/s1, Table S1: Data used in this study.

Author Contributions

Conceptualization, R.M., M.M. (Manfred Mudelsee), A.R.R. and T.L.; methodology, R.M., M.M. (Manfred Mudelsee), M.G.R. and B.B.; software, R.M. and M.M. (Manfred Mudelsee); validation, A.R.R., M.M. (Miloš Marjanović), S.B.M., V.S. and T.L.; formal analysis, R.M., M.M. (Manfred Mudelsee) and M.G.R.; investigation, R.M.; resources, M.M. (Manfred Mudelsee), J.N., B.B. and T.L.; data curation, R.M. and J.N.; writing—original draft preparation, R.M.; writing—review and editing, M.M. (Manfred Mudelsee), R.J.S., A.A. and T.L.; visualization, R.M., M.G.R., M.M. (Miloš Marjanović) and A.A.; supervision, M.M. (Manfred Mudelsee), S.B.M., A.R.R., V.S. and T.L.; project administration, B.B., M.M. (Manfred Mudelsee) and T.L.; funding acquisition, M.M. (Manfred Mudelsee) and T.L. All authors have read and agreed to the published version of the manuscript.

Funding

This research received no external funding.

Institutional Review Board Statement

Not applicable.

Informed Consent Statement

Not applicable.

Data Availability Statement

Data is contained within the article or Supplementary Materials.

Acknowledgments

This research is supported by the EXtremeClimTwin project funded by the European Union’s Horizon 2020 research and innovation program under grant agreement No. 952384; Ministry of Science, Technological Development and Innovation, Republic of Serbia (No. 451-03-47/2023-01/ 200124); Ministry of Science, Technological Development and Innovation of the Republic of Serbia (No. 451-03-66/2024-03/ 200125 & 451-03-65/2024-03/200125). The authors are grateful to the anonymous reviewers whose comments and suggestions greatly improved the manuscript.

Conflicts of Interest

Author Aleksandar Antić is an employee of MDPI; however, he was not working for the journal Atmosphere at the time of submission and publication. Author Manfred Mudelsee is an employee of Climate Risk Analysis and Advanced Climate Risk Education gUG. The companies played no role in the design of the study, the collection, analysis, or interpretation of data, the writing of the manuscript, or the decision to publish the articles. The paper reflects the views of the scientists and not those of the company. Other authors declare no conflict of interest.

References

  1. Terzaghi, K. Mechanism of Landslides; Geotechnical Society of America: Berkeley, CA, USA, 1950. [Google Scholar]
  2. Cruden, D. A simple definition of a landslide. Bull. Eng. Geol. Environ. 1991, 43, 27. [Google Scholar] [CrossRef]
  3. Dai, F.C.; Lee, C.F.; Ngai, Y.Y. Landslide risk assessment and management: An overview. Eng. Geol. 2002, 64, 65–87. [Google Scholar] [CrossRef]
  4. Alimohammadlou, Y.; Najafi, A.; Yalcin, A. Landslide process and impacts: A proposed classification method. Catena 2013, 104, 219–232. [Google Scholar] [CrossRef]
  5. Lukić, T.; Leščešen, I.; Sakulski, D.; Basarin, B.; Jordaan, A. Rainfall erosivity as an indicator of sliding occurrence along the southern slopes of the Bačka loess plateau: A case study of the Kula settlement, Vojvodina (North Serbia). Carpath. J. Earth Environ. Sci. 2016, 11, 303–318. [Google Scholar]
  6. Aleksova, B.; Lukić, T.; Milevski, I.; Spalević, V.; Marković, S.B. Modelling Water Erosion and Mass Movements (Wet) by Using GIS-Based Multi-Hazard Susceptibility Assessment Approaches: A Case Study—Kratovska Reka Catchment (North Macedonia). Atmosphere 2023, 14, 1139. [Google Scholar] [CrossRef]
  7. Haque, U.; Blum, P.; Da Silva, P.F.; Andersen, P.; Pilz, J.; Chalov, S.R.; Malet, J.P.; Auflič, M.J.; Andres, N.; Poyiadji, E.; et al. Fatal landslides in Europe. Landslides 2016, 13, 1545–1554. [Google Scholar] [CrossRef]
  8. Rahman, H.A.; Mapjabil, J. Landslides disaster in Malaysia: An overview. Health 2017, 8, 58–71. [Google Scholar]
  9. Zhang, F.; Huang, X. Trend and spatiotemporal distribution of fatal landslides triggered by non-seismic effects in China. Landslides 2018, 15, 1663–1674. [Google Scholar] [CrossRef]
  10. Froude, M.J.; Petley, D.N. Global fatal landslide occurrence from 2004 to 2016. Nat. Hazards Earth Syst. Sci. 2018, 18, 2161–2181. [Google Scholar] [CrossRef]
  11. Hearn, G.J.; Hart, A.B. Landslide susceptibility mapping: A practitioner’s view. Bull. Eng. Geol. Environ. 2019, 78, 5811–5826. [Google Scholar] [CrossRef]
  12. Fang, K.; Tang, H.; Li, C.; Su, X.; An, P.; Sun, S. Centrifuge modelling of landslides and landslide hazard mitigation: A review. Geosci. Front. 2023, 14, 101493. [Google Scholar] [CrossRef]
  13. Abella, E.C.; Van Westen, C.J. Generation of a landslide risk index map for Cuba using spatial multi-criteria evaluation. Landslides 2007, 4, 311–325. [Google Scholar] [CrossRef]
  14. Vasu, N.N.; Lee, S.R.; Pradhan, A.M.S.; Kim, Y.T.; Kang, S.H.; Lee, D.H. A new approach to temporal modelling for landslide hazard assessment using an extreme rainfall induced-landslide index. Eng. Geol. 2016, 215, 36–49. [Google Scholar] [CrossRef]
  15. Yang, H.; Adler, R.F. Predicting global landslide spatiotemporal distribution: Integrating landslide susceptibility zoning techniques and real-time satellite rainfall estimates. Int. J. Sediment Res. 2008, 23, 249–257. [Google Scholar] [CrossRef]
  16. Zhang, Y.; Tang, J.; Cheng, Y.; Huang, L.; Guo, F.; Yin, X.; Li, N. Prediction of landslide displacement with dynamic features using intelligent approaches. Int. J. Min. Sci. Technol. 2022, 32, 539–549. [Google Scholar] [CrossRef]
  17. Vujačić, D.; Milevski, I.; Mijanović, D.; Vujović, F.; Lukić, T. Initial results of comparative assessment of soil erosion intensity using the wintero model: A case study of polimlje and shirindareh drainage basins. Carpath. J. Earth Environ. Sci. 2023, 18, 385–404. [Google Scholar] [CrossRef]
  18. Habibi, M.; Babaeian, I.; Schöner, W. Changing Causes of Drought in the Urmia Lake Basin—Increasing Influence of Evaporation and Disappearing Snow Cover. Water 2021, 13, 3273. [Google Scholar] [CrossRef]
  19. Yu, J.; Cai, W.; Zhou, M. Evaluation and Prediction Model for Ice–Snow Tourism Suitability under Climate Warming. Atmosphere 2022, 13, 1806. [Google Scholar] [CrossRef]
  20. Hultstrand, D.M.; Fassnacht, S.R.; Stednick, J.D.; Hiemstra, C.A. Snowpack Distribution Using Topographical, Climatological and Winter Season Index Inputs. Atmosphere 2022, 13, 3. [Google Scholar] [CrossRef]
  21. Al-Umar, M.; Fall, M.; Daneshfar, B. GIS-based modeling of snowmelt-induced landslide susceptibility of sensitive marine clays. Geoenviron. Dis. 2020, 7, 1–18. [Google Scholar] [CrossRef]
  22. Cardinali, M.; Ardizzone, F.; Galli, M.; Guzzetti, F.; Reichenbach, P. Landslides triggered by rapid snow melting: The December 1996–January 1997 event in Central Italy. In Proceedings of the 1st Plinius Conference on Mediterranean Storms, Maratea, Italy, 16–18 October 1999; Bios: Cosenza, Italy, 2000; pp. 439–448. [Google Scholar]
  23. Martelloni, G.; Segoni, S.; Lagomarsino, D.; Fanti, R.; Catani, F. Snow accumulation/melting model (SAMM) for integrated use in regional scale landslide early warning systems. Hydrol. Earth Syst. Sci. 2013, 17, 1229–1240. [Google Scholar] [CrossRef]
  24. Moreiras, S.; Lisboa, M.S.; Mastrantonio, L. The role of snow melting upon landslides in the central Argentinean Andes. Earth Surf. Process. Landf. 2012, 37, 1106–1119. [Google Scholar] [CrossRef]
  25. Pfeiffer, J.; Zieher, T.; Schmieder, J.; Rutzinger, M.; Strasser, U. Spatio-temporal assessment of the hydrological drivers of an active deep-seated gravitational slope deformation: The Vögelsberg landslide in Tyrol (Austria). Earth Surf. Process. Landf. 2021, 46, 1865–1881. [Google Scholar] [CrossRef]
  26. Xian, Y.; Wei, X.; Zhou, H.; Chen, N.; Liu, Y.; Liu, F.; Sun, H. Snowmelt-triggered reactivation of a loess landslide in Yili, Xinjiang, China: Mode and mechanism. Landslides 2022, 19, 1843–1860. [Google Scholar] [CrossRef]
  27. Gou, Y.; Zhang, L.; Chen, Y.; Zhou, H.; Zhu, Q.; Liu, X.; Lin, J. Monitoring Seasonal Movement Characteristics of the Landslide Based on Time-Series InSAR Technology: The Cheyiping Landslide Case Study, China. Remote Sens. 2023, 15, 51. [Google Scholar] [CrossRef]
  28. Kawagoe, S.; Kazama, S.; Sarukkalige, P.R. Assessment of snowmelt triggered landslide hazard and risk in Japan. Cold Reg. Sci. Technol. 2009, 58, 120–129. [Google Scholar] [CrossRef]
  29. Chiarelli, D.D.; Galizzi, M.; Bocchiola, D.; Rosso, R.; Rulli, M.C. Modeling snowmelt influence on shallow landslides in Tartano valley, Italian Alps. Sci. Total Environ. 2023, 856, 158772. [Google Scholar] [CrossRef] [PubMed]
  30. Dai, X.; Schneider-Muntau, B.; Krenn, J.; Zangerl, C.; Fellin, W. Mechanisms for the Formation of an Exceptionally Gently Inclined Basal Shear Zone of a Landslide in Glacial Sediments—The Ludoialm Case Study. Appl. Sci. 2023, 13, 6837. [Google Scholar] [CrossRef]
  31. Micić Ponjiger, T.; Lukić, T.; Wilby, R.L.; Marković, S.B.; Valjarević, A.; Dragićević, S.; Gavrilov, M.B.; Ponjiger, I.; Durlević, U.; Milanović, M.M.; et al. Evaluation of Rainfall Erosivity in the Western Balkans by Mapping and Clustering ERA5 Reanalysis Data. Atmosphere 2023, 14, 104. [Google Scholar] [CrossRef]
  32. Daskalov, R.D.; Mishkova, D.; Marinov, T.; Vezenkov, A. Entangled Histories of the Balkans-Volume Four: Concepts, Approaches, and (Self-) Representations; Brill: Leiden, The Netherlands, 2017; Volume 18. [Google Scholar]
  33. Füssel, H.M. (Ed.) Climate Change, Impacts and Vulnerability in Europe 2016: An Indicator-Based Report; European Environment Agency: Copenhagen, Denmark, 2017. [Google Scholar]
  34. Blinkov, I. Review and comparison of water erosion intensity in the Western Balkan and EU countries. Contributions, Section of Natural. Math. Biotech. Sci. 2017, 36, 27–42. [Google Scholar]
  35. Verheijen, F.G.; Jones, R.J.; Rickson, R.J.; Smith, C.J. Tolerable versus actual soil erosion rates in Europe. Earth-Sci. Rev. 2009, 94, 23–38. [Google Scholar] [CrossRef]
  36. Lukić, T.; Bjelajac, D.; Fitzsimmons, K.E.; Marković, S.B.; Basarin, B.; Mlađan, D.; Micić, T.; Schaetzl, R.J.; Gavrilov, M.B.; Milanović, M.; et al. Factors triggering landslide occurrence on the Zemun loess plateau, Belgrade area, Serbia. Environ. Earth Sci. 2018, 77, 1–15. [Google Scholar] [CrossRef]
  37. Životić, L.; Perović, V.; Jaramaz, D.; Ðordević, A.; Petrović, R.; Todorović, M. Application of USLE, GIS, and Remote Sensing in the Assessment of Soil Erosion Rates in Southeastern Serbia. Pol. J. Environ. Stud. 2012, 21, 1929–1935. [Google Scholar]
  38. Dragicevic, S.; Filipovic, D.; Kostadinov, S.; Ristic, R.; Novkovic, I.; Zivkovic, N.; Andjelkovic, G.; Abolmasov, B.; Secerov, V.; Djurdjic, S. Natural hazard assessment for land-use planning in Serbia. Int. J. Environ. Res. 2011, 5, 371–380. [Google Scholar]
  39. Đurić, D.; Mladenović, A.; Pešić-Georgiadis, M.; Marjanović, M.; Abolmasov, B. Using multiresolution and multitemporal satellite data for post-disaster landslide inventory in the Republic of Serbia. Landslides 2017, 14, 1467–1482. [Google Scholar] [CrossRef]
  40. Stanković, S.M. Počela Izgradnja Hidroelektrane “Zavoj”; Srpsko Geografsko Društvo: Beograd, Serbia, 1977. [Google Scholar]
  41. Sibinović, M. Old mountain’s perspectives for the excursion and outdoors practice. Globus 2008, 39, 87–96. [Google Scholar]
  42. Nakicenovic, N.; Alcamo, J.; Davis, G.; Vries, B.D.; Fenhann, J.; Gaffin, S.; Gregory, K.; Grubler, A.; Jung, T.Y.; Kram, T.; et al. Special Report on Emissions Scenarios; Cambridge University Press: Cambridge, UK, 2000. [Google Scholar]
  43. Barrie, P.A. Climate Change Turning Up the Heat; CSIRO, Publishing: Collingwood, Australia, 2005. [Google Scholar]
  44. Copernicus Climate Change Service, Climate Data Store. CORDEX Regional Climate Model Data on Single Levels; Copernicus Climate Change Service (C3S) Climate Data Store (CDS): Maastricht, The Netherlands, 2019. [Google Scholar] [CrossRef]
  45. Vidanović-Sazda, G. Visok: Privredno-Geografska Ispitivanja; Naučna Knjiga: Beograd, Serbia, 1955. [Google Scholar]
  46. Census, 2022, Republički Zavod za Statistiku- Nacionalna Pripadnost, Knjiga 1. 2023. Available online: https://popis2022.stat.gov.rs/sr-Latn/5-vestisaopstenja/news-events/20230428-konacnirezpopisa (accessed on 27 October 2023).
  47. Đaković, M.; Rabrenović, D.; Jovanović, D.; Sudar, M.; Radonjić, M. Biostratigraphy on ammonoids and foraminifers of Middle Triassic (Pelsonian) Jelovica Limestone Formation (Stara Planina Mts), Eastern Serbia. Geol. Carpath. 2022, 73, 187–205. [Google Scholar] [CrossRef]
  48. Dimitrijević, M.D.; Karamata, S.O. Geological Map of the Carpatho-Balkanides between Mehadia, Oravița, Niš and Sofia; Geoinstitut: Belgrade, Serbia, 2003. [Google Scholar]
  49. Spalevic, V. Impact of Land Use on Runoff and Soil Erosion in Polimlje. Ph.D. Dissertation, Faculty of Agriculture of the University of Belgrade, Belgrade, Serbia, 2011. [Google Scholar]
  50. Manojlović, S.; Antić, M.; Šantić, D.; Sibinović, M.; Carević, I.; Srejić, T. Anthropogenic impact on erosion intensity: Case study of rural areas of pirot and dimitrovgrad municipalities, Serbia. Sustainability 2018, 10, 826. [Google Scholar] [CrossRef]
  51. Stojadinović Sule, D. Vodopadi Srbije; Narodna Biblioteka “Vuk Karadžić”: Kragujevac, Serbia, 2013. (In Serbian) [Google Scholar]
  52. Stankov, U.; Stojanović, V.; Dragićević, V.; Arsenović, D. Ecotourism: An alternative to mass tourism in nature park “Stara planina”. J. Geogr. Inst. “Jovan Cvijic” SASA 2011, 61, 43–59. [Google Scholar] [CrossRef]
  53. Marjanović, M.; Milenković, J.; Lukić, M.; Tomić, N.; Antić, A.; Marković, R.S.; Atanasijević, J.; Božić, D.; Buhmiler, S.; Radaković, M.; et al. Geomorphological and hydrological heritage of Mt. Stara Planina in SE Serbia: From river protection initiative to potential geotouristic destination. Open Geosci. 2022, 14, 275–293. [Google Scholar] [CrossRef]
  54. Census, 1961; Republički Zavod za Statistiku- Uporedni Pregled Broja Stanovnika 1948–2011, Knjiga 20. 2011. Available online: https://pod2.stat.gov.rs/objavljenepublikacije/popis2011/knjiga20.pdf (accessed on 15 July 2023).
  55. Pecelj, M.; Milinčić, M.; Mandić, D.; Pecelj, M.; Šabić, D.; Pecelj, J.; Lukić, B. New Technologies in transforming natural hazards to hydro-technical object. In Proceedings of the 7th WSEAS International Conference on Engineering Education, Corfu Island, Greece, 22–24 July 2010; pp. 22–24. [Google Scholar]
  56. Jovanović, R. Zavoj- od sela do jezera. In Popularno-Naučni Zbornik Zemlja i Ljudi; Nachgewiesen: Beograd, Serbia, 2011. [Google Scholar]
  57. Mustafić, S.; Kostadinov, S.; Manojlović, P. Risk of artificial lake’Zavoj’to processes of erosion: Methodological, knowing and protecting aspect. Bull. Serb. Geogr. Soc. 2008, 88, 29–42. [Google Scholar]
  58. Spalevic, V.; Barovic, G.; Vujacic, D.; Curovic, M.; Behzadfar, M.; Djurovic, N.; Dudic, B.; Billi, P. The impact of land use changes on soil erosion in the river basin of Miocki Potok, Montenegro. Water 2020, 12, 2973. [Google Scholar] [CrossRef]
  59. Mudelsee, M. Climate Time Series Analysis: Classical Statistical and Bootstrap Methods, 2nd ed.; Springer: Cham, Switzerland, 2014; 454p. [Google Scholar]
  60. Ólafsdóttir, K.B.; Mudelsee, M. More accurate, calibrated bootstrap confidence intervals for estimating the correlation between two time series. Math. Geosci. 2014, 46, 411–427. [Google Scholar] [CrossRef]
  61. Das, A.; Agrawal, R.; Mohan, S. Topographic Correction of ALOS-PALSAR Images Using InSAR-Derived DEM. Geocarto Int. 2014, 30, 1–9. [Google Scholar] [CrossRef]
  62. Manić, M.; Đorđević, M.; Đokić, M.; Dragović, R.; Kićović, D.; Đorđević, D.; Jović, M.; Smičiklas, I.; Dragović, S. Remote Sensing and Nuclear Techniques for Soil Erosion Research in Forest Areas: Case Study of the Crveni Potok Catchment. Front. Environ. Sci. 2022, 10, 897248. [Google Scholar] [CrossRef]
  63. Georgoulias, A.K.; Akritidis, D.; Kalisoras, A.; Kapsomenakis, J.; Melas, D.; Zerefos, C.S.; Zanis, P. Climate change projections for Greece in the 21st century from high-resolution EURO-CORDEX RCM simulations. Atmos. Res. 2022, 271, 106049. [Google Scholar] [CrossRef]
  64. McSweeney, C.F.; Jones, R.G.; Lee, R.W.; Rowell, D.P. Selecting CMIP5 GCMs for downscaling over multiple regions. Clim. Dyn. 2015, 44, 3237–3260. [Google Scholar] [CrossRef]
  65. De Cáceres, M.; Martin-StPaul, N.; Turco, M.; Cabon, A.; Granda, V. Estimating daily meteorological data and downscaling climate models over landscapes. Environ. Model. Softw. 2018, 108, 186–196. [Google Scholar] [CrossRef]
  66. Handwerger, A.L.; Roering, J.J.; Schmidt, D.A. Controls on the seasonal deformation of slow-moving landslides. Earth Planet. Sci. Lett. 2013, 377, 239–247. [Google Scholar] [CrossRef]
  67. Earman, S.; Campbell, A.R.; Phillips, F.M.; Newman, B.D. Isotopic exchange between snow and atmospheric water vapor: Estimation of the snowmelt component of groundwater recharge in the southwestern United States. J. Geophys. Res. Atmos. 2006, 111, D09302. [Google Scholar] [CrossRef]
  68. Crosta, G.B.; Di Prisco, C.; Frattini, P.; Frigerio, G.; Castellanza, R.; Agliardi, F. Chasing a complete understanding of the triggering mechanisms of a large rapidly evolving rockslide. Landslides 2014, 11, 747–764. [Google Scholar] [CrossRef]
  69. Krstić, V. Stanovništvo Jugoistočne Srbije, Komparativna Studija Demografskog Razvitka [The Population of the South-East Serbia, Comparative Study of Demographic Development]; Zavod za Urbanizam: Niš, Serbia, 2007. [Google Scholar]
  70. Velojić, M.; Radovanović, O. Visok; Tercija: Zaječar, Serbia; Bor, Serbia, 2017. [Google Scholar]
  71. Census, 1953; Republički Zavod za Statistiku- Uporedni Pregled Broja Stanovnika 1948–2011, Knjiga 20. 2011. Available online: https://pod2.stat.gov.rs/objavljenepublikacije/popis2011/knjiga20.pdf (accessed on 15 July 2023).
  72. Newell, R.G.; Prest, B.C.; Sexton, S.E. The GDP-temperature relationship: Implications for climate change damages. J. Environ. Econ. Manag. 2021, 108, 102445. [Google Scholar] [CrossRef]
  73. Gavrilov, M.B.; Jovanović, G.R.; Janjić, Z. Sensitivity of a long-range numerical weather forecast model to small changes of model parameters. Adv. Sci. Res. 2011, 6, 13–18. [Google Scholar] [CrossRef]
Figure 1. Geographical position of the Visok microregion. (A). Position of Serbia in Europe; (B). Position of the study area; (C). Main geographical features of the study area (Meteorological stations used in this study are represented by red dots on the (C) panel).
Atmosphere 15 00256 g001
Figure 2. Thematic maps of the Visok microregion associated with soil erosion. (On panels (CE), the Bulgarian part of the region was not included) (A). Geological map of (the Serbian part was digitalized using a basic geological map with a resolution of 1:100,000, while the Bulgarian part was digitalized using the map of the Carpatho–Balkanides with a 1:300,000 resolution [48]; (B). Slopes; (C). Soil permeability, according to the IntErO model [49]; (D). Erosion intensity during 1971 (Manojlović et al. (2018) [50], modified); (E). Erosion intensity during 2011 (Manojlović et al. (2018) [50], modified).
Atmosphere 15 00256 g002
Figure 3. (A). Waterfall Tupavica; (B). Waterfall Skok; (C). Zavoj Lake from the viewpoint at Koziji kamen (D,E). The submerged village of Velika Lukanja, during the extremely low water level of Zavoj Lake. Photo by: Rastko Marković.
Atmosphere 15 00256 g003
Figure 4. A flowchart of the methodology used in this study.
Atmosphere 15 00256 g004
Figure 5. Data from the Dimitrovgrad meteorological station. (A). Precipitation data with the SML index applied; (B). Tmax data; (C). Tavg data; (D). Monthly precipitation values. Black lines represent linear trend curves estimated using ordinary least-squares regression.
Atmosphere 15 00256 g005
Figure 6. Precipitation data from the Dimitrovgrad, Topli Do, and Dojkinci gauges, with applied SML index based on the interpolated Dimitrovgrad Tmax to the average height of the basin. Defined thresholds of 300 mm (red line) and 250 mm (yellow line) are presented in Table 2. (A). Dimitrovgrad station precipitation data; (B). Topli Do station precipitation data; (C). Dojkinci station precipitation data. For the definition of the thresholds (red and yellow horizontal lines), see Table 2.
Atmosphere 15 00256 g006
Figure 7. SML index values for the Dimitrovgrad station, showing summer (red) and winter (blue) monthly values. Defined thresholds of 300 mm (red line) and 250 mm (yellow line) are indicated.
Atmosphere 15 00256 g007
Figure 8. SML index data calculated using Dimitrovgrad station data. (A). Predictions based on bias-corrected RCM; (B). Predictions based on non-bias-corrected RCM. The SML threshold (300 mm) exceedances are indicated by a red asterisk.
Atmosphere 15 00256 g008
Figure 9. SML with interpolated Tmax (gray) and without interpolated Tmax (blue) for stations Dimitrovgrad (A), Topli Do (B), and Dojkinci (C). Defined thresholds of 300 mm (red line) and 250 mm (yellow line) are indicated on the panels.
Atmosphere 15 00256 g009
Table 1. Pearson’s r (with 95% confidence interval) calculated for all combinations of average monthly maximum temperature (Tmax) and monthly precipitation (P) data.
Data RelationshipPearson’s r [95% Confidence Interval]
Dimitrovgrad (Tmax)–Pirot (Tmax): 0.995 [0.977; 0.999]
Dimitrovgrad (Tmax)–Topli Do (Tmax): 0.997 [0.995; 0.998]
Pirot (Tmax)–Topli Do (Tmax): 0.996 [0.995; 0.997]
Dimitrovgrad (P)–Pirot (P): 0.852 [0.810; 0.885]
Dimitrovgrad (P)–Topli Do (P): 0.765 [0.717; 0.805]
Dimitrovgrad (P)–Dojkinci (P): 0.715 [0.670; 0.754]
Pirot (P)–Topli Do (P): 0.789 [0.749; 0.823]
Pirot (P)–Dojkinci (P): 0.724 [0.678; 0.764]
Topli Do (P)–Dojkinci (P): 0.745 [0.680; 0.798]
Table 2. Classification of Snow-Melt Landslide Index values.
SML Value (Units: mm)Probability of Landslide Occurrence
above 300High probability of a landslide in the Visočica basin
250 to 300Medium probability of a landslide in the Visočica basin
below 250No chance or low probability of a landslide in the Visočica basin
Table 3. CORDEX Grid coordinates for the Visočica catchment.
GridLatitudeLongitude
123.1076° E43.3057° N
223.0971° E43.196° N
323.0866° E43.0863° N
422.958° E43.3132° N
522.9478° E43.2034° N
622.9376° E43.0937° N
722.8084° E43.3204° N
822.7985° E43.2107° N
922.7886° E43.1009° N
1022.6587° E43.3275° N
1122.6491° E43.2177° N
1222.6396° E43.1079° N
Table 4. Non-bias-corrected regional climate models used in this study.
RCPMean Precipitation FluxMaximum 2 m Temperature in the Last 24 h
8.5CCCma-CanESM2, CLMcom-CLM-CCLM4-8-17CCCma-CanESM2, CLMcom-CLM-CCLM4-8-17
ICHEC-EC-EARTH, CLM-comETH-COSMO-crCLIMICHEC-EC-EARTH, CLM-comETH-COSMO-crCLIM
IPSL-CM5A-MR, SMHI-RCA4IPSL-CM5A-MR, SMHI-RCA4
NCC-NorESM1-M, MOHC-HadREM3-GA7-05NCC-NorESM1-M, MOHC-HadREM3-GA7-05
MPI-M-MPI-ESM-LR, KNMI-RACMO22EMPI-M-MPI-ESM-LR, KNMI-RACMO22E
Table 5. Bias-corrected regional climate models used in this study.
RCPMean Precipitation FluxMaximum 2 m Temperature in the Last 24 h
2.6MPI-M-MPI-ESM-LR_rcp26_r1i1p1_MPI-CSC-REMO2009_v1-SMHI-DBS45-MESANMPI-M-MPI-ESM-LR_rcp26_r1i1p1_MPI-CSC-REMO2009_v1-SMHI-DBS45-MESAN
4.5CNRM-CERFACS-CNRM-CM5_rcp45_r1i1p1_SMHI-RCA4_v1-SMHI-DBS45-MESANCNRM-CERFACS-CNRM-CM5_rcp45_r1i1p1_SMHI-RCA4_v1-SMHI-DBS45-MESAN
MPI-M-MPI-ESM-LR_rcp45_r1i1p1_SMHI-RCA4_v1a-SMHI-DBS45-MESANMPI-M-MPI-ESM-LR_rcp45_r1i1p1_SMHI-RCA4_v1a-SMHI-DBS45-MESAN
MOHC-HadGEM2-ES_rcp45_r1i1p1_CLMcom-CCLM4-8-17_v1-SMHI-DBS45-MESANMOHC-HadGEM2-ES_rcp45_r1i1p1_CLMcom-CCLM4-8-17_v1-SMHI-DBS45-MESAN
8.5CNRM-CERFACS-CNRM-CM5_rcp85_r1i1p1_CLMcom-CCLM4-8-17_v1-SMHI-DBS45-MESANCNRM-CERFACS-CNRM-CM5_rcp85_r1i1p1_CLMcom-CCLM4-8-17_v1-SMHI-DBS45-MESAN
MPI-M-MPI-ESM-LR_rcp85_r1i1p1_MPI-CSC-REMO2009_v1-SMHI-DBS45-MESANMPI-M-MPI-ESM-LR_rcp85_r1i1p1_SMHI-RCA4_v1a-SMHI-DBS45-MESAN
MOHC-HadGEM2-ES_rcp85_r1i1p1_SMHI-RCA4_v1-SMHI-DBS45-MESANMOHC-HadGEM2-ES_rcp85_r1i1p1_CLMcom-CCLM4-8-17_v1-SMHI-DBS45-MESAN
Table 6. Monthly precipitation (mm) data for the Dimitrovgrad station. AVG, average; σ, standard deviation; MAX, maximum.
MonthJanuaryFebruaryMarchApril MayJuneJulyAugustSeptemberOctoberNovemberDecemberMAX
AVG13.6612.9114.6215.7121.7624.8225.0819.7117.5818.5417.3714.0125.08
σ9.987.509.028.4111.4513.0020.6312.4712.6811.6810.248.5217.00
MAX67.947.952.546.461.971.3123.353.884.549.14843.9123.3
Table 7. Maximum daily precipitation values at the Dimitrovgrad station by month. AVG, average; Σ, sum; MAX, maximum.
MonthJanuaryFebruaryMarchApril MayJuneJulyAugustSeptemberOctoberNovemberDecemberSUM
AVG43.640.146.953.377.379.758.846.645.449.954.549.6645.8
Σ33.222.028.625.436.743.136.833.835.434.233.230.0
MAX212.9101.4138.4145.8169.1205.4152.5168.3174.3125.7148.2143.9976.6
Table 8. Linear ordinary least-squares (OLS) regression results (slope and intercept estimates) with bootstrap standard errors (se), obtained from 2000 moving-block bootstrap resampling (following the approach of Mudelsee (2014) [59]).
Dimitrovgrad
Station
Slopese_SlopeInterceptse_Intercept
Units(Degrees/Year)(Degrees/Year)DegreesDegrees
Tmax3.047 × 10−21.087 × 10⁻²−4.403 × 1012.158 × 101
Tavg1.245 × 10−2 7.698 × 10⁻³−1.459 × 1011.527 × 101
P8.605 × 10−26.058 × 10⁻²−1.168 × 1021.203 × 102
Disclaimer/Publisher’s Note: The statements, opinions and data contained in all publications are solely those of the individual author(s) and contributor(s) and not of MDPI and/or the editor(s). MDPI and/or the editor(s) disclaim responsibility for any injury to people or property resulting from any ideas, methods, instructions or products referred to in the content.

