Assessing the Impact of Spatiotemporal Land Cover Changes on the Urban Heat Islands in Developing Cities with Landsat Data: A Case Study in Zhanjiang
Abstract
:1. Introduction
2. Materials and Methods
2.1. Study Area
2.2. Preprocessing of Spatial Data
2.3. Spatiotemporal Analysis
2.3.1. Land Use Cover Classification
2.3.2. Landscape Pattern Calculation
2.3.3. Calculation of Land Use Indices (NDVI and NDBI)
2.3.4. Land Surface Temperature (LST)
2.3.5. Estimation of UTFVI
2.4. Statistical Analysis
3. Results
3.1. Spatiotemporal Change Analysis
3.1.1. LUCC Information
3.1.2. NDVI and NDBI
3.1.3. Land Surface Temperature (LST)
3.1.4. Urban Thermal Field Variance Index (UTFVI)
3.2. Correlation Analysis
3.2.1. NDVI, NDBI, and LST
3.2.2. Landscape Pattern Indices and LST
3.3. Analysis of the Impact of LUC Categories on LST
3.3.1. Average Temperature
3.3.2. UTFVI Distribution
3.3.3. Contribution of Different Land Cover to UTFVI
4. Discussion
4.1. Land Cover and UHI Variation
Impact of Land Cover Parameters
4.2. Impact of Landscape Pattern
4.3. Suggestions for UHI Slowdown of Less-Developed Cities
4.4. Limitations and Prospects
5. Conclusions
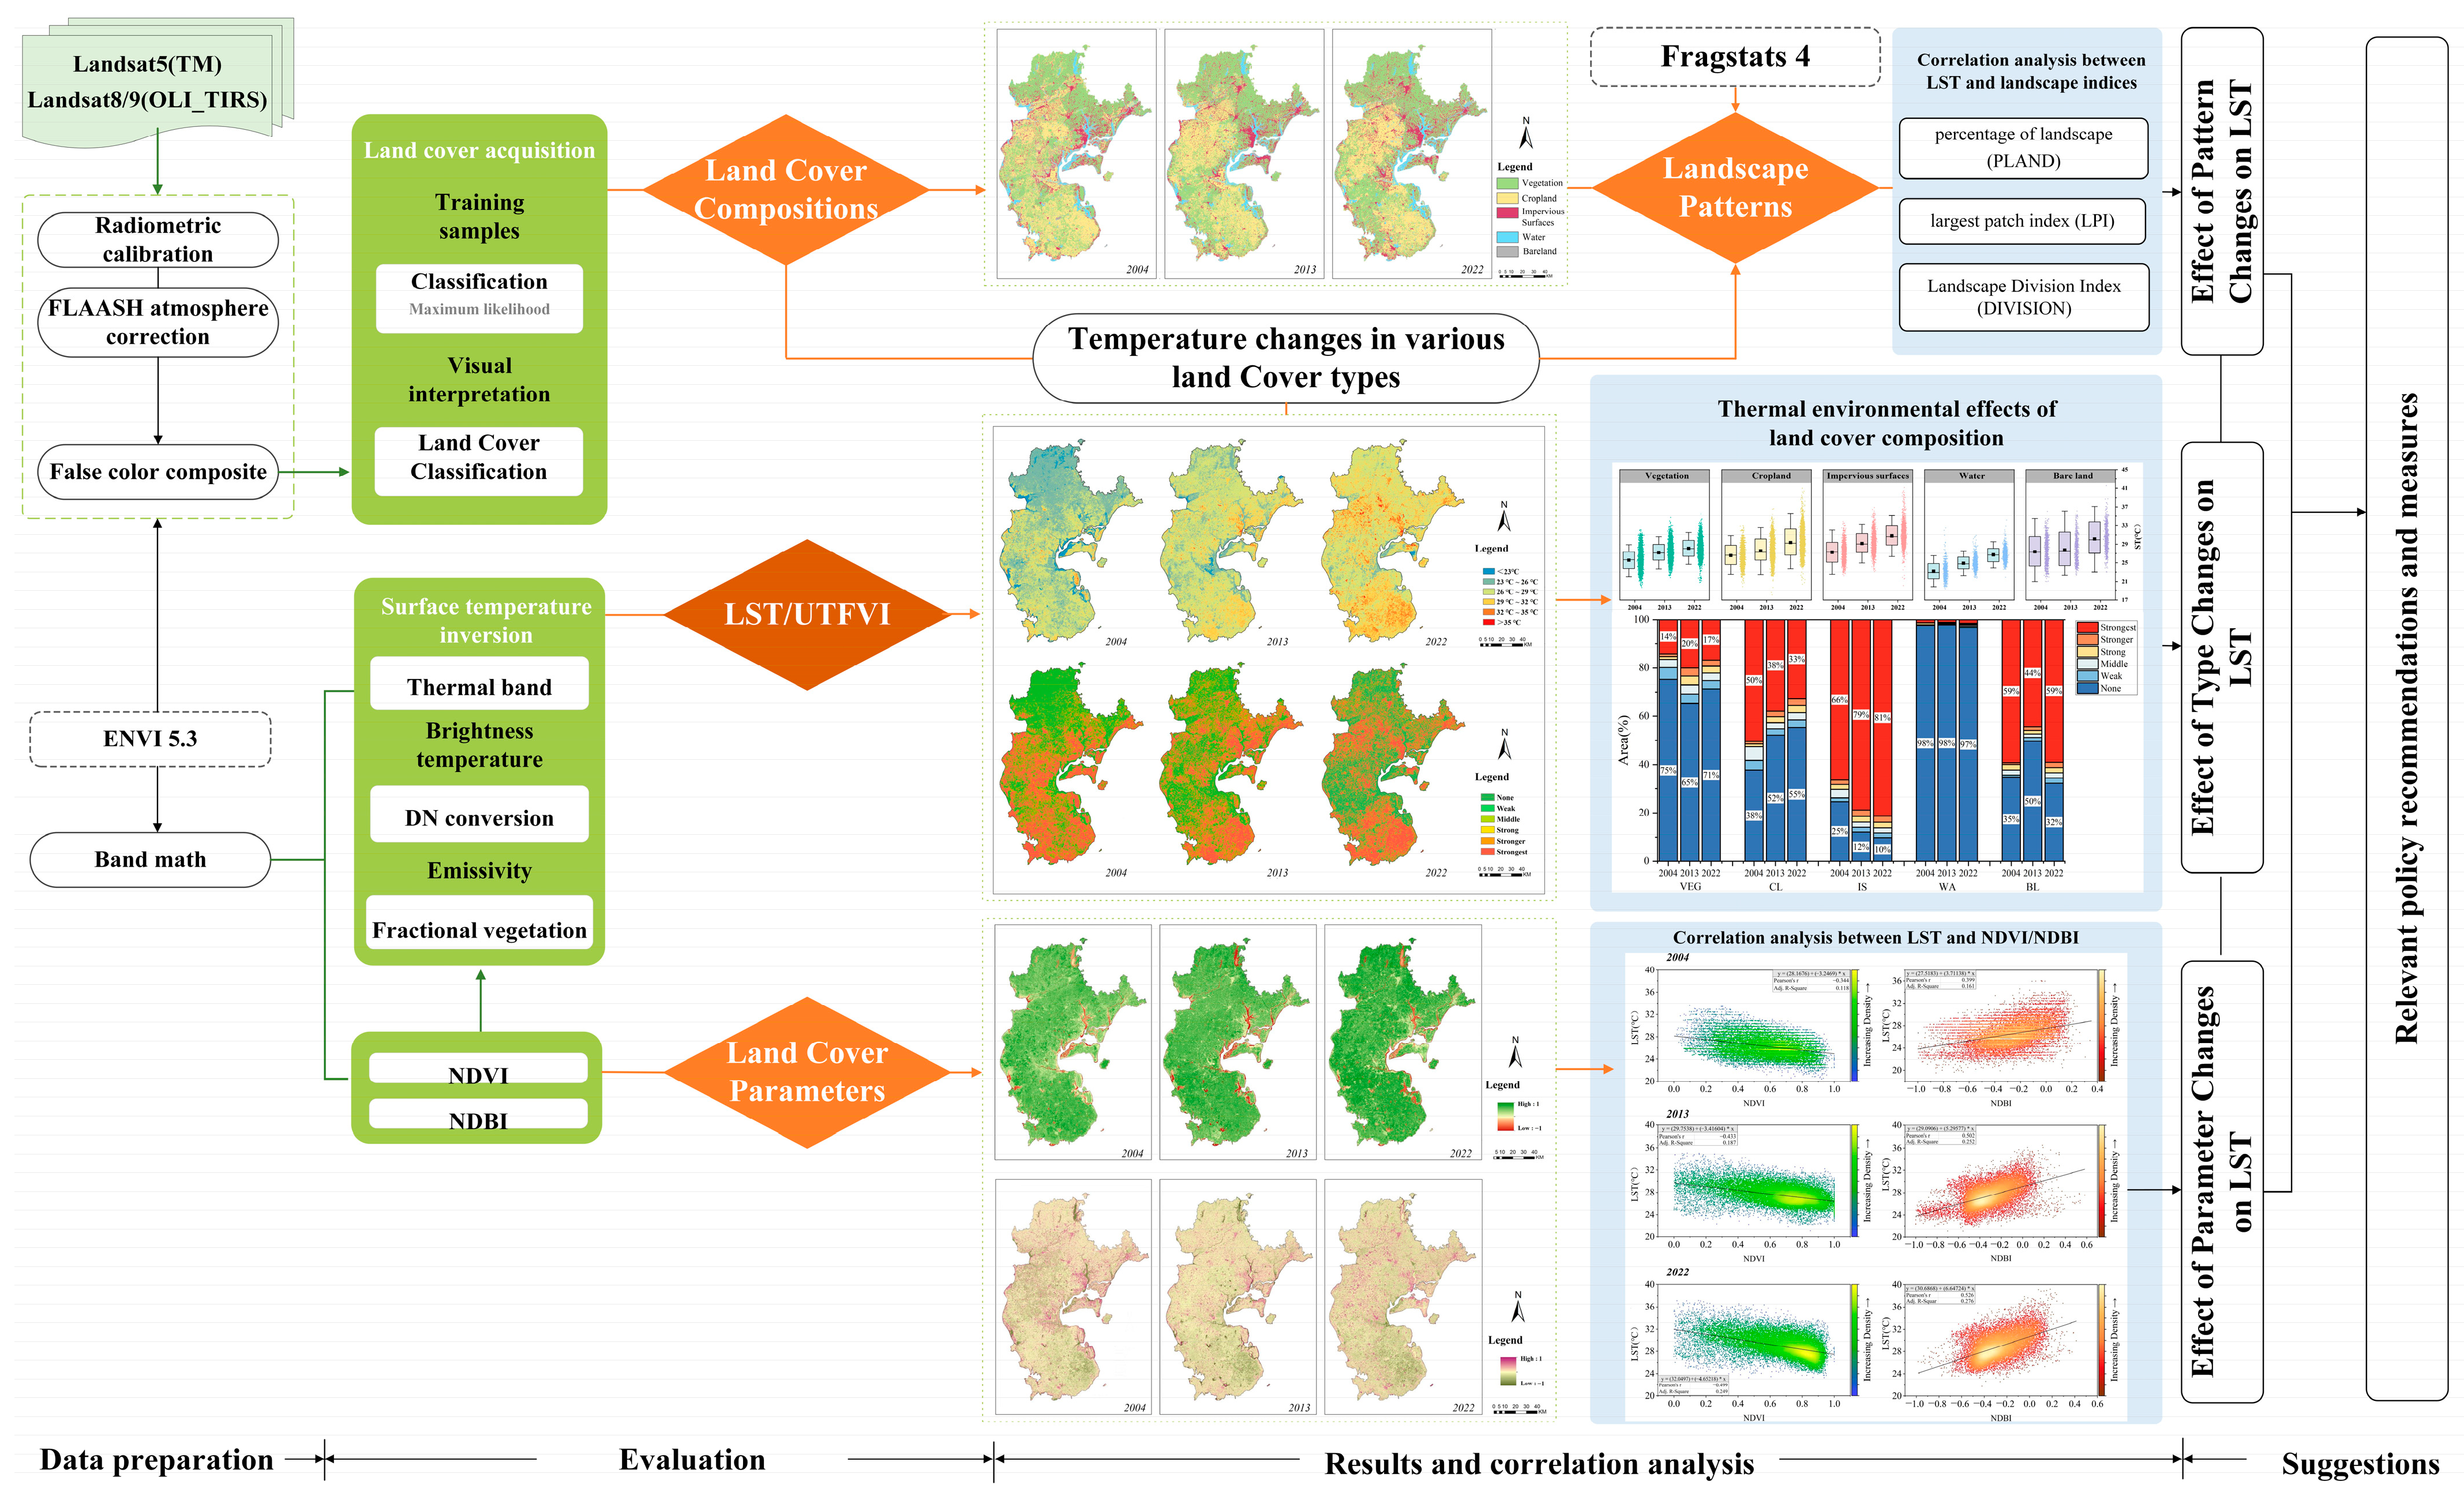
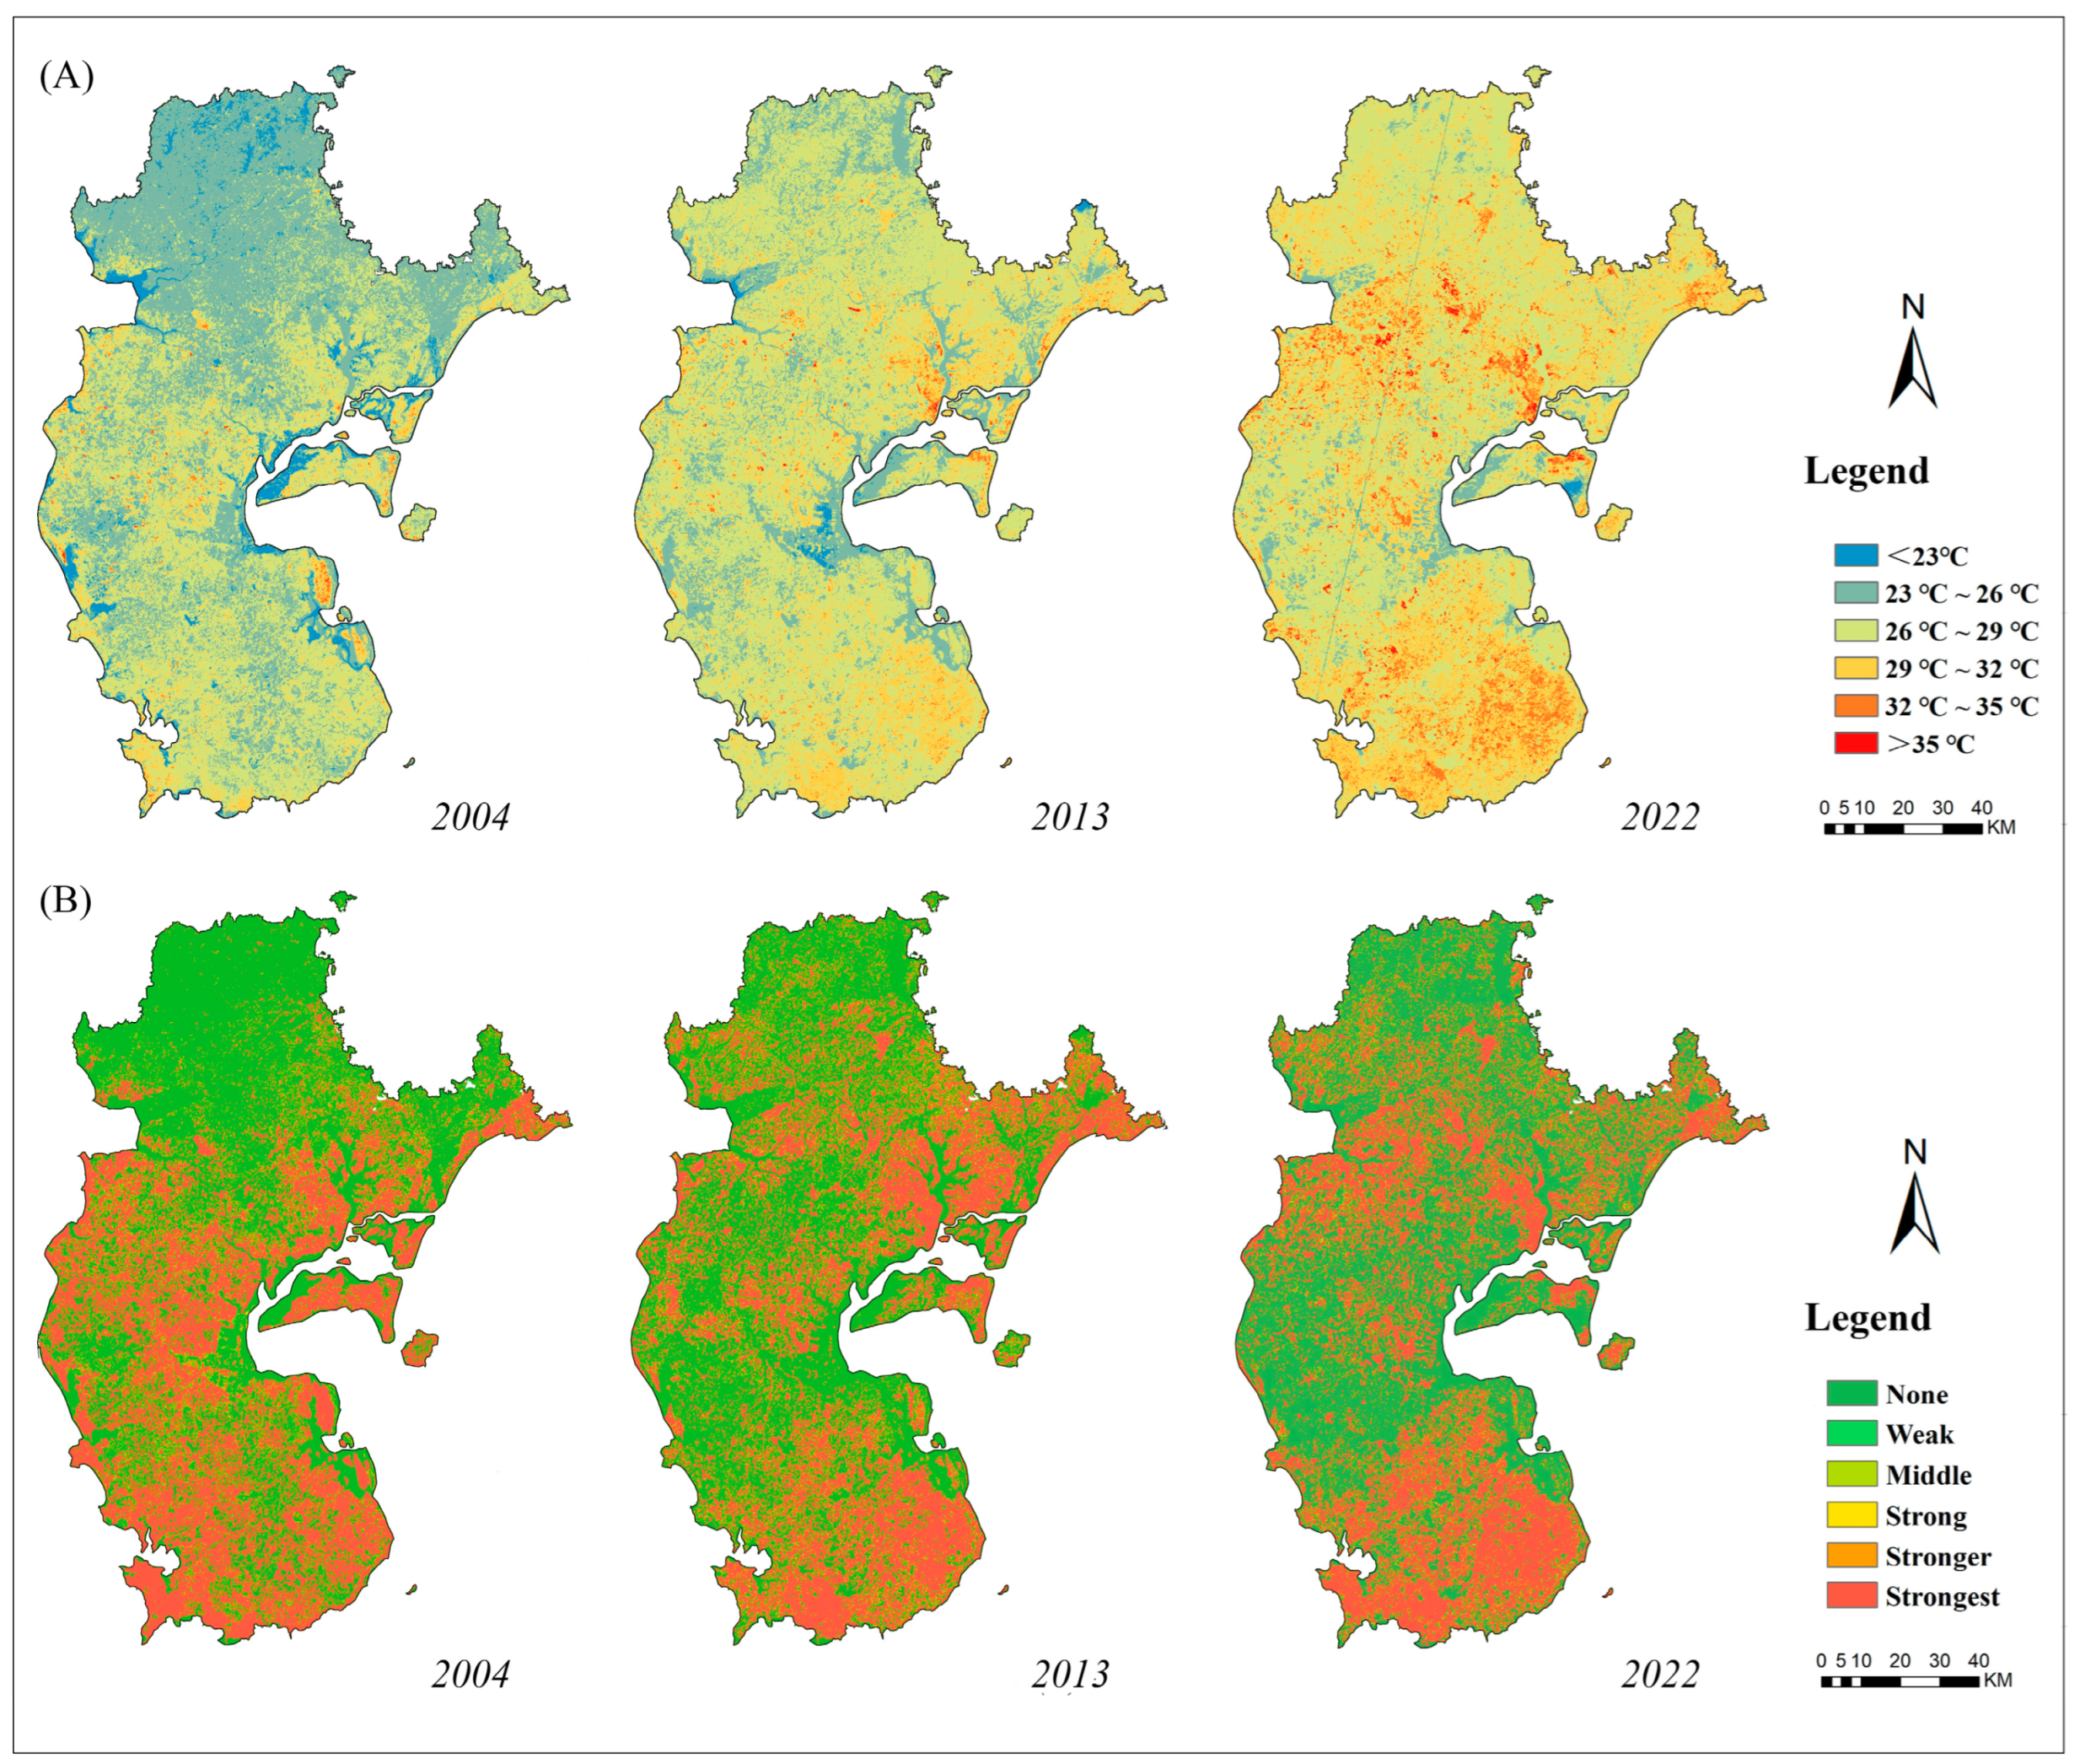
- Over the past 18 years, the thermal conditions in Zhanjiang have become more intense. This is reflected in a significant increase in the average temperature of the heat island and non-heat island regions in relation to UTFVI. The urban thermal field generally showed a trend of expansion to the north and northwest.
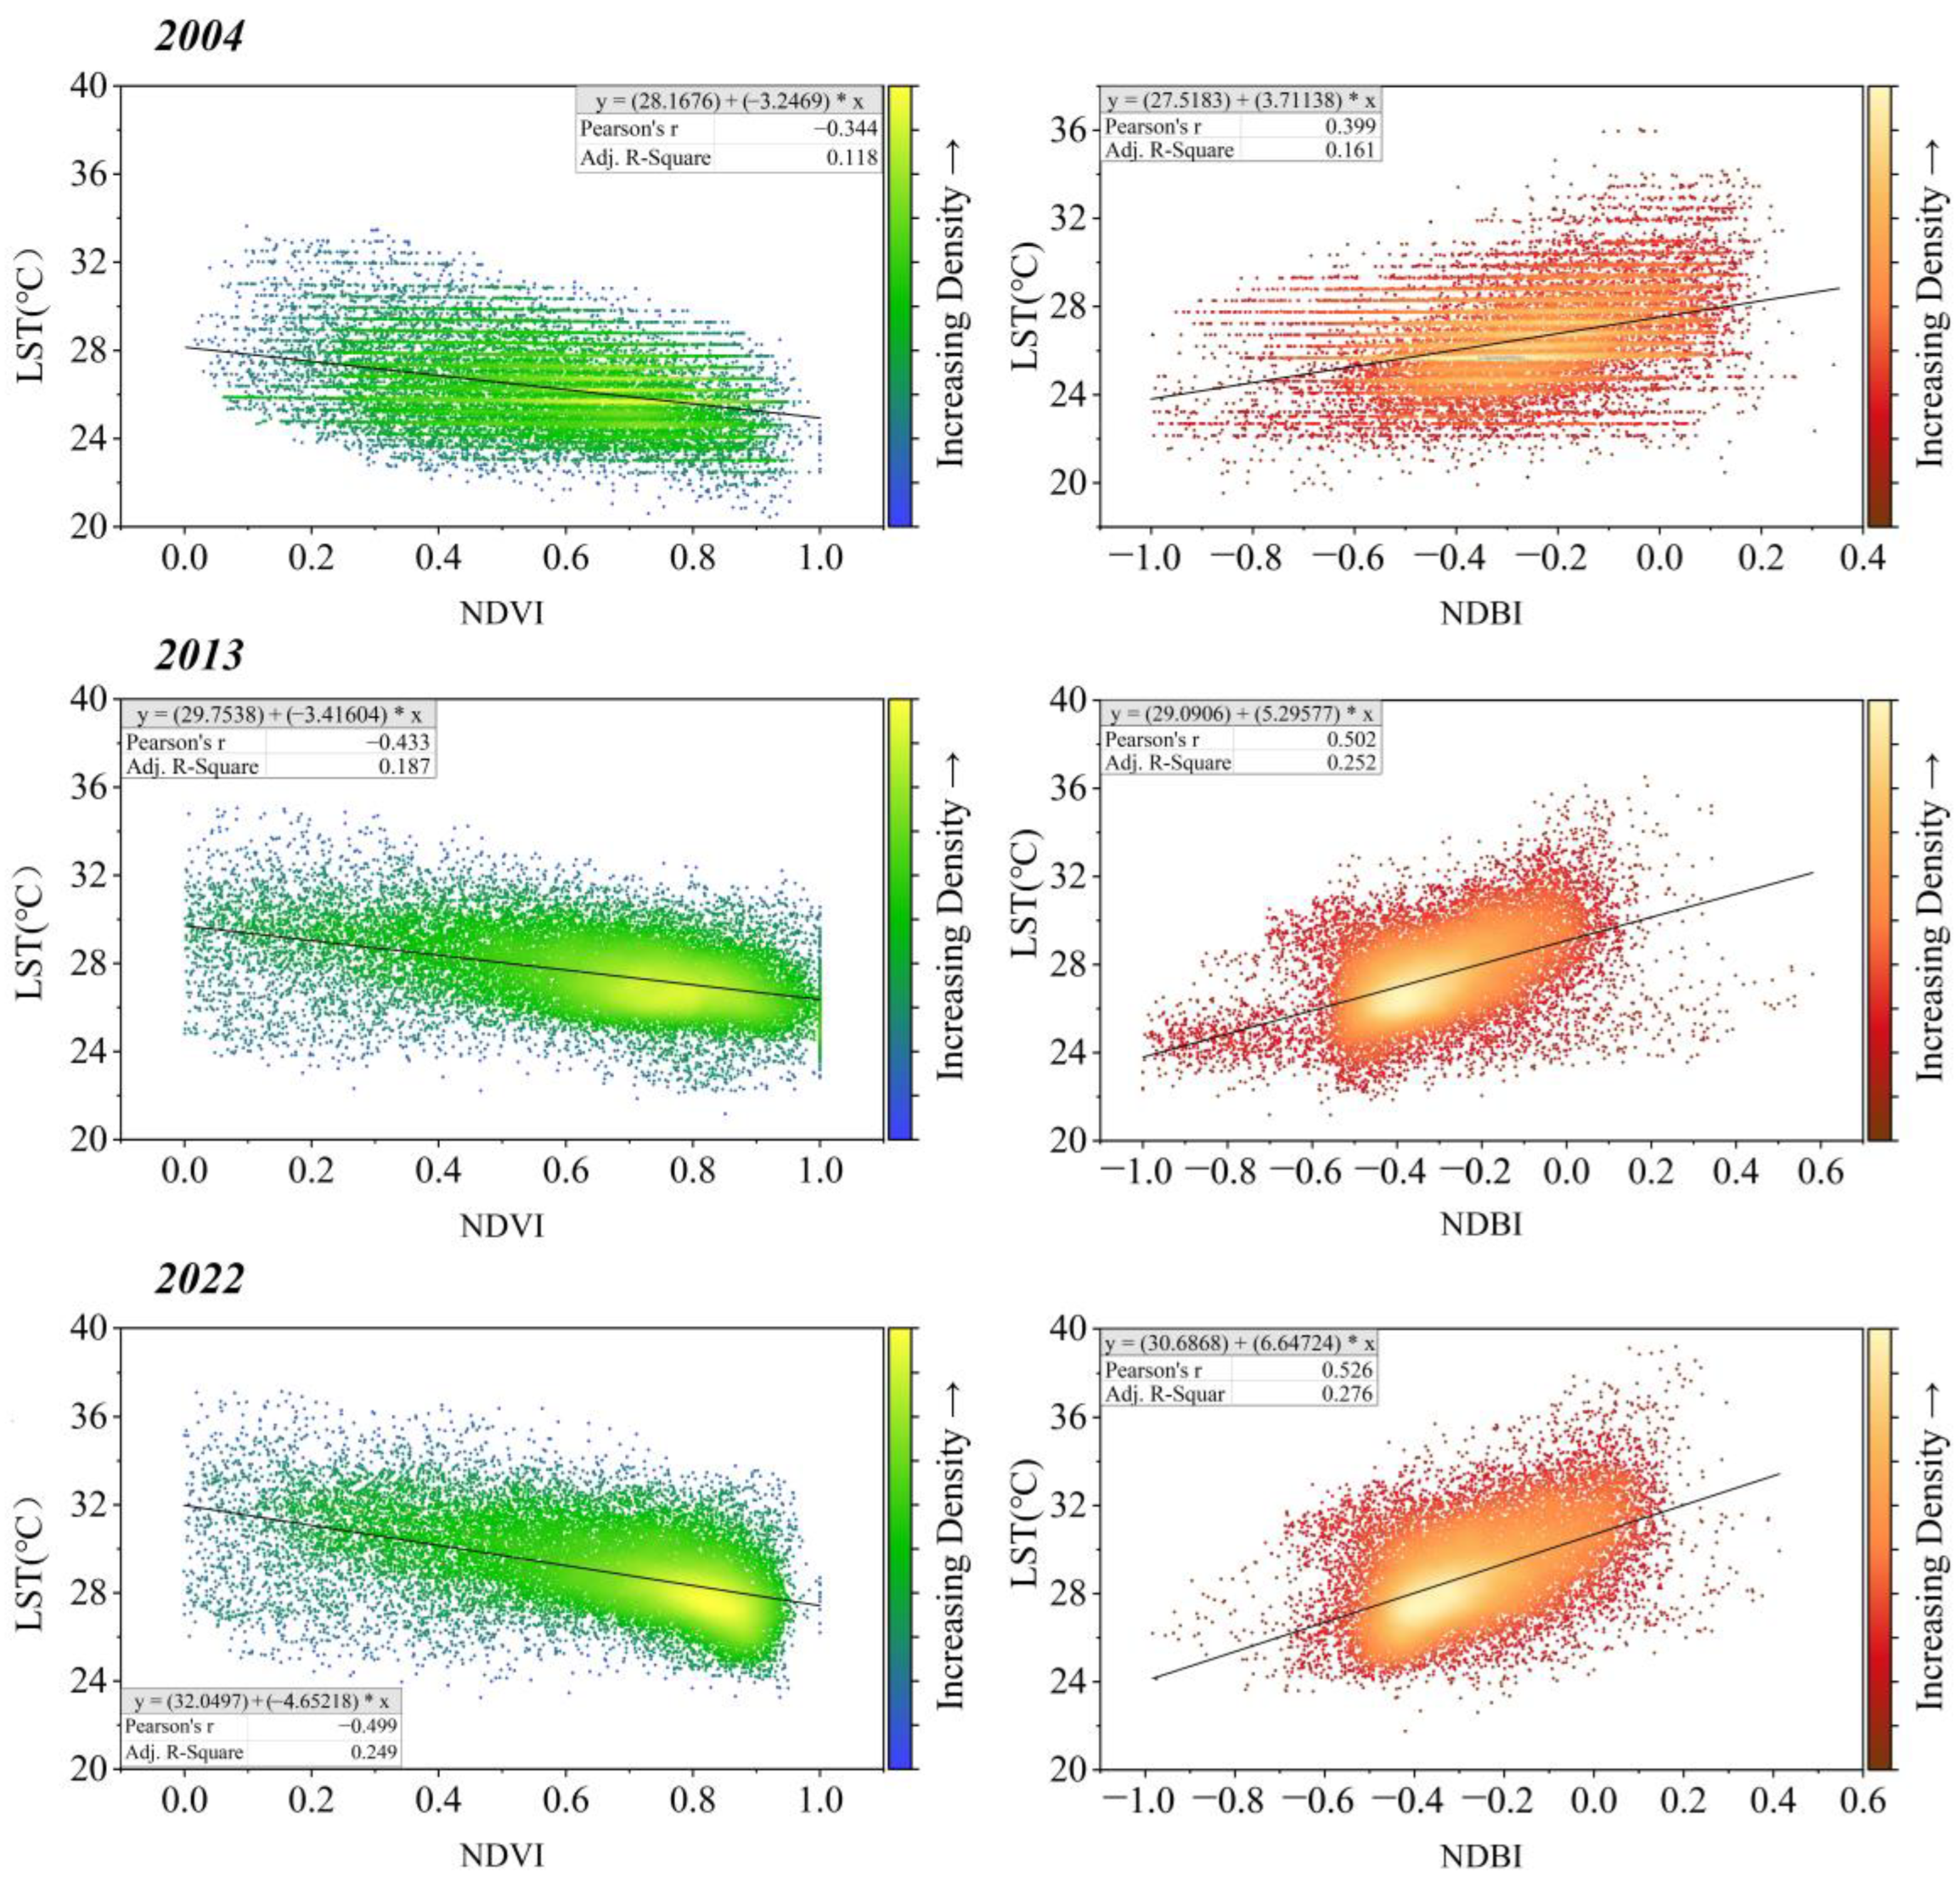
- LST (land surface temperature) is strongly linked to land cover parameters, exhibiting a negative correlation with NDVI and a positive correlation with NDBI. For every 0.1 increase in NDVI, the overall LST is reduced by approximately 0.32–0.47 °C. Conversely, in the case of NDBI, this increases by about 0.37–0.67 °C. Correlation coefficients and the analysis of the fit indicate that the warming effect of NDBI outweighs the cooling effect of NDVI.
- Correlation analysis reveals that the landscape pattern index at the type level is strongly associated with land surface temperature (LST). The percentage of land cover (PLAND) and the landscape shape index (LPI) of vegetation and water bodies are negatively correlated with LST, meaning they contribute to cooling. On the other hand, the DIVISION index shows a positive correlation with LST, indicating a warming effect, which is true for cropland and impervious surfaces. Among these factors, the DIVISION index has the most significant impact on LST.
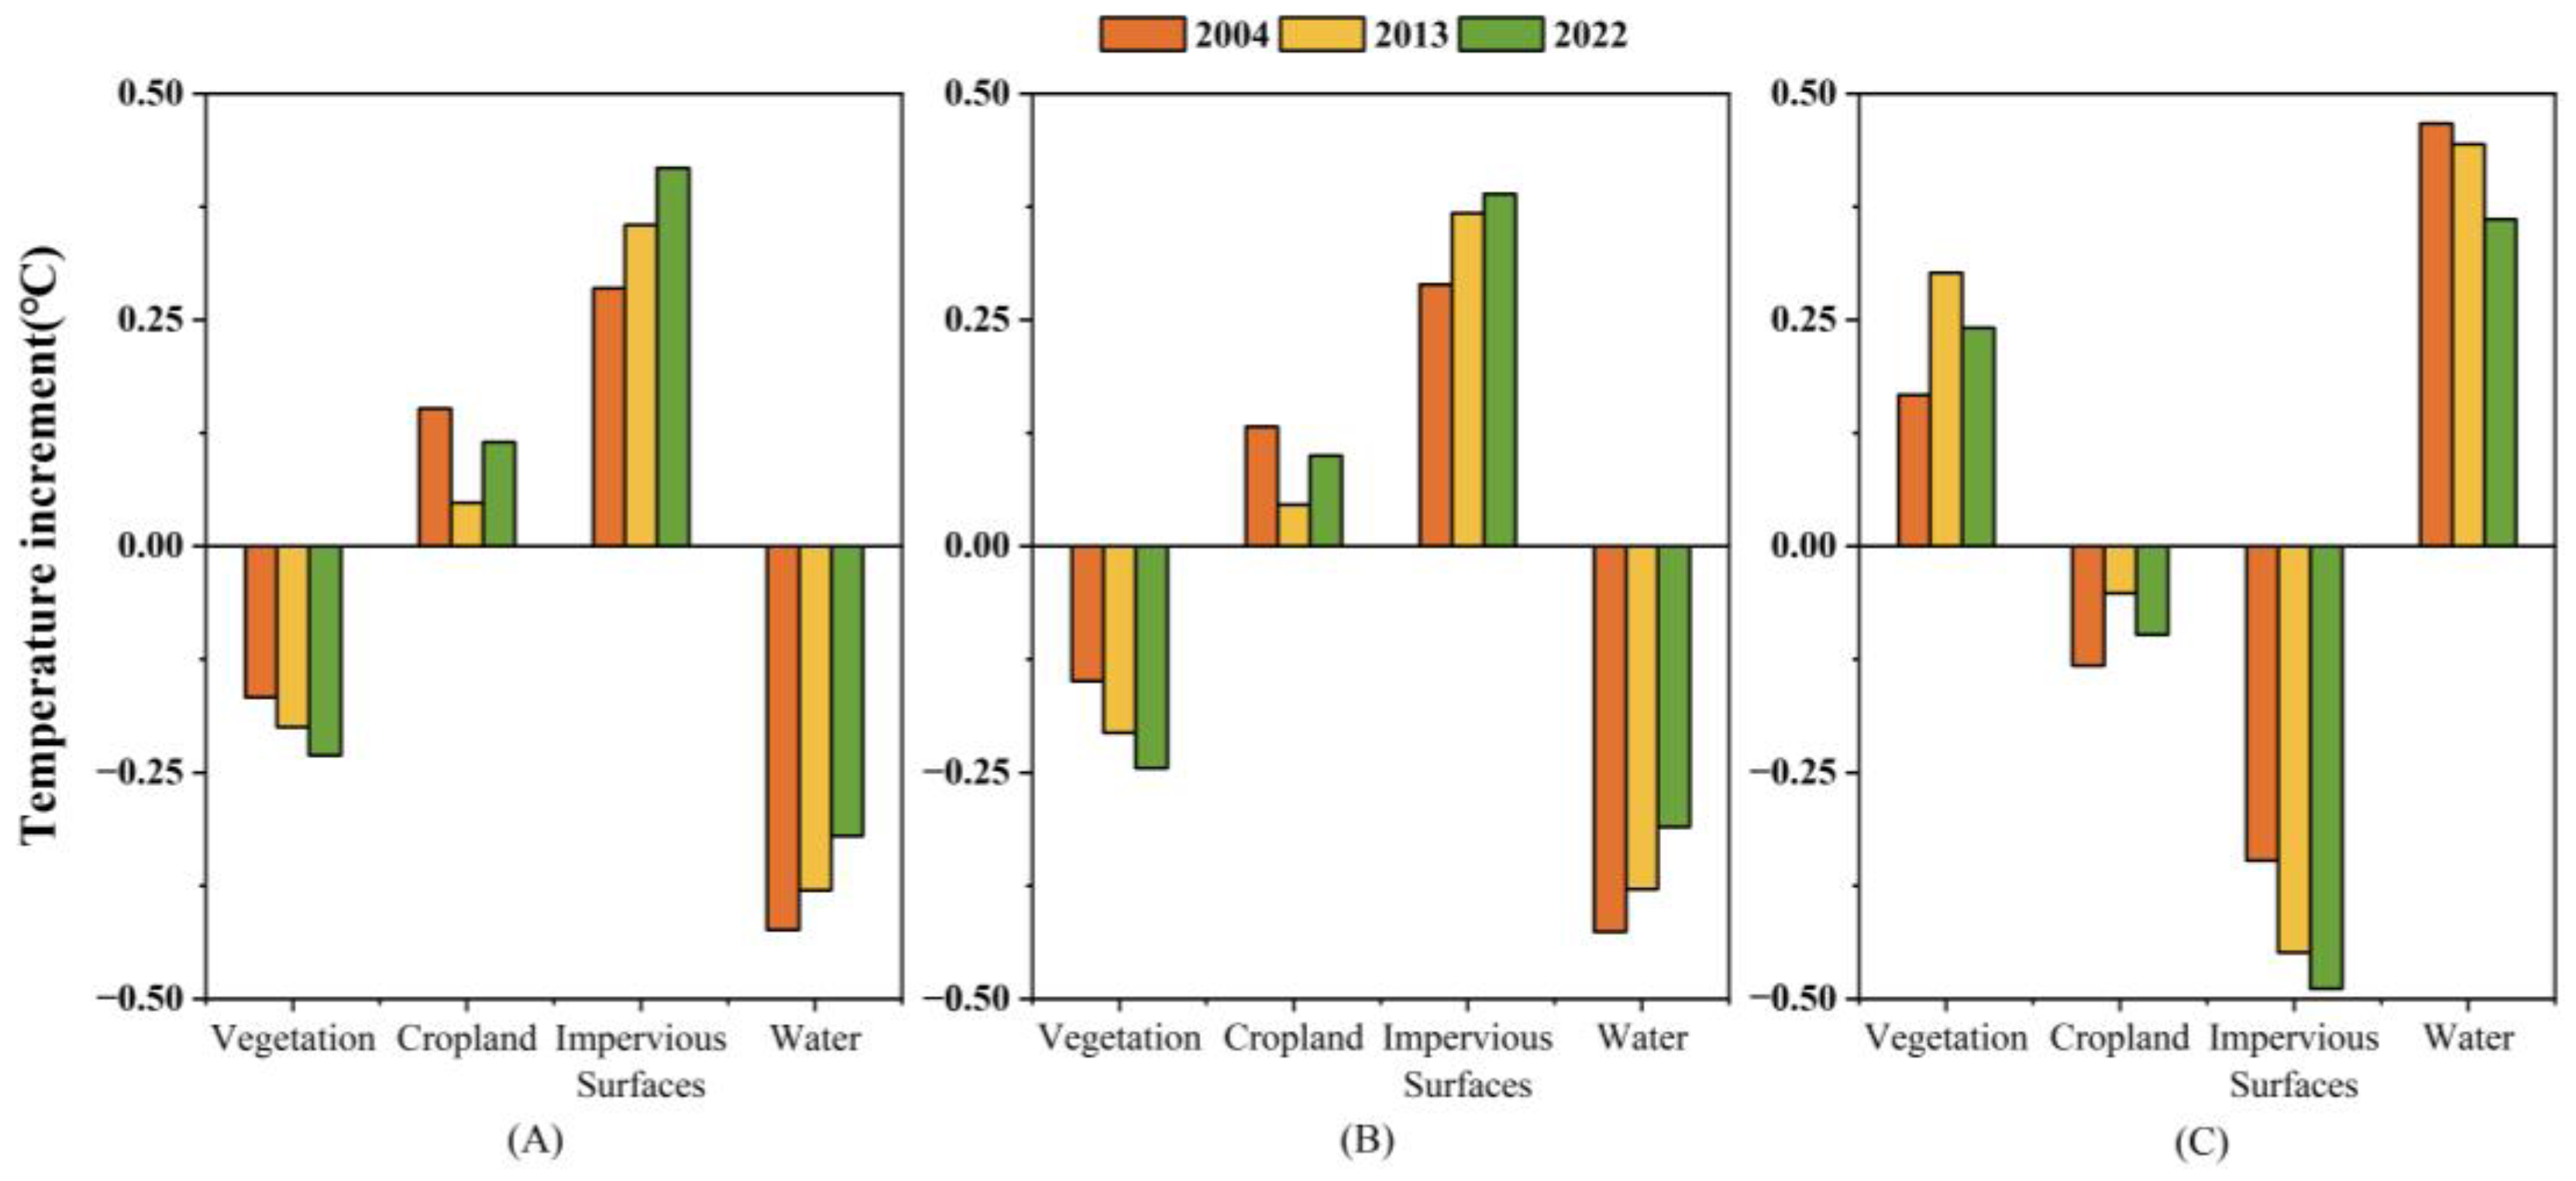
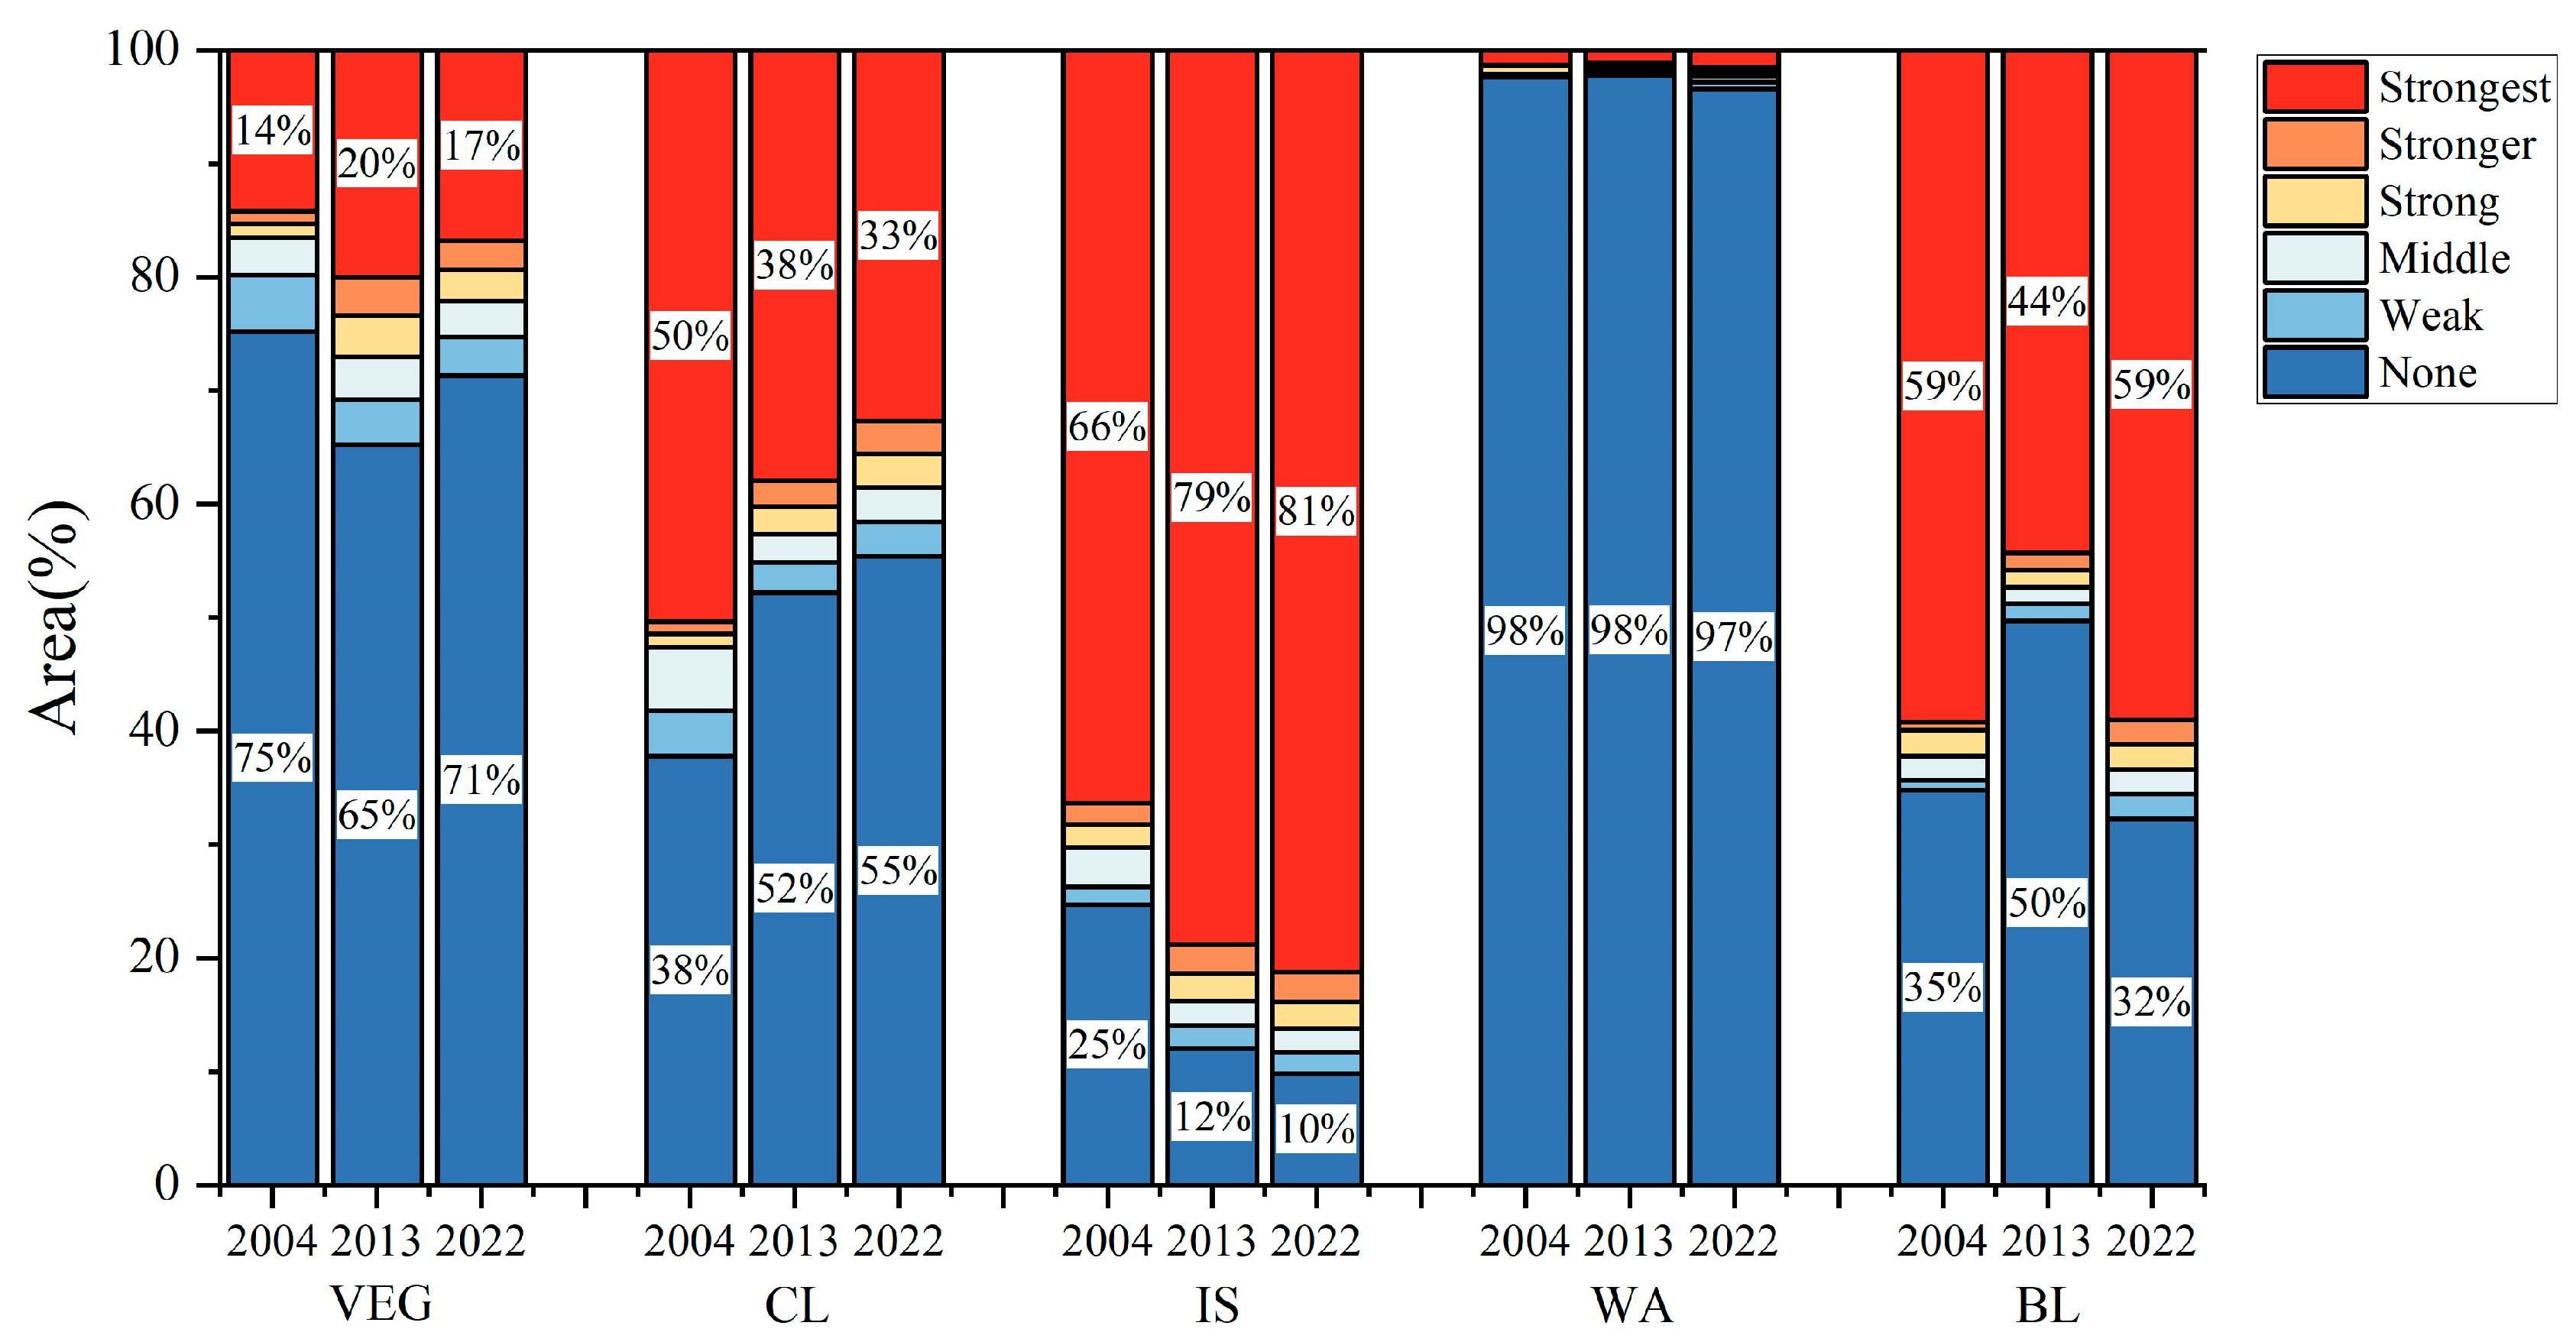
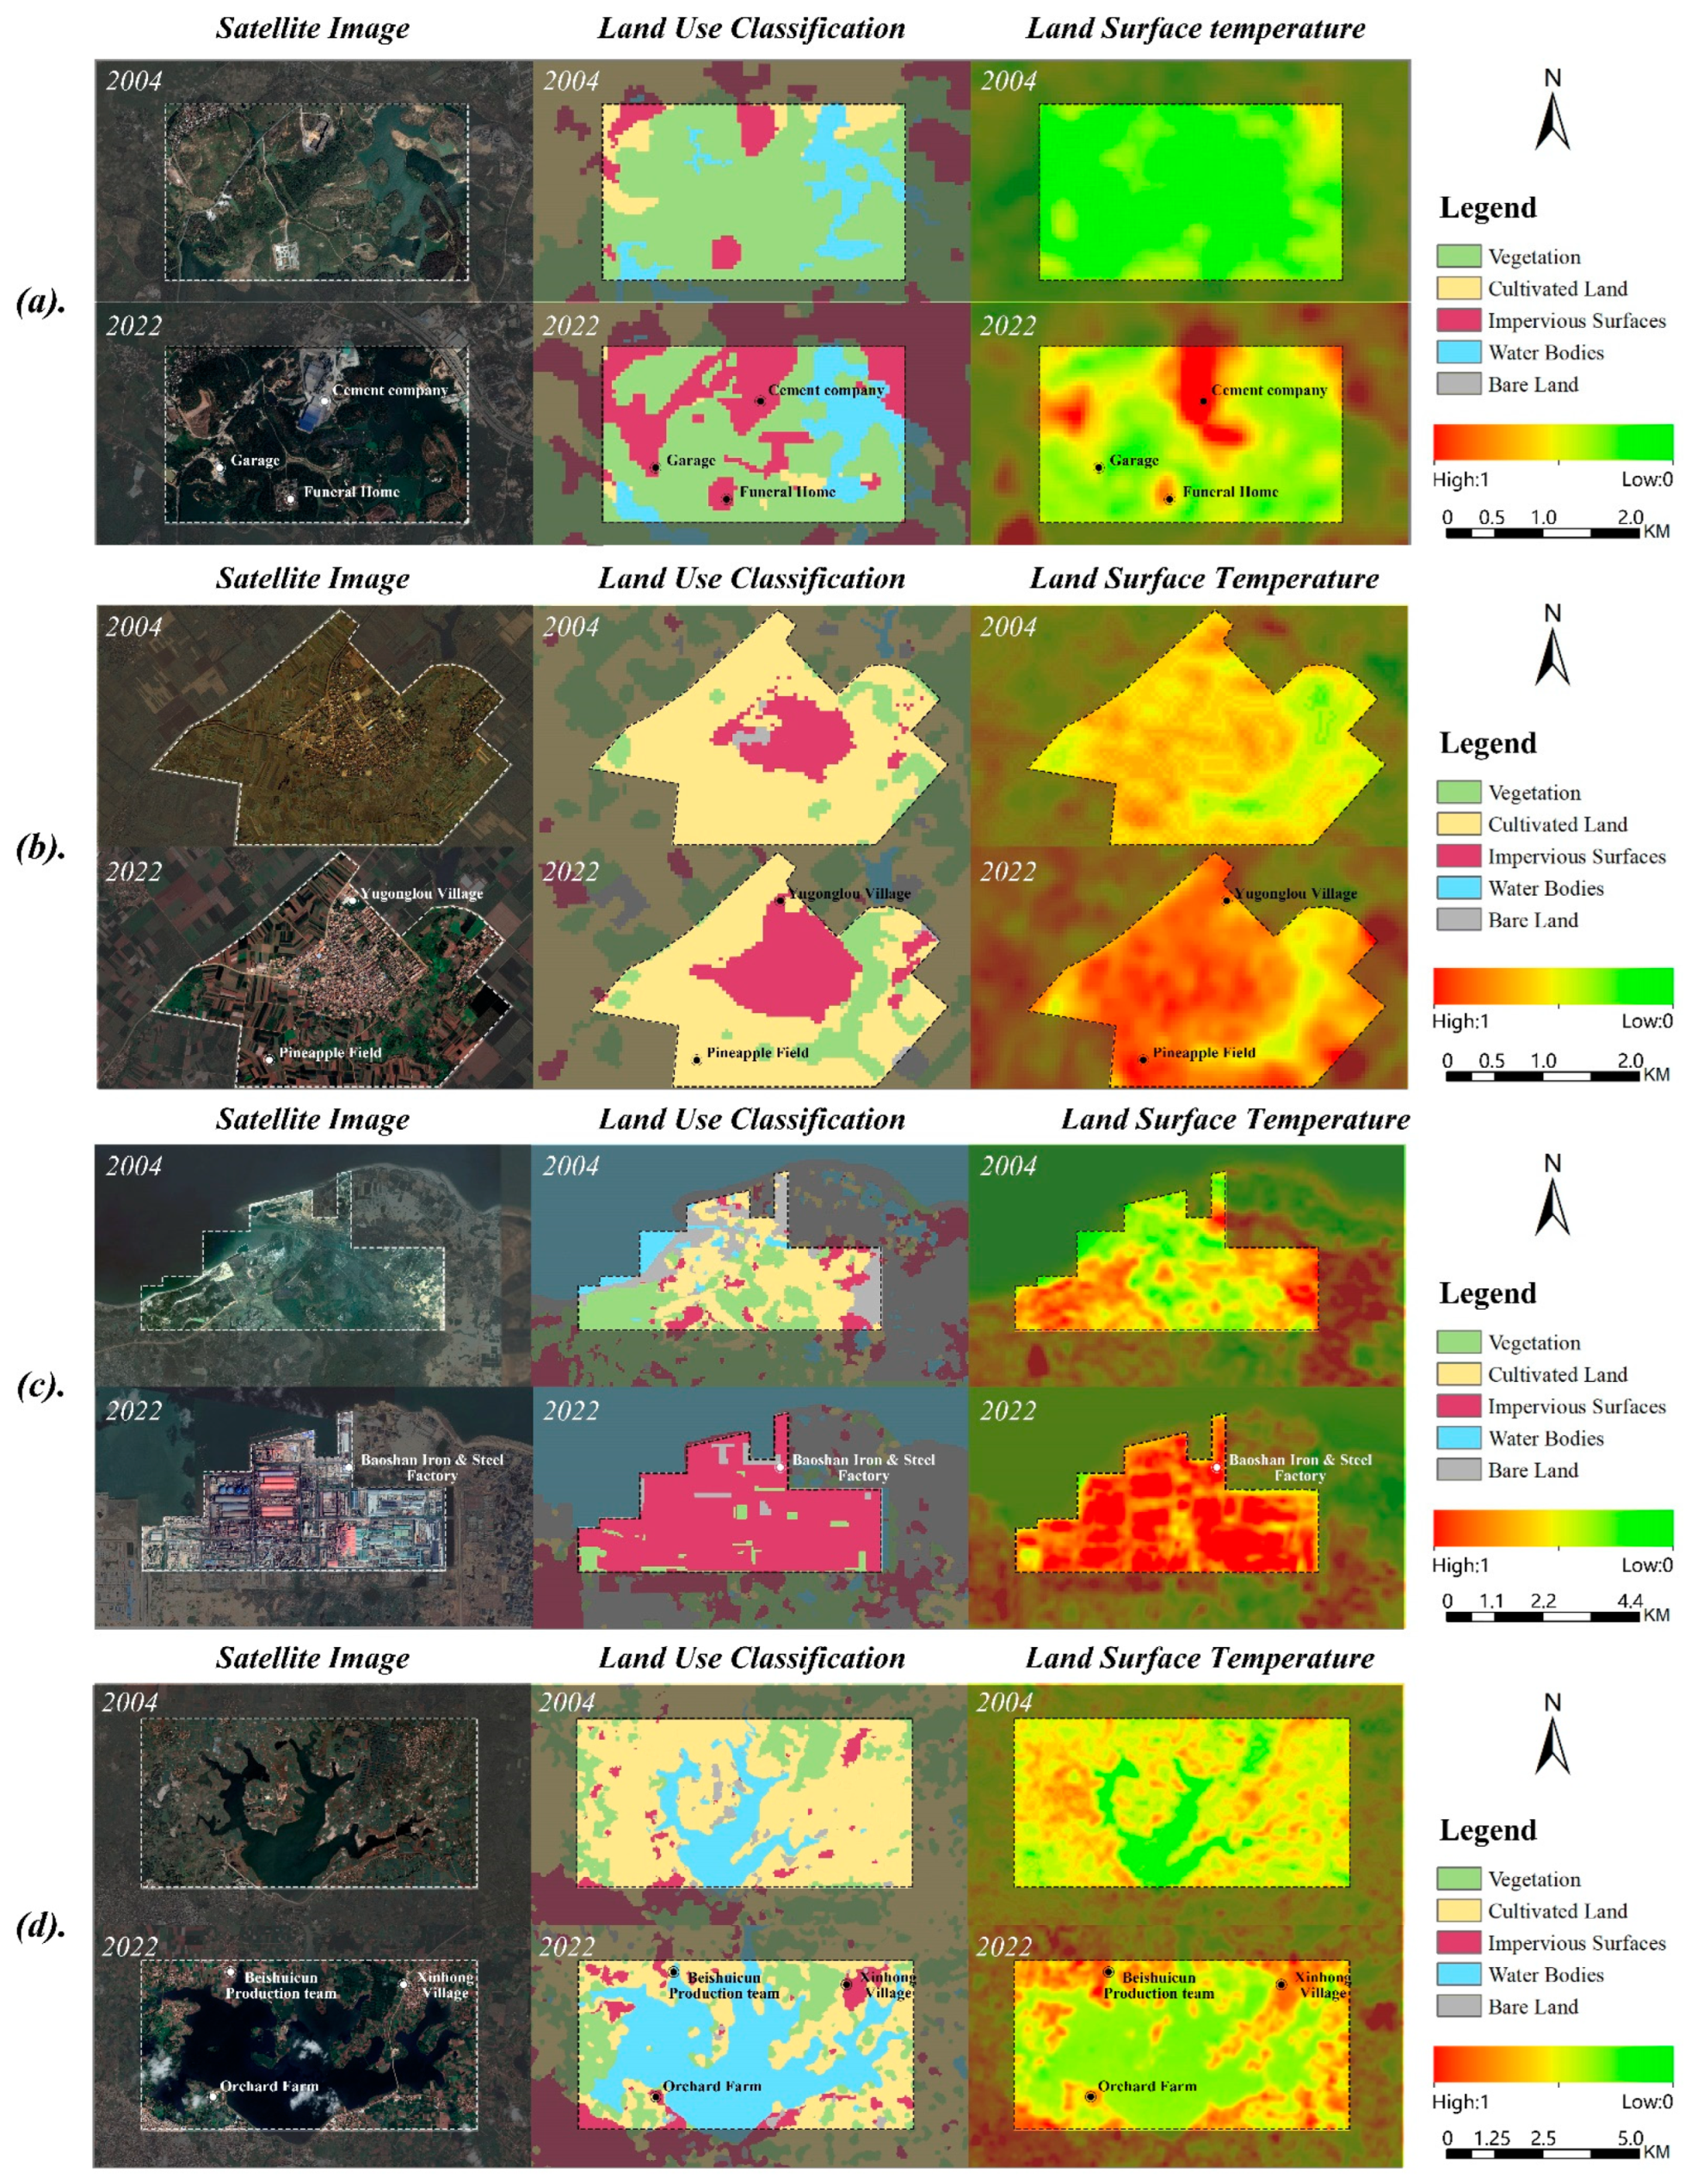
- Impervious surfaces and cropland play important roles in the intensification of the thermal field in Zhanjiang, but the impact of cropland is generally decreasing, and the impervious surfaces have gradually come to dominate the UHI. The UHI of water accounts for only about 2% of the total. However, due to the low proportion of such areas, vegetation still dominates non-UHI areas. In addition, due to the wide coverage, vegetation also makes an overall contribution of about 10% to the UHI.
Author Contributions
Funding
Institutional Review Board Statement
Informed Consent Statement
Data Availability Statement
Conflicts of Interest
References
- Hassan, T.; Zhang, J.; Prodhan, F.A.; Pangali Sharma, T.P.; Bashir, B. Surface urban heat islands dynamics in response to LULC and vegetation across South Asia (2000–2019). Remote Sens. 2021, 13, 3177. [Google Scholar] [CrossRef]
- Rinner, C.; Hussain, M. Toronto’s urban heat island—Exploring the relationship between land use and surface temperature. Remote Sens. 2011, 3, 1251–1265. [Google Scholar] [CrossRef]
- Owen, T.W.; Carlson, T.N.; Gillies, R.R. An assessment of satellite remotely-sensed land cover parameters in quantitatively describing the climatic effect of urbanization. Int. J. Remote Sens. 2010, 19, 1663–1681. [Google Scholar] [CrossRef]
- Pal, S.; Ziaul, S. Detection of land use and land cover change and land surface temperature in English Bazar urban centre. Egypt. J. Remote Sens. Space Sci. 2017, 20, 125–145. [Google Scholar] [CrossRef]
- Voogt, J.A.; Oke, T.R. Thermal remote sensing of urban climates. Remote Sens. Environ. 2003, 86, 370–384. [Google Scholar] [CrossRef]
- Yu, Y.; Li, J.; Zhu, C.; Plaza, A. Urban Impervious Surface Estimation from Remote Sensing and Social Data. Photogramm. Eng. Remote Sens. 2018, 84, 771–780. [Google Scholar] [CrossRef]
- Santamouris, M.; Cartalis, C.; Synnefa, A.; Kolokotsa, D. On the impact of urban heat island and global warming on the power demand and electricity consumption of buildings—A review. Energ. Build. 2015, 98, 119–124. [Google Scholar] [CrossRef]
- Huang, H.; Yang, H.; Chen, Y.; Chen, T.; Bai, L.; Peng, Z. Urban green space optimization based on a climate health risk appraisal—A case study of Beijing city, China. Urban For. Urban Green. 2021, 62, 127154. [Google Scholar] [CrossRef]
- Noelke, C.; McGovern, M.; Corsi, D.J.; Jimenez, M.P.; Stern, A.; Wing, I.S.; Berkman, L. Increasing ambient temperature reduces emotional well-being. Environ. Res. 2016, 151, 124–129. [Google Scholar] [CrossRef]
- Li, X.; Zhou, W.; Ouyang, Z.; Xu, W.; Zheng, H. Spatial pattern of greenspace affects land surface temperature: Evidence from the heavily urbanized Beijing metropolitan area, China. Landsc. Ecol. 2012, 27, 887–898. [Google Scholar] [CrossRef]
- Estoque, R.C.; Murayama, Y.; Myint, S.W. Effects of landscape composition and pattern on land surface temperature: An urban heat island study in the megacities of Southeast Asia. Sci. Total Environ. 2017, 577, 349–359. [Google Scholar] [CrossRef] [PubMed]
- Shen, C.; Hou, H.; Zheng, Y.; Murayama, Y.; Wang, R.; Hu, T. Prediction of the future urban heat island intensity and distribution based on landscape composition and configuration: A case study in Hangzhou. Sustain. Cities Soc. 2022, 83, 103992. [Google Scholar] [CrossRef]
- Li, Y.; Liu, Y.; Ranagalage, M.; Zhang, H.; Zhou, R. Examining land use/land cover change and the summertime surface urban heat island effect in fast-growing Greater Hefei, China: Implications for sustainable land development. SPRS Int. J. Geo-Inf. 2020, 9, 568. [Google Scholar] [CrossRef]
- Dai, Z.; Guldmann, J.; Hu, Y. Spatial regression models of park and land-use impacts on the urban heat island in central Beijing. Sci. Total Environ. 2018, 626, 1136–1147. [Google Scholar] [CrossRef] [PubMed]
- Chen, X.; Zhang, Y. Impacts of urban surface characteristics on spatiotemporal pattern of land surface temperature in Kunming of China. Sustain. Cities Soc. 2017, 32, 87–99. [Google Scholar] [CrossRef]
- Chen, H.; Deng, Q.; Zhou, Z.; Ren, Z.; Shan, X. Influence of land cover change on spatio-temporal distribution of urban heat island—A case in Wuhan main urban area. Sustain. Cities Soc. 2022, 79, 103715. [Google Scholar] [CrossRef]
- Wang, R.; Hou, H.; Murayama, Y.; Derdouri, A. Spatiotemporal analysis of land use/cover patterns and their relationship with land surface temperature in Nanjing, China. Remote Sens. 2020, 12, 440. [Google Scholar] [CrossRef]
- Wang, H.; Zhang, Y.; Tsou, J.; Li, Y. Surface urban heat island analysis of Shanghai (China) based on the change of land use and land cover. Sustainability 2017, 9, 1538. [Google Scholar] [CrossRef]
- Xiong, Y.; Huang, S.; Chen, F.; Ye, H.; Wang, C.; Zhu, C. The impacts of rapid urbanization on the thermal environment: A remote sensing study of Guangzhou, South China. Remote Sens. 2012, 4, 2033–2056. [Google Scholar] [CrossRef]
- Li, W.; Bai, Y.; Chen, Q.; He, K.; Ji, X.; Han, C. Discrepant impacts of land use and land cover on urban heat islands: A case study of Shanghai, China. Ecol. Indic. 2014, 47, 171–178. [Google Scholar] [CrossRef]
- Yu, W.; Shi, J.; Fang, Y.; Xiang, A.; Li, X.; Hu, C.; Ma, M. Exploration of urbanization characteristics and their effect on the urban thermal environment in Chengdu, China. Build. Environ. 2022, 219, 109150. [Google Scholar] [CrossRef]
- Du, C.; Song, P.; Wang, K.; Li, A.; Hu, Y.; Zhang, K.; Jia, X.; Feng, Y.; Wu, M.; Qu, K.; et al. Investigating the trends and drivers between urbanization and the land surface temperature: A case study of Zhengzhou, China. Sustainability 2022, 14, 13845. [Google Scholar] [CrossRef]
- Du, S.; Xiong, Z.; Wang, Y.; Guo, L. Quantifying the multilevel effects of landscape composition and configuration on land surface temperature. Remote Sens. Environ. 2016, 178, 84–92. [Google Scholar] [CrossRef]
- Hou, H.; Estoque, R.C. Detecting cooling effect of landscape from composition and configuration: An urban heat island study on Hangzhou. Urban For. Urban Green. 2020, 53, 126719. [Google Scholar] [CrossRef]
- Peng, J.; Hu, Y.; Dong, J.; Liu, Q.; Liu, Y. Quantifying spatial morphology and connectivity of urban heat islands in a megacity: A radius approach. Sci. Total Environ. 2020, 714, 136792. [Google Scholar] [CrossRef] [PubMed]
- Hamoodi, M.N.; Corner, R.; Dewan, A. Thermophysical behaviour of LULC surfaces and their effect on the urban thermal environment. J. Spat. Sci. 2019, 64, 111–130. [Google Scholar] [CrossRef]
- Duncan, J.M.A.; Boruff, B.; Saunders, A.; Sun, Q.; Hurley, J.; Amati, M. Turning down the heat: An enhanced understanding of the relationship between urban vegetation and surface temperature at the city scale. Sci. Total Environ. 2019, 656, 118–128. [Google Scholar] [CrossRef] [PubMed]
- Wu, Q.; Tan, J.; Guo, F.; Li, H.; Chen, S. Multi-scale relationship between land surface temperature and landscape pattern based on Wavelet Coherence: The case of Metropolitan Beijing, China. Remote Sens. 2019, 11, 3021. [Google Scholar] [CrossRef]
- Liu, S.; Li, X.; Chen, L.; Zhao, Q.; Zhao, C.; Hu, X.; Li, J. A new approach to investigate the spatially heterogeneous in the cooling effects of landscape pattern. Land 2022, 11, 239. [Google Scholar] [CrossRef]
- Wu, Y.; Hou, H.; Wang, R.; Murayama, Y.; Wang, L.; Hu, T. Effects of landscape patterns on the morphological evolution of surface urban heat island in Hangzhou during 2000–2020. Sustain. Cities Soc. 2022, 79, 103717. [Google Scholar] [CrossRef]
- Estoque, R.C.; Murayama, Y. Monitoring surface urban heat island formation in a tropical mountain city using Landsat data (1987–2015). ISPRS J. Photogramm. 2017, 133, 18–29. [Google Scholar] [CrossRef]
- Wu, Z.; Zhang, Y. Spatial variation of urban thermal environment and its relation to green space patterns: Implication to sustainable landscape planning. Sustainability 2018, 10, 2249. [Google Scholar] [CrossRef]
- Athukorala, D.; Murayama, Y. Spatial variation of land use/cover composition and impact on surface urban heat island in a tropical sub-Saharan city of Accra, Ghana. Sustainability 2020, 12, 7953. [Google Scholar] [CrossRef]
- Wang, L.; Hou, H.; Weng, J. Ordinary least squares modelling of urban heat island intensity based on landscape composition and configuration: A comparative study among three megacities along the Yangtze River. Sustain. Cities Soc. 2020, 62, 102381. [Google Scholar] [CrossRef]
- Zhou, W.; Cao, F. Effects of changing spatial extent on the relationship between urban forest patterns and land surface temperature. Ecol. Indic. 2020, 109, 105778. [Google Scholar] [CrossRef]
- Anees, M.M.; Mann, D.; Sharma, M.; Banzhaf, E.; Joshi, P.K. Assessment of Urban Dynamics to Understand Spatiotemporal Differentiation at Various Scales Using Remote Sensing and Geospatial Tools. Remote Sens. 2020, 12, 1306. [Google Scholar] [CrossRef]
- Song, J.; Du, S.; Feng, X.; Guo, L. The relationships between landscape compositions and land surface temperature: Quantifying their resolution sensitivity with spatial regression models. Landsc. Urban Plan. 2014, 123, 145–157. [Google Scholar] [CrossRef]
- Sobrino, J.A.; Jiménez-Muñoz, J.C.; Paolini, L. Land surface temperature retrieval from Landsat TM 5. Remote Sens. Environ. 2004, 90, 434–440. [Google Scholar] [CrossRef]
- Chander, G.; Markham, B.L.; Helder, D.L. Summary of current radiometric calibration coefficients for Landsat MSS, TM, ETM+, and EO-1 ALI sensors. Remote Sens. Environ. 2009, 113, 893–903. [Google Scholar] [CrossRef]
- Malaret, E.; Bartolucci, L.; Lozano, D.; Antlta, P.; McGillem, C. Landsat-4 and Landsat-5 thematic mapper data quality analysis. Photogramm. Eng. Remote Sens. 1985, 51, 1407–1416. [Google Scholar]
- Barsi, J.; Schott, J.; Hook, S.; Raqueno, N.; Markham, B.; Radocinski, R. Landsat-8 thermal infrared sensor (TIRS) vicarious radiometric calibration. Remote Sens. 2014, 6, 11607–11626. [Google Scholar] [CrossRef]
- Arabi Aliabad, F.; Zare, M.; Ghafarian Malamiri, H. Comparison of the accuracy of daytime land surface temperature retrieval methods using Landsat 8 images in arid regions. Infrared Phys Techn. 2021, 115, 103692. [Google Scholar] [CrossRef]
- Silvestri, M.; Rabuffi, F.; Pisciotta, A.; Musacchio, M.; Diliberto, I.S.; Spinetti, C.; Lombardo, V.; Colini, L.; Buongiorno, M.F. Analysis of thermal anomalies in volcanic areas using multiscale and multitemporal monitoring; Vulcano Island test case. Remote Sens. 2019, 11, 134. [Google Scholar] [CrossRef]
- Hua, L.; Wang, H.; Zhang, H.; Sun, F.; Li, L.; Tang, L. A new technique for impervious surface mapping and its spatio-temporal changes from Landsat and Sentinel-2 images. Sustainability 2023, 15, 7947. [Google Scholar] [CrossRef]
- Hidalgo-García, D.; Arco-Díaz, J. Modeling the surface urban heat island (SUHI) to study of its relationship with variations in the thermal field and with the indices of land use in the metropolitan area of Granada (Spain). Sustain. Cities Soc. 2022, 87, 104166. [Google Scholar] [CrossRef]
- Anderson, J.R. Land use classification schemes used in selected recent geographic applications of remote sensing. Photogramm. Eng. 1971, 37, 379–387. [Google Scholar]
- Saha, S.; Saha, A.; Das, M.; Saha, A.; Sarkar, R.; Das, A. Analyzing spatial relationship between land use/land cover (LULC) and land surface temperature (LST) of three urban agglomerations (UAs) of Eastern India. Remote Sens. Appl. Soc. Environ. 2021, 22, 100507. [Google Scholar] [CrossRef]
- Khan, M.S.; Ullah, S.; Chen, L. Comparison on land-use/land-cover indices in explaining land surface temperature variations in the city of Beijing, China. Land 2021, 10, 1018. [Google Scholar] [CrossRef]
- Fonseka, H.P.U.; Zhang, H.; Sun, Y.; Su, H.; Lin, H.; Lin, Y. Urbanization and its impacts on land surface temperature in Colombo Metropolitan Area, Sri Lanka, from 1988 to 2016. Remote Sens. 2019, 11, 957. [Google Scholar] [CrossRef]
- Lane, P.N.J.; Morris, J.; Ningnan, Z.; Guangyi, Z.; Guoyi, Z.; Daping, X. Water balance of tropical eucalypt plantations in south-eastern China. Agric. For. Meteorol. 2004, 124, 253–267. [Google Scholar] [CrossRef]
- Rashid, N.; Alam, J.A.M.M.; Chowdhury, M.A.; Islam, S.L.U. Impact of landuse change and urbanization on urban heat island effect in Narayanganj city, Bangladesh: A remote sensing-based estimation. Environ. Chall. 2022, 8, 100571. [Google Scholar] [CrossRef]
- Sekertekin, A.; Zadbagher, E. Simulation of future land surface temperature distribution and evaluating surface urban heat island based on impervious surface area. Ecol. Indic. 2021, 122, 107230. [Google Scholar] [CrossRef]
- Silva, A.G.L.; Torres, M.C.A. Proposing an effective and inexpensive tool to detect urban surface temperature changes associated with urbanization processes in small cities. Build. Environ. 2021, 192, 107634. [Google Scholar] [CrossRef]
- Sun, Z.; Li, Z.; Zhong, J. Analysis of the impact of landscape patterns on urban heat islands: A case study of Chengdu, China. Int. J. Environ. Res. Public Health 2022, 19, 13297. [Google Scholar] [CrossRef]
- Zhang, Y.; Wang, Y.; Ding, N.; Yang, X. Spatial pattern impact of impervious surface density on urban heat island effect: A case study in Xuzhou, China. Land 2022, 11, 2135. [Google Scholar] [CrossRef]
- Azhdari, A.; Soltani, A.; Alidadi, M. Urban morphology and landscape structure effect on land surface temperature: Evidence from Shiraz, a semi-arid city. Sustain. Cities Soc. 2018, 41, 853–864. [Google Scholar] [CrossRef]
- Portela, C.I.; Massi, K.G.; Rodrigues, T.; Alcântara, E. Impact of urban and industrial features on land surface temperature: Evidences from satellite thermal indices. Sustain. Cities Soc. 2020, 56, 102100. [Google Scholar] [CrossRef]
- Tariq, A.; Mumtaz, F. Modeling spatio-temporal assessment of land use land cover of Lahore and its impact on land surface temperature using multi-spectral remote sensing data. Environ. Sci. Pollut. Res. Int. 2023, 30, 23908–23924. [Google Scholar] [CrossRef] [PubMed]
- Amir Siddique, M.; Boqing, F.; Dongyun, L. Modeling the impact and risk assessment of urbanization on urban heat island and thermal comfort level of Beijing City, China (2005–2020). Sustainability 2023, 15, 6043. [Google Scholar] [CrossRef]
- Zhu, D.; Zhou, X.; Cheng, W. Water effects on urban heat islands in summer using WRF-UCM with gridded urban canopy parameters—A case study of Wuhan. Build. Environ. 2022, 225, 109528. [Google Scholar] [CrossRef]
- Guo, L.; Liu, R.; Men, C.; Wang, Q.; Miao, Y.; Zhang, Y. Quantifying and simulating landscape composition and pattern impacts on land surface temperature: A decadal study of the rapidly urbanizing city of Beijing, China. Sci. Total Environ. 2019, 654, 430–440. [Google Scholar] [CrossRef] [PubMed]
- Chen, Y.; Yang, J.; Yu, W.; Ren, J.; Xiao, X.; Xia, J.C. Relationship between urban spatial form and seasonal land surface temperature under different grid scales. Sustain. Cities Soc. 2023, 89, 104374. [Google Scholar] [CrossRef]






| Satellite Type | Date | Observation Time (UTC/GMT+08:00) | Cloud Cover |
|---|---|---|---|
| Landsat5 | 18 November 2004 | 10:49:57 | 0.00% |
| Landsat8 | 26 October 2013 | 11:06:37 | 2.48% |
| Landsat9 | 11 October 2022 | 11:05:16 | 0.17% |
| Classifications | Abbreviations | Description |
|---|---|---|
| Vegetation | VEG | Forest, grassland, and urban and rural tree plantation |
| Cropland | CL | Agricultural plantation |
| Impervious surfaces | IS | Built-up areas including buildings and roads |
| Water | WA | Lake, pond, river, reservoir, and part of the sea |
| Bare land | BL | Bare soil or rocks, mudflat, and other unbuilt zones |
| Metric | Formula | Description | Range |
|---|---|---|---|
| Percentage of landscape (PLAND) | The percentage of different types of landscape in the unit window | 0 < PLAND ≤ 100 | |
| Largest patch index (LPI) | The proportion of the largest plaque in the landscape | 0 < LPI ≤ 100 | |
| Landscape division index (DIVISION) | Reflects the degree of separation of patches in the landscape | 0 ≤ DIVISION < 1 |
| Step | Process Name | Formula | References |
|---|---|---|---|
| 1 | Spectral radiance (SR) | Lλ1 = 209.831 + 0.834DN − 0.00133DN2 Lλ2 = 0.0003342 × DN + 0.1 | [39,40,41] |
| 2 | Fractional vegetation (Fv) | Pv = (NDVI − NDVIs)/(NDVIv − NDVIs) | [42] |
| 3 | Surface emissivity (ε) | ε = 0.004 Pv + 0.986 | [37,42] |
| 4 | Brightness temperature (TB) | Tb = ([Lλ − Lu − t × (1 − ε) Ld])/(t × ε) | [43] |
| 5 | Land surface temperature (LST) | LST = K2/In(K1/Ts + 1) − 273 | [43,44] |
| UTFVI Value | SUHI Degree |
|---|---|
| <0 | None |
| 0–0.005 | Weak |
| 0.005–0.010 | Middle |
| 0.010–0.015 | Strong |
| 0.015–0.020 | Stronger |
| >0.020 | Strongest |
| Landscape Classification | 2004 | 2013 | 2022 | |||
|---|---|---|---|---|---|---|
| Area/km2 | Percentage/% | Area/km2 | Percentage/% | Area/km2 | Percentage/% | |
| Vegetation | 5382.521 | 41.98% | 5820.025 | 45.39% | 5682.905 | 44.32% |
| Cropland | 4381.719 | 34.17% | 4102.721 | 32.00% | 3876.355 | 30.23% |
| Impervious surfaces | 1587.879 | 12.38% | 1656.388 | 12.92% | 1878.679 | 14.65% |
| Water | 782.952 | 6.11% | 896.382 | 6.99% | 964.8711 | 7.53% |
| Bare land | 686.532 | 5.35% | 346.0887 | 2.70% | 418.7943 | 3.27% |
| Landscape Classification | Reference Totals | Classified Totals | No. Correct | Producer’s Accuracy (%) | User’s Accuracy (%) | Overall Accuracy (%) | Kappa Score |
|---|---|---|---|---|---|---|---|
| Vegetation | 100 | 104 | 88 | 88.00% | 84.62% | 90.22% | 0.88 |
| Cropland | 100 | 94 | 84 | 84.00% | 89.36% | ||
| Impervious surfaces | 100 | 107 | 95 | 95.00% | 88.79% | ||
| Water | 100 | 100 | 98 | 98.00% | 98.00% | ||
| Bare land | 50 | 45 | 41 | 82.00% | 91.11% | ||
| Total | 450 | 450 | 406 |
| Landscape Classification | Reference Totals | Classified Totals | No. Correct | Producer’s Accuracy (%) | User’s Accuracy (%) | Overall Accuracy (%) | Kappa Score |
|---|---|---|---|---|---|---|---|
| Vegetation | 100 | 109 | 92 | 92.00% | 84.40% | 91.56% | 0.89 |
| Cropland | 100 | 104 | 88 | 88.00% | 84.62% | ||
| Impervious surfaces | 100 | 99 | 94 | 94.00% | 94.95% | ||
| Water | 100 | 97 | 97 | 97.00% | 100.00% | ||
| Bare land | 50 | 41 | 41 | 82.00% | 100.00% | ||
| Total | 450 | 450 | 412 |
| Landscape Classification | Reference Totals | Classified Totals | No. Correct | Producer’s Accuracy (%) | User’s Accuracy (%) | Overall Accuracy (%) | Kappa Score |
|---|---|---|---|---|---|---|---|
| Vegetation | 100 | 103 | 91 | 91.00% | 88.35% | 93.11% | 0.91 |
| Cropland | 100 | 98 | 90 | 90.00% | 91.84% | ||
| Impervious surfaces | 100 | 105 | 97 | 97.00% | 92.38% | ||
| Water | 100 | 101 | 99 | 99.00% | 98.02% | ||
| Bare land | 50 | 43 | 42 | 84.00% | 97.67% | ||
| Total | 450 | 450 | 406 |
| LST Grade | 2004 | 2013 | 2022 | |||
|---|---|---|---|---|---|---|
| Area/km2 | Percentage/% | Area/km2 | Percentage/% | Area/km2 | Percentage/% | |
| <23 °C | 608.15 | 47.43% | 70.54 | 0.55% | 22.29 | 0.17% |
| 23–26 °C | 5962.59 | 46.50% | 2640.25 | 20.59% | 760.13 | 5.93% |
| 26–29 °C | 5335.51 | 41.61% | 7669.87 | 59.81% | 6682.78 | 52.11% |
| 29–32 °C | 826.90 | 6.45% | 2243.45 | 17.50% | 4309.27 | 33.61% |
| 32–35 °C | 85.44 | 0.67% | 185.52 | 1.45% | 947.15 | 7.39% |
| >35 °C | 4.50 | 0.04% | 13.46 | 0.10% | 101.46 | 0.79% |
| UTFVI Grade | 2004 | 2013 | 2022 | |||
|---|---|---|---|---|---|---|
| Area/km2 | Percentage/% | Area/km2 | Percentage/% | Area/km2 | Percentage/% | |
| None | 6649.85 | 51.86% | 6739.54 | 52.56% | 6867.61 | 53.56% |
| Weak | 474.91 | 3.71% | 379.97 | 2.96% | 332.12 | 2.59% |
| Middle | 494.71 | 3.86% | 367.58 | 2.87% | 322.27 | 2.51% |
| Strong | 170.84 | 1.33% | 356.26 | 2.78% | 306.83 | 2.39% |
| Stronger | 143.01 | 1.11% | 342.52 | 2.67% | 291.96 | 2.28% |
| Strongest | 4889.76 | 38.13% | 4637.22 | 36.16% | 4702.29 | 36.67% |
Disclaimer/Publisher’s Note: The statements, opinions and data contained in all publications are solely those of the individual author(s) and contributor(s) and not of MDPI and/or the editor(s). MDPI and/or the editor(s) disclaim responsibility for any injury to people or property resulting from any ideas, methods, instructions or products referred to in the content. |
© 2023 by the authors. Licensee MDPI, Basel, Switzerland. This article is an open access article distributed under the terms and conditions of the Creative Commons Attribution (CC BY) license (https://creativecommons.org/licenses/by/4.0/).
Share and Cite
Hu, Y.; Li, H.; Amir Siddique, M.; Liu, D. Assessing the Impact of Spatiotemporal Land Cover Changes on the Urban Heat Islands in Developing Cities with Landsat Data: A Case Study in Zhanjiang. Atmosphere 2023, 14, 1716. https://doi.org/10.3390/atmos14121716
Hu Y, Li H, Amir Siddique M, Liu D. Assessing the Impact of Spatiotemporal Land Cover Changes on the Urban Heat Islands in Developing Cities with Landsat Data: A Case Study in Zhanjiang. Atmosphere. 2023; 14(12):1716. https://doi.org/10.3390/atmos14121716
Chicago/Turabian StyleHu, Yutian, Hongye Li, Muhammad Amir Siddique, and Dongyun Liu. 2023. "Assessing the Impact of Spatiotemporal Land Cover Changes on the Urban Heat Islands in Developing Cities with Landsat Data: A Case Study in Zhanjiang" Atmosphere 14, no. 12: 1716. https://doi.org/10.3390/atmos14121716
APA StyleHu, Y., Li, H., Amir Siddique, M., & Liu, D. (2023). Assessing the Impact of Spatiotemporal Land Cover Changes on the Urban Heat Islands in Developing Cities with Landsat Data: A Case Study in Zhanjiang. Atmosphere, 14(12), 1716. https://doi.org/10.3390/atmos14121716


