Article

Quantitative Analysis of the Impacts of Ash from Lubricating Oil on the Nanostructure of Diesel Particulate Matter

1
Faculty of Environmental Science and Engineering, Kunming University of Science and Technology, Kunming 650500, China
2
Kunming Sino-Platinum Metals Catalyst Co., Ltd., Kunming 650500, China
3
National Laboratory of Auto Performance & Emission Test, School of Mechanical Engineering, Beijing Institute of Technology, Beijing100081, China
4
Collaborative Innovation Center of Electric Vehicles in Beijing, Beijing 100081, China
*
Author to whom correspondence should be addressed.
Atmosphere 2024, 15(1), 130; https://doi.org/10.3390/atmos15010130
Submission received: 13 November 2023 / Revised: 22 December 2023 / Accepted: 16 January 2024 / Published: 20 January 2024
(This article belongs to the Special Issue Traffic Related Emission (2nd Edition))

Abstract

:
Microscopic analyses of the effects of ash on particulate matter oxidation are rather scarce. In this study, three different lubricating oils with varying ash contents were used to investigate their effects on the nanostructure of diesel particulate matter. The nanostructure and nanostructure parameters, including fringe length, fringe separation distance, and fringe tortuosity, were studied using high-resolution transmission electron microscopy. The results show that all samples obtained from blending with different lubricant oil present typical core–shell structures. The inner cores remain relatively unchanged, whereas the thickness of the outer shells increases with the increasing ash content in the lubricant oil under the same working conditions. The fringe length increases and the fringe separation distance decreases with the rising ash content in the lubricant oil operating in the same working conditions. The fringe tortuosity decreases when the ash content in the lubricant oil increases from 0.92% to 1.21%, but shows little change when the ash content in the lubricant oil increases from 1.21% to 1.92%. Based on the effects of ash on the nanostructure parameters, it can be inferred that the oxidation activity of particles decreases with increasing ash content in the lubricant oil.

1. Introduction

Particulate matter (PM) emitted from diesel engines mainly consists of soot, ash, organic compounds, and sulfate material. This has brought about huge environmental and health problems [1,2,3,4,5]. In order to reduce PM emissions and meet increasingly stringent emission regulations, several approaches have been proposed, including internal purification technology, improvement of fuel quality, the optimization engine control strategy, and the use of after-treatment devices [6,7,8]. Among these approaches, the diesel particulate filter (DPF) is considered to be the most effective approach due to its filtration efficiency, which can reach as high as 95% [9]. However, the DPF needs to be periodically regenerated by burning trapped PM. This is because continuous accumulation of PM in the DPF can lead to negative effects, such as increasing filter backpressure, decreasing fuel economy, and deteriorating engine performance. DPF regeneration can be achieved through active or passive methods. Active regeneration involves raising the exhaust temperature to approximately 600 °C by injecting fuel into the exhaust pipe or using in-cylinder fuel post injection. Passive regeneration utilizes a catalyst coated on the DPF substrate to oxidize PM at relatively lower temperatures [10,11,12].
However, regardless of the regeneration method used, the essence is the oxidation reaction of the accumulated soot in the filter. The diesel soot oxidation process is closely influenced by engine operation conditions, diesel fuel composition, lubricant oil, after-treatment devices, etc. [13,14]. Meanwhile, lubricant oil is responsible for about 90% of ash formation [15], which is an important component of PM. The ash cannot be burned and will deposit in the DPF. As the ash accumulates, it leads to a series of negative problems, such as reducing soot storage capacity, increasing the DPF pressure drop, decreasing fuel economy, shifting the balance point temperature during regeneration, and so on [6].
So far, numerous publications have focused on the impacts of ash deposited in the DPF on PM oxidation. Chen et al. [16] investigated the effects of ash on exhaust flow and convective heat transfer during regeneration using a mathematical simulation. They found that the soot oxidation rate in inlet channels gradually increased with the accumulation of ash, reaching its maximum when the ash amount exceeded 15 g/L. Meng et al. [17] demonstrated the characterization of soot deposition and the oxidation process on a catalytic diesel particulate filter with five different ash loadings. Their results showed the ash played the role of an oxygen carrier and had a catalytic effect on the soot layer. Choi et al. [18] addressed the influences of ash on the gasoline direct-injection (GDI) engine soot oxidation characteristics and found the soot oxidation reactivity was significantly enhanced by the catalytic effects of ash.
Based on the literature review conducted, it is evident that the understanding of the effects of ash on PM oxidation is primarily analyzed from the macroscopic oxidation characteristics, focusing on oxidation rate and activation energy, whereas microscopic analyses are rather scarce. It is important to note that PM oxidation behaviors are greatly influenced by particle nanostructures, morphology, and graphitization degree [7,19]. Although Tan et al. [20] studied the effects of ash content in lubricating oil on the particle aggregate morphology and nanostructure, the ash content in PM is usually negligible under normal working conditions [15]. Therefore, this study aims to investigate the impacts of ash from three different lubricating oils on the nanostructure of diesel particulate matter using high-resolution transmission electron microscopy (HRTEM); the accelerating loading method of diesel fuel blending with lubricant was chosen for this purpose. The related conclusions from this work can provide basic knowledge about the effects of ash on particle oxidation from a microscopic level and further give useful information for accurately controlling DPF regeneration.

2. Materials and Methods

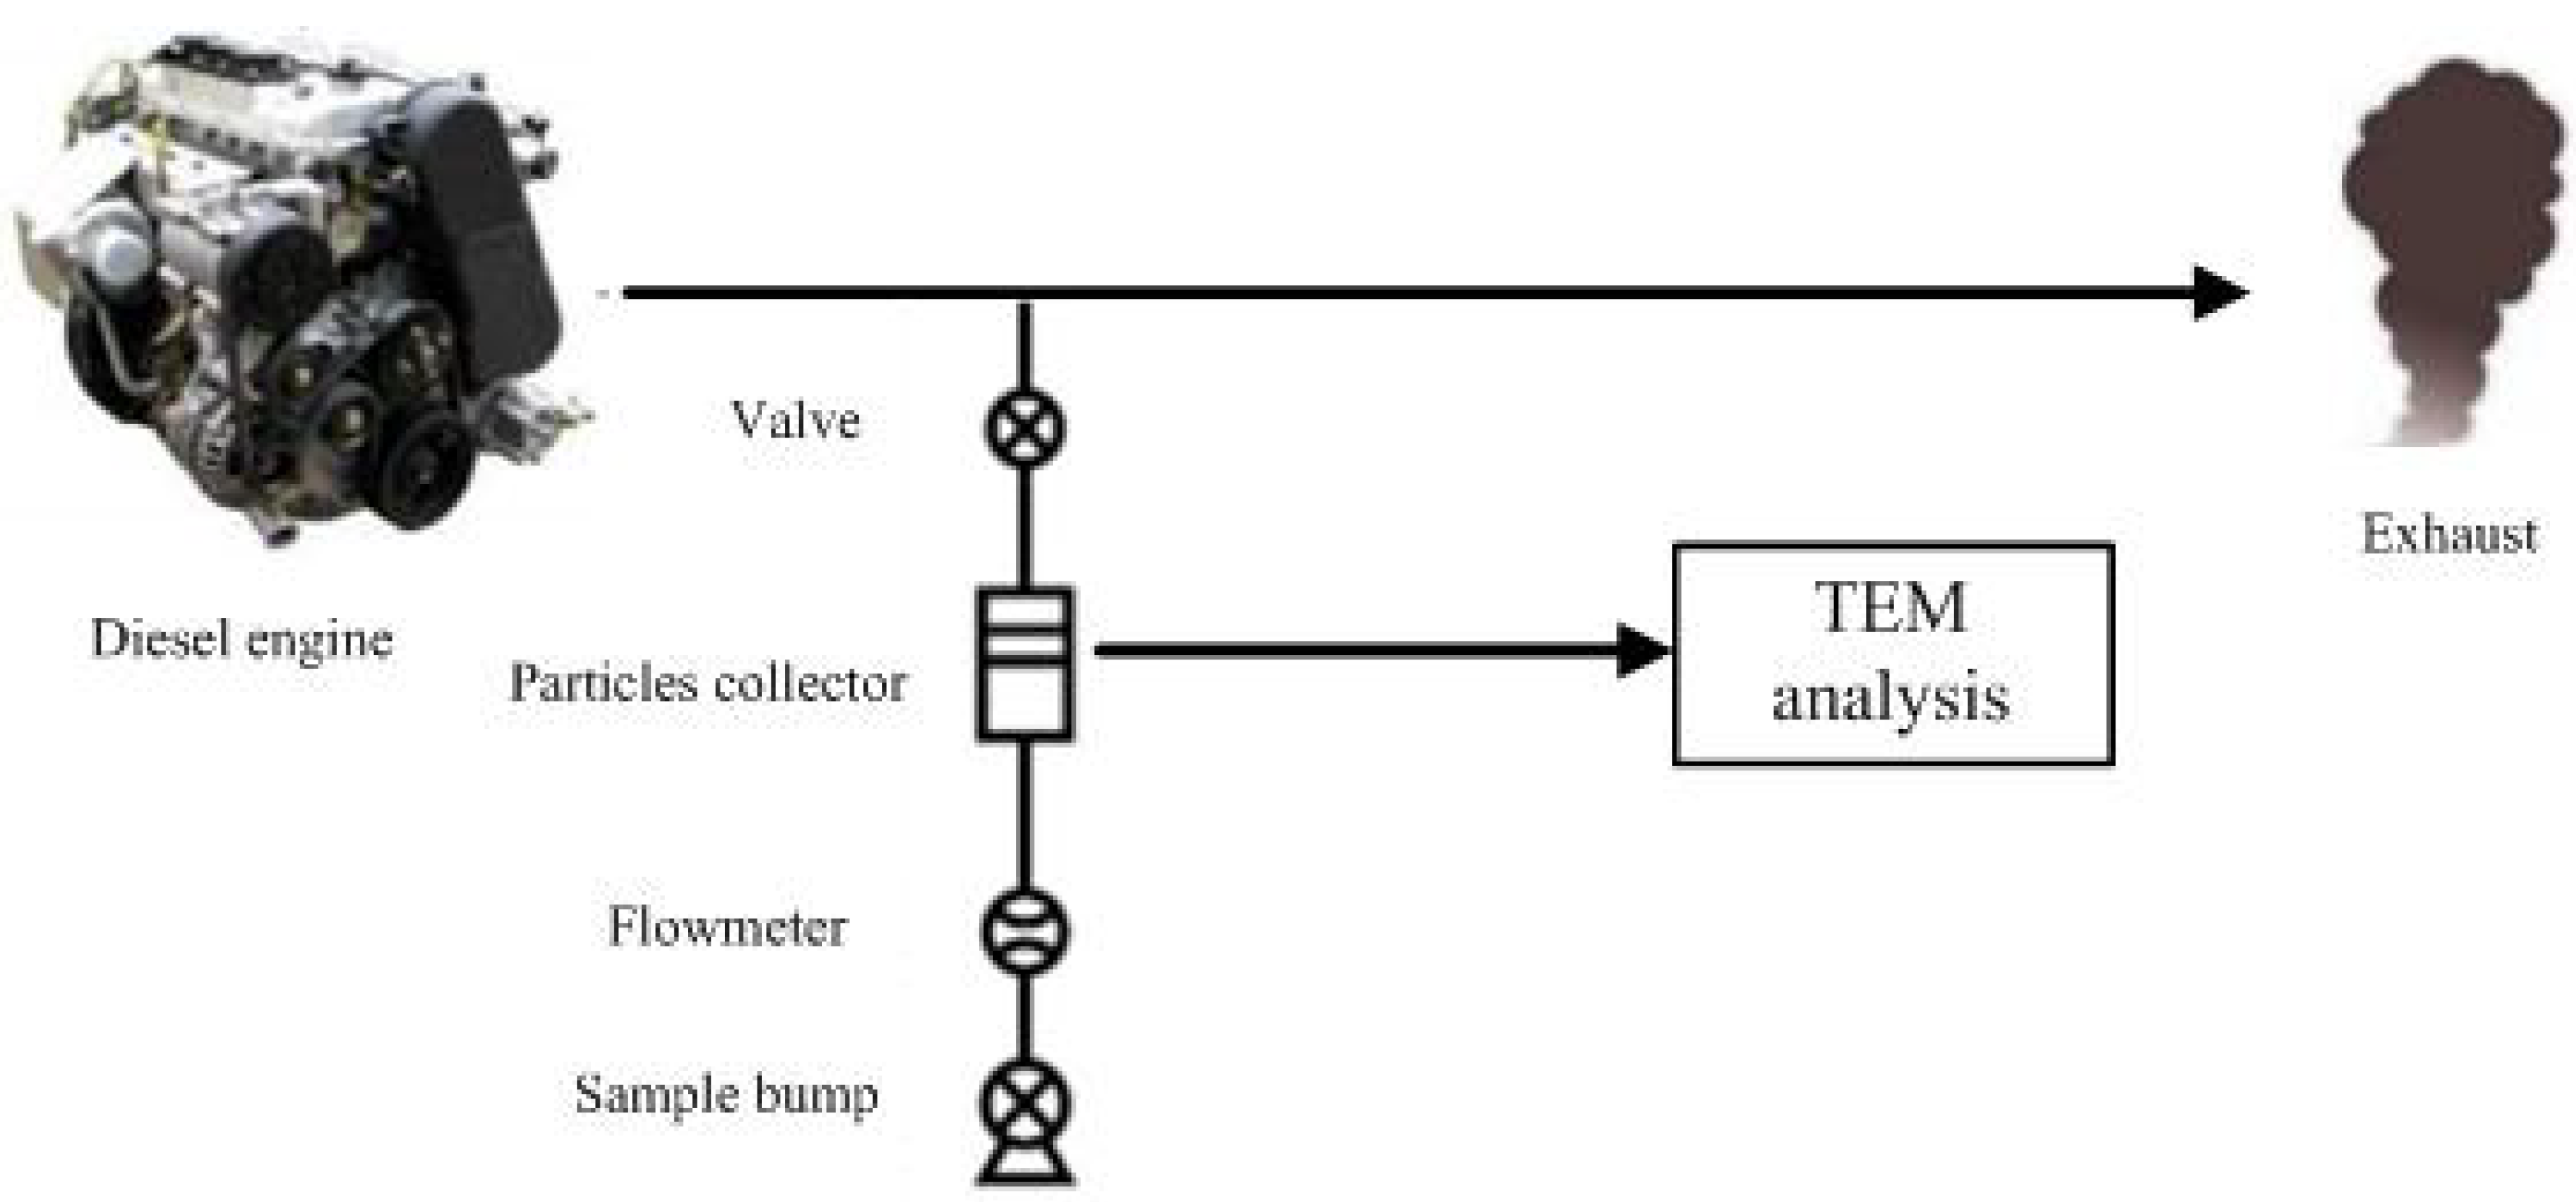
2.1. Experiment Apparatus and Sampling

Figure 1 illustrates the experiment system adopted in this study. The engine employed was a 4-cylinder, turbocharged, and intercooled diesel engine from Yunnei Power Ltd., Kunming, China, which was carried out on a test bench based on an AC dynamometer Schenck HT350 (Horiba, Munich, Germany). The specifications of the engine are provided in Table 1 for reference.
This work utilized commercial diesel fuel 0# (China VI) purchased from a filling station. Its detailed parameters are presented in Table 2. In this study, three types of lubricant oil were employed and their specifications are listed in Table 3. To minimize the effects of fuel quality, the sulfur content was kept low and similar across the oils. Based on their ash content, these oils were marked as H oil, M oil, and L oil, respectively. According to the findings of our previous work [15,21], the accelerating loading method of diesel blending with lubricant could improve the ash content in particles, and the particle property remained similar to those normal conditions when the lubricant oil blending volume was 2%. Therefore, the lubricant dosing amount was 2%. To avoid cross-contamination effects among the three types of lubricant oil, the previous testing lubricant oil was discharged before conducting a new test. The related discharged steps were employed as follows: (a) opening the blot on the oil pan to discharge the used lubricant oil; (b) adding new lubricant oil into the engine before the cylinder was exposed to the air at about 2 h; (c) starting engine for 0.5 h to allow the new lube oil into all parts of the engine fully before conducting a new experiment. It is worth noting that the blending lubricant oil was always consistent with the lube that remained in the engine.
The PM sampling was conducted under three engine working conditions: 2000 rpm/40% loading, 2000 rpm/60% loading, 2000 rpm/80% loading. The engine ran for at least 10 min to warm up before the sampling. The exhaust gas was extracted using a vacuum pump with a flow rate of 10 L/min. The exhaust gas was directed through a TEM grid holder, which was installed in the particle collector. A copper TEM grid coated with a 200-mesh carbon film was placed in the center of the holder to collect the particles. To prevent particles from being over aggregated, the sampling time was about 30 s. After each test, the copper grid was removed and saved in a box for TEM analysis.

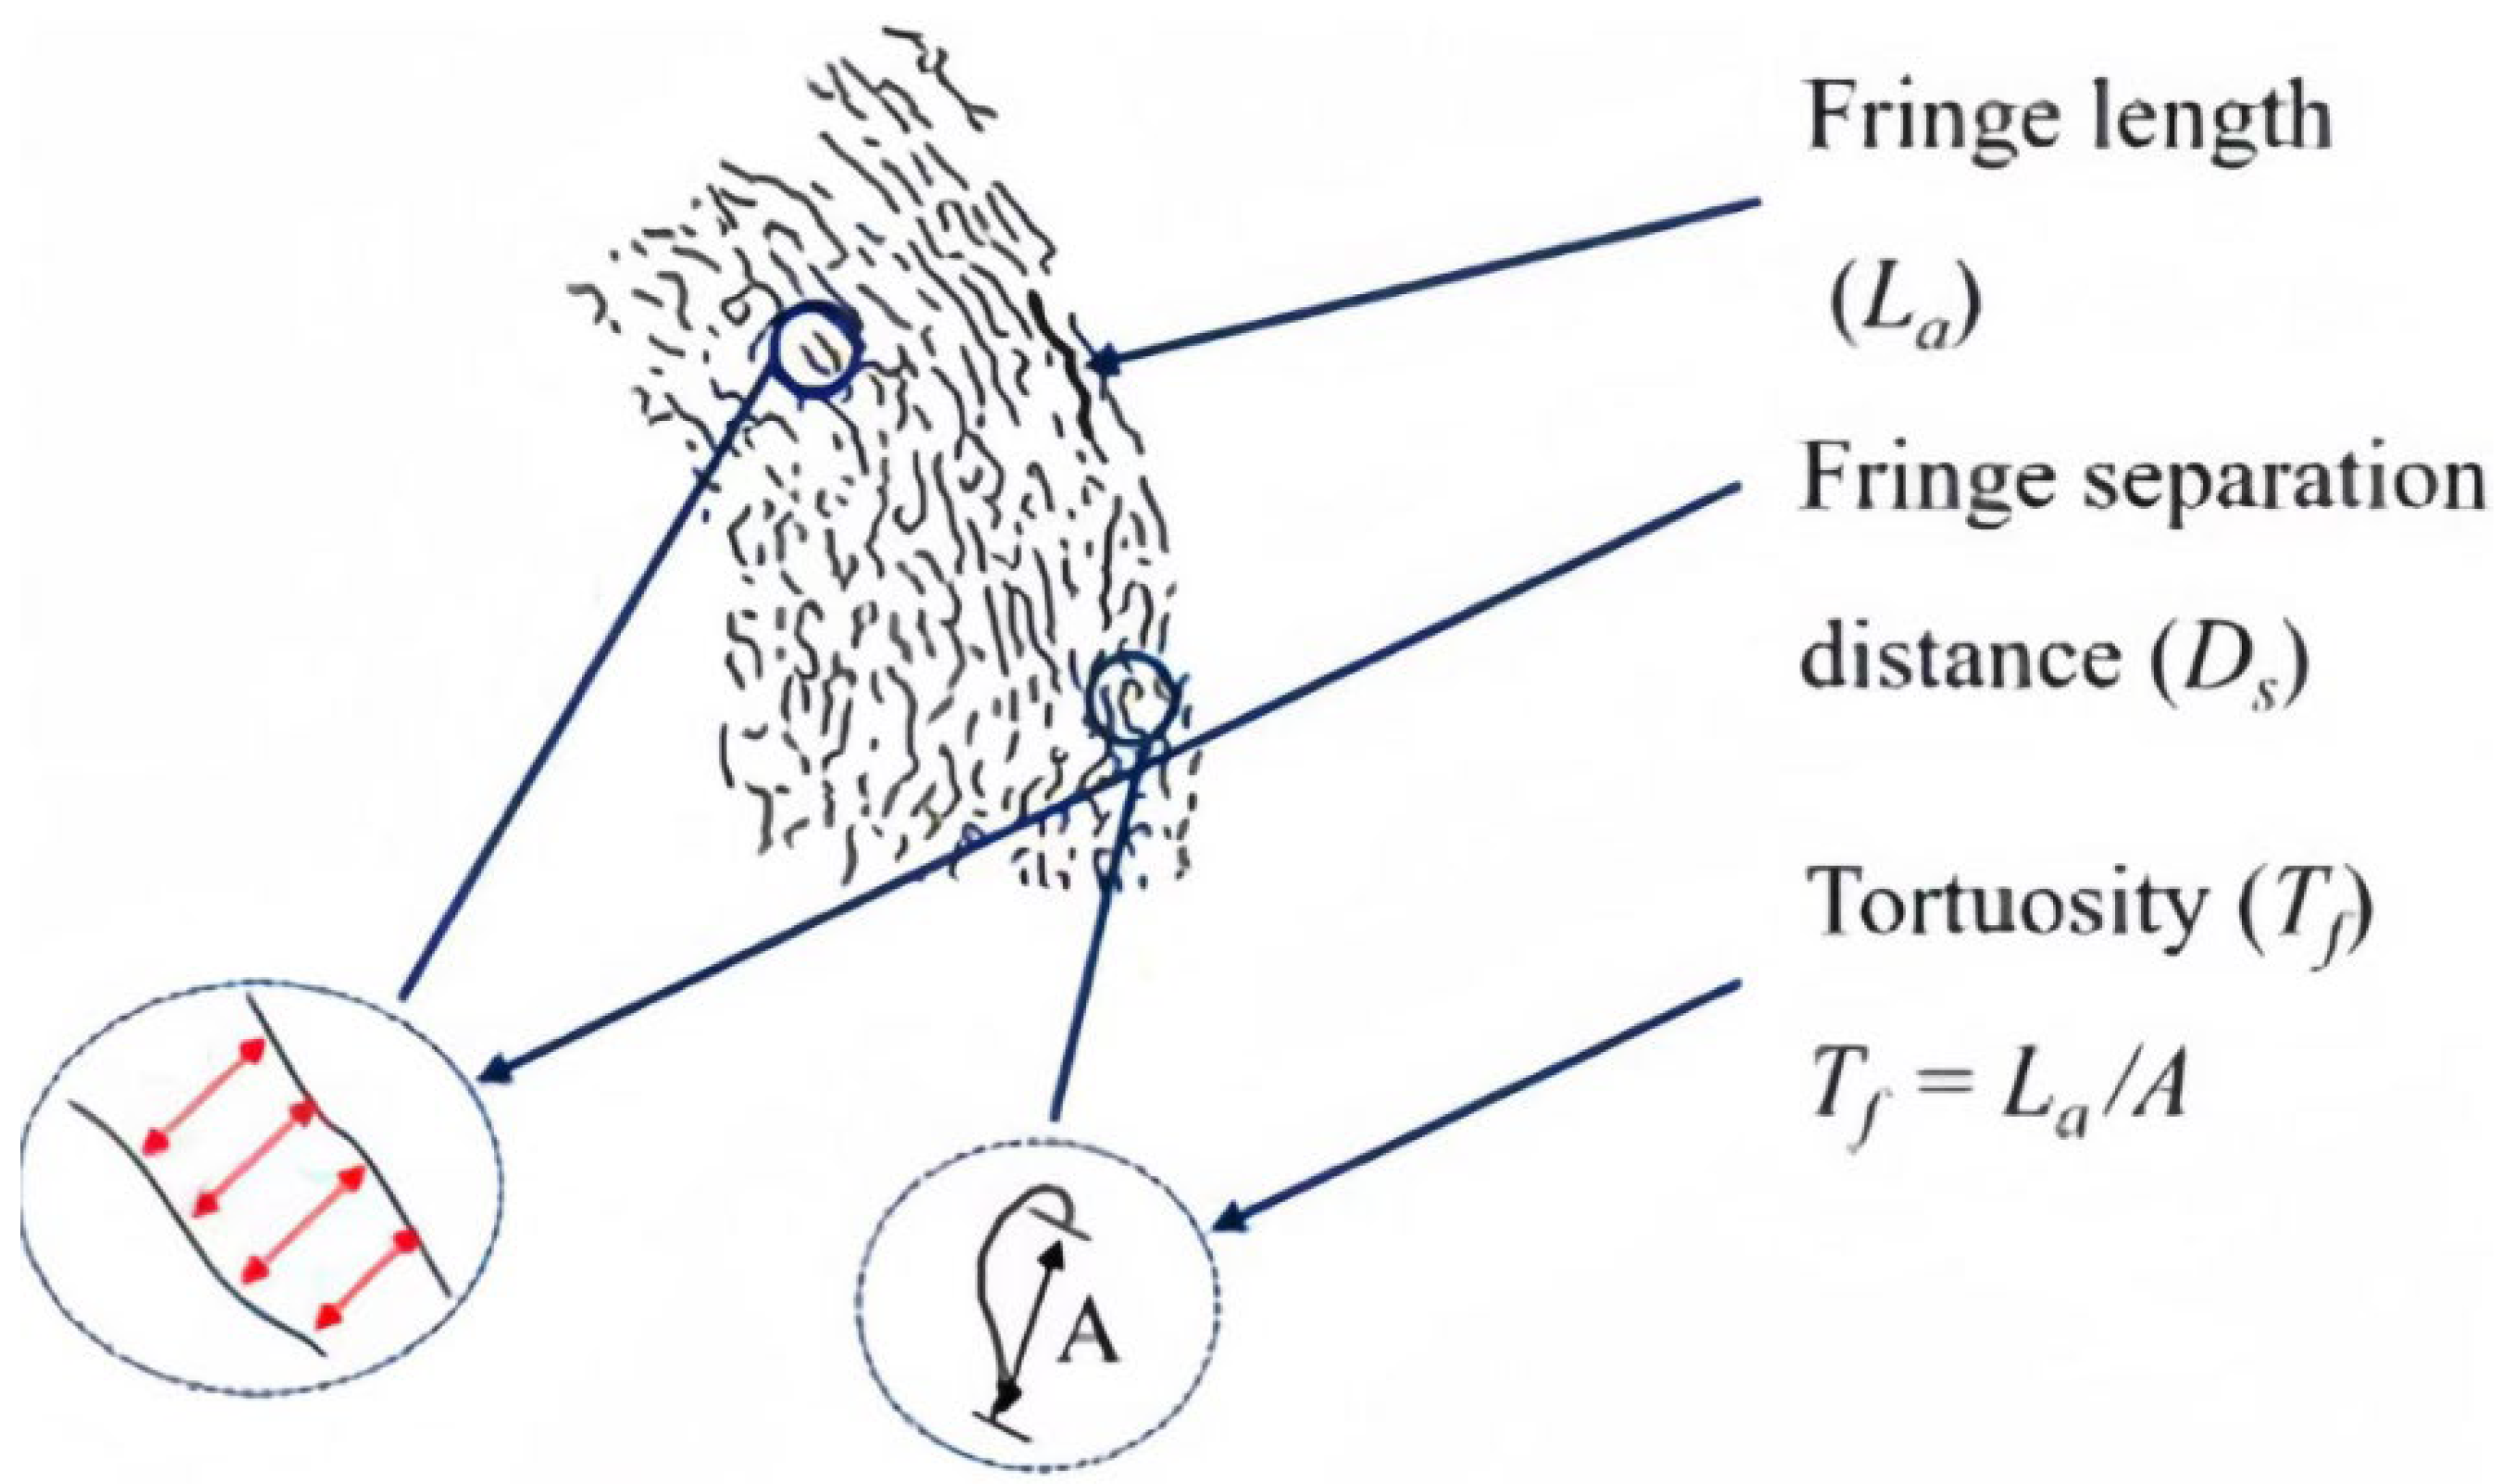
2.2. Analytical Method

A field emission TEM (JEM-2100) was used to obtain the HRTEM figures. The applied magnification for the images was set as 1,000,000×. Before the tests, the suspensions were prepared by ultrasonication of soot within acetone. A drop of the suspension was deposited on a copper grid, then the grid was dried under accent light to remove the acetone. The point-to-point resolution of the HRTEM figures was 0.19 nm. To analyze the nanostructure of diesel particulate matter, MATLABTM software was employed. The nanostructure parameters include fringe length (La), fringe separation distance (Ds), fringe tortuosity (Tf). As shown in Figure 2, the fringe length is a measure of the physical extent of the atomic carbon layer planes. The fringe separation distance is the mean distance between adjacent carbon layer planes. The fringe tortuosity is defined as the ratio of the fringe length to the linear distance between the two endpoints of the carbon layer planes. To ensure the accuracy of the data, ten HRTEM images of the particles in each test were obtained randomly to analyze. In order to reduce error, more than 200 particles were analyzed for each lubricating oil under each set of operating conditions.

3. Results and Discussion

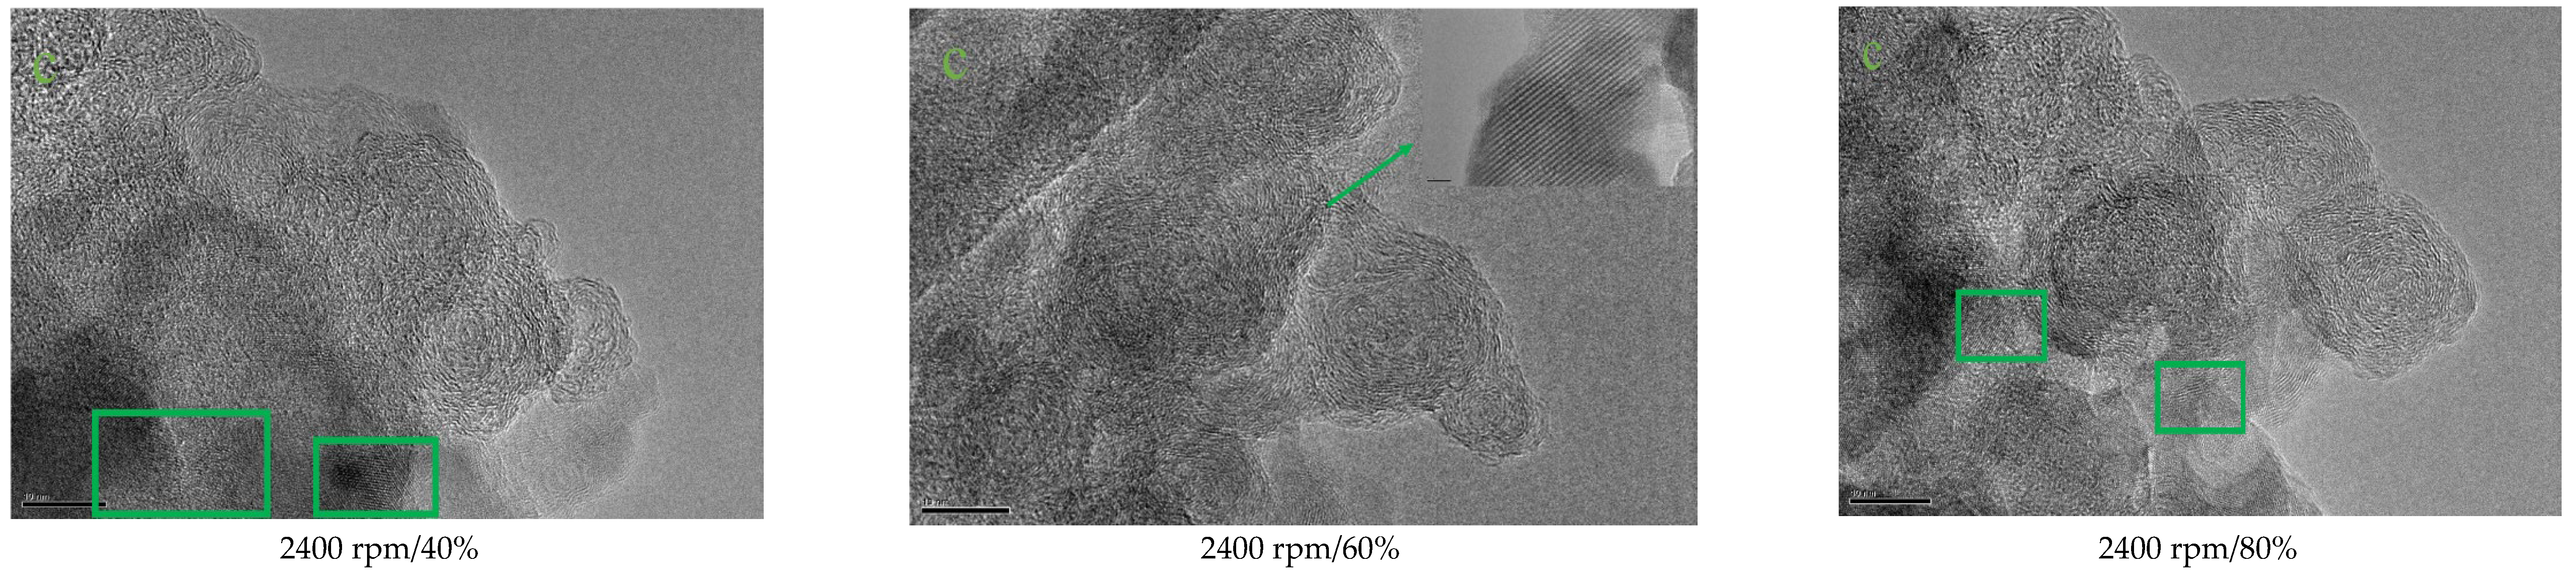
3.1. Nanomorphology Analysis

The nanostructure of particulate matter (PM) under various working conditions is shown in Figure 3. All the samples present typical core–shell-like structures with short amorphous crystals distributed randomly in the cores, and long crystal-like graphite layers in the shells, which are consistent with previous reports [7,11,23]. Because the nucleation process occurs prior to the core surface growth [23], it is clearly seen from the figure that single or multiple cores exist in the structure. This nanostructure represents the equilibrium configuration achieved through the high-temperature reactions of polyaromatics in the PM. The reason that the boundary between shell and core occurred is because the orientational elastic stain overcomes the crystals’ free energy [24]. Under the same working conditions, the inner cores remain relatively unchanged with the increasing ash content in the lubricant oil, whereas the thickness of the outer shells increases. In addition, the boundary of the single core–shell-like structures appears fuzzier and overlapped. This is because the outer shell is main attached with soluble organic fraction and metallic salts, which promote the oxidation of particles, and the metallic salts are the main original source of ash.
It is worth mentioning that the lattice structures are observed in the particle nanostructure under different working conditions with blending L lubricant oil, as shown in the green box of Figure 3. To further investigate the composition of the particles, an electronic spectrogram was performed, as shown in Figure 4. A large number of metallic and non-metallic elements exist within the particles. However, it is challenging to confirm the crystal type due to extensive speculations and limitations in the precision of the crystal spacing measurement. Further analysis is required in future studies to provide more detailed insights.

3.2. Nanostructure Parameters Analysis

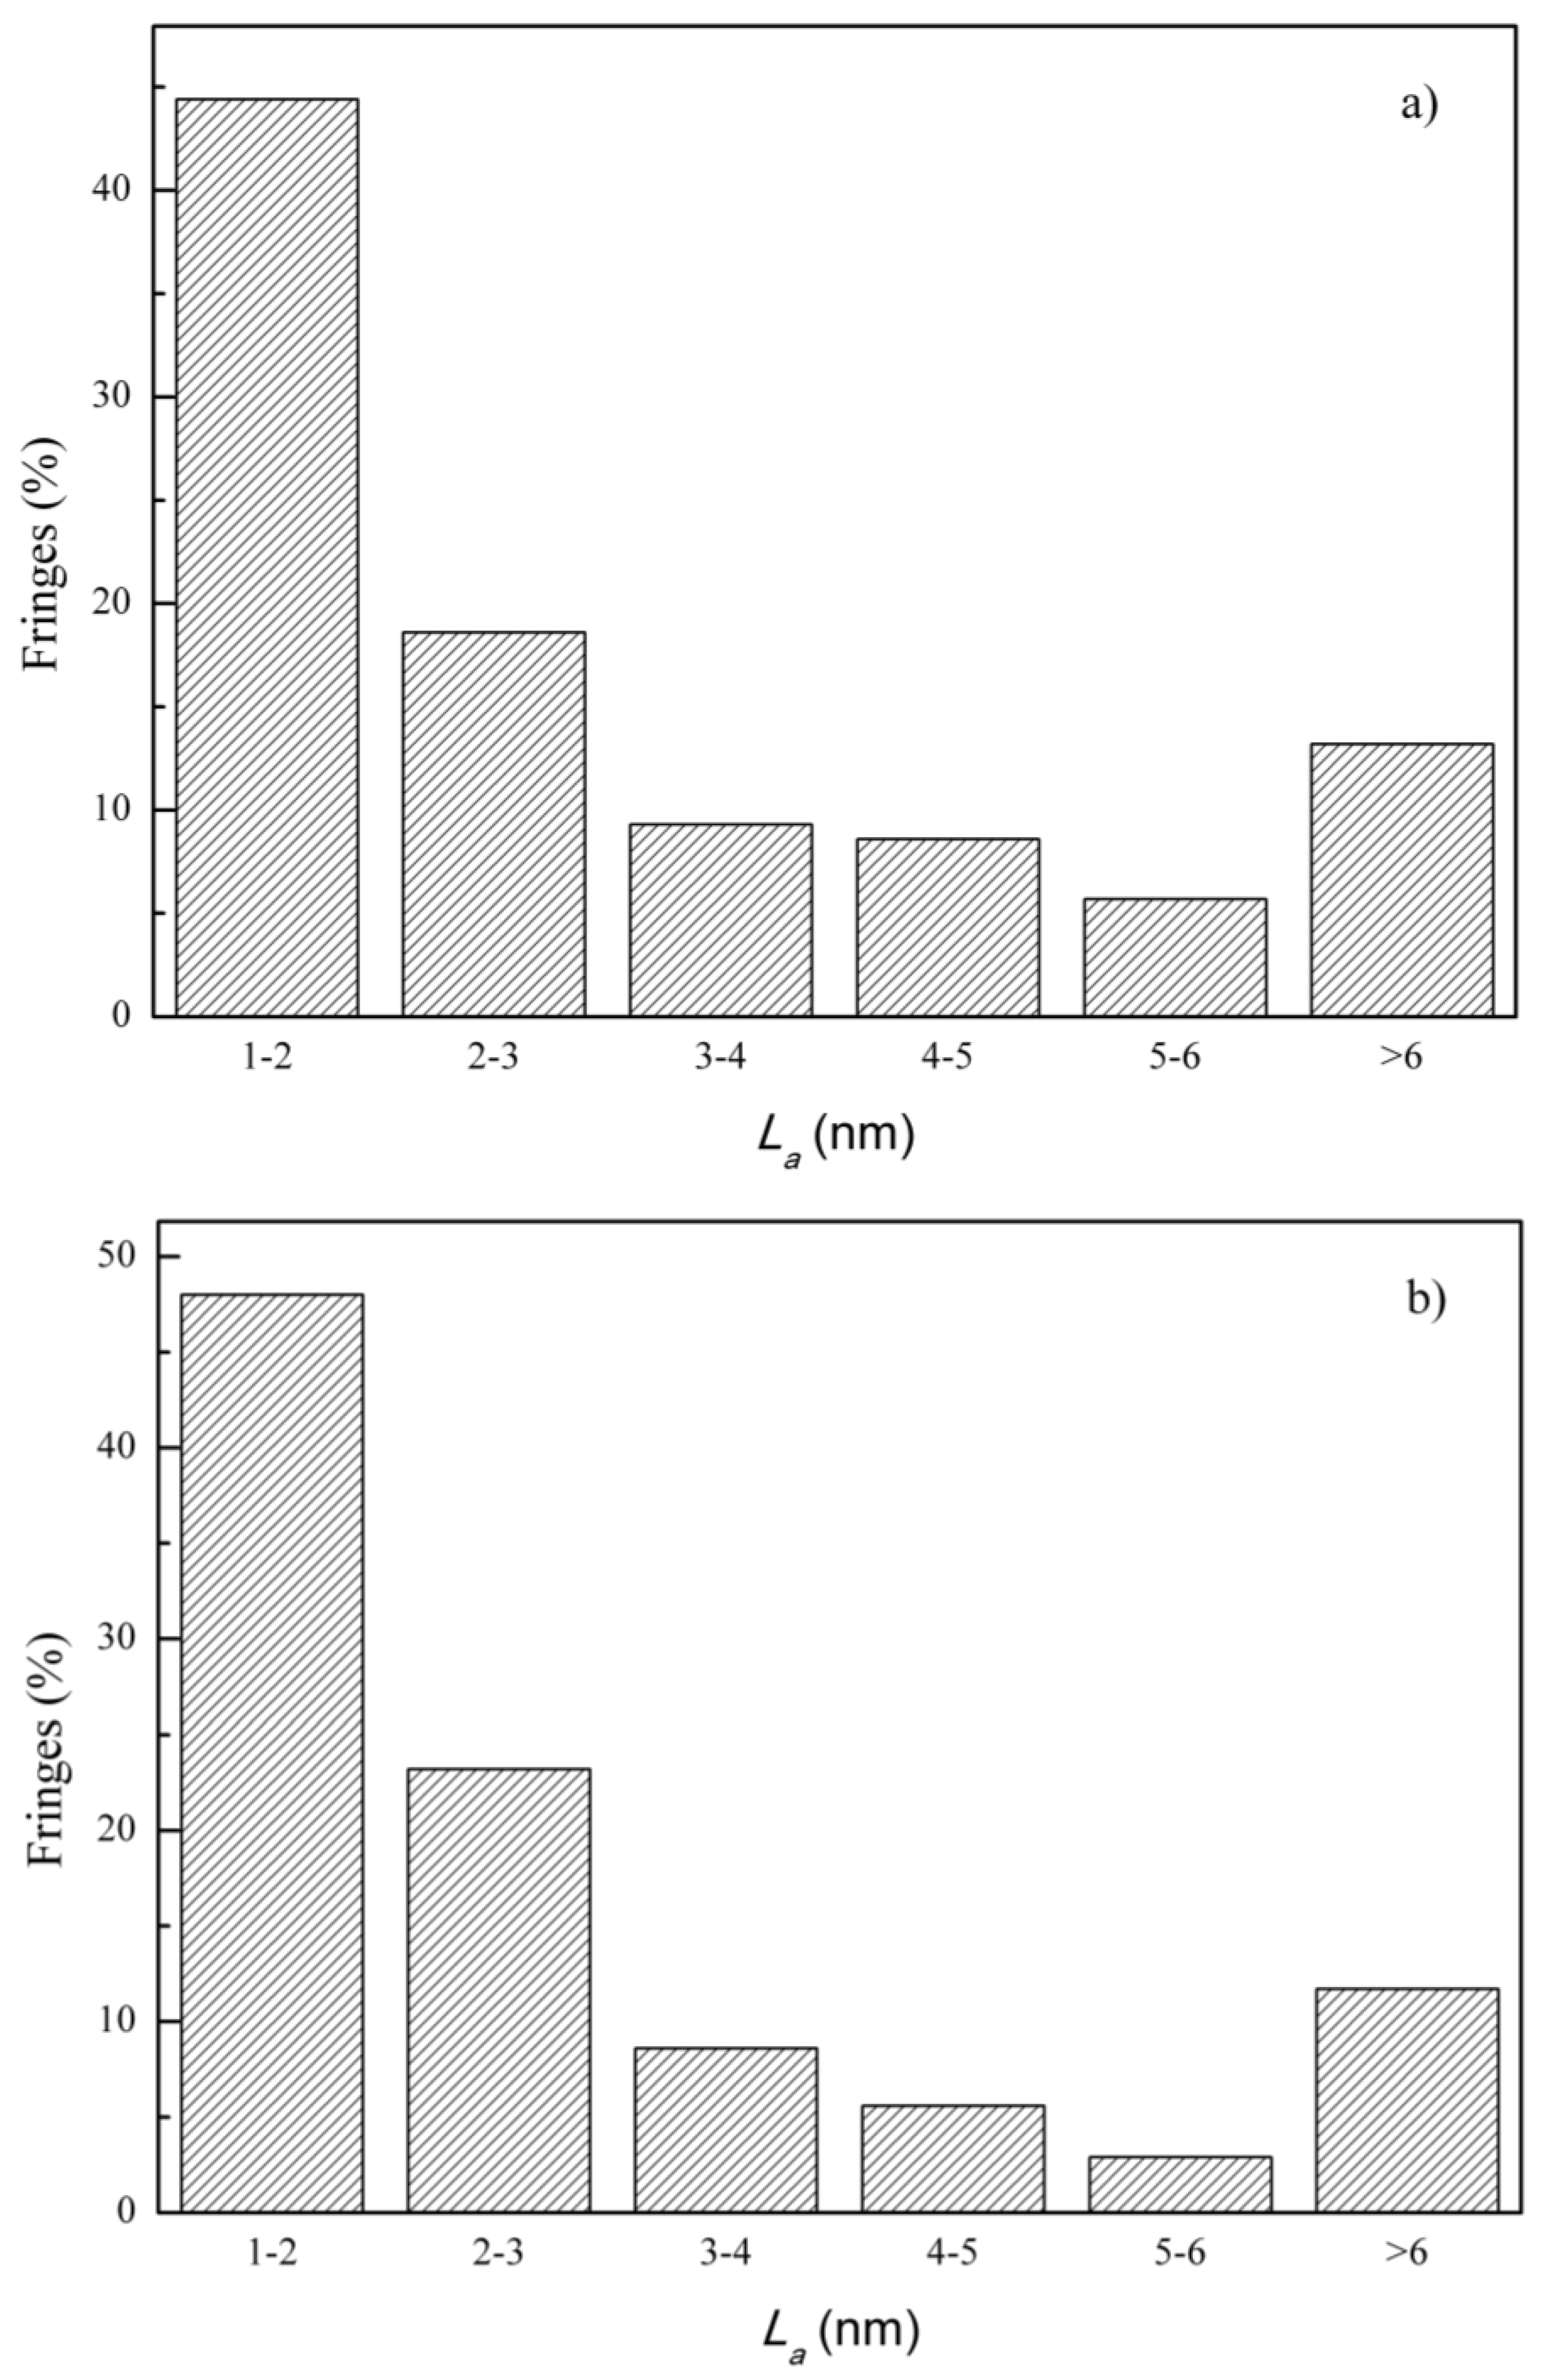
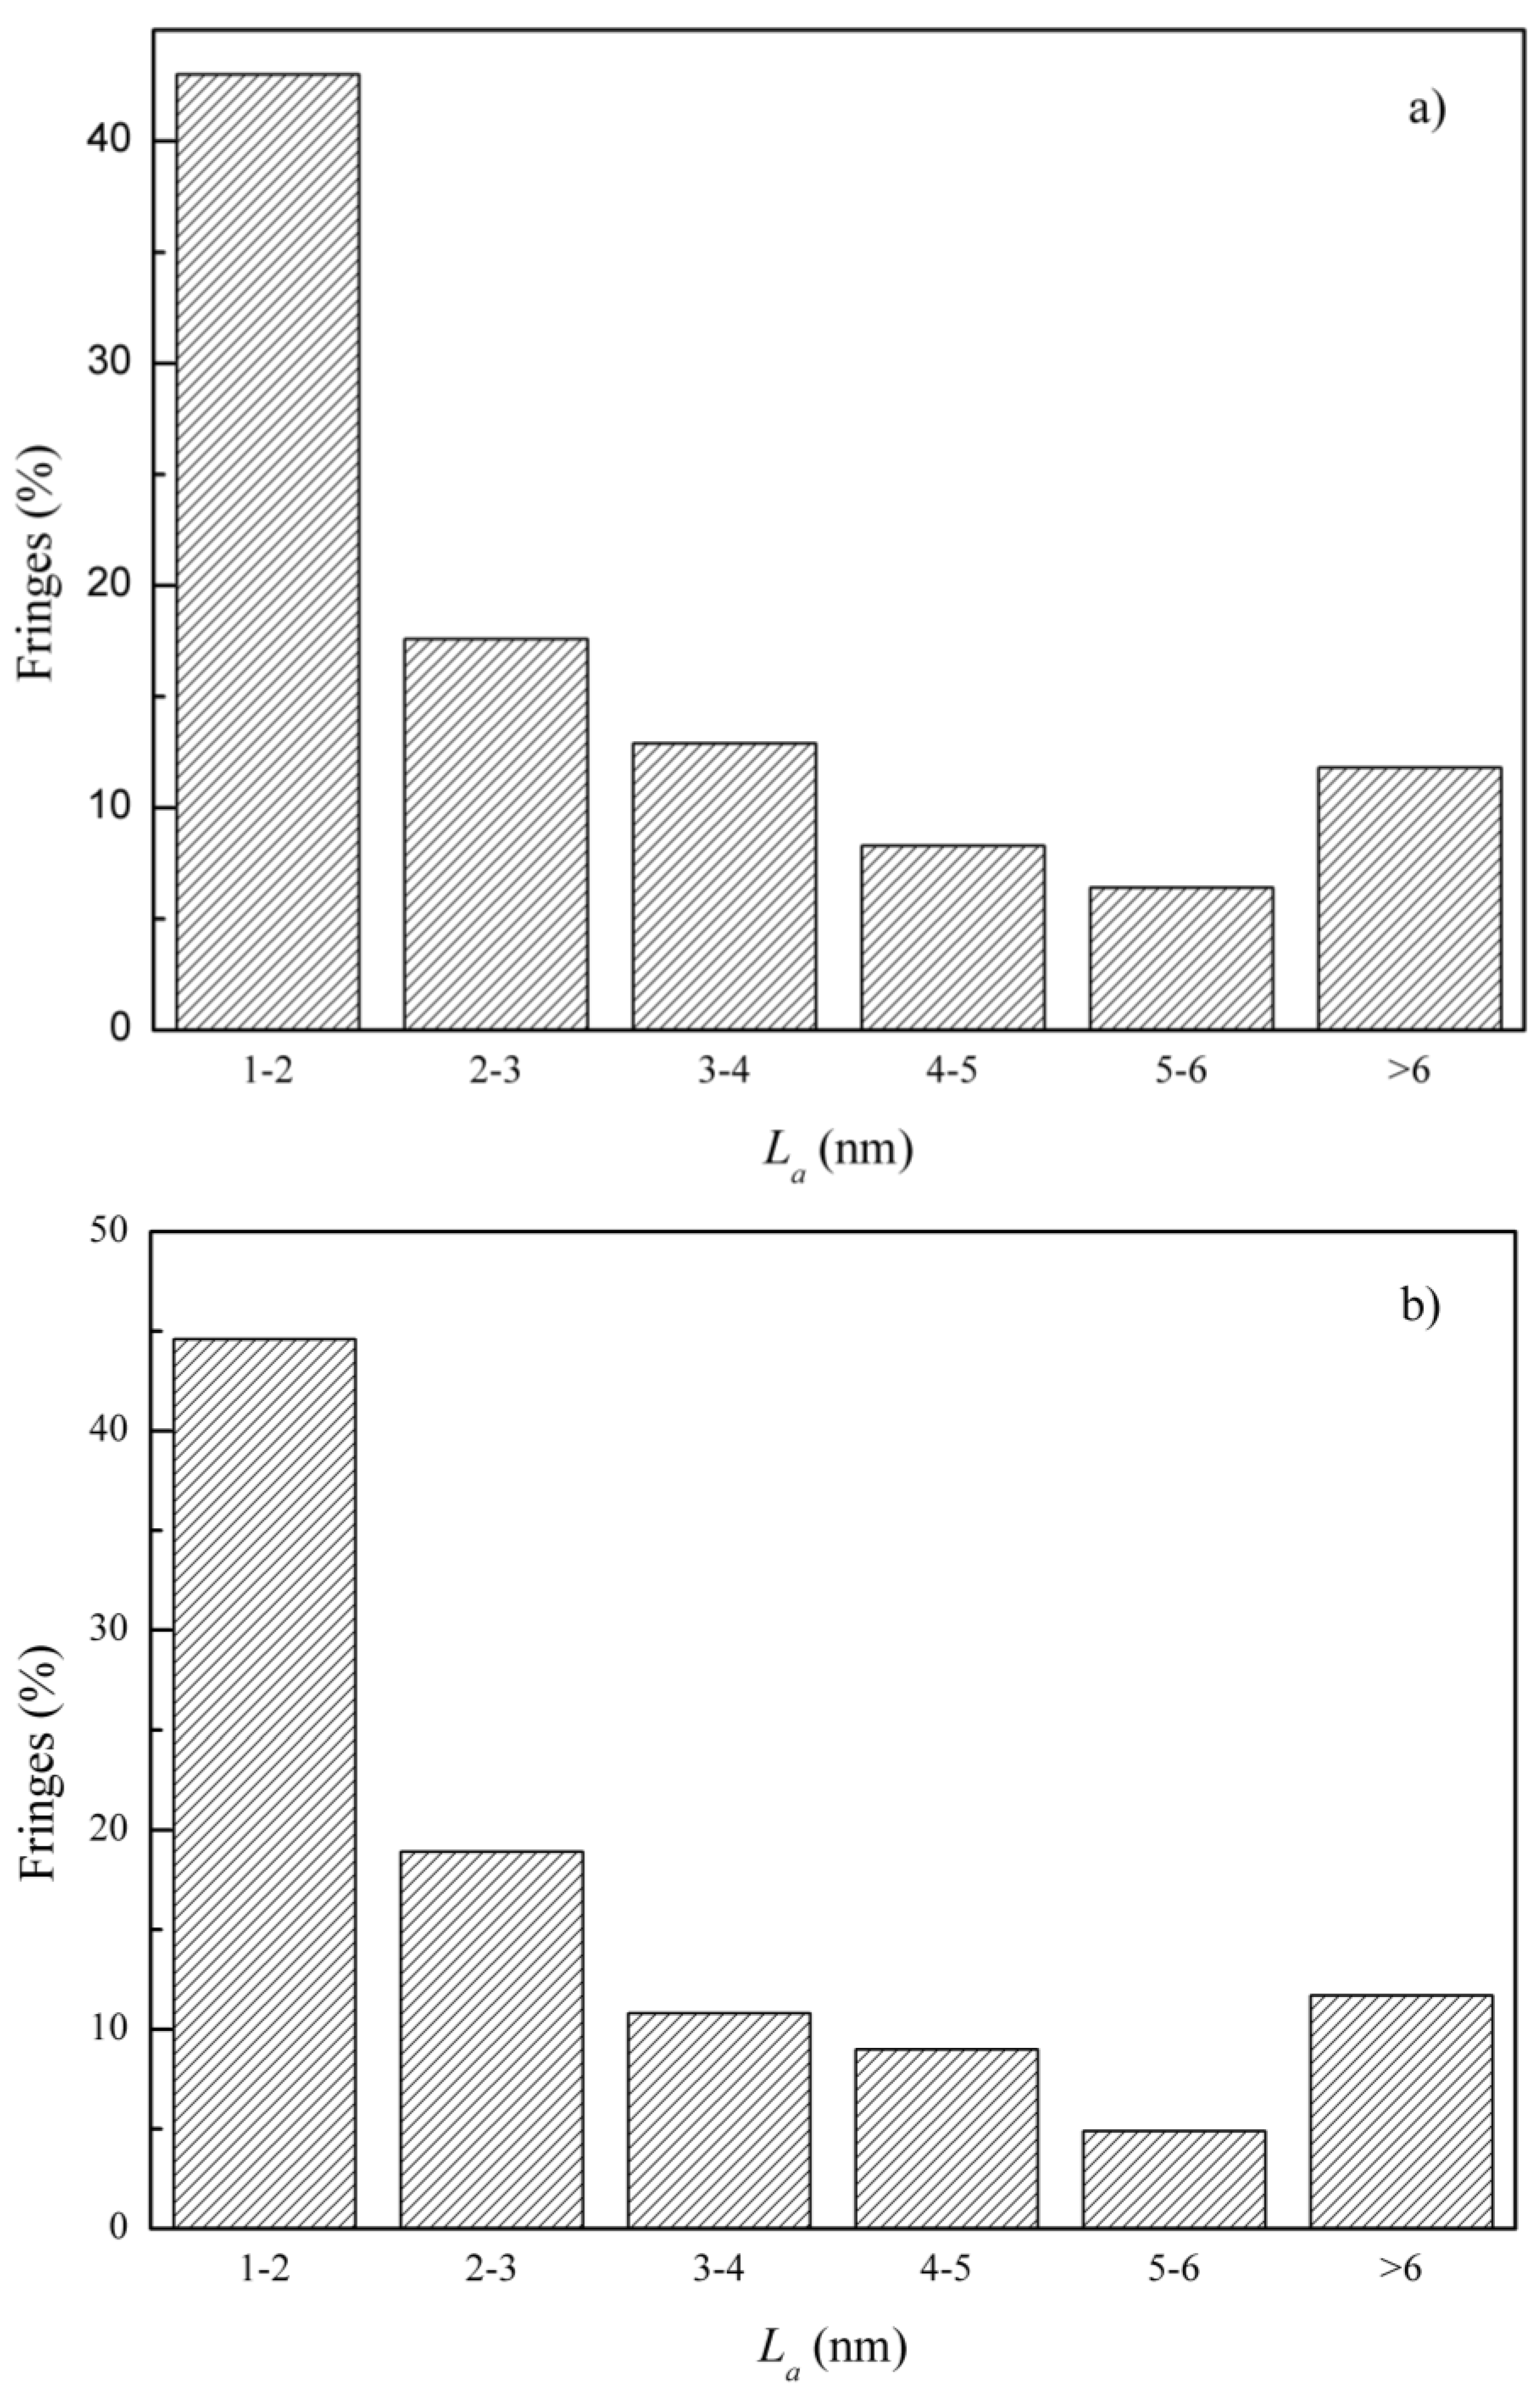
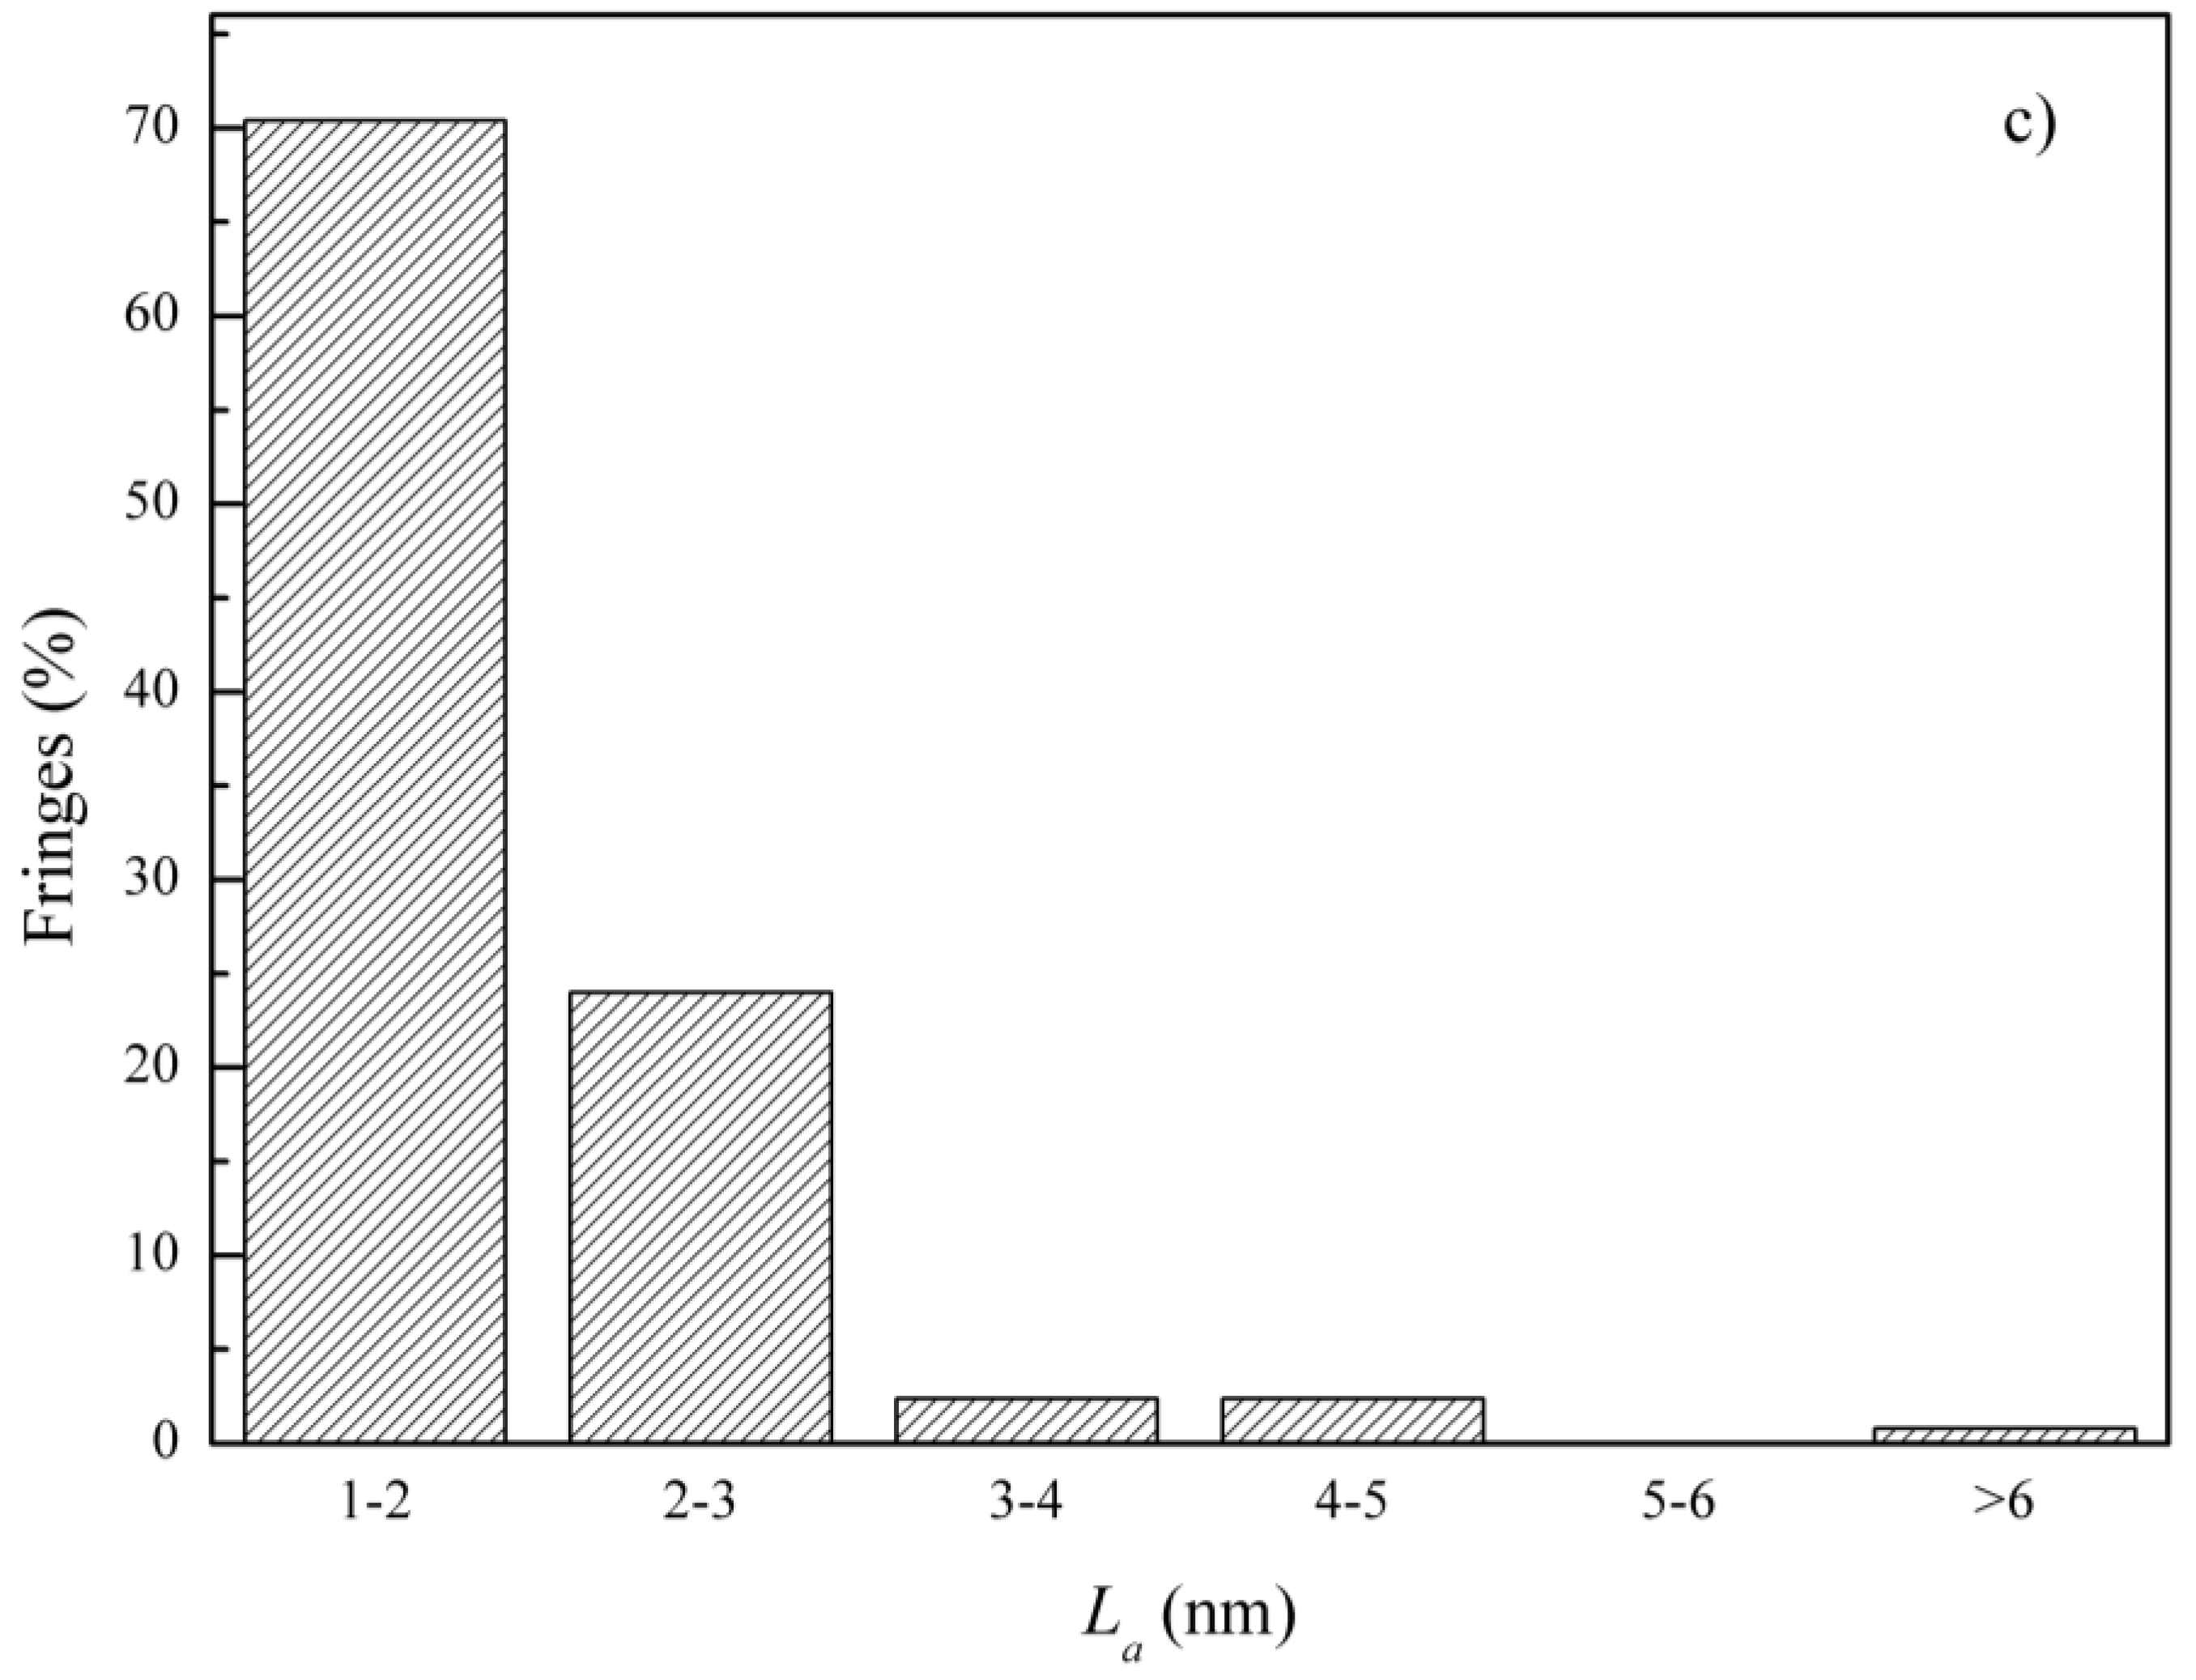
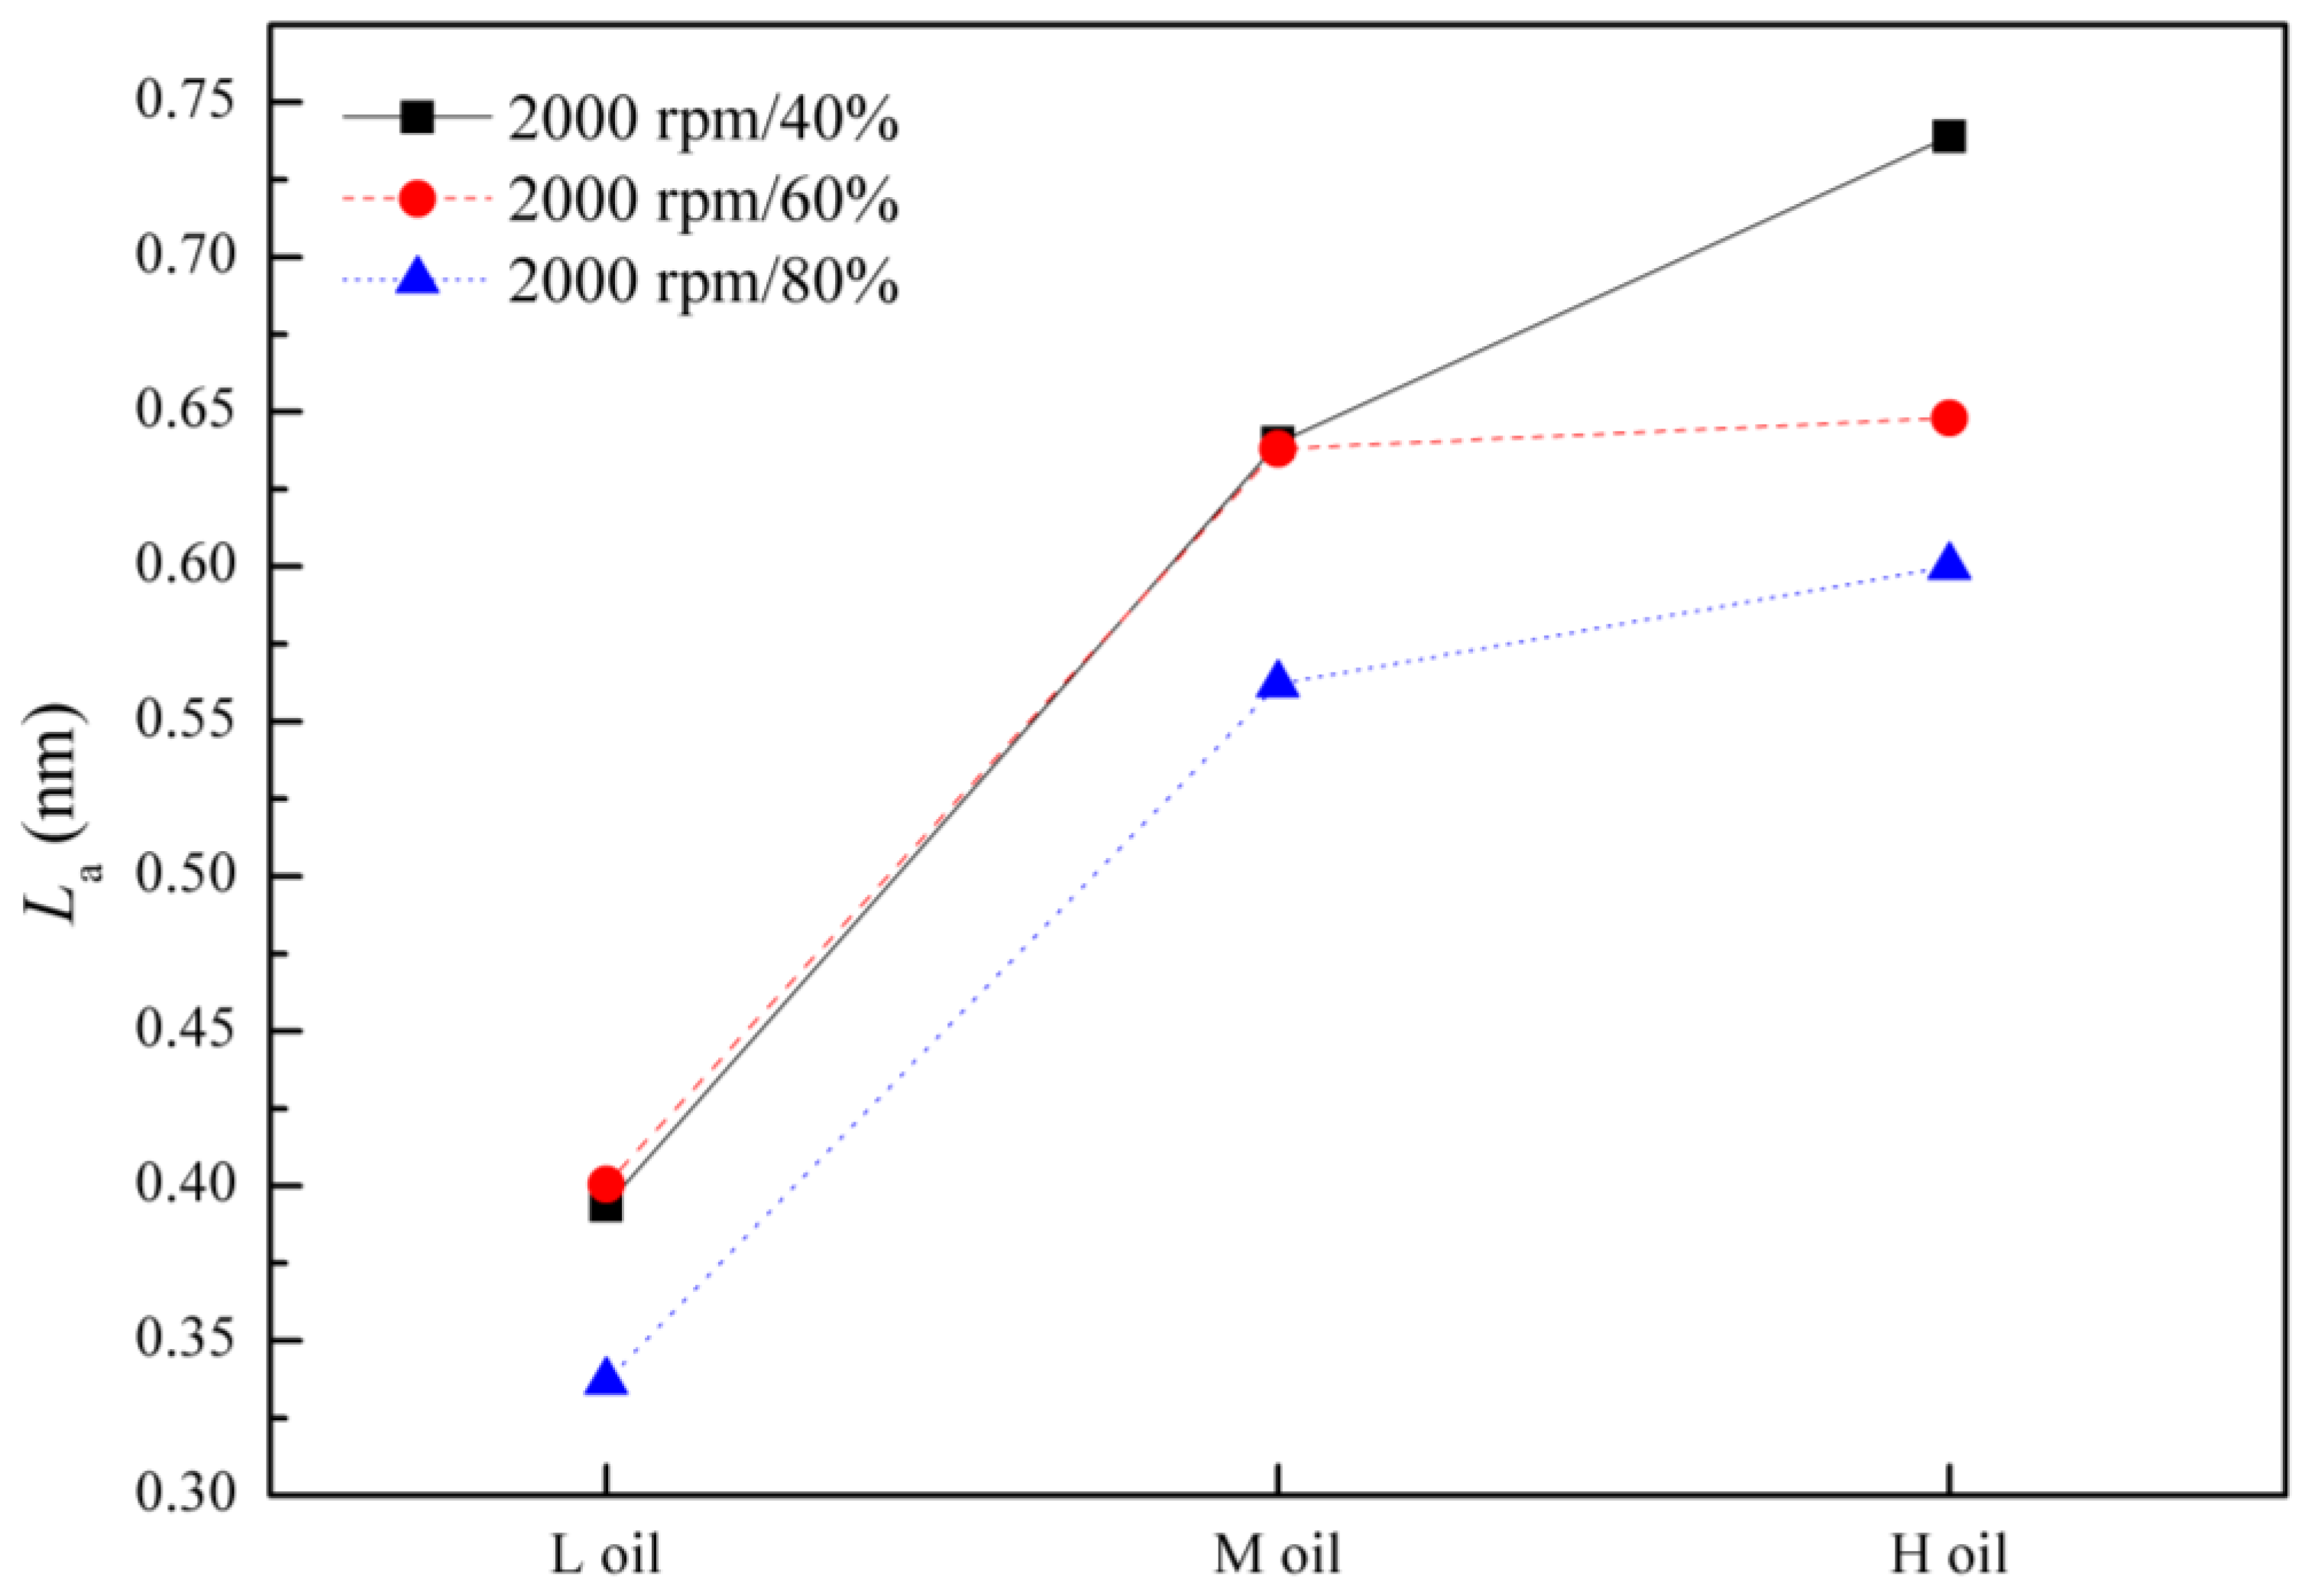
3.2.1. Fringe Length

The fringe length distribution histograms of particles obtained from blending with three types of lubricant oil under different working conditions are shown in Figure 5, Figure 6 and Figure 7. It is worth noting that fringes with lengths ranging from 0 to 1 nm were not considered in this work because many fringe length values were zero in this range. Generally, the proportion of fringe length decreases with the length of fringe in all samples. The most frequent observed range is 1–2 nm, which is consistent with the previous study [25]. The proportions of the fringe length in the range of 1–2 nm are 44–48%, 62.9–70.5%, and 43–70.4%, corresponding to blends with H oil, M oil and L oil, respectively. It is known that fringe length reflects the extent of carbon rings within the aromatic framework, and the larger values indicate a lower level of oxidation activity in the fringe [7,19]. Therefore, the results further show that the proportion of fringe with high oxidation activity is larger. Additionally, compared to the particles obtained from blending with M oil, the proportion of the fringe length in the range of >6 nm is higher in H oil and L oil. Although the fringe length distribution is slightly different in various working conditions and lubricant oils, the distribution tendency Is similar as a whole.
The effects of ash on the fringe length are shown in Figure 8. It is necessary to mention that the value of the fringe length is an average value. In the same working conditions, the fringe length increases with the rising ash content in the lubricant oil. When the ash content rises from 0.92% to 1.21%, the growth of the fringe length is significant. However, when the ash content further increases from 1.21% to 1.92%, the growth of the fringe length slows down. It is known that the larger the fringe length, the higher the degree of graphitization, which means lower oxidation activity. Therefore, it can be inferred that the oxidation activity of particles decreases with the increasing ash content in the lubricant oil. Additionally, the fringe length decreases with the rising engine loading in the same ash content in the lubricant oil.

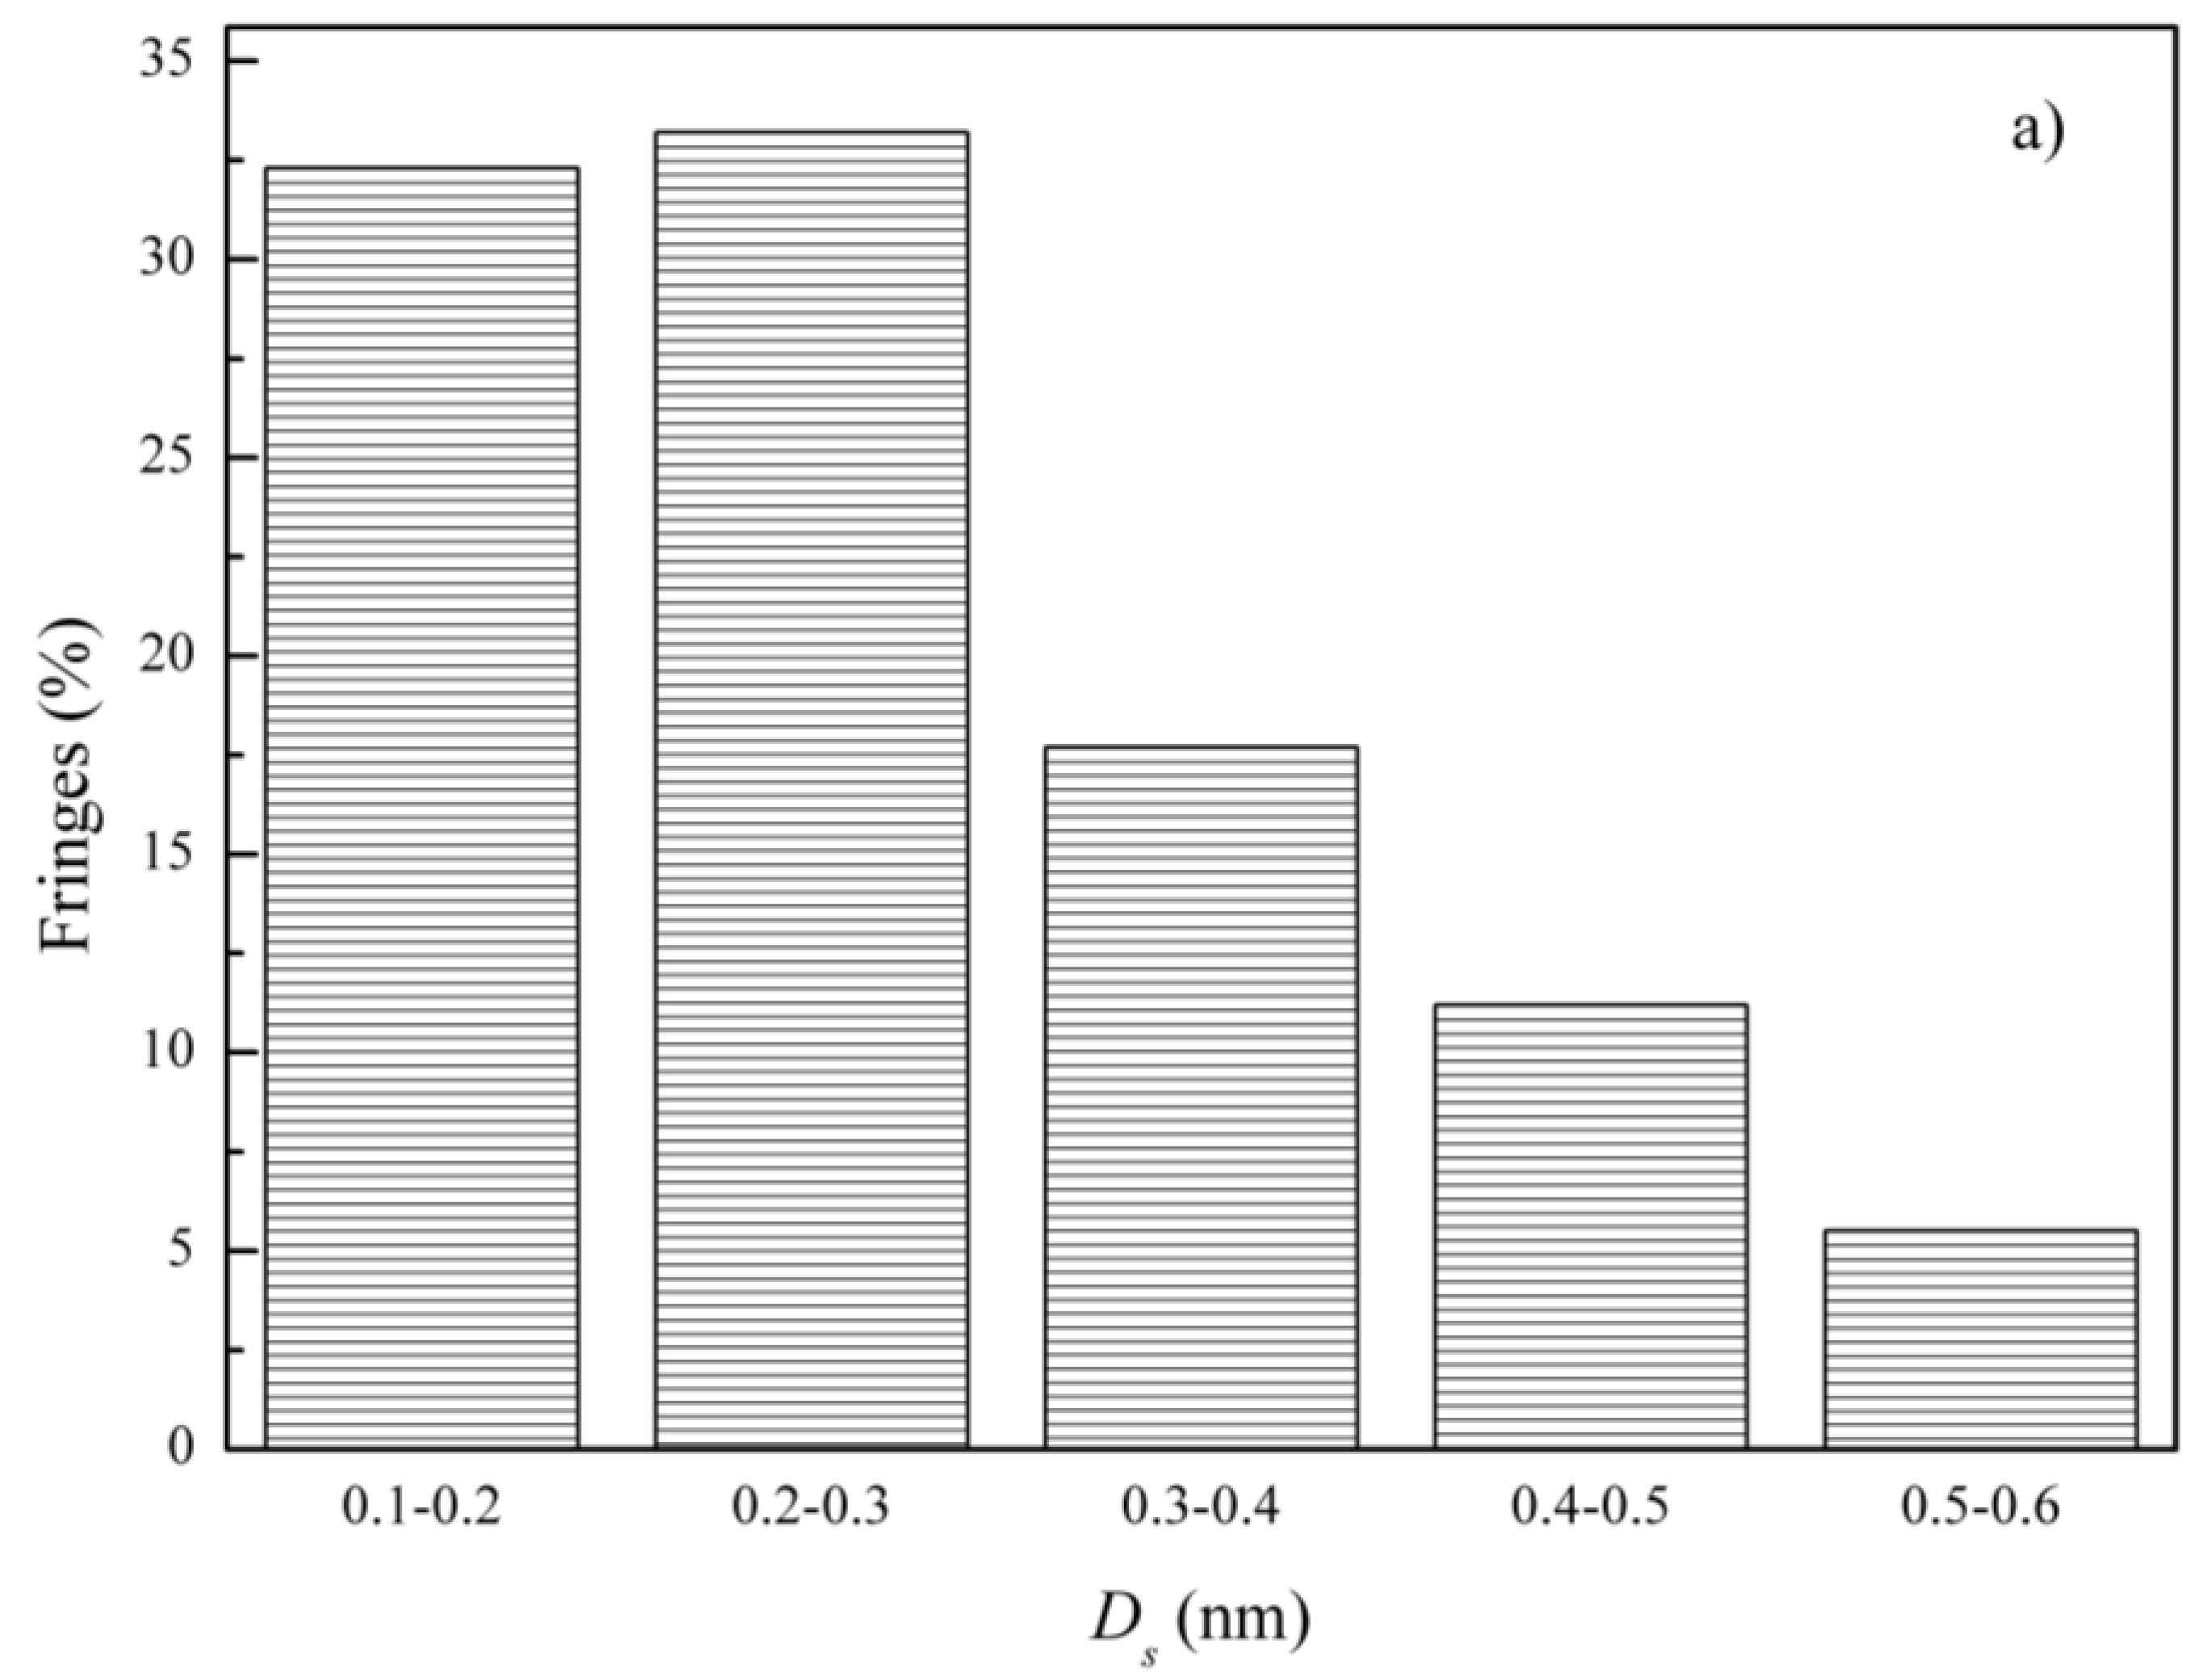
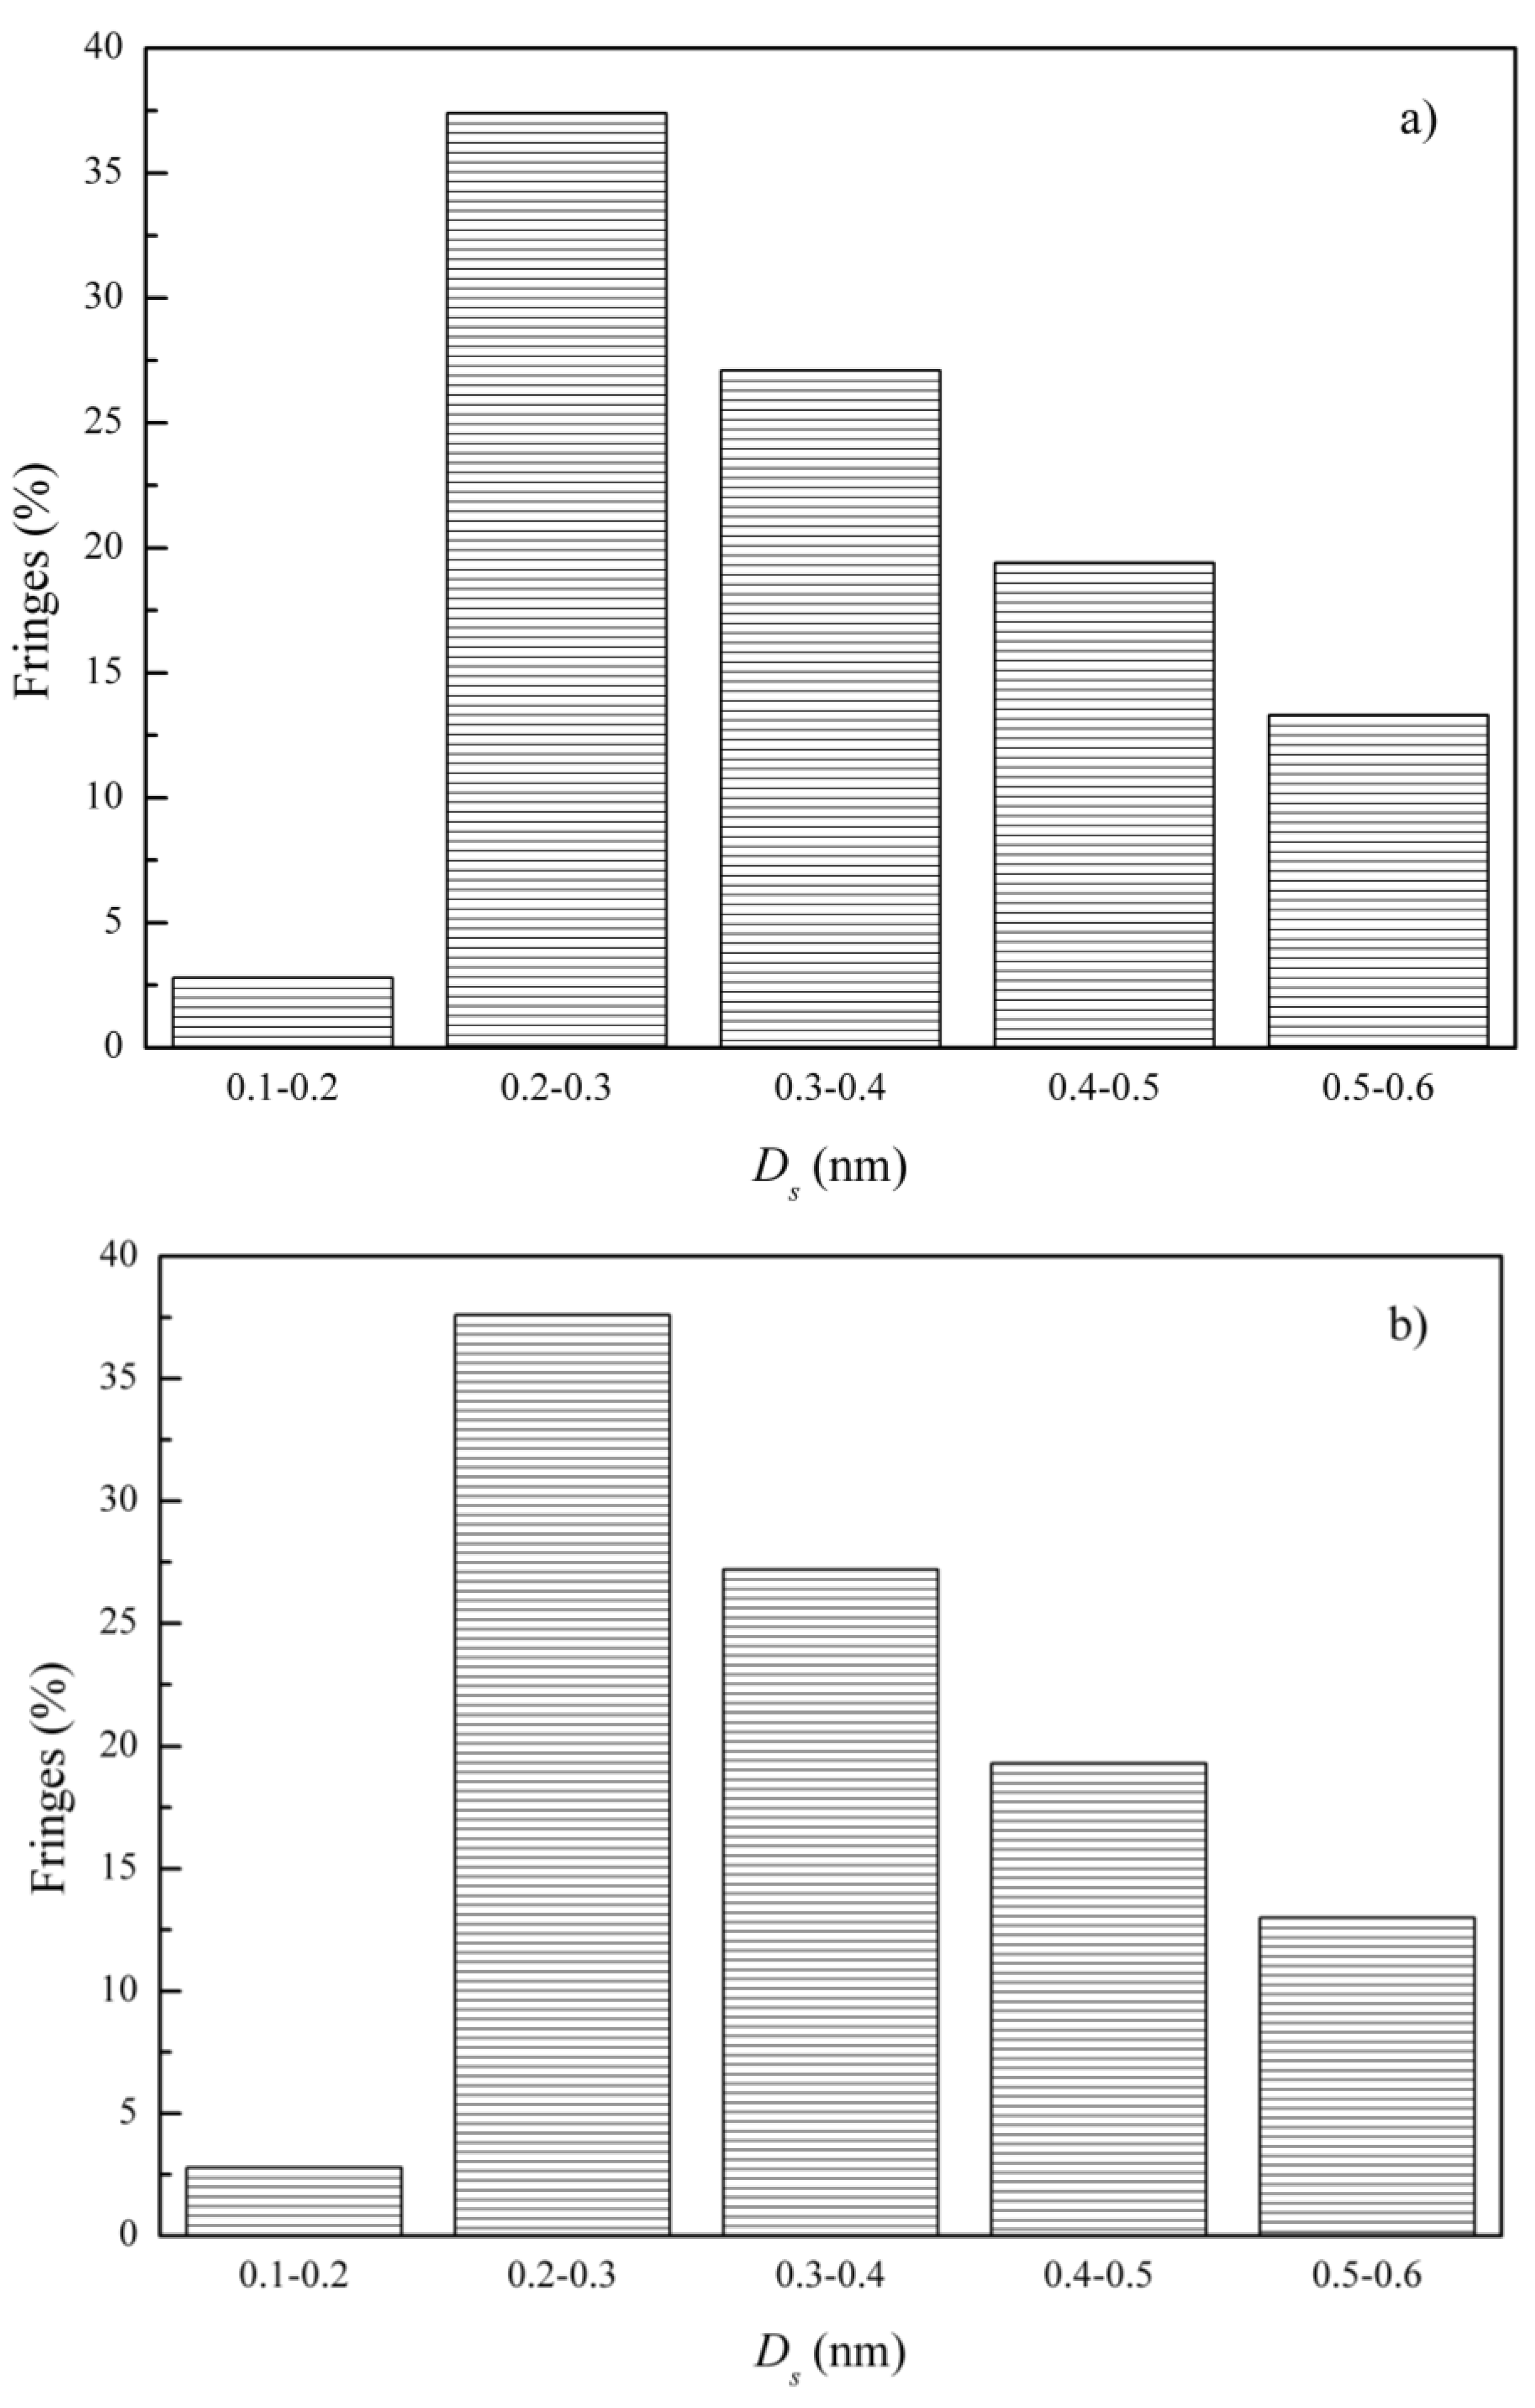
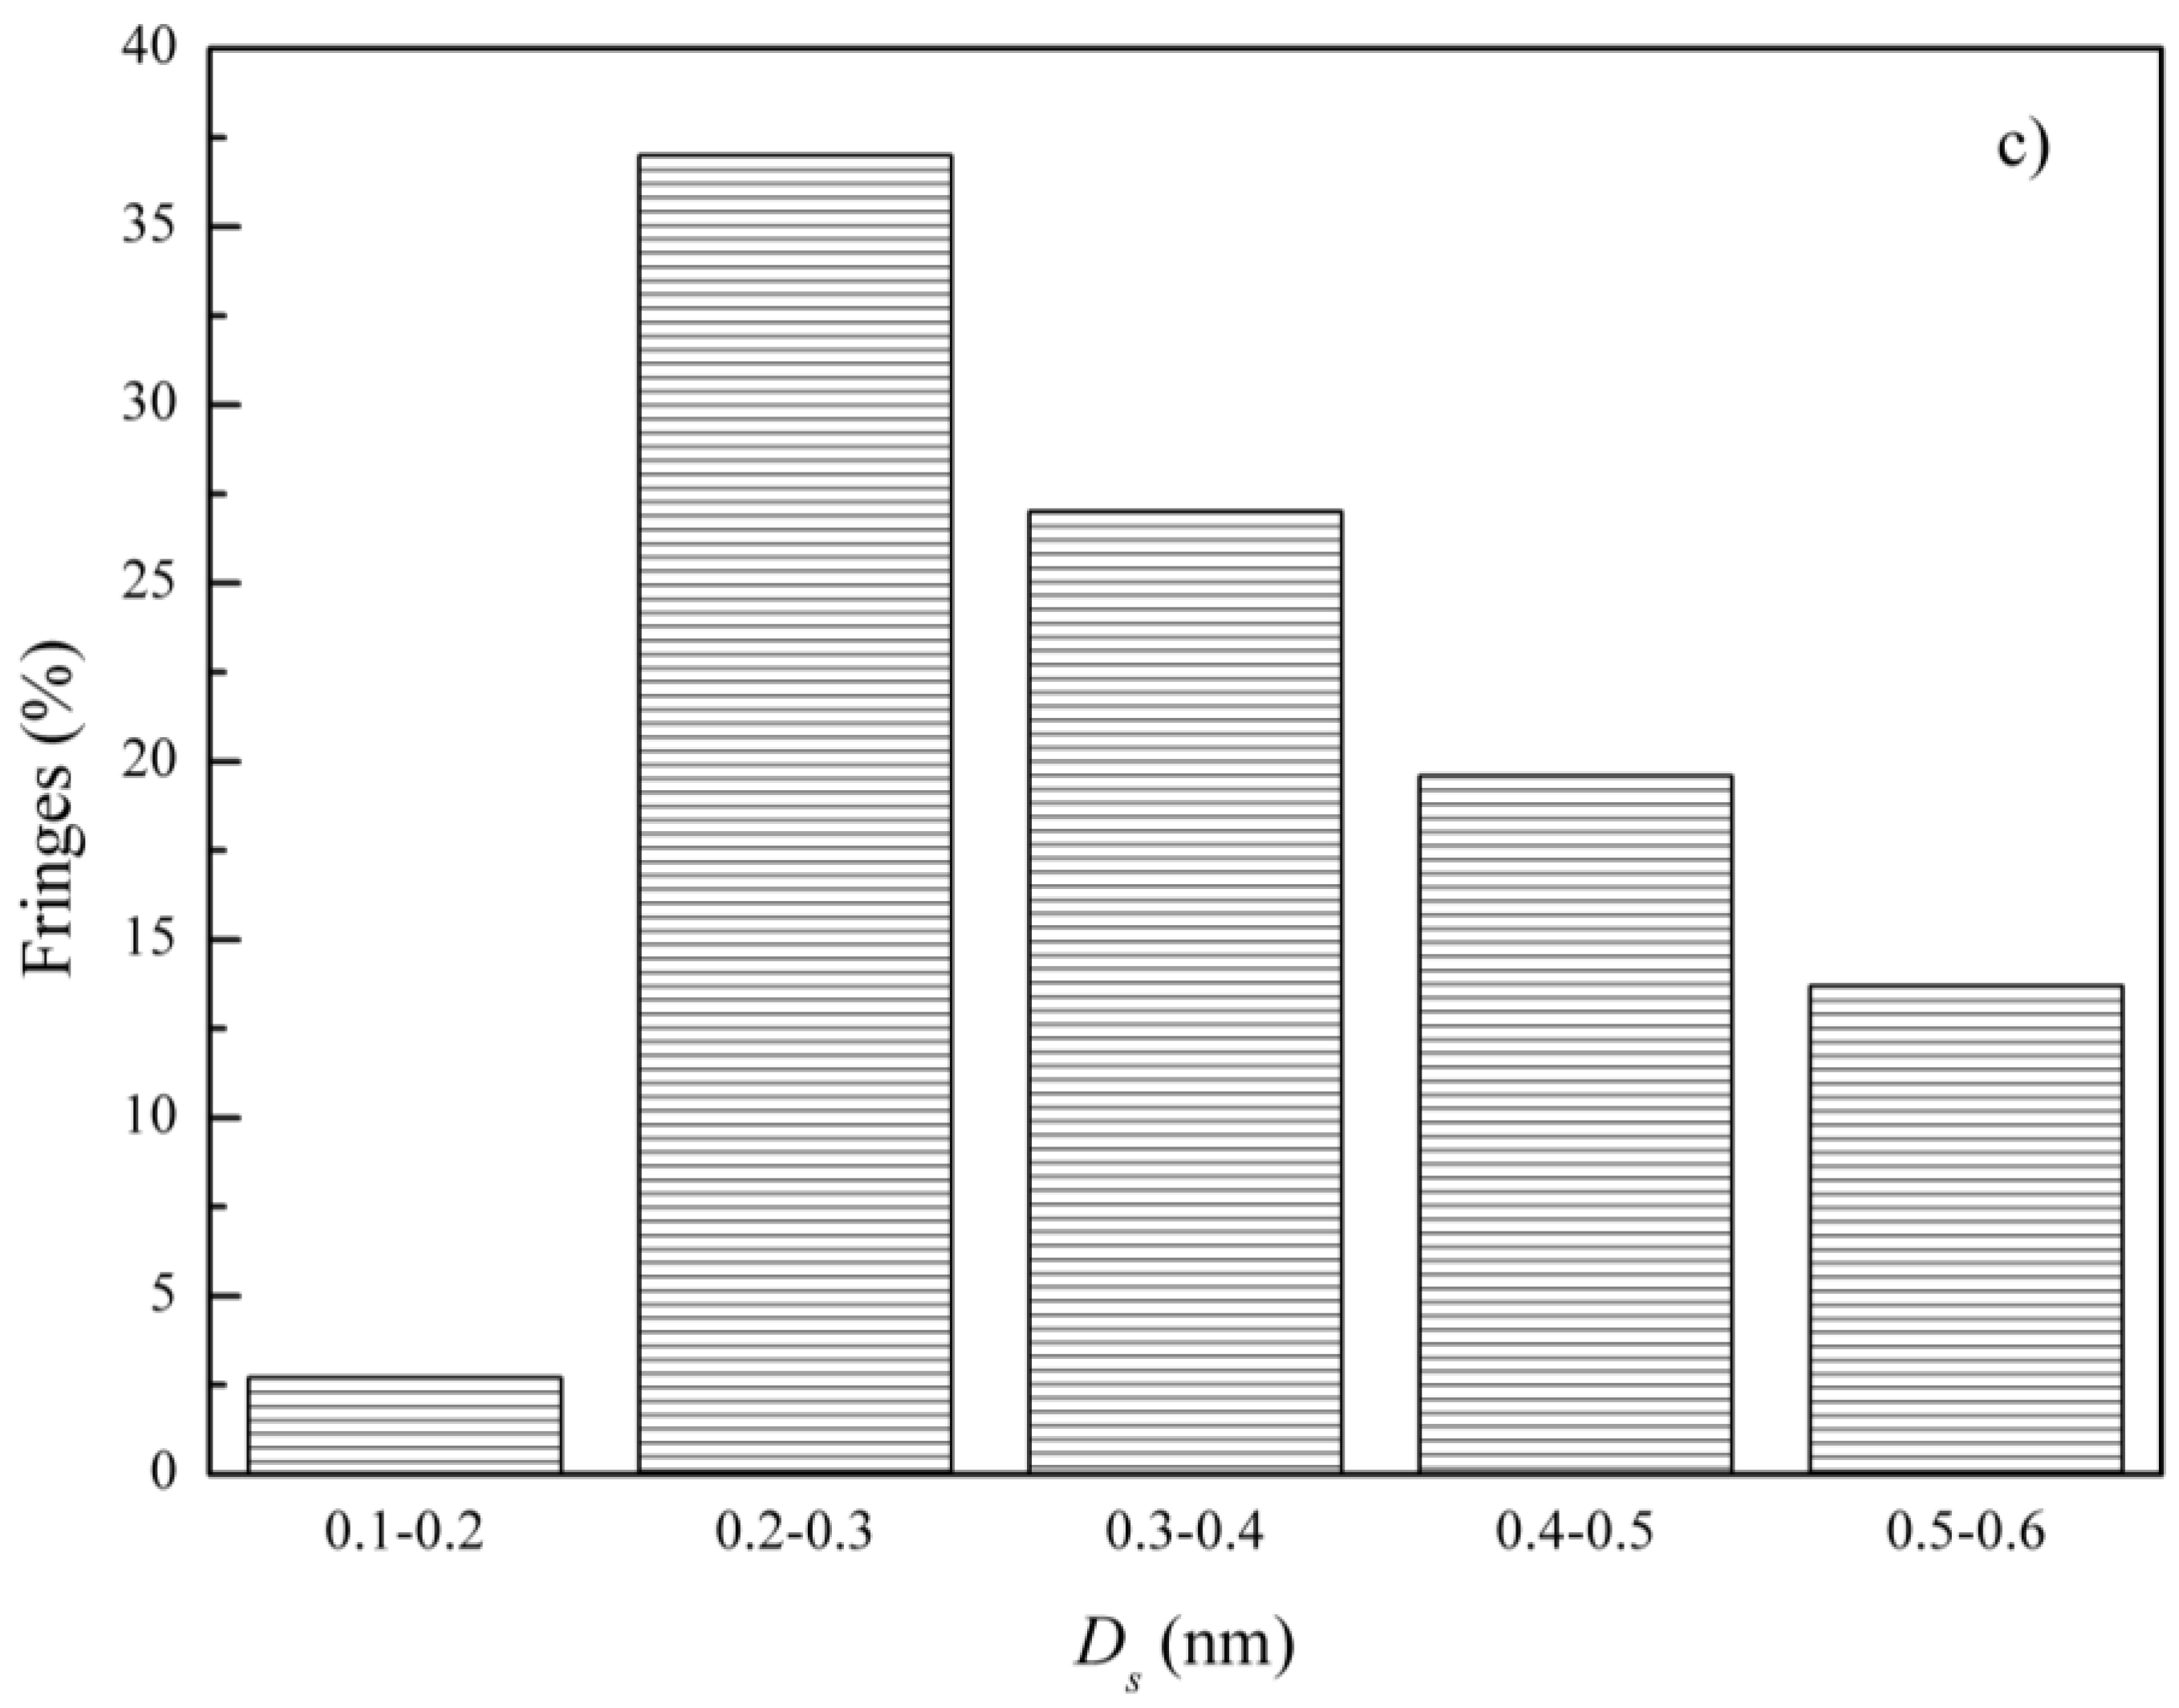
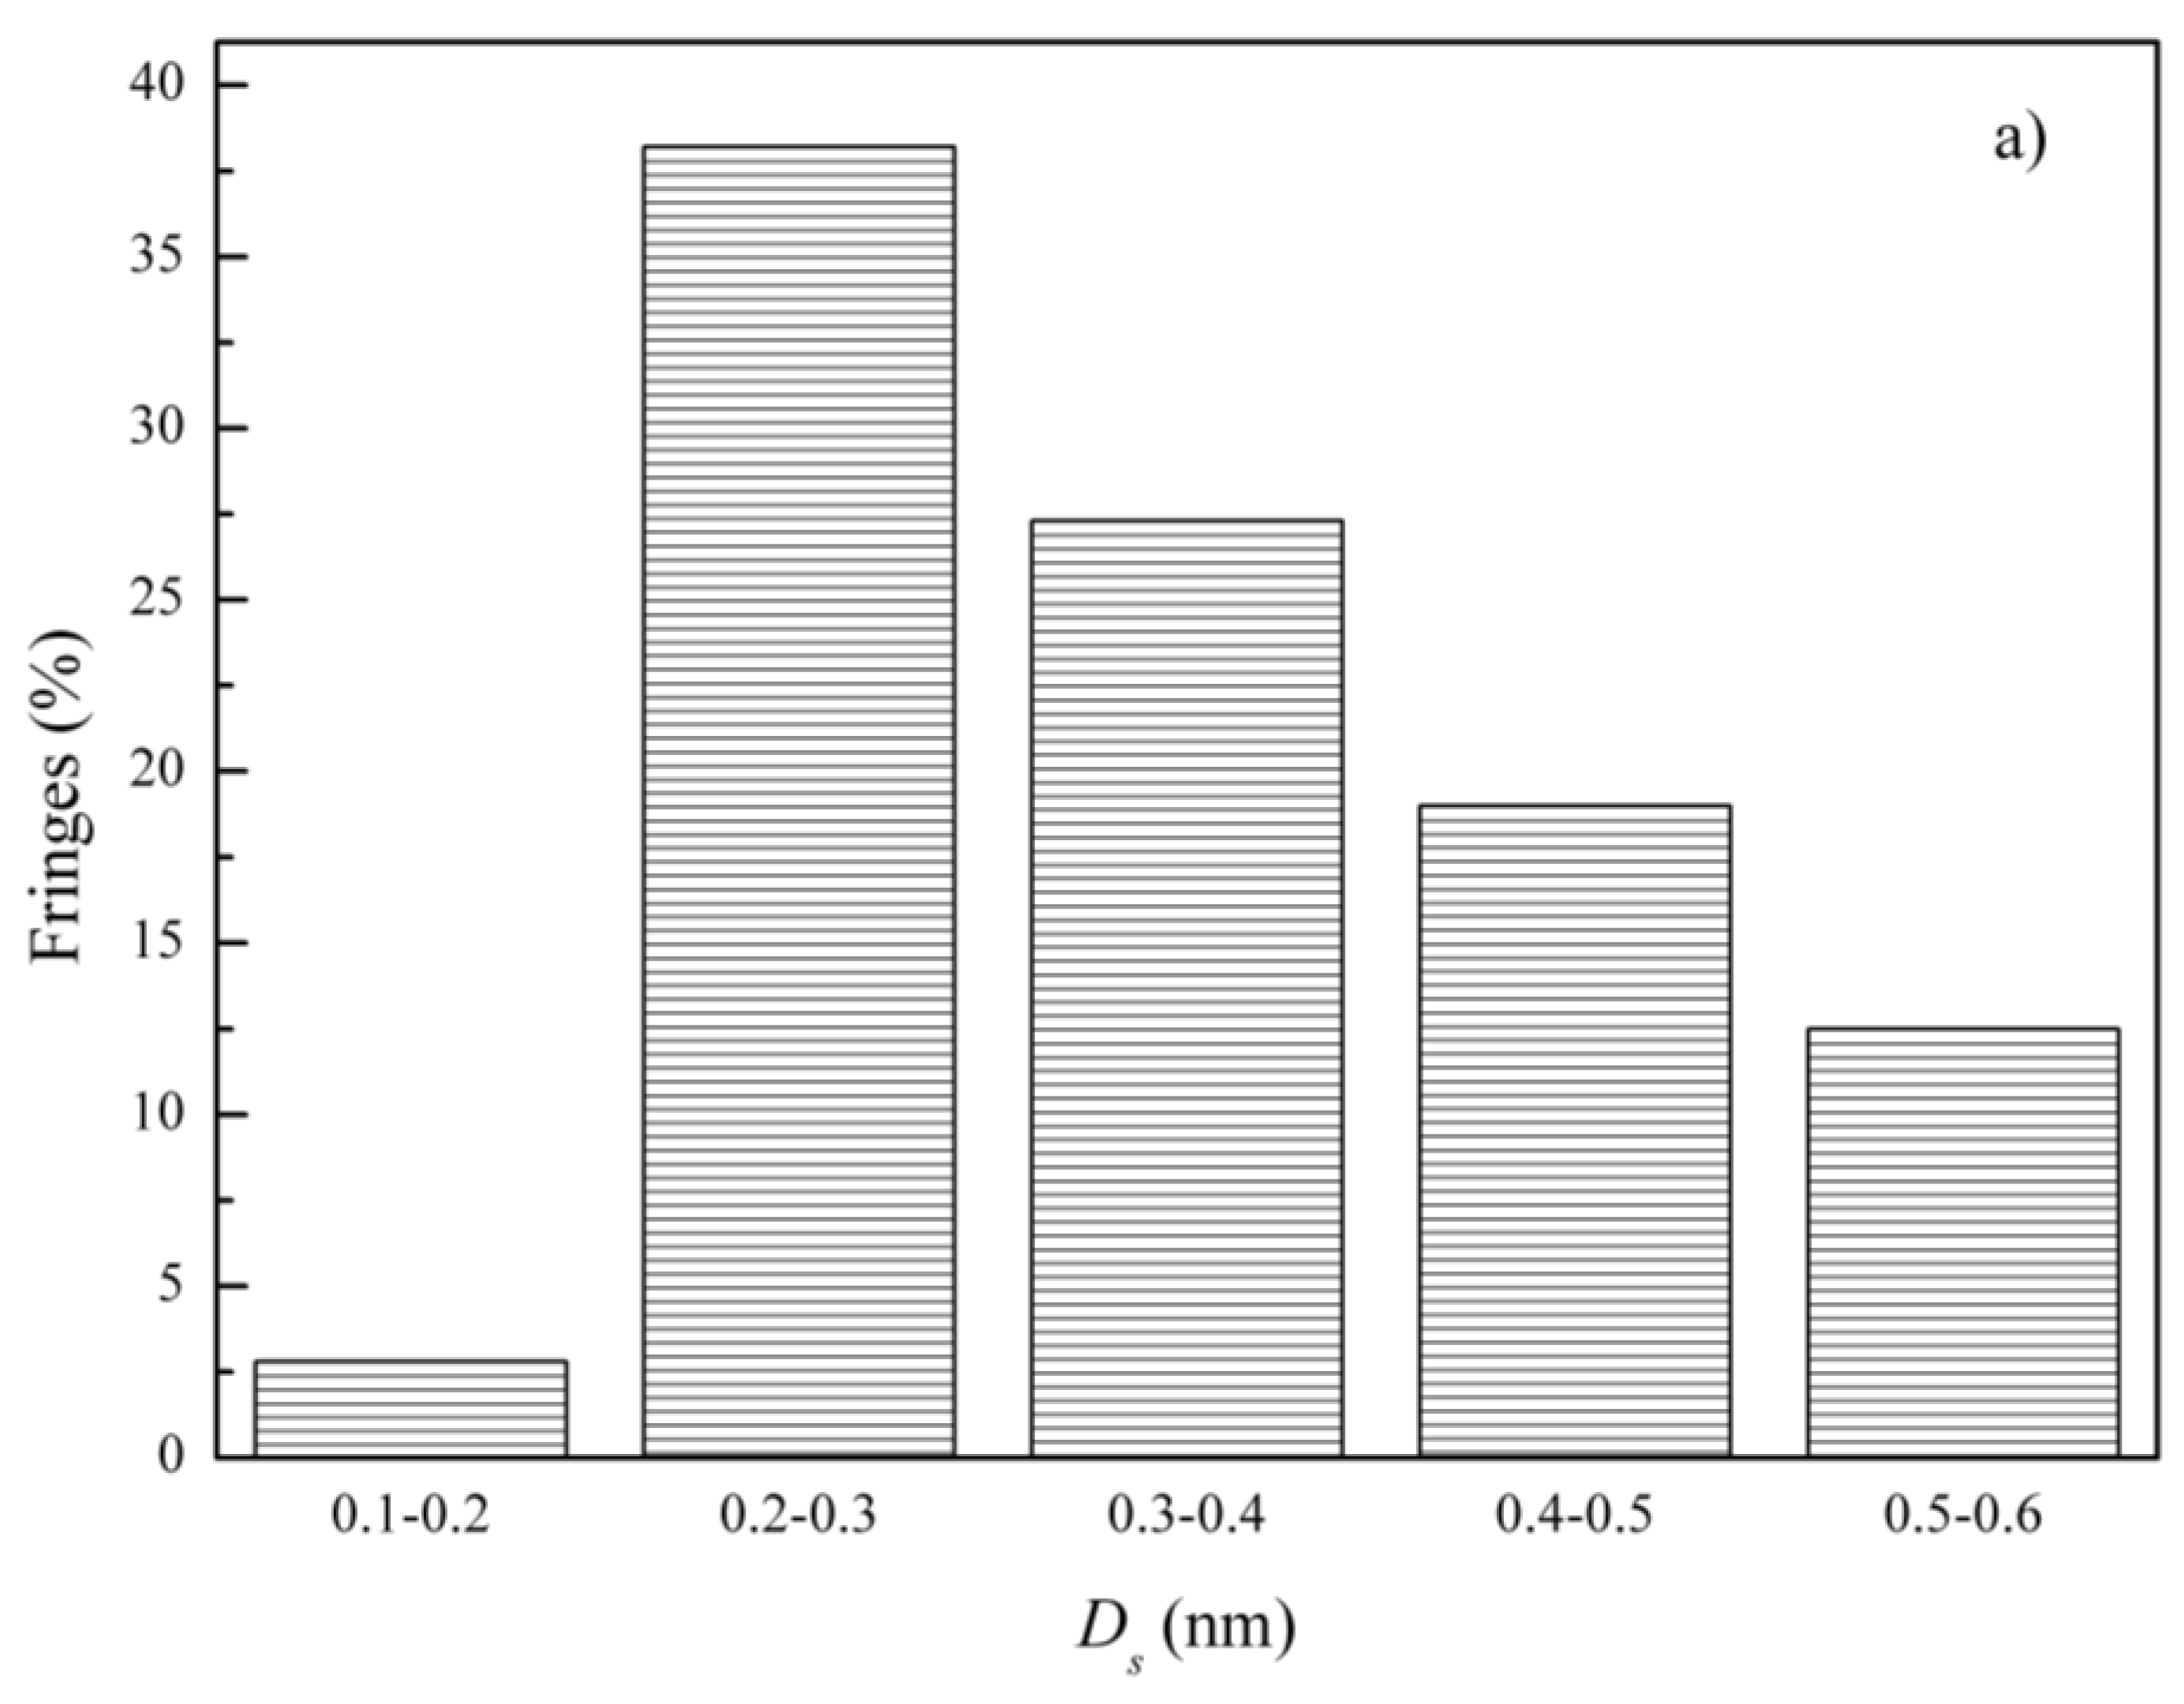
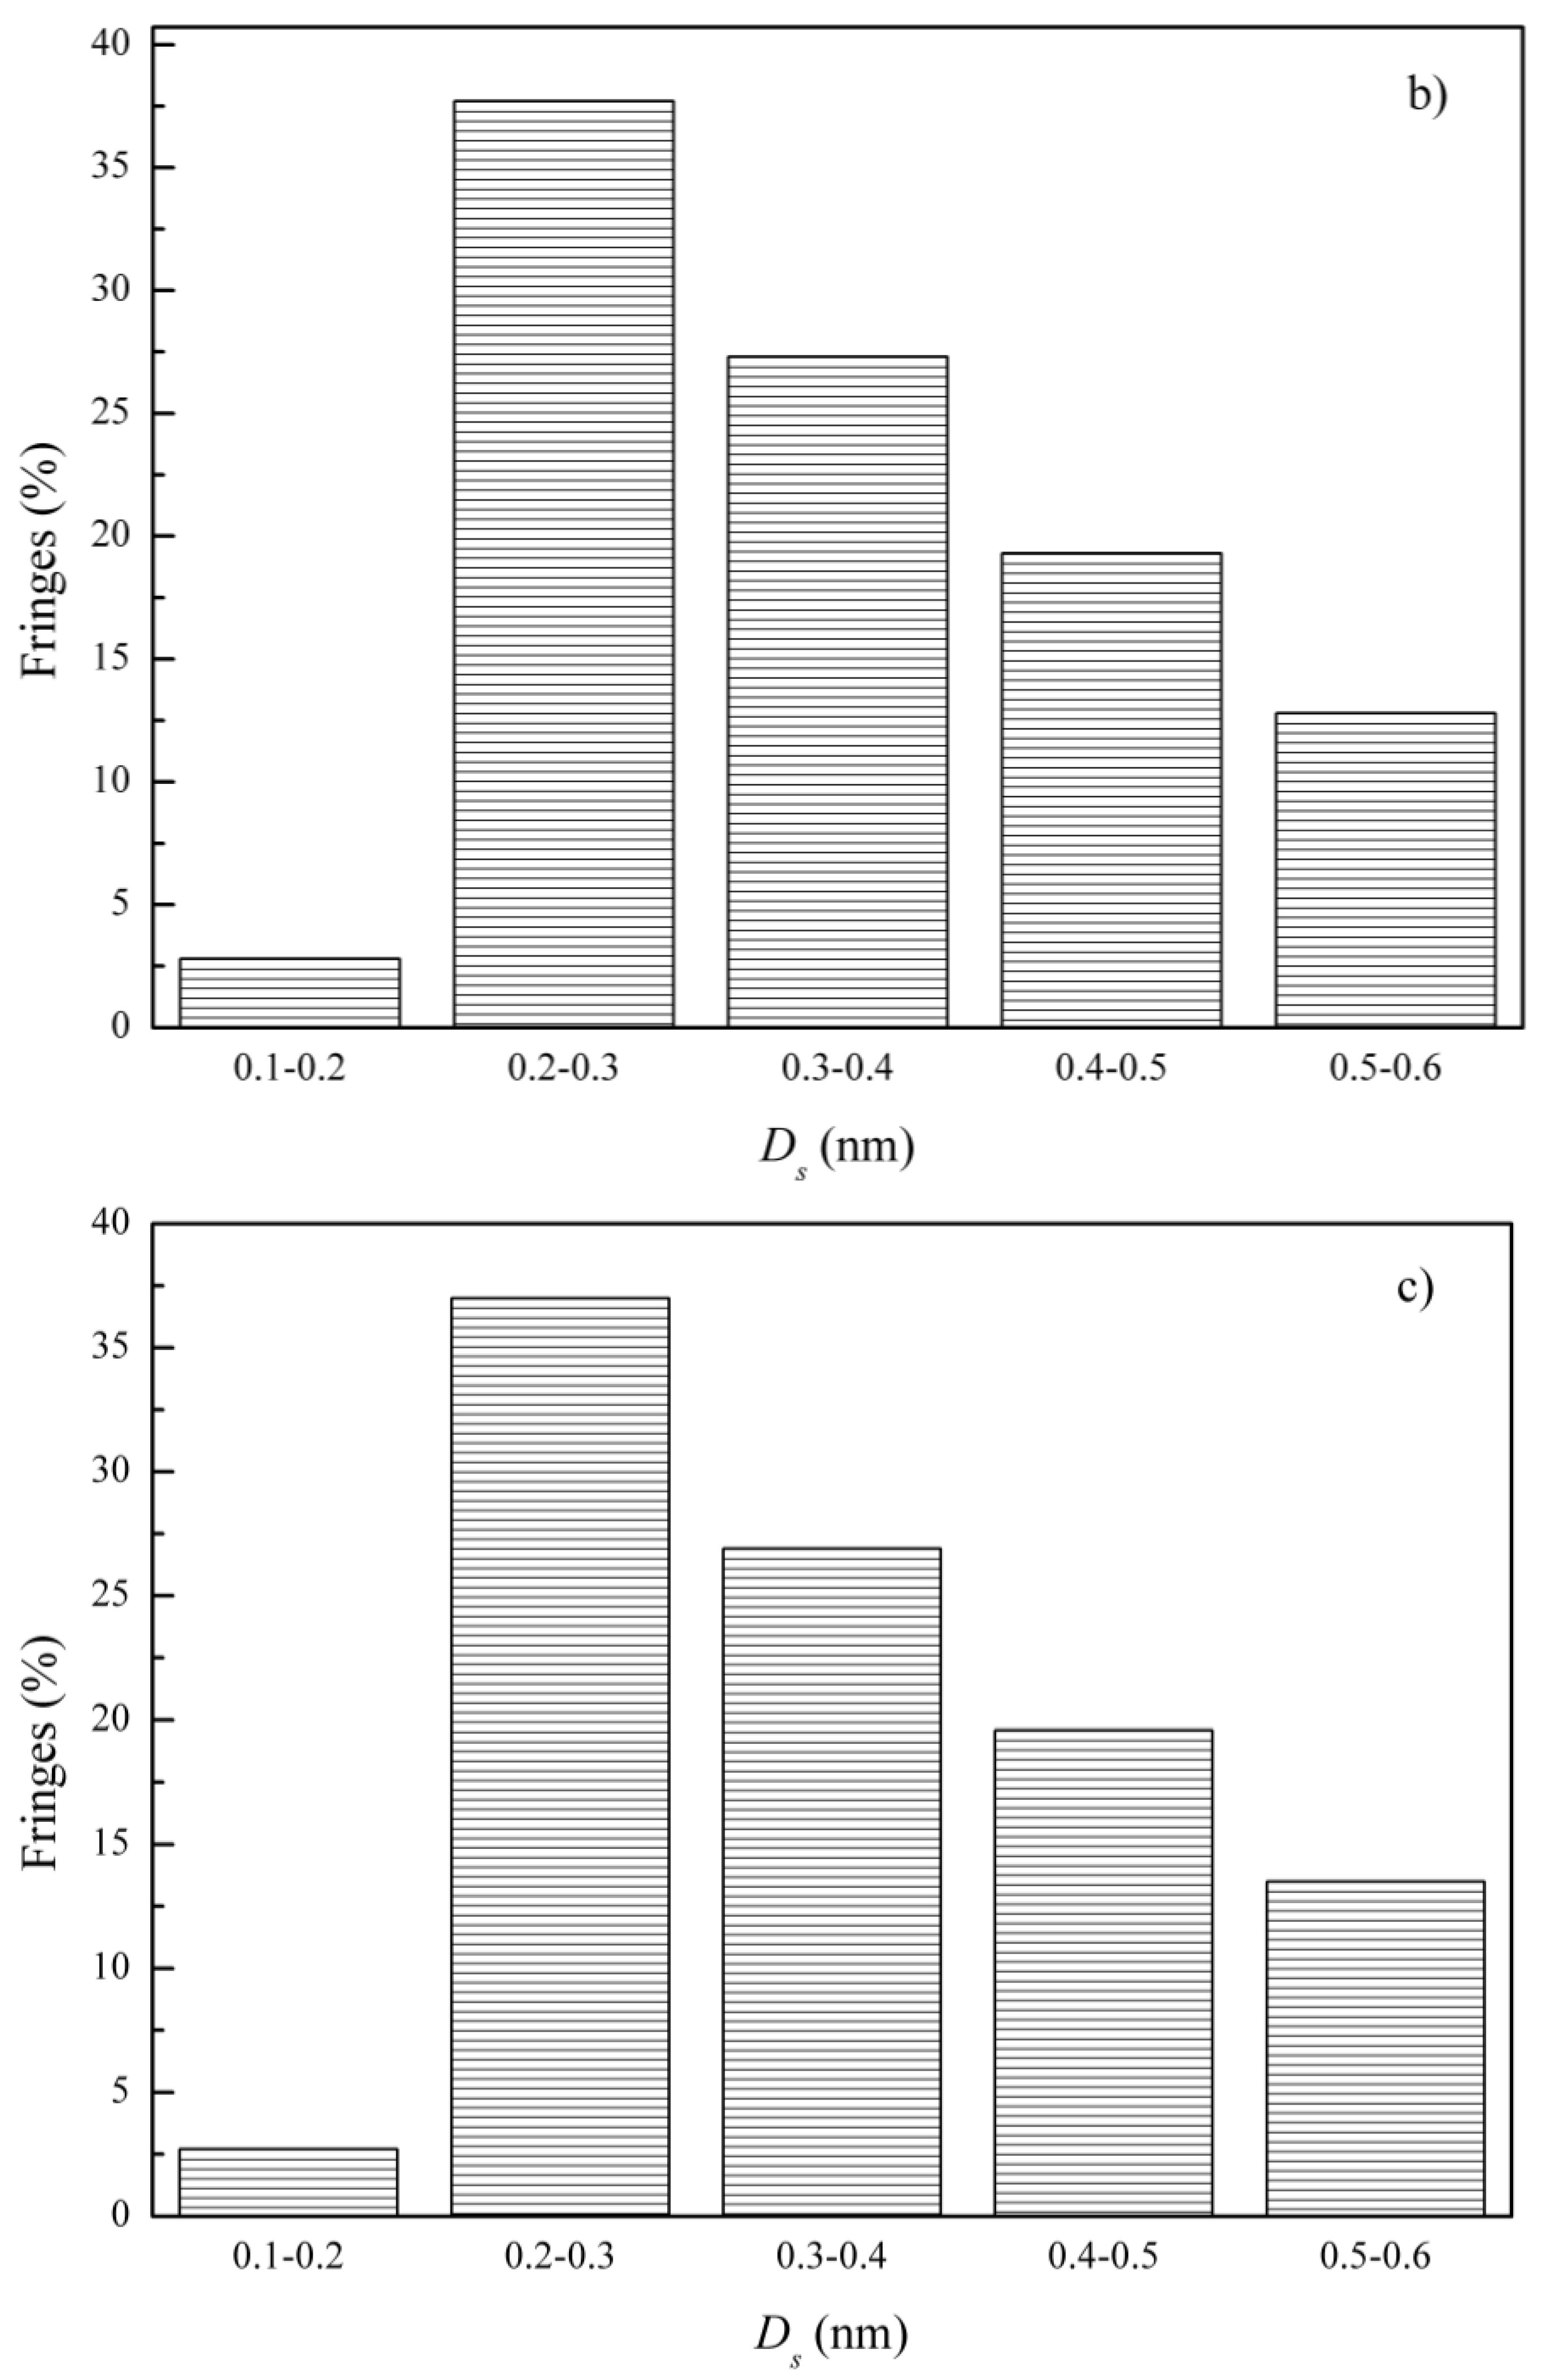
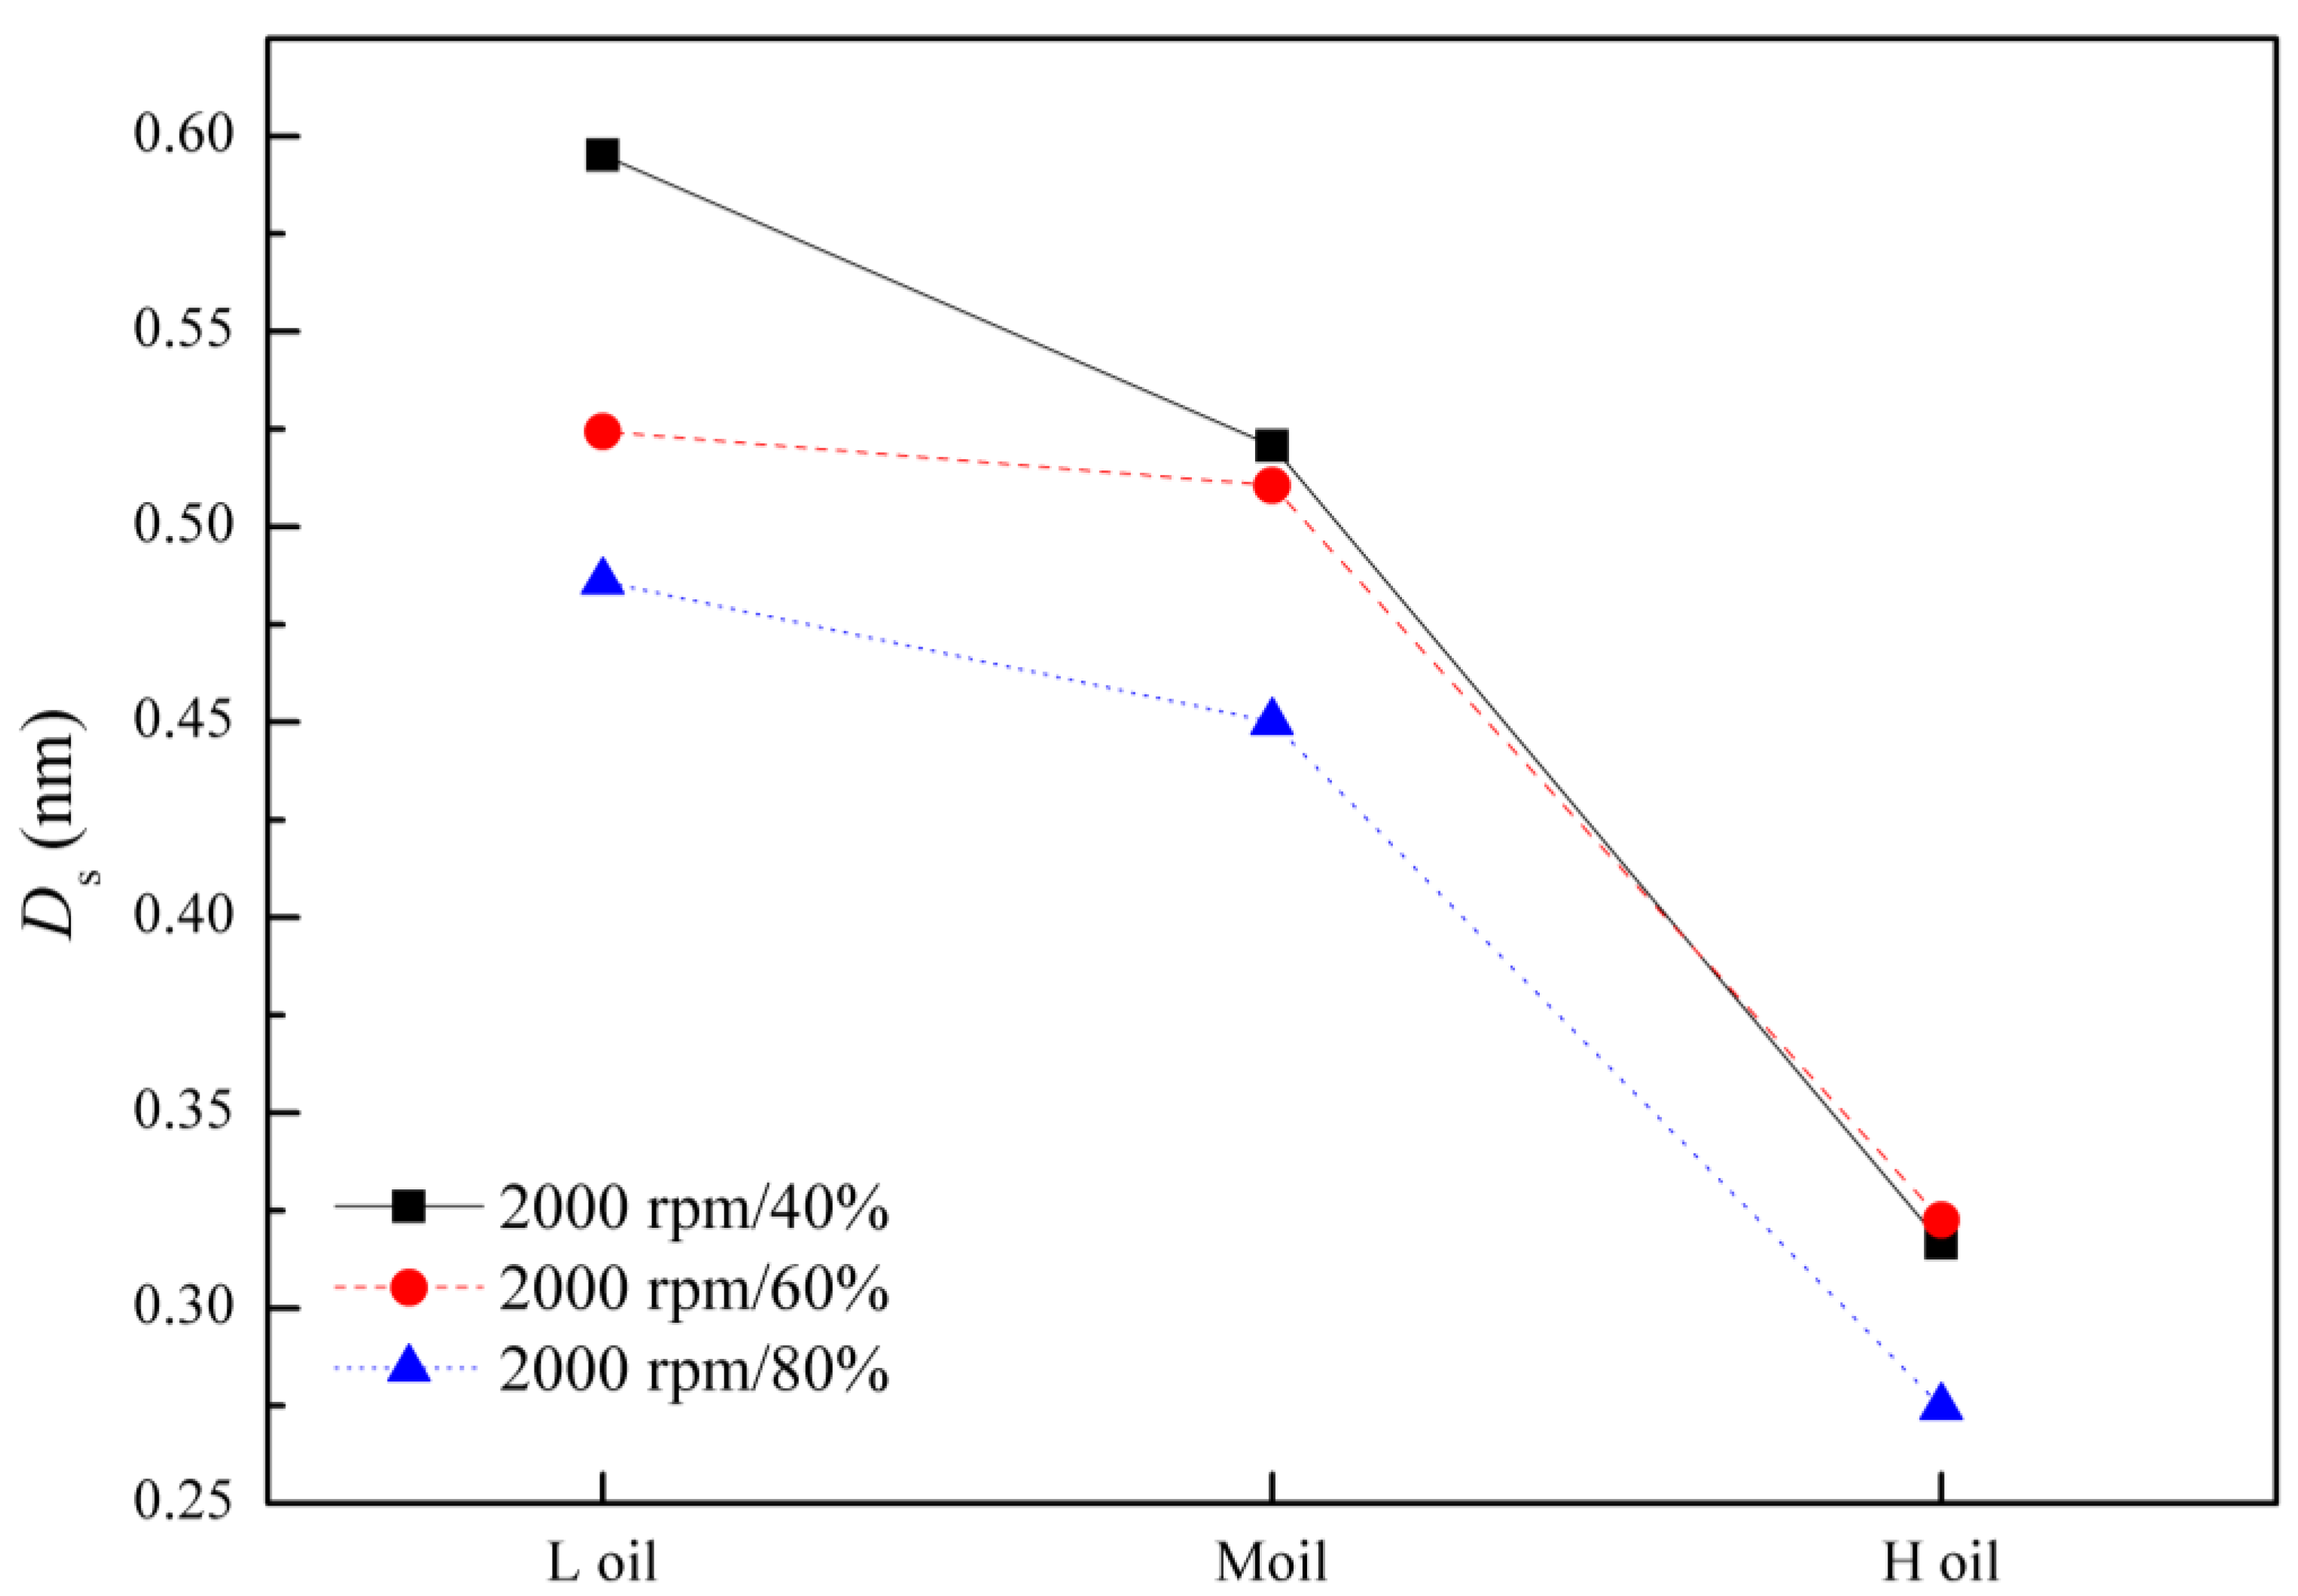
3.2.2. Fringe Separation Distance

Figure 9, Figure 10 and Figure 11 show the fringe separation distance distribution histograms of particles obtained from blending with three types of lubricant oil under different working conditions. Botero et al. [26] pointed out that Van der Waals forces were negligible when the fringe separation distance was smaller than 0.6 nm. In this study, the fringe separation distance of all samples was less than 0.6 nm, indicating that the effect of the Van der Waals forces is negligible. As shown in Figure 9, Figure 10 and Figure 11, the fringe separation distance presents parabolic-like shapes except for 2000 rpm/60% loading and 2000 rpm/80% loading in blending with H lubricant oil, which is consistent with previous research [7,25]. The fringe separation distance is in the range of 0.2–0.3 nm at the summit, which is 26.4–33.2%, 37–38.2%, and 37–37.6% corresponding to blends with H oil, M oil, and L oil, respectively. When compared to the proportions of fringe separation distance in blending with H lube, the fringe separation distance in the range of 0.5–0.6 nm increases slightly when blending with M lube and L lube, which is around 15%.
As illustrated in Figure 12, the fringe separation distance, which is an average value, decreases with the rising ash content in the lubricant oil operating under the same working conditions. It is deduced that the arrangement of particles obtained from blending with M lube and L lube is more compact. The fringe separation distance is linked to the possibility of oxygen accessing the carbon layer. The larger value means the arrangement of fringe is looser and makes it more likely for oxygen to access the carbon layer, which leads to an increase in the oxidation activity of particles. Therefore, once again, it is found that the oxidation activity of particles decreases with the rising ash content in the lubricant oil, which is consistent with the result that the proportion of larger fringe separation distance is lower when blending with H oil in Figure 9, Figure 10 and Figure 11. Additionally, the fringe separation distance decreases with the increasing engine loading in blending with the same oil, which means the arrangement of particles is more compact.

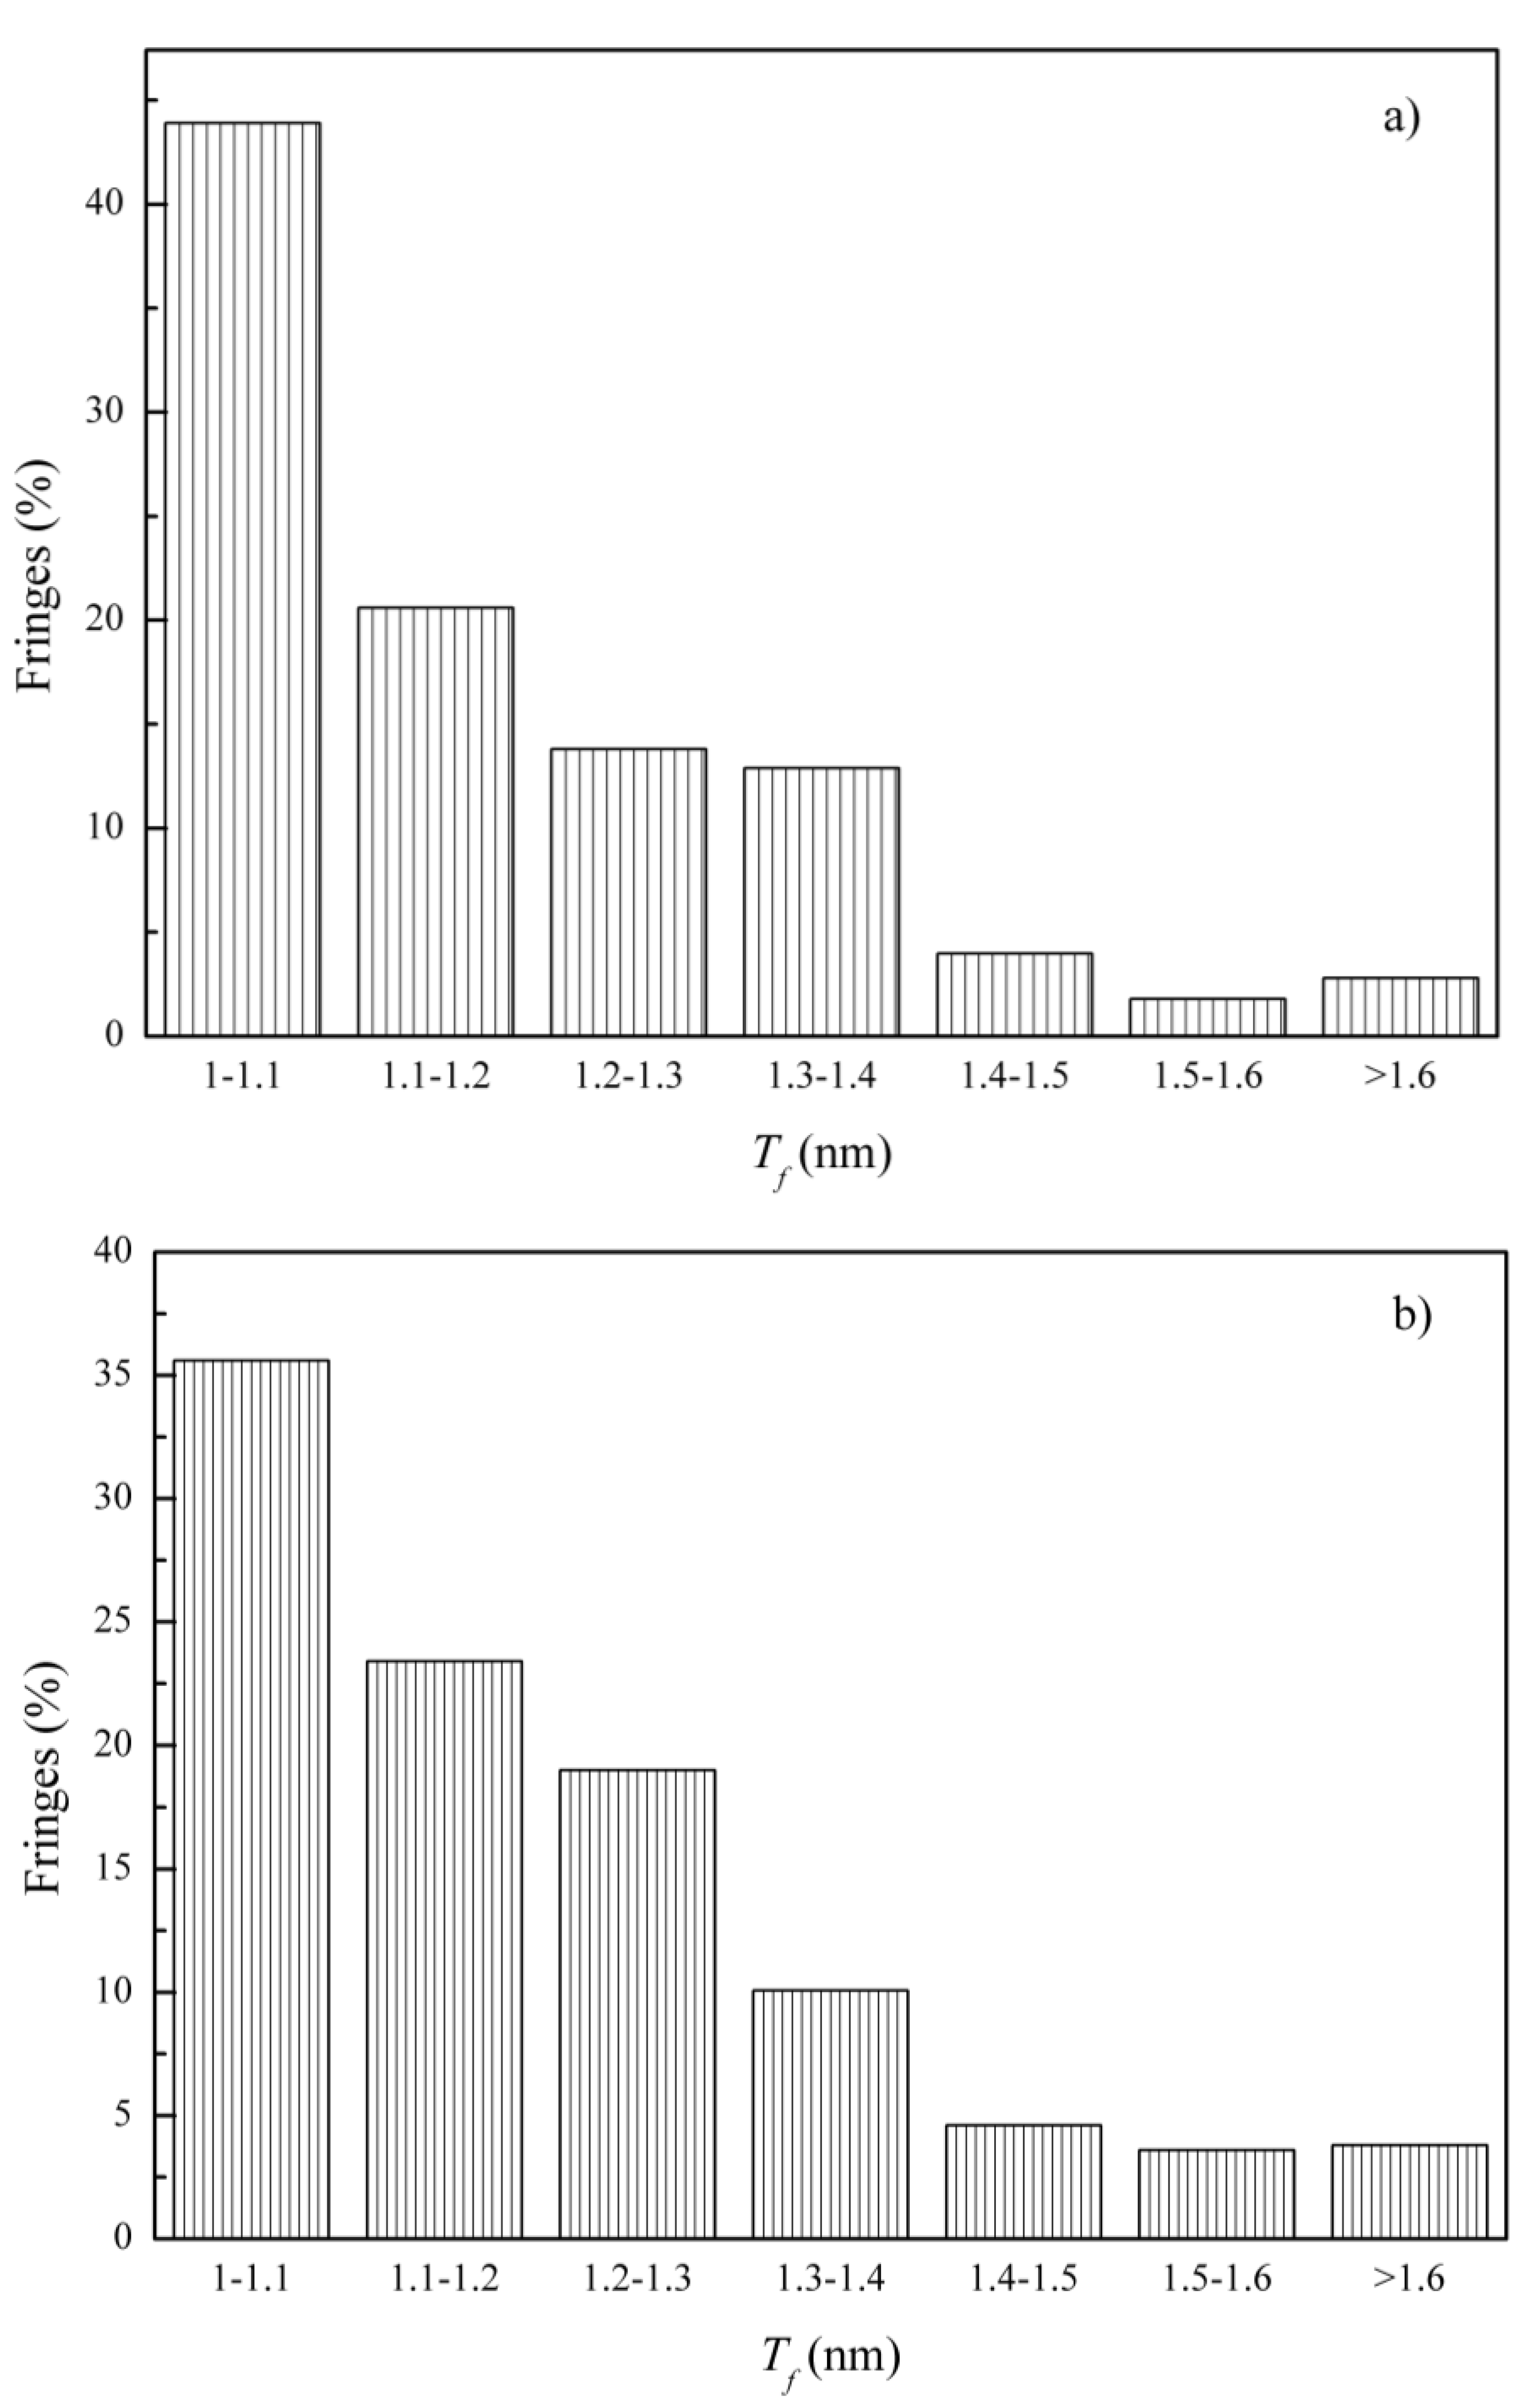
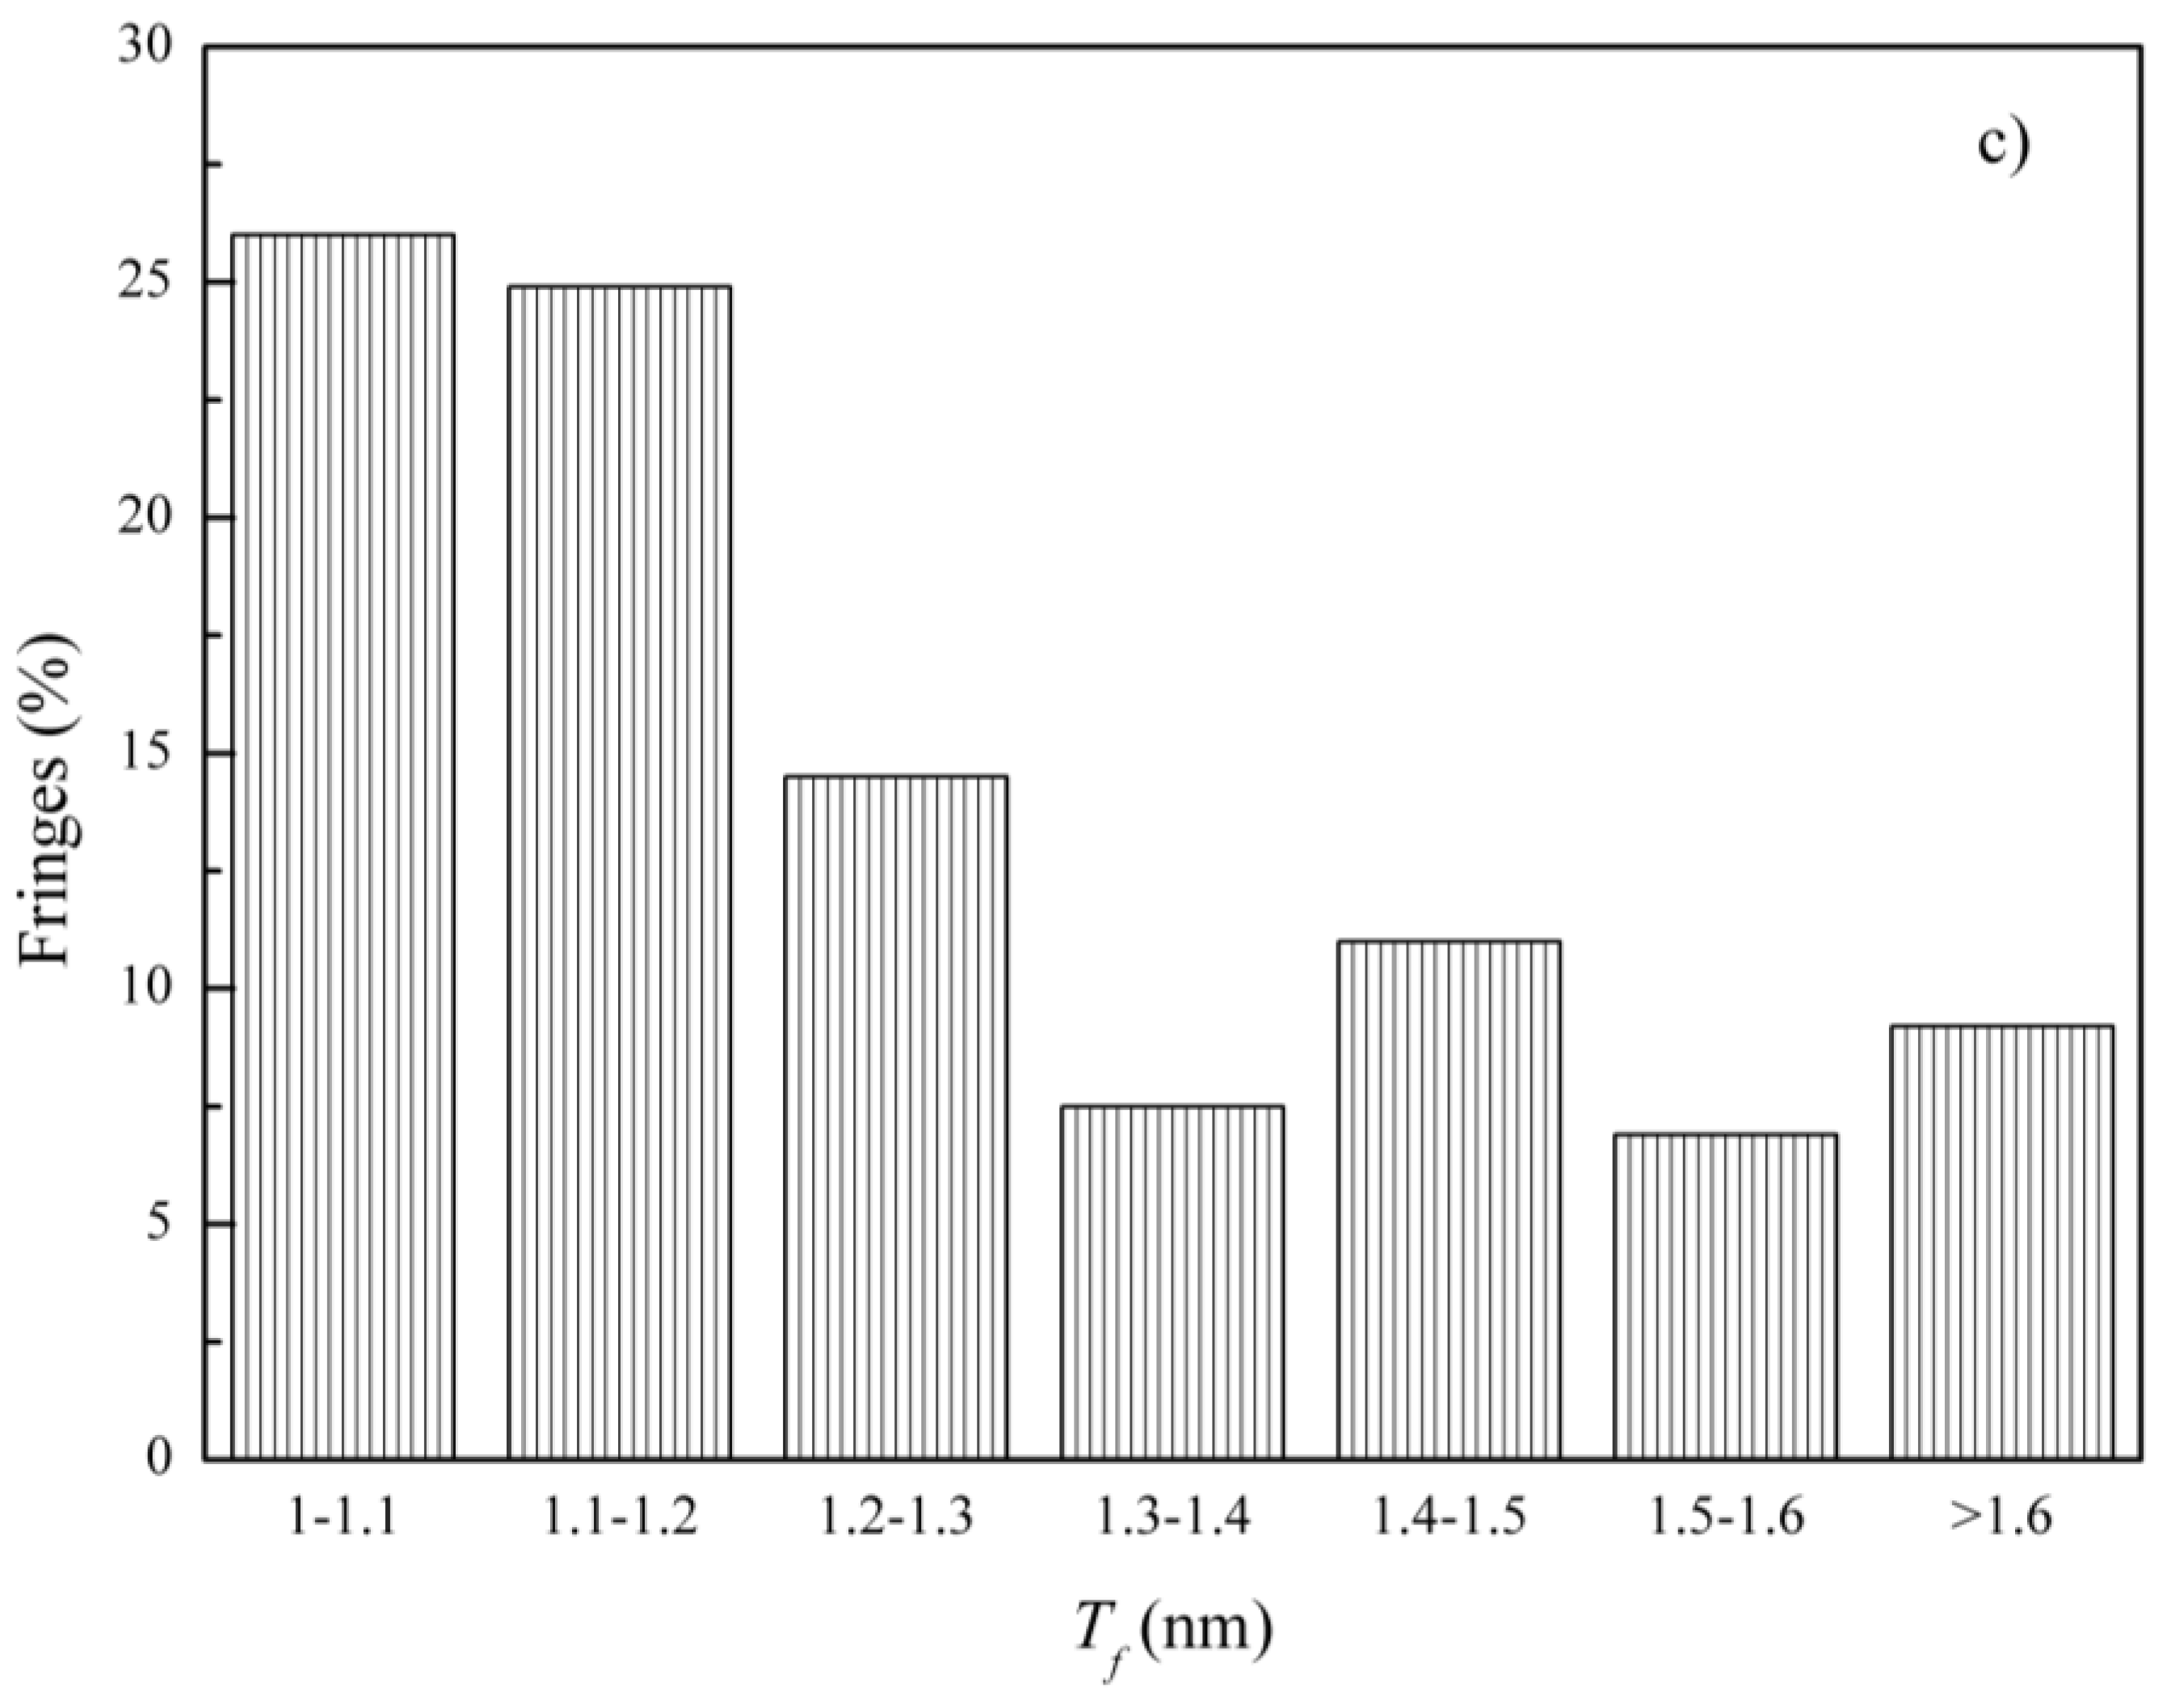
3.2.3. Fringe Tortuosity

The fringe tortuosity distribution histograms of particles obtained from blending with three types of lubricant oil under different working conditions are illustrated in Figure 13, Figure 14 and Figure 15. Similar to the distribution of the fringe length, the fringe tortuosity proportion decreases as the tortuosity value increases as a whole. The tortuosity values for the majority of fringes fall within the range of 1–1.1, which represents 35.6–43.9%, 47.8–55.1%, and 24.5–26% corresponding to blending with H oil, M oil, and L oil, respectively. The fringe tortuosity indirectly indicates the specific surface area of particles, which plays a key role in the adsorption between oxygen molecules and the fringes [19,22]. Therefore, compared to the particles obtained from blending with H oil and M oil, the tortuosity changes for the particles obtained from blending with L oil are the greatest, which indirectly reflects that its specific surface area changes are the greatest.
The effects of ash content in lubricant oil on the fringe tortuosity are shown in Figure 16. It is necessary to mention that the value of fringe tortuosity is an average value. It can be observed that the fringe tortuosity decreases when the ash content in the lubricant oil increases from 0.92% to 1.21%. However, there is only a slight change in the fringe tortuosity when the ash content in the lubricant oil increases from 1.21% to 1.92%. Fringe tortuosity indicates the degree of disorder in the carbon lattice, and a high value is related to an increase in the sp2/sp3 hybridization ratio, which means poor electron resonance stabilization and high oxidation activity [27,28]. Therefore, the phenomenon indicates that the oxidation activity of the particles obtained from blending with L oil is higher than that of the particles obtained from blending with H oil and M oil. Additionally, unlike the tendency of fringe length and fringe separation distance, the fringe tortuosity does not present a single trend in relation to the engine working conditions when blending with the same oil.
Table 3. Specifications of lube oils used in the test.
PropertyMethodH oilM oilL oil
Density at 20 °C (kg/m3)SH/T0604-2000 [28]858.1872.5860.4
Viscosity at 40 °C (mm2/s)GB/T265-88 [29]72.78114.195.3
Viscosity at 100 °C (mm2/s)GB/T265-8812.315.213.5
Viscosity index (-)-156158157
Viscosity grade-15W-405W-4010W-40
API service classification-CJ-4CJ-4CK-4
Carbon content (%)SH/T0656-1988 (2004) [30]83.9985.1685.11
Hydrogen content (%)SH/T0656-1988 (2004)13.8513.8213.84
Ash content (%)GB/T2433-2001 [31]1.921.210.92
Sulfur content (%)SH/T0689-2000 [32]0.410.440.40
Ca content (%)ICP-MS0.110.140.47
Zn content (%)0.130.110.11
P content (%)0.120.120.11
Si content (%)0.000310.000830.0005

4. Conclusions

In this study, the effects of ash from three different lubricating oils on the nanostructure of diesel particulate matter were investigated using high-resolution transmission electron microscopy. The following conclusions could be made.
The results show that all the samples obtained from blending with different lubricant oils present typical core–shell structures. Under the same working conditions, the inner cores change a little with the increasing ash content in the lube oil, whereas the thickness of the outer shells increase. Furthermore, the boundaries of the single core–shell structures appear fuzzier and overlapped.
The fringe length increases and the fringe separation distance decreases with the rising ash content in the lube operating under the same working conditions. The fringe separation distance distribution presents a parabolic-like shape. Moreover, the arrangement of particles obtained from blending with M lube and L lubricant oil is more compact.
The fringe tortuosity decreases when the ash content in the lube increases from 0.92% to 1.21%, while it changes a little when the ash content in the lube increases from 1.21% to 1.92%. Based on the effects of ash on the nanostructure parameters, it is inferred that the oxidation activity of particles decreases with the increasing ash content in the lube.

Author Contributions

L.W.: methodology, conceptualization, validation, and writing—original. J.Y.: experiment performance and writing—review and editing. H.W.: experiment performance and writing—review and editing. D.Y.: data curation and investigation. Y.G.: editing and funding acquisition. P.N.: supervision and funding acquisition. All authors have read and agreed to the published version of the manuscript.

Funding

This research is sponsored by the National High-Tech Research and Development Program (Grant No. 2016YFC0208005), and the National Natural Science Foundation of China (Grant No. 5157060575).

Institutional Review Board Statement

Not applicable.

Informed Consent Statement

Not applicable.

Data Availability Statement

Authors declare no conflict of interest.

Conflicts of Interest

The authors declare no competing interests.

Abbreviations and Symbols

DPFDiesel particulate filter
DOCDiesel oxidation catalyst
EGRExhaust gas recirculation
GDIGasoline direct-injection
HRTEMHigh-resolution transmission electron microscopy
PMParticulate matter
TEMTransmission electron microscopy
DsFringe separation distance
LaFringe length
TfFringe tortuosity

References

  1. Liati, A.; Dimopoulos Eggenschwiler, P.; Müller Gubler, E.; Schreiber, D.; Aguirre, M. Investigation of diesel ash particulate matter: A scanning electron microscope and transmission electron microscope study. Atmos. Environ. 2012, 49 (Suppl. C), 391–402. [Google Scholar] [CrossRef]
  2. Gao, J.; Tian, G.; Ma, C.; Chen, J.; Huang, L. Physicochemical property changes during oxidation process for diesel PM sampled at different tailpipe positions. Fuel 2018, 219, 62–68. [Google Scholar] [CrossRef]
  3. Shi, Y.; Cai, Y.X.; Li, X.; Ji, L.; Chen, Y.; Wang, W. Evolution of diesel particulate physicochemical properties using nonthermal plasma. Fuel 2019, 253, 1292–1299. [Google Scholar] [CrossRef]
  4. Bao, J.H.; Qu, P.P.; Wang, H.Y.; Zhou, C.Y.; Zhang, L.; Shi, C. Implementation of various bowl designs in an HPDI natural gas engine focused on performance and pollutant emissions. Chemosphere 2022, 303, 135275. [Google Scholar] [CrossRef]
  5. Bao, J.H.; Wang, H.H.; Wang, R.F.; Wang, Q.X.; Di, L.M.; Shi, C. Comparative experimental study on macroscopic spray characteristics of various oxygenated diesel fuels. Energy Sci. Eng. 2023, 11, 1579–1588. [Google Scholar] [CrossRef]
  6. Wang, H.H.; Ge, Y.S.; Tan, J.W.; Hao, L.; Wu, L.; Yang, J.; Du, Q.; Zhang, H.; Huang, Y.; Chen, Y.; et al. Ash deposited in diesel particular filter: A review. Energ. Source. Part A 2018, 41, 2184–2193. [Google Scholar] [CrossRef]
  7. Gao, J.B.; Ma, C.; Xing, S.; Sun, L.; Huang, L. Nanostructure analysis of particulate matter emitted from a diesel engine equipped with a NTP reactor. Fuel 2017, 192, 35–44. [Google Scholar] [CrossRef]
  8. Shi, C.; Chai, S.; Wang, H.Y.; Ji, C.W.; Ge, Y.S.; Di, L.M. An insight into direct water injection applied on the hydrogen-enriched rotary engine. Fuel 2023, 339, 127352. [Google Scholar] [CrossRef]
  9. Fang, J.; Meng, Z.W.; Li, J.; Pu, Y.F.; Du, Y.H.; Li, J.S.; Jin, Z.X.; Chen, C.; Chase, G.G. The influence of ash on soot deposition and regeneration processes in diesel particular filter. Appl. Therm. Eng. 2017, 124, 633–640. [Google Scholar] [CrossRef]
  10. Tan, P.Q.; Duan, L.S.; Li, E.F.; Hu, Z.Y.; Lou, D.M. Experimental study on the temperature characteristics of a diesel particulate filter during a drop to idle active regeneration process. Appl. Therm. Eng. 2020, 178, 115628. [Google Scholar] [CrossRef]
  11. Ji, L.; Cai, Y.; Shi, Y.; Fan, R.; Wang, W.; Chen, Y. Effects of Nonthermal Plasma on Microstructure and Oxidation Characteristics of Particulate Matter. Environ. Sci. Technol. 2020, 54, 2510–2519. [Google Scholar] [CrossRef] [PubMed]
  12. Bai, S.; Wang, C.; Li, D.; Wang, G.; Li, G. Influence of the idle-up strategy on the thermal management of diesel particulate filter regeneration during a drop to the idle process. Appl. Therm. Eng. 2018, 141, 976–980. [Google Scholar] [CrossRef]
  13. Gao, J.B.; Ma, C.; Xing, S.; Sun, L.; Huang, L. A review of fundamental factors affecting diesel PM oxidation behaviors. Sci. China Technol. Sci. 2018, 61, 330–345. [Google Scholar] [CrossRef]
  14. Gao, J.B.; Ma, C.C.; Tian, G.H.; Chen, J.Y.; Xing, S.K.; Huang, L.Y. Oxidation Activity Restoration of Diesel Particulate Matter by Aging in Air. Energy Fuel 2018, 32, 2450–2457. [Google Scholar] [CrossRef]
  15. Zhang, M.Z.; Ge, Y.S.; Wang, X.; Peng, Z.; Tan, J.; Hao, L.; Lv, L.; Wang, C. An investigation into the impact of burning diesel/lubricant oil mixtures on the nature of particulate emissions: Implications for DPF ash-loading acceleration method. J. Energy Inst. 2020, 93, 1207–1215. [Google Scholar] [CrossRef]
  16. Chen, T.; Wu, Z.; Gong, J.; E, J.Q. Numerical Simulation of Diesel Particulate Filter Regeneration Considering Ash Deposit. Flow Turbul. Combust. 2016, 97, 849–864. [Google Scholar] [CrossRef]
  17. Du, Y.H.; Meng, Z.W.; Fang, J.; Qin, Y.; Jiang, Y.; Li, S.; Li, J.; Chen, C.; Bai, W. Characterization of soot deposition and oxidation process on catalytic diesel particulate filter with ash loading through an optimized visualized method. Fuel 2019, 243, 251–261. [Google Scholar] [CrossRef]
  18. Choi, S.; Seong, H. Oxidation characteristics of gasoline direct-injection (GDI) engine soot: Catalytic effects of ash and modified kinetic correlation. Combust. Flame 2015, 162, 2371–2389. [Google Scholar] [CrossRef]
  19. Tan, P.Q.; Wang, D.Y. Effects of Sulfur Content and Ash Content in Lubricating Oil on the Aggregate Morphology and Nanostructure of Diesel Particulate Matter. Energ. Fuels 2018, 32, 713–724. [Google Scholar] [CrossRef]
  20. Tan, P.Q.; Li, Y.; Shen, H.Y. Exhaust particle properties from a light duty diesel engine using different ash content lubricating oil. J. Energy Inst. 2018, 91, 55–64. [Google Scholar] [CrossRef]
  21. Wang, H.H.; Tan, J.W.; Ge, Y.S.; Li, J.; Yan, X. Pore morphology and fractal dimension of ash deposited in catalyst diesel particulate filter. Environ. Sci. pollut. R. 2020, 27, 11026–11037. [Google Scholar] [CrossRef] [PubMed]
  22. Vander Wal, R.L. Soot Nanostructure: Definition, Quantification and Implications; SAE International: Warren-dale, PA, USA, 2005. [Google Scholar]
  23. Zhang, Y.; Kim, D.; Rao, L.; Zhang, R.; Kook, S.; Kim, K.S.; Kweon, C.B. The soot particle formation process inside the piston bowl of a small-bore diesel engine. Combust. Flame 2017, 185, 278–291. [Google Scholar] [CrossRef]
  24. Hurt, R.H.; Crawford, G.P.; Shim, H.S. Equilibrium nanostructure of primary soot particles. Proc. Combust. Inst. 2000, 28, 2539–2546. [Google Scholar] [CrossRef]
  25. Wang, Y.S.; Liang, X.Y.; Tang, G.; Chen, Y.; Dong, L.H.; Shu, G.Q. Impact of lubricating oil combustion on nanostructure, composition and graphitization of diesel particles. Fuel 2017, 190, 237–244. [Google Scholar] [CrossRef]
  26. Botero, M.L.; Chen, D.; González-Calera, S.; Jefferson, D.; Kraft, M. HRTEM evaluation of soot particles produced by the non-premixed combustion of liquid fuels. Carbon 2016, 96, 459–473. [Google Scholar] [CrossRef]
  27. Wal, R.L.V. Initial investigation of effects of fuel oxygenation on nanostructure of soot from a direct-injection diesel engine. Energ. Fuel 2006, 20, 2364–2369. [Google Scholar]
  28. Zhang, W.; Song, C.; Lyu, G.; Bi, F.; Wang, T.; Liu, Y.; Qiao, Y. Petroleum and Fischer-Tropsch diesel soot: A comparison of morphology, nanostructure and oxidation reactivity. Fuel 2021, 283, 118919. [Google Scholar] [CrossRef]
  29. SH/T0604-2000; Crude Petroleum and Petroleum Products-Determination of Density-Oscillating U-tube Method. China Petroleum & Chemical Corporation Research Institute of Petroleum: Beijing, China, 2001.
  30. GB/T265-88; Petroleum Products—Determination of Kinematic Viscosity and Calculation of Dynamic Viscosity. China Petroleum & Chemical Corporation Research Institute of Petroleum: Beijing, China, 1989.
  31. SH/T0656-1988; Determination of Carbon, Hydrogen, Nitrogen in Petroleum Products and Lubricants (Elemental Analyzer Method). 2004.
  32. GB/T2433-2001; Petroleum Products—Lubricating Oils and Additives—Determination of Sulphated Ash. China Petroleum & Chemical Corporation Research Institute of Petroleum: Beijing, China, 2002.
Figure 1. Schematic diagram of the experimental system.
Atmosphere 15 00130 g001
Figure 2. Schematic diagram of the nanostructure parameters definition [19,22].
Atmosphere 15 00130 g002
Figure 3. HRTEM images of particles under different working conditions: (a) H oil; (b) M oil; (c) L oil.
Atmosphere 15 00130 g003aAtmosphere 15 00130 g003b
Figure 4. Electronic spectrogram of particles.
Atmosphere 15 00130 g004
Figure 5. The fringe length distribution histograms of particles obtained from blending with H oil under different working conditions (a) 2000 rpm/40%; (b) 2000 rpm/60%; (c) 2000 rpm/80%.
Atmosphere 15 00130 g005aAtmosphere 15 00130 g005b
Figure 6. The fringe length distribution histograms of particles obtained from blending with M oil under different working conditions (a) 2000 rpm/40%; (b) 2000 rpm/60%; (c) 2000 rpm/80%.
Atmosphere 15 00130 g006aAtmosphere 15 00130 g006b
Figure 7. The fringe length distribution histograms of particles obtained from blending with L oil under different working conditions (a) 2000 rpm/40%; (b) 2000 rpm/60%; (c) 2000 rpm/80%.
Atmosphere 15 00130 g007aAtmosphere 15 00130 g007b
Figure 8. The fringe length with respect to ash content in the lubricant oil.
Atmosphere 15 00130 g008
Figure 9. The fringe separation distance histograms of particles obtained from blending with H oil under different working conditions (a) 2000 rpm/40%; (b) 2000 rpm/60%; (c) 2000 rpm/80%.
Atmosphere 15 00130 g009aAtmosphere 15 00130 g009b
Figure 10. The fringe separation distance histograms of particles obtained from blending with M oil under different working conditions (a) 2000 rpm/40%; (b) 2000 rpm/60%; (c) 2000 rpm/80%.
Atmosphere 15 00130 g010aAtmosphere 15 00130 g010b
Figure 11. The fringe separation distance histograms of particles obtained from blending with L oil under different working conditions (a) 2000 rpm/40%; (b) 2000 rpm/60%; (c) 2000 rpm/80%.
Atmosphere 15 00130 g011aAtmosphere 15 00130 g011b
Figure 12. The fringe separation distance with respect to ash content in the lubricant oil.
Atmosphere 15 00130 g012
Figure 13. The fringe tortuosity histograms of particles obtained from blending with H oil under different working conditions (a) 2000 rpm/40%; (b) 2000 rpm/60%; (c) 2000 rpm/80%.
Atmosphere 15 00130 g013aAtmosphere 15 00130 g013b
Figure 14. The fringe tortuosity histograms of particles obtained from blending with M oil under different working conditions (a) 2000 rpm/40%; (b) 2000 rpm/60%; (c) 2000 rpm/80%.
Atmosphere 15 00130 g014aAtmosphere 15 00130 g014b
Figure 15. The fringe tortuosity histograms of particles obtained from blending with L oil under different working conditions (a) 2000 rpm/40%; (b) 2000 rpm/60%; (c) 2000 rpm/80%.
Atmosphere 15 00130 g015aAtmosphere 15 00130 g015b
Figure 16. The fringe tortuosity with respect to ash content in the lubricant oil.
Atmosphere 15 00130 g016
Table 1. Specifications of the engine.
PropertyValuePropertyValue
Number of cylinders4Rated power (kW/(r/min))105/3600
Bore × diameter × stroke (mm)4 × 92 × 94Maximum torque ((N·m)/(r/min))360/1600~2800
Displacement (L)2.499Fuel SystemCommon rail
Lube consumption≤0.2%Intake SystemTurbocharged EGR
Compression ratio16.6:1AftertreatmentDOC + DPF
Table 2. Specifications of diesel used in the test.
PropertyValue
Distillation50% recovery temperature °C257.5
90% recovery temperature °C333.0
95% recovery temperature °C351.0
Cetane number-55.7
Viscosity at 20 °Cmm2/s3.72
Density at 20 °CKg/m3821.3
PAH content%2.57
Sulfur contentppm4.8
Disclaimer/Publisher’s Note: The statements, opinions and data contained in all publications are solely those of the individual author(s) and contributor(s) and not of MDPI and/or the editor(s). MDPI and/or the editor(s) disclaim responsibility for any injury to people or property resulting from any ideas, methods, instructions or products referred to in the content.

