Article

Estimation of Radiation Exposure for Various Flights from Athens International Airport

by
Anastasia Tezari
1,
Argyris N. Stassinakis
1,
Panagiota Makrantoni
1,
Pavlos Paschalis
1,
Dimitris Alexandridis
1,
Maria Gerontidou
1,
Helen Mavromichalaki
1,*,
Pantelis Karaiskos
2,
Norma Crosby
3 and
Mark Dierckxsens
3
1
Athens Cosmic Ray Group, Faculty of Physics, National and Kapodistrian University of Athens, 15784 Athens, Greece
2
Medical Physics Laboratory, Faculty of Medicine, National and Kapodistrian University of Athens, 11517 Athens, Greece
3
Royal Belgian Institute for Space Aeronomy, 1180 Brussels, Belgium
*
Author to whom correspondence should be addressed.
Atmosphere 2024, 15(2), 149; https://doi.org/10.3390/atmos15020149
Submission received: 20 December 2023 / Revised: 19 January 2024 / Accepted: 22 January 2024 / Published: 24 January 2024
(This article belongs to the Special Issue Novel Insights into the Effects of Space Weather on Human Health)

Abstract

:
In recent decades, the exposure of aviation crews and passengers to cosmic radiation has been progressively increasing due to the growing need of flights. Therefore, there is a need for radiation assessment software tools to act as a complement to other radiation protection techniques and countermeasures. In this work, the exposure to cosmic radiation is estimated for flights from Athens International Airport to various international destinations, by performing Monte Carlo simulations with the validated tool DYASTIMA/DYASTIMA-R. The results of the estimated total ambient dose equivalent, as well as the ambient dose equivalent rate for different flights, applying a typical flying level and constant atmospheric conditions, are presented for the first time. This study is carried out for different phases of solar activity for the time period from 1996 to 2019, which includes the two recent Solar Cycles 23 and 24.

1. Introduction

During recent decades, the aviation industry has presented a trend of great growth, which has been driven by financial growth and development as well as the need for a more efficient global connectivity. While there have been a few short-term disruptions, mainly due to the COVID-19 pandemic, between 2020 and 2022, with many flights being either cancelled or operated at lower capacities, the aviation industry has demonstrated adaptability and resilience over time, flourishing and providing many opportunities not only for leisure, but also for work, creating many job positions. However, becoming a crew member (either pilot or flight attendant) is quite challenging and demanding, as there are many requirements and demands, such as education, training, skills, competencies, and physical and mental demands.
Therefore, due to the nature of their profession, aircrews are in general healthy compared to the general population, also known as the “healthy worker effect”. This is both due to the selection process in order for someone to become a pilot or flight attendant, and due to the continuous and rigorous monitoring of crew health [1,2], along with the completely different lifestyle and high socio-economic status of this group. As a result, overall crew mortality is lower than that of the general population, while most medical factors, such as smoking and alcohol consumption, are less prevalent among aircrews. However, aircrews are occupationally exposed to factors that may have a negative impact on their health. Typical examples are various carcinogenic and mutagenic agents such as ionizing cosmic radiation, ultraviolet radiation, magnetic fields from cockpit instruments, ozone, various volatile substances such as aerosols, cabin air pollutants, emissions from aircraft fuel, irregular working hours, and continuous circadian rhythm disturbances [3].
Aircraft crews are constantly exposed to galactic cosmic radiation and, in exceptional cases, they may also be exposed to extreme solar energetic particle (SEP) events (energies higher than 200 MeV), which are more prevalent at high geographic latitudes and may result in ground-level enhancements in cosmic ray intensity (GLEs) [4,5,6,7,8]. During some extreme events, GLEs may be recorded in lower-latitude regions as well (e.g., November 2003) [9]. Thus, the exposure of pilots and cabin crews to cosmic radiation depends on various parameters such as altitude, flight path, duration of the flight, as well as solar activity [10]. The study of the ambient dose equivalent rate as a function of geomagnetic shielding and solar activity is particularly significant for radiation protection purposes, as it may contribute to the assessment of radiation doses received by aircraft passengers and crew during different flights. It is highlighted that the radiation dose for passengers on aircrafts is less of a concern as they fly much less often compared to aircrew. Numerous studies have been conducted to calculate the radiation dose for various aviation routes during different solar activity phases [11,12,13,14,15,16,17,18,19,20,21,22,23,24,25] and a variety of analytical methods and models have been used so far.
However, besides the impact on health that crew face during flights due to cosmic radiation, electronic systems are also vulnerable to such radiation. More specifically, the radiation that penetrates the fuselage of the aircraft is responsible for additional thermal and shot noise on the complex electronic systems (called avionics) [26]. Such noise increases the probability of error during signal transmission between devices or by depositing electric charges in the logical record, changing the information stored in cells. If these electric charges occur in multiple cells, a Multiple Bit Upset (MBU) is caused. Such effects may lead to the total failure of some electronic devices during flights, increasing the probability of accidents. In order to avoid radiation effects on electronic systems, various protection technologies and materials have been developed for absorbing and decreasing radiation on sensitive electronic components. Therefore, a study on radiation dose during flights will help in the estimation of electronic failure probability and choose suitable solutions for decreasing such a probability.
In this work, the radiation dose during different flight routes is estimated by performing Monte Carlo simulations with the validated software tool Dynamic Atmospheric Shower Tracking Interactive Model Application (DYASTIMA) [27,28], and its extension DYASTIMA-R, for the first time. DYASTIMA is a GEANT4 software application that can be used for the description and the calculation of different parameters regarding the secondary cosmic ray particles cascade, such as the energy of the particles and the energy deposition, generated by primary cosmic ray particles hitting the top of the Earth’s atmosphere. The standalone tool was developed and validated by the Athens Cosmic Ray Group, and it is available alongside a Software User Manual at the Athens Neutron Monitor Station portal (http://cosray.phys.uoa.gr/index.php/dyastima) (accessed on 11 December 2023). The feature DYASTIMA-R was added in order to provide an estimation of several radiobiological parameters, which is crucial for the radiation assessment of the aircrews’ occupational exposure to solar and galactic cosmic radiation (which consists of about 90% protons, 8% alpha particles, and small amounts of heavier nuclei, electrons, and positrons). Specifically, this new functionality allows radiation dose calculations on a human phantom to be performed, through a second simulation which is realized based on the results provided by DYASTIMA output for the different tracking layers (the atmospheric altitudes where the tracking of particles takes place). In order to conduct a radiation assessment analysis, international flights from Athens, Greece, to a range of destinations are selected. Results regarding the total ambient dose equivalent through a whole flight, as well as the ambient dose equivalent rate, are presented for the first time, while a comparison with other well-known and widely used software is performed. The results are thoroughly discussed, while, finally, conclusions and future steps are presented. The remainder of this paper is organized as follows: in Section 2, the method of calculating the ambient dose equivalent is presented. In Section 3, the results of this research are presented, and they are discussed in Section 4.

2. Methods and Analysis

In previous works, DYASTIMA and DYASTIMA-R have been used for the calculation of the energy deposition and the ambient dose equivalent rate for different altitudes inside the Earth’s atmosphere for different geographic coordinates (expressed as a function of the magnetic rigidity threshold) and different phases of solar activity, covering two whole solar cycles (Solar Cycle 23 from year 1996 to 2008, and Solar Cycle 24 from year 2008 to 2019). Specifically, more than 400 simulations have been performed, covering three usual commercial flying altitudes, eighteen values of magnetic threshold rigidity expressed in gigavolts (GV) (0–17 GV), as well as different phases of solar activity.
The input parameters for DYASTIMA, including the primary cosmic ray spectrum at the top of the atmosphere, the atmospheric profile as a function of temperature, the atmospheric composition, the characteristics of the planet (radius; surface pressure; gravitational acceleration; surface pressure; north, east, and vertical components of the magnetic field), the values of the necessary geomagnetic field components, the altitude of the tracking layers, as well as the results for all corresponding scenarios, are available and thoroughly discussed in [29,30,31,32] and references within. In summary, the atmospheric composition as well as the atmospheric profile of temperature as a function of altitude are described by the International Standard Atmosphere (ISA) [33]; the primary cosmic ray spectrum at the top of the Earth’s atmosphere for six elements (H, He, C, O, Si, and Fe) is based on the ISO15390 model [34], as retrieved by using the tool OMERE by TRAD, Toulouse, France (https://www.trad.fr/en/space/omere-software/) (accessed on 5 December 2023) [35]; and the components of the magnetic field were derived by the portal of the National Oceanic and Atmospheric Administration (https://www.ngdc.noaa.gov/geomag/) (accessed on 11 December 2023). Simulations were performed with DYASTIMA in order to calculate the energy deposition in specific tracking layers for specific points. Then, the next round of simulations with DYASTIMA-R provided values for the ambient dose equivalent rate, resulting in the creation of contour maps where the dose is depicted. A selection of these results in digital format (.csv, .txt, and .png files) is available as a federated product on the European Space Agency Space Weather (ESA SWE) portal (https://swe.ssa.esa.int/dyastima-federated) (accessed on 11 December 2023).
Based on the aforementioned results, an analysis was performed and a total of fourteen flights towards various popular international destinations from Athens International Airport Eleftherios Venizelos were studied in this work. More specifically, eleven flights were considered for destinations in Europe (Larnaca, Rome, Berlin, Brussels, Paris, Amsterdam, Moscow, Madrid, London, Stockholm, and Reykjavik), two for destinations in Asia (Dubai and Tokyo), and one for a destination in North America (New York). All the necessary information concerning the airports that were used in this study, such as the name, city, International Civil Aviation Organization (ICAO) abbreviation names, and geographical coordinates, is given in Table 1.
The calculation of the duration of each flight is based on the average speed of a commercial aircraft, assumed to be about 500 mph, which is equivalent to 805 km/h (or 434 knots). These values also include an extra 30 min in order to take into account the take-off and landing. It is important to note that the actual flight time may vary depending on the speed of the wind as well as on the selected flight path of the aircraft, depending on atmospheric conditions, air traffic, or fuel restrictions. The indicative values for the duration of each flight used in this study are presented in ascending order in Table 2.
The theoretically optimal path followed on each flight is illustrated in Figure 1. It is worth noting that the path for each flight, as well as the determination of its duration, is based on the theory of great circles, rather than on straight lines. As we move on a spherical surface, like Earth, the shortest path (geodesic) between two points corresponds, according to Riemannian geometry, to a great circle, and not to a straight line as in Euclidean geometry. The determination of the trajectory of each flight was carried out by using Python and applying the Geodesic routines of GeographicLib, as described at https://geographiclib.sourceforge.io/html/python/index.html (accessed on 10 November 2023). In this way, the distance between the beginning and final destination is divided into points whose distance is approximately 1°. Through this procedure, the geographic coordinates of these points were defined, and then they were matched with the corresponding magnetic rigidity threshold values based on the magnetic rigidity maps that are available in the literature [36,37,38,39]. These maps provide the magnetic rigidity value for each 5° geographic latitude and 15° geographic longitude at an altitude of 20 km, using the International Geomagnetic Reference Field (IGRF) model for the magnetic field for the respective time intervals. Finally, the magnetic rigidity values were matched with the corresponding values of the ambient equivalent dose rate dH*/dt, as calculated using simulations with DYASTIMA-R.

3. Results

In order to calculate the total ambient dose equivalent H*(10)total due to cosmic radiation, the duration of each flight was divided into ten-minute intervals. For each of the intervals, the dose was calculated, and subsequently, the cumulative exposure was computed. These calculations were conducted for an average flying altitude of 10.67 km or 35,000 ft (FL350), assuming constant atmospheric conditions, and without taking into account the altitude variation during take-off and landing. The results presented in Figure 2 provide an estimation of the H*(10) total of the flights listed in Table 2 for the years 2001 and 2009, corresponding to maximum and minimum solar activity conditions. The results are shown in the form of histograms in Figure 2, where the flights are arranged in ascending order of flight duration. It should be highlighted that, in all cases, these radiation doses remain within the permitted exposure limits; however, particular attention should be paid to the occupational exposure of pilots and flight attendants, as the doses are cumulative over the year. Greece adheres to EU directives on radiation protection, specifically the Basic Safety Standards Directive (2013/59/Euratom). This directive establishes fundamental standards, including a 20-millisieverts (mSv) annual dose limit for occupational exposure to ionizing radiation, with additional restrictions on equivalent doses to specific organs and tissues. The doses received by aircraft crews depend on the altitude, the duration, and the route of the flight, as well as on solar activity. As expected, a higher dose is observed during solar minimum conditions (2009), due to the negative correlation of cosmic ray intensity and solar activity. This is because during high solar activity, the intensified solar wind forms a protective shield that reduces cosmic ray intensity. In contrast, during low solar activity, the weakened solar wind allows more cosmic rays to penetrate, creating a negative correlation between cosmic ray intensity and solar activity.
It is also observed that the flights with the shortest duration (Athens–Larnaca and Athens–Rome) present the lowest dose values, while the flights with the longest duration (Athens–New York and Athens–Tokyo) have the highest dose values. However, we cannot draw a clear conclusion on radiation exposure based on flight duration alone. As shown, while the Athens–Madrid flight has the same duration as the Athens–London flight, the former has a lower overall dose. Similarly, the Athens–Dubai flight is longer than the Athens–Stockholm flight, and yet has a lower total dose. This shows the significant effect of the aircraft route of each flight, especially the geographic latitude, which is related to magnetic rigidity [21,22].
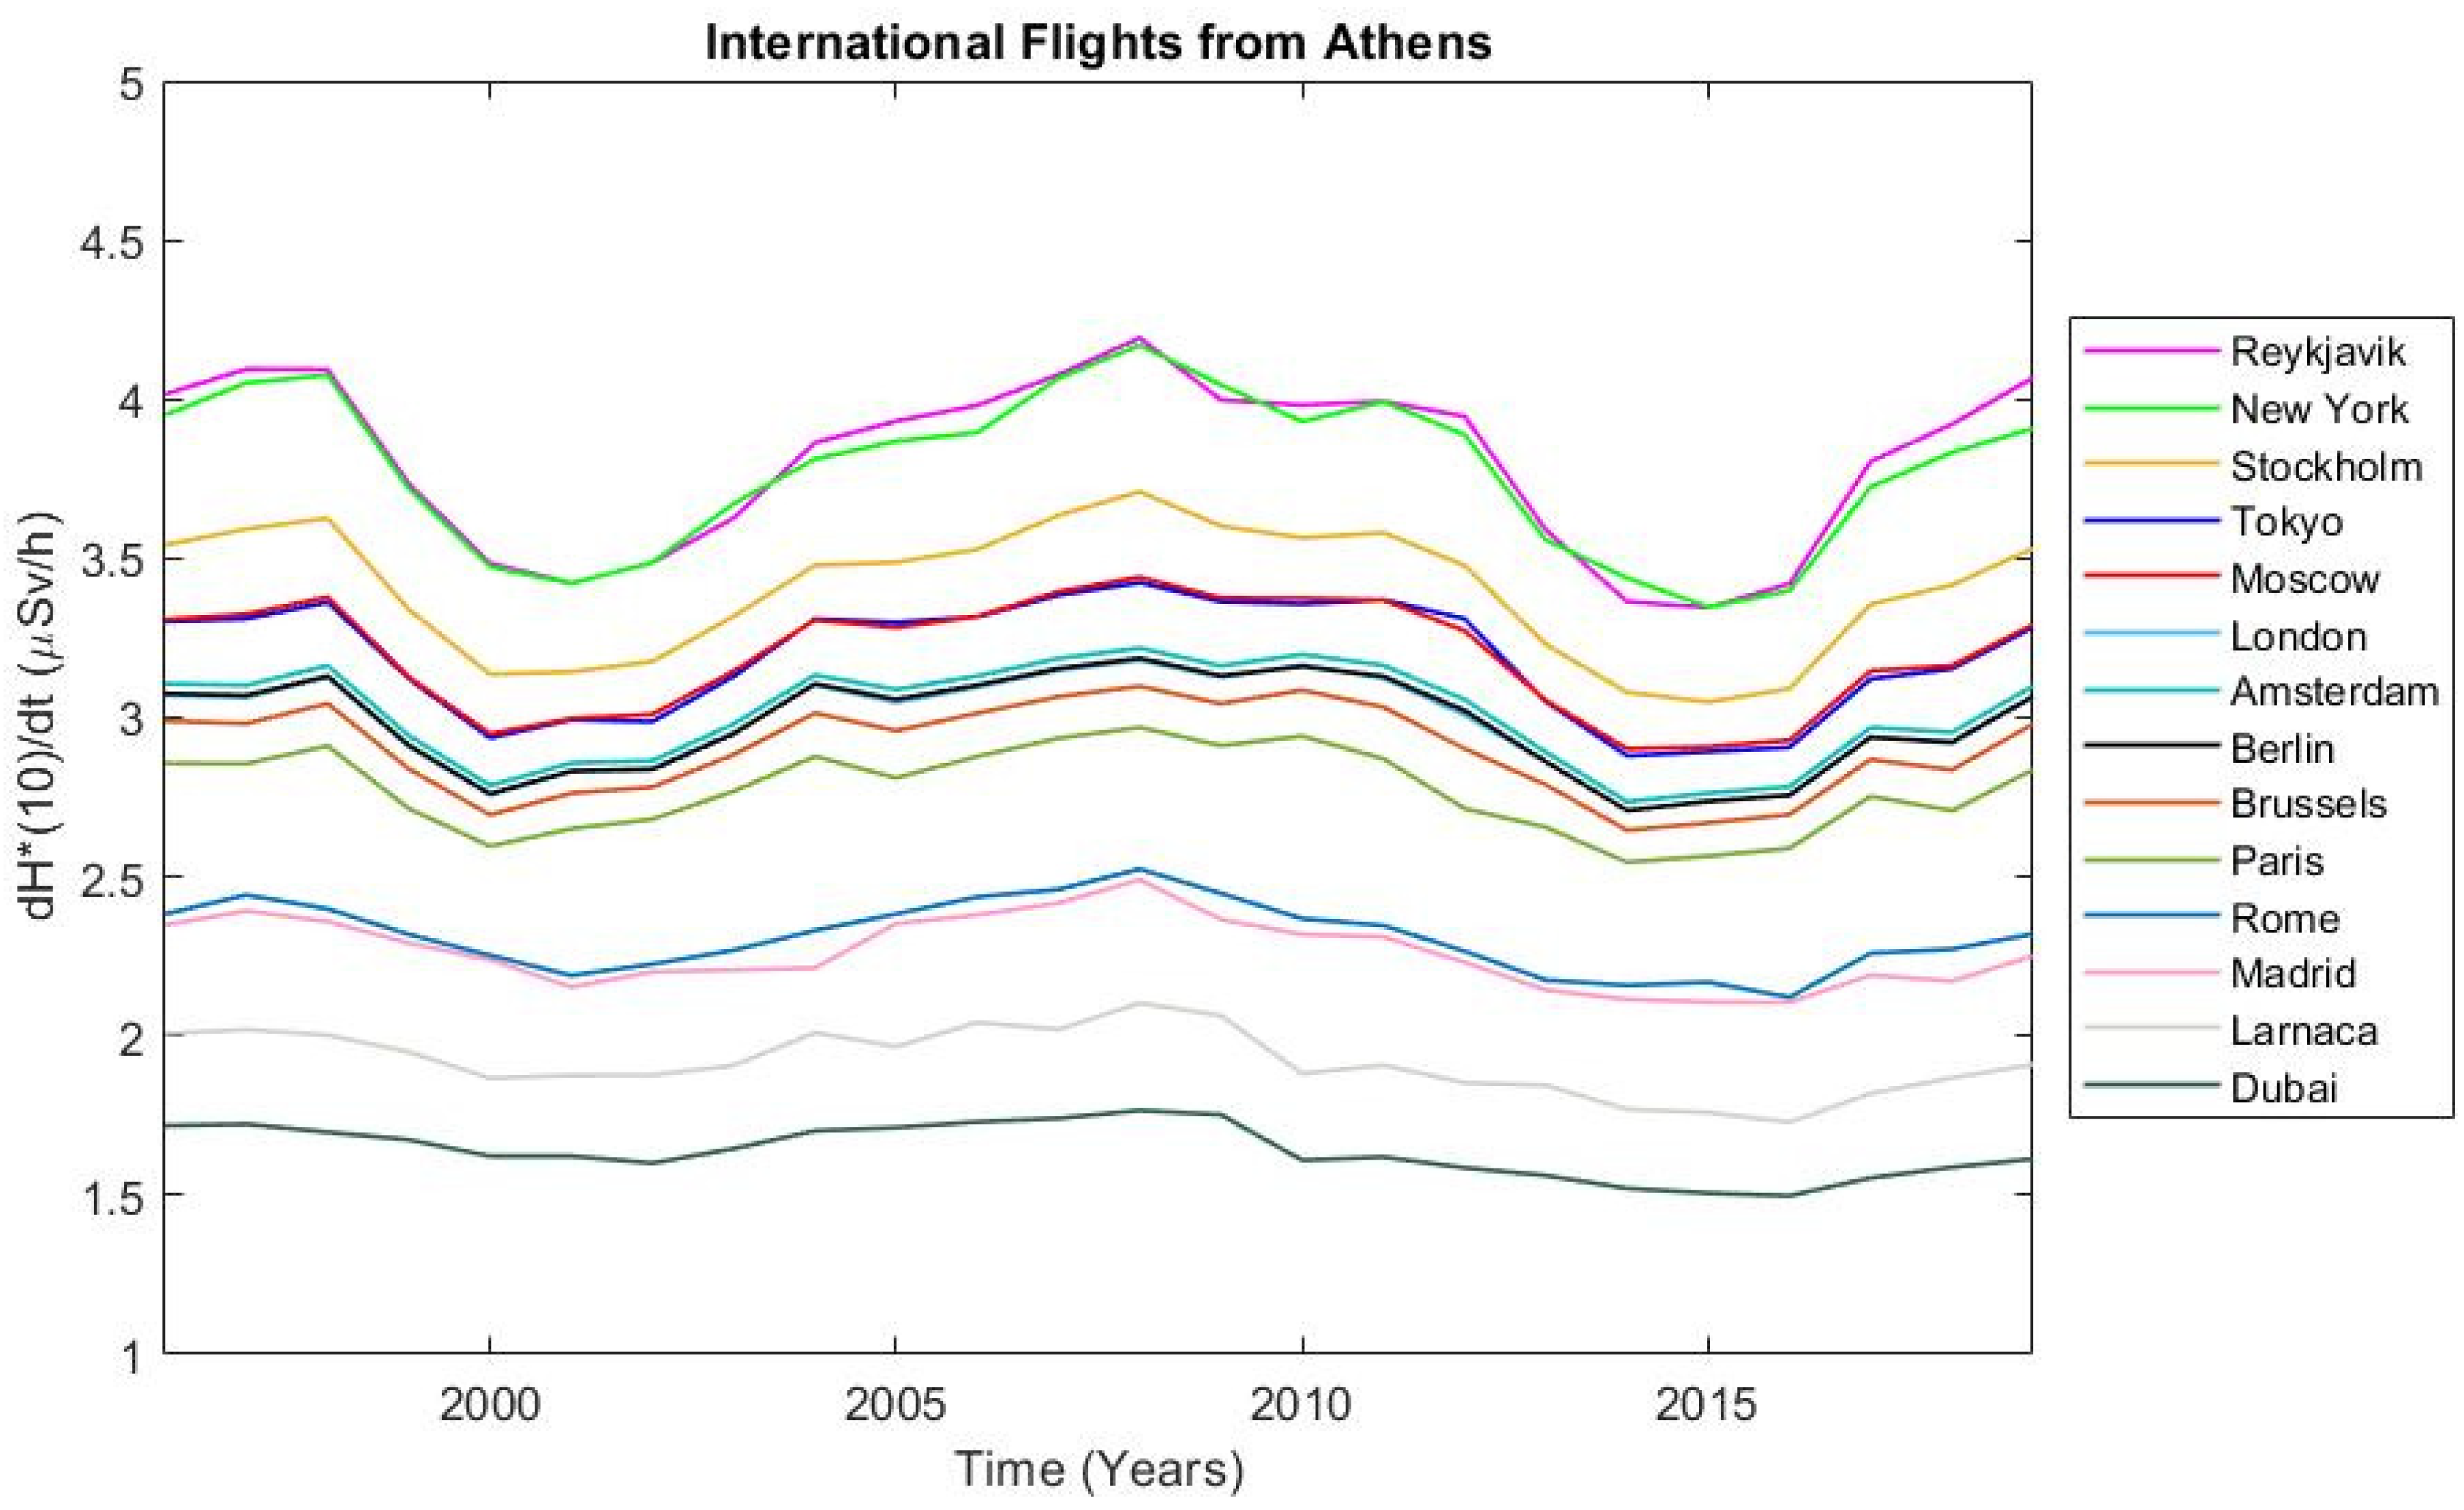
Consequently, in addition to the total dose, it is instructive to also estimate the ambient dose equivalent rate dH*(10)/dt during a flight. In order to achieve that, the total dose is divided by the time duration of each flight. The results are shown in Figure 3, for the time period 1996–2019, also known as Solar Cycles 23 and 24. The lowest ambient dose equivalent rate is observed on the Athens–Dubai flight while the highest dose rate is observed on the Athens–Reykjavik flight. This is because Reykjavik as a destination is located at the highest geographic latitude, resulting in the aircraft passing through points of low magnetic rigidity during the flight. Low cut-off rigidities lead to increased dose rates, as the Earth’s magnetic field lines are more “open” and, therefore, a larger number of particles with even lower energies can penetrate and, through their interactions with the atoms/nuclei of the atmosphere, give rise to products that reach the usual flying levels. On the contrary, Dubai is located at low latitude (also known as greater magnetic rigidity) and thus has a lower ambient dose equivalent rate, as the very perplexed geomagnetic field provides better shielding against low-energy incoming particles. Flights to central Europe (Amsterdam, Berlin, Brussels, and Paris) have almost the same dose rate, while flights to northern regions of Europe (London, Stockholm, and Moscow) present an increased dose rate. Similarly, the destinations in the greater Mediterranean region (Madrid, Rome, and Larnaca) show much lower dose rates.
It is worth noting that the ambient dose equivalent rate during the flights follows the 11-year and 22-year solar cycle to a greater or lesser degree [40], due to the negative correlation between solar activity and galactic cosmic ray intensity. Specifically, the highest dose rates due to galactic cosmic radiation occur during the time period 2007–2009, which corresponds to the extended solar minimum observed between Solar Cycles 23 and 24, while the lowest dose rates correspond to the solar maxima of Solar Cycles 23 and 24 (2001 and 2014, respectively). The dependence on solar activity is evident in flights with destinations of high geographic latitude and low magnetic rigidity (such as Reykjavik, Stockholm, New York, Central Europe, and Tokyo), while the dose rate in low-latitude flights is almost independent of the phase of the solar cycle (such as the Mediterranean region and Dubai).

4. Discussion

The DYASTIMA/DYASTIMA-R software application has been successfully validated according to international standards set by the International Committee on Radiological Protection (ICRP) [41] and the International Commission on Radiation Units and Measurements (ICRU) [42] and has been used successfully for the calculation of the energy deposition as well as the ambient dose equivalent rate in the atmosphere of Earth for different scenarios (i.e., different atmospheric altitudes, different values of geomagnetic cut-off rigidity, different periods of solar activity), as well as other planets, such as Venus [29] and Mars [43]. This is the first time that it has been used in order to estimate the ambient dose equivalent during a whole flight and not just for specific points.
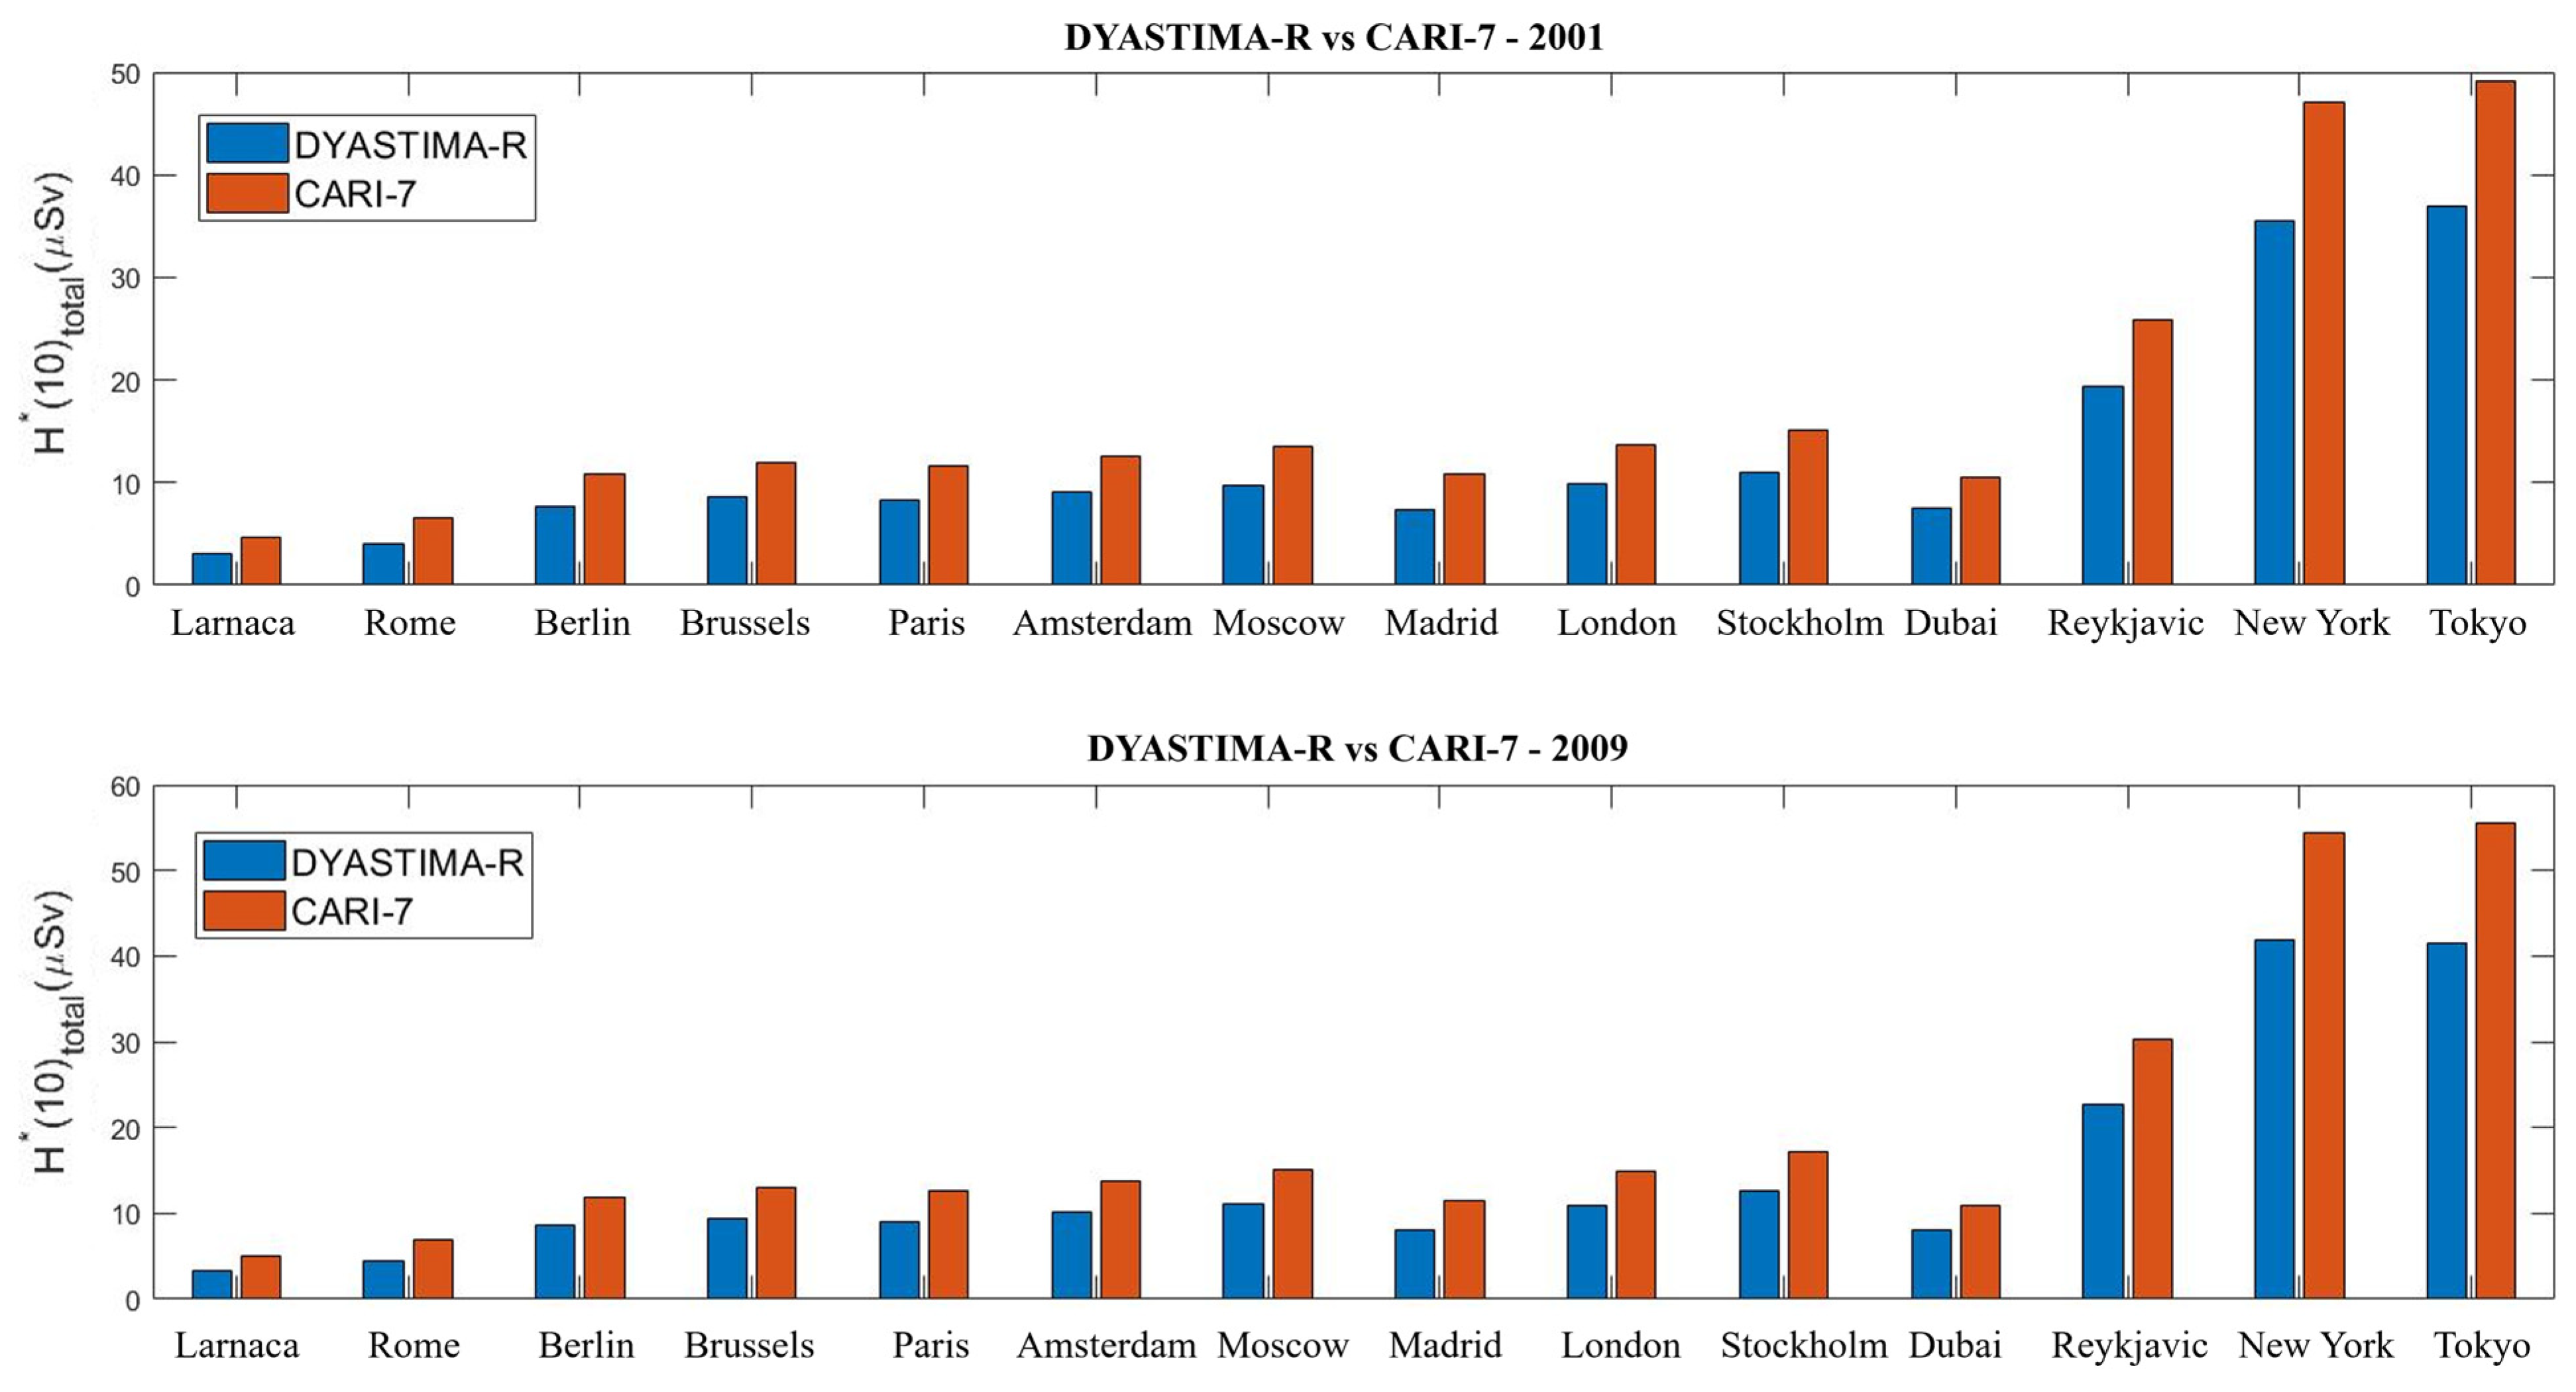
For this reason, a comparison was made between the values obtained with DYASTIMA-R and those from the Federal Aviation Administration’s (FAA) internationally recognized CARI-7 software, one of the oldest models available for radiation assessment [44]. The comparison was performed for the years 2001 and 2009, taking FL350 as the flight altitude, and it is presented in Figure 4. It is observed that the values obtained with DYASTIMA-R are similar to those obtained with CARI-7. Small deviations are observed for flights of short and medium durations (approximately 20%), while the largest deviations (approximately 30%) are observed for the two long-duration flights (Athens–New York and Athens–Tokyo), both in 2001 and 2009, respectively. The difference is due to the systematic errors of the DYASTIMA input parameters, as they are mostly based on models, as well as the simplified flight profile which does not take into consideration changes in flying altitude during the flight (for example, lower or higher FLs), take-off and landing, as well as the actual route of the plane. Furthermore, each model requires different solar parameters. For example, DYASTIMA-R uses the differential primary cosmic ray spectrum (in this work provided by ISO15390 model, as retrieved by using the tool OMERE by TRAD), while CARI-7 takes into account the solar activity by using the sunspot number. But, regardless of the different parameters they use as input, they also use different numerical methods for extracting the results. More precisely, CARI-7 uses the MCNPX method while DYASTIMA-R uses the Geant4 method. So, it is obvious that the results will be biased differently with different systematic errors. Many benchmark tests have been carried out for the performance of these two methods [45,46].
It is worth noting that at this moment, the geometry and shielding of the aircraft are not taken into account by DYASTIMA/DYASTIMA-R software. Thus, the actual exposure inside the aircraft may be lower than the calculations made inside the atmosphere, depending on the type of the aircraft, the position of the person inside, the number of passengers, and the amount of fuel. For this reason, it is considered necessary to place detectors inside the cabin of the aircraft in order to include the effect of all the above [44]. The actual data retrieved during these experiments could then be used for correcting the results obtained by DYASTIMA. Future plans for DYASTIMA include the possibility of optionally using aircraft geometry made of different materials, so that the shielding offered by each material can be studied.
As it seems, the calculation of the dose due to cosmic radiation (either the H*(10)total or the dH*(10)/dt)) during a flight is not an easy task, as it requires data from a very large number of simulations to be processed for different geographical coordinates, different values of magnetic rigidities, different atmospheric altitudes, and different phases of solar activity. In this context, a first attempt was made to estimate the dose during flights from Athens to different destinations using the software DYASTIMA/DYASTIMA-R. Future plans include the use of a more realistic flight path, i.e., more flight levels, altitude variation, take-off and landing time calculation, and more accurate trajectories, as well as performing dose calculations for more flights around the world. These results could then be compared to others found in the literature or provided by other software models, such as CARI-7 and AVIDOS [47]. Another interesting plan is the estimation of the radiation dose during solar energetic particle events (SEPs) and ground-level enhancements (GLEs) of cosmic ray intensity, as well as a comparison of the results with those of other software and models [15,48,49,50]. During these events, depending on the flight path, the dose rate may be significantly enhanced and affect the health of everyone on board, i.e., pilots, flight attendants, and passengers; thus, such a study would be of great importance.

Author Contributions

Conceptualization, A.T.; methodology, M.G.; software, P.P.; validation, H.M. and P.K.; formal analysis, A.N.S.; investigation, A.T.; resources, A.T., A.N.S. and P.M.; data curation, A.T., A.N.S. and P.M.; writing—original draft preparation, A.T., A.N.S. and P.M.; writing—review and editing, H.M., N.C., M.D., D.A. and P.K; visualization, A.T., A.N.S. and P.M.; supervision, H.M.; project administration, A.T., A.N.S. and P.M. All authors have read and agreed to the published version of the manuscript.

Funding

This work is supported by ESA SSA SWE Space Radiation Expert Service Centre activities (ESA contract number 4000113187/15/D/MRP) and the ESA Space Safety Programme’s network of space weather service development and pre-operational activities (ESA contract number 4000134036/21/D/MRP). The European Neutron Monitor Services research is funded by the ESA SSA SN IV-3 Tender: RFQ/3-13556/12/D/MRP. The authors would like to thank the cosmic ray data providers of the High-Resolution Neutron Monitor Database (NMDB) that was funded by the European Union. A.Ne.Mo.S is supported by the Special Research Account of Athens University (70/4/5803).

Institutional Review Board Statement

Not applicable.

Informed Consent Statement

Not applicable.

Data Availability Statement

The datasets generated and/or analyzed during the current study are available from the corresponding author on reasonable request. The data are not publicly available as they can be associated with health and should be provided only on request and after appropriate description.

Conflicts of Interest

The authors declare no conflicts of interest.

References

  1. Kuipers, S.; Venemans-Jellema, A.; Cannegieter, S.C.; van Haften, M.; Middeldorp, S.; Büller, H.R.; Rosendaal, F.R. The incidence of venous thromboembolism in commercial airline pilots: A cohort study of 2630 pilots. J. Thromb. Haemost. 2014, 12, 1260–1265. [Google Scholar] [CrossRef] [PubMed]
  2. Zeeb, H.; Hammer, G.P.; Blettner, M. Epidemiological investigations of aircrew: An occupational group with low-level cosmic radiation exposure. J. Radiol. Prot. 2012, 32, N15–N19. [Google Scholar] [CrossRef]
  3. Rafnsson, V.; Tulinius, H.; Jónasson, J.G.; Hrafnkelsson, J. Risk of breast cancer in female flight attendants: A population-based study (Iceland). Cancer Causes Control 2001, 12, 95–101. [Google Scholar] [CrossRef] [PubMed]
  4. Mavromichalaki, H.; Gerontidou, M.; Paschalis, P.; Paouris, E.; Tezari, A.; Sgouropoulos, C.; Dierckxsens, M. Dierckxsens, Real-Time Detection of the Ground Level Enhancement on 10 September 2017 by A.Ne.Mo.S.: System Report. Space Weather 2018, 16, 1797–1805. [Google Scholar] [CrossRef]
  5. Usoskin, I.G.; Kovaltsov, G.A.; Mironova, I.A.; Tylka, A.J.; Dietrich, W.F. Ionization effect of solar particle GLE events in low and middle atmosphere. Atmos. Meas. Tech. 2011, 11, 1979–1988. [Google Scholar] [CrossRef]
  6. Miroshnichenko, L.I. Retrospective analysis of GLEs and estimates of radiation risks. J. Space Weather Space Clim. 2018, 8, A52. [Google Scholar] [CrossRef]
  7. Plainaki, C.; Laurenza, M.; Mavromichalaki, H.; Storini, M.; Gerontidou, M.; Kanellakopoulos, A.; Andriopoulou, M.; Belov, A.; Eroshenko, E.; Yanke, V. Derivation of relativistic SEP properties through neutron monitor data modeling. J. Phys. Conf. Ser. 2015, 632, 012076. [Google Scholar] [CrossRef]
  8. Vainio, R.; Valtonen, E.; Heber, B.; Malandraki, O.E.; Papaioannou, A.; Klein, K.L.; Vilmer, N. The first SEPServer event catalogue ~68-MeV solar proton events observed at 1 AU in 1996–2010. J. Space Weather Space Clim. 2013, 3, A12. [Google Scholar] [CrossRef]
  9. Mishev, A.L.; Koldobskiy, S.A.; Kocharov, L.G.; Usoskin, I.G. GLE # 67 Event on 2 November 2003: An Analysis of the Spectral and Anisotropy Characteristics Using Verified Yield Function and Detrended Neutron Monitor Data. Sol. Phys. 2021, 296, 1–18. [Google Scholar] [CrossRef]
  10. Linnersjo, A.; Hammar, N.; Dammström, B.-G.; Johansson, M.; Eliasch, H. Cancer incidence in airline cabin crew: Experience from Sweden. Occup. Environ. Med. 2003, 60, 810–814. [Google Scholar] [CrossRef]
  11. Beck, P. Aircraft crew radiation exposure in aviation altitudes during quiet and solar storm periods. In Space Weather; Lilensten, J., Ed.; Astrophysics and Space Science Library: Dordrecht, The Netherlands, 2007; Volume 344, pp. 241–266. [Google Scholar] [CrossRef]
  12. Beck, P.; Bartlett, D.; Lindborg, L.; McAulay, I.; Schnuer, K.; Schraube, H.; Spurny, F. Aircraft crew radiation workplaces: Comparison of measured and calculated ambient dose equivalent rate data using the EURADOS in-flight radiation data base. Radiat. Prot. Dosim. 2006, 118, 182–189. [Google Scholar] [CrossRef] [PubMed]
  13. Beck, P.; Bartlett, D.T.; Bilski, P.; Dyer, C.; Fluckiger, E.; Fuller, N.; Lantos, P.; Reitz, G.; Ruhm, W.; Spurny, F.; et al. Validation of modelling the radiation exposure due to solar particle events at aircraft altitudes. Radiat. Prot. Dosim. 2008, 131, 51–58. [Google Scholar] [CrossRef] [PubMed]
  14. Bottollier-Depois, J.F.; Beck, P.; Latocha, M.; Mares, V.; Matthiä, D.; Rühm, W.; Wissmann, F. Comparison of Codes Assessing Radiation Exposure of Aircraft Crew due to Galactic Cosmic Radiation; Report 2012-03; European Radiation Dosimetry Group (EURADOS): Braunschweig, Germany, 2012; ISBN 978-3-943701-02-9. [Google Scholar]
  15. Bottollier-Depois, J.F.; Biau, A.; Blanchard, P.; Clairand, I.; Dessarps, P.; Lantos, P.; Saint-Lô, D.; Valero, M. Assessing exposure to cosmic radiation aboard aircraft: The SIEVERT system. Radioprotection 2003, 38, 357–366. [Google Scholar] [CrossRef]
  16. Bütikofer, R.; Flückiger, E.; Desorgher, L.; Moser, M. The extreme solar cosmic ray particle event on 20 January 2005 and its influence on the radiation dose rate at aircraft altitude. Sci. Total Environ. 2008, 391, 177–183. [Google Scholar] [CrossRef] [PubMed]
  17. Clairand, I.; Fuller, N.; Bottollier-Depois, J.-F.; Trompier, F. The SIEVERT system for aircrew dosimetry. Radiat. Prot. Dosim. 2009, 136, 282–285. [Google Scholar] [CrossRef]
  18. EC. Radiation Protection 156: Evaluation of the Implementation of Radiation Protection Measures for Aircrew; Directorate-General for Energy and Transport of the European Commission: Luxembourg, 2009; ISBN 978-92-79-08409-6. [Google Scholar]
  19. EC. Radiation Protection 173: Comparison of Codes Assessing Radiation Exposure of Aircraft Crew due to Galactic Cosmic Radiation; Directorate-General for Energy and Transport of the European Commission: Luxembourg, 2017; ISBN 978-92-79-27036-9. [Google Scholar]
  20. EC. Radiation Protection 140: Cosmic Radiation Exposure of Aircraft Crew—Compilation of Measured and Calculated Data; Directorate-General for Energy and Transport of the European Commission: Luxembourg, 2004; ISBN 92-894-8448-9. [Google Scholar]
  21. Guillaume, H.; Sébastien, A. Analysis of solar and galactic cosmic rays induced atmospheric ionizing radiation: Impacts for typical transatlantic ights and antarctica environment. JSM Environ. Sci. Ecol. 2017, 5, 9–44. [Google Scholar]
  22. Hubert, G.; Aubry, S. Analysis of Exposure to Solar and Galactic Cosmic Radiations of Flights Representative of the European International Air Traffic. Radiat. Res. 2018, 190, 271–281. [Google Scholar] [CrossRef]
  23. Lantos, P.; Fuller, N. Semi-Empirical Model to Calculate Potential Radiation Exposure on Board Airplane During Solar Particle Events. IEEE Trans. Plasma Sci. 2004, 32, 1468–1477. [Google Scholar] [CrossRef]
  24. Mares, V.; Yasuda, H. Aviation route doses calculated with EPCARD.Net and JISCARD EX. Radiat. Meas. 2010, 45, 1553–1556. [Google Scholar] [CrossRef]
  25. Shea, M.; Smart, D. Cosmic ray Implications for Human Health. Space Sci. Rev. 2000, 93, 187–205. [Google Scholar] [CrossRef]
  26. Perez, R. Methods for Spacecraft Avionics Protection Against Space Radiation in the Form of Single-Event Transients. IEEE Trans. Electromagn. Compat. 2008, 50, 455–465. [Google Scholar] [CrossRef]
  27. Allison, J.; Amako, K.; Apostolakis, J.; Araujo, H.; Dubois, P.A.; Asai, M.; Barrand, G.; Capra, R.; Chauvie, S.; Chytracek, R.; et al. Geant4 developments and applications. IEEE Trans. Nucl. Sci. 2006, 53, 270–278. [Google Scholar] [CrossRef]
  28. Allison, J.; Amako, K.; Apostolakis, J.; The GEANT4 Collaboration. Recent developments in geant4. Nucl. Instrum. Methods Phys. A 2016, 835, 186–225. [Google Scholar] [CrossRef]
  29. Tezari, A.; Paschalis, P.; Stassinakis, A.; Mavromichalaki, H.; Karaiskos, P.; Gerontidou, M.; Alexandridis, D.; Kanellakopoulos, A.; Crosby, N.; Dierckxsens, M. Radiation Exposure in the Lower Atmosphere during Different Periods of Solar Activity. Atmosphere 2022, 13, 166. [Google Scholar] [CrossRef]
  30. Tezari, A.; Stassinakis, A.N.; Paschalis, P.; Mavromichalaki, H.; Plainaki, C.; Kanellakopoulos, A.; Crosby, N.; Dierckxsens, M.; Karaiskos, P. Radiation Dosimetry Estimations in the Venusian Atmosphere during Different Periods of Solar Activity. Universe 2022, 8, 637. [Google Scholar] [CrossRef]
  31. Makrantoni, P.; Tezari, A.; Stassinakis, A.N.; Paschalis, P.; Gerontidou, M.; Karaiskos, P.; Georgakilas, A.G.; Mavromichalaki, H.; Usoskin, I.G.; Crosby, N.; et al. Estimation of Cosmic-Ray-Induced Atmospheric Ionization and Radiation at Commercial Aviation Flight Altitudes. Appl. Sci. 2022, 12, 5297. [Google Scholar] [CrossRef]
  32. Tezari, A.; Paschalis, P.; Mavromichalaki, H.; Karaiskos, P.; Crosby, N.; Dierckxsens, M. Assessing radiation exposure inside the earth’s atmosphere. Radiat. Prot. Dosim. 2020, 190, 427–436. [Google Scholar] [CrossRef]
  33. ISO 2533:1975ISO; Standard Atmosphere. International Organization for Standardization: Geneva, Switzerland, 2007.
  34. ISO 15390:2004ISO; Space Environment (Natural and Artificial)—Galactic Cosmic Ray Model. International Organization for Standardization: Geneva, Switzerland, 2004.
  35. OMERE Space Radiation Environment and Effects Tool: New Developments and New Interface. Available online: https://indico.esa.int/event/188/contributions/1622/attachments/1521/1753/OMERE_space_radiation_environment_and_effects_tool_Varotsou_07032017.pdf (accessed on 5 December 2023).
  36. Gerontidou, M.; Katzourakis, N.; Mavromichalaki, H.; Yanke, V.; Eroshenko, E. World grid of cosmic ray vertical cut-off rigidity for the last decade. Adv. Space Res. 2021, 67, 2231–2240. [Google Scholar] [CrossRef]
  37. Smart, D.F.; Shea, M.A. World grid of calculated cosmic ray vertical cut off_rigidities for epoch 1995.0. In Proceedings of the 30th International Cosmic Ray Conference, Merida, Mexico, 3–11 July 2007; Volume 1, pp. 733–736. [Google Scholar]
  38. Smart, D.F.; Shea, M.A. World grid of calculated cosmic ray vertical cut off rigidities for epoch 2000.0. In Proceedings of the 30th International Cosmic Ray Conference, Merida, Mexico, 3–11 July 2007; Volume 1, pp. 737–740. [Google Scholar]
  39. Smart, D.F.; Shea, M.A. Vertical geomagnetic cut off rigidities for epoch 2015. In Proceedings of the 36th International Cosmic Ray Conference, PoS(ICRC2019), Madison, WI, USA, 24 July–1 August 2019; Volume 1154, pp. 1–8. [Google Scholar]
  40. Mavromichalaki, H.; Belehaki, A.; Rafios, X.; Tsagouri, I. Hale-cycle effects in cosmic-ray intensity during the last four cycles. Astrophys. Space Sci. 1997, 246, 7–14. [Google Scholar] [CrossRef]
  41. ICRP. Radiological protection from cosmic radiation in aviation. icrp publication 132. Ann. ICRP 2016, 45, 1–48. [Google Scholar] [CrossRef]
  42. ICRU. Reference data for the validation of doses from cosmic-radiation exposure of aircraft crew. Report 84. J. Int. Comm. Radiat. Units Meas. 2010, 10, e1–e2. [Google Scholar] [CrossRef]
  43. Tezari, A.; Stassinakis, A.; Paschalis, P.; Mavromichalaki, H.; Gerontidou, M.; Karaiskos, P.; Kanellakopoulos, A.; Plainaki, C.; Crosby, N.; Dierckxsens, M. Estimation of the radiation exposure in the atmospheres of Earth, Venus and Mars with the software DYASTIMA. In Proceedings of the 44th COSPAR Scientific Assembly, Athens, Greece, 16–24 July 2022; Available online: https://www.cosparathens2022.org/.AbstractF2.3–0023-22 (accessed on 30 November 2023).
  44. Copeland, K. CARI-7A: Development and validation. Radiat. Prot. Dosim. 2017, 175, 419–431. [Google Scholar] [CrossRef]
  45. Sihver, L.; Ploc, O.; Puchalska, M.; Ova, I.A.; Ak, J.K.; Kyselova, D.; Shurshakov, V. Radiation environment at aviation altitudes and in space. Radiat. Prot. Dosim. 2015, 164, 477–483. [Google Scholar] [CrossRef] [PubMed]
  46. van der Ende, B.M.; Atanackovic, J.; Erlandson, A.; Bentoumi, G. Use of GEANT4 vs. MCNPX for the characterization of a boron-lined neutron detector. In Nuclear Instruments and Methods in Physics Research Section A: Accelerators, Spectrometers, Detectors and Associated Equipment; Elsevier B.V.: Amsterdam, The Netherlands, 2016; Volume 820, pp. 40–47. ISSN 0168-9002. [Google Scholar]
  47. Latocha, M.; Beck, P.; Rollet, S. AVIDOS—A software package for European accredited aviation dosimetry. Radiat. Prot. Dosim. 2009, 136, 286–290. [Google Scholar] [CrossRef] [PubMed]
  48. Mishev, A. Computation of radiation environment during ground level enhancements 65, 69 and 70 at equatorial region and flight altitudes. Adv. Space Res. 2014, 54, 528–535. [Google Scholar] [CrossRef]
  49. Mishev, A.; Adibpour, F.; Usoskin, I.; Felsberger, E. Computation of dose rate at flight altitudes during ground level enhancements no. 69, 70 and 71. Adv. Space Res. 2015, 55, 354–362. [Google Scholar] [CrossRef]
  50. Mishev, A.L.; Usoskin, I.G. Assessment of the Radiation Environment at Commercial Jet-Flight Altitudes During GLE 72 on 10 September 2017 Using Neutron Monitor Data. Space Weather 2018, 16, 1921–1929. [Google Scholar] [CrossRef]
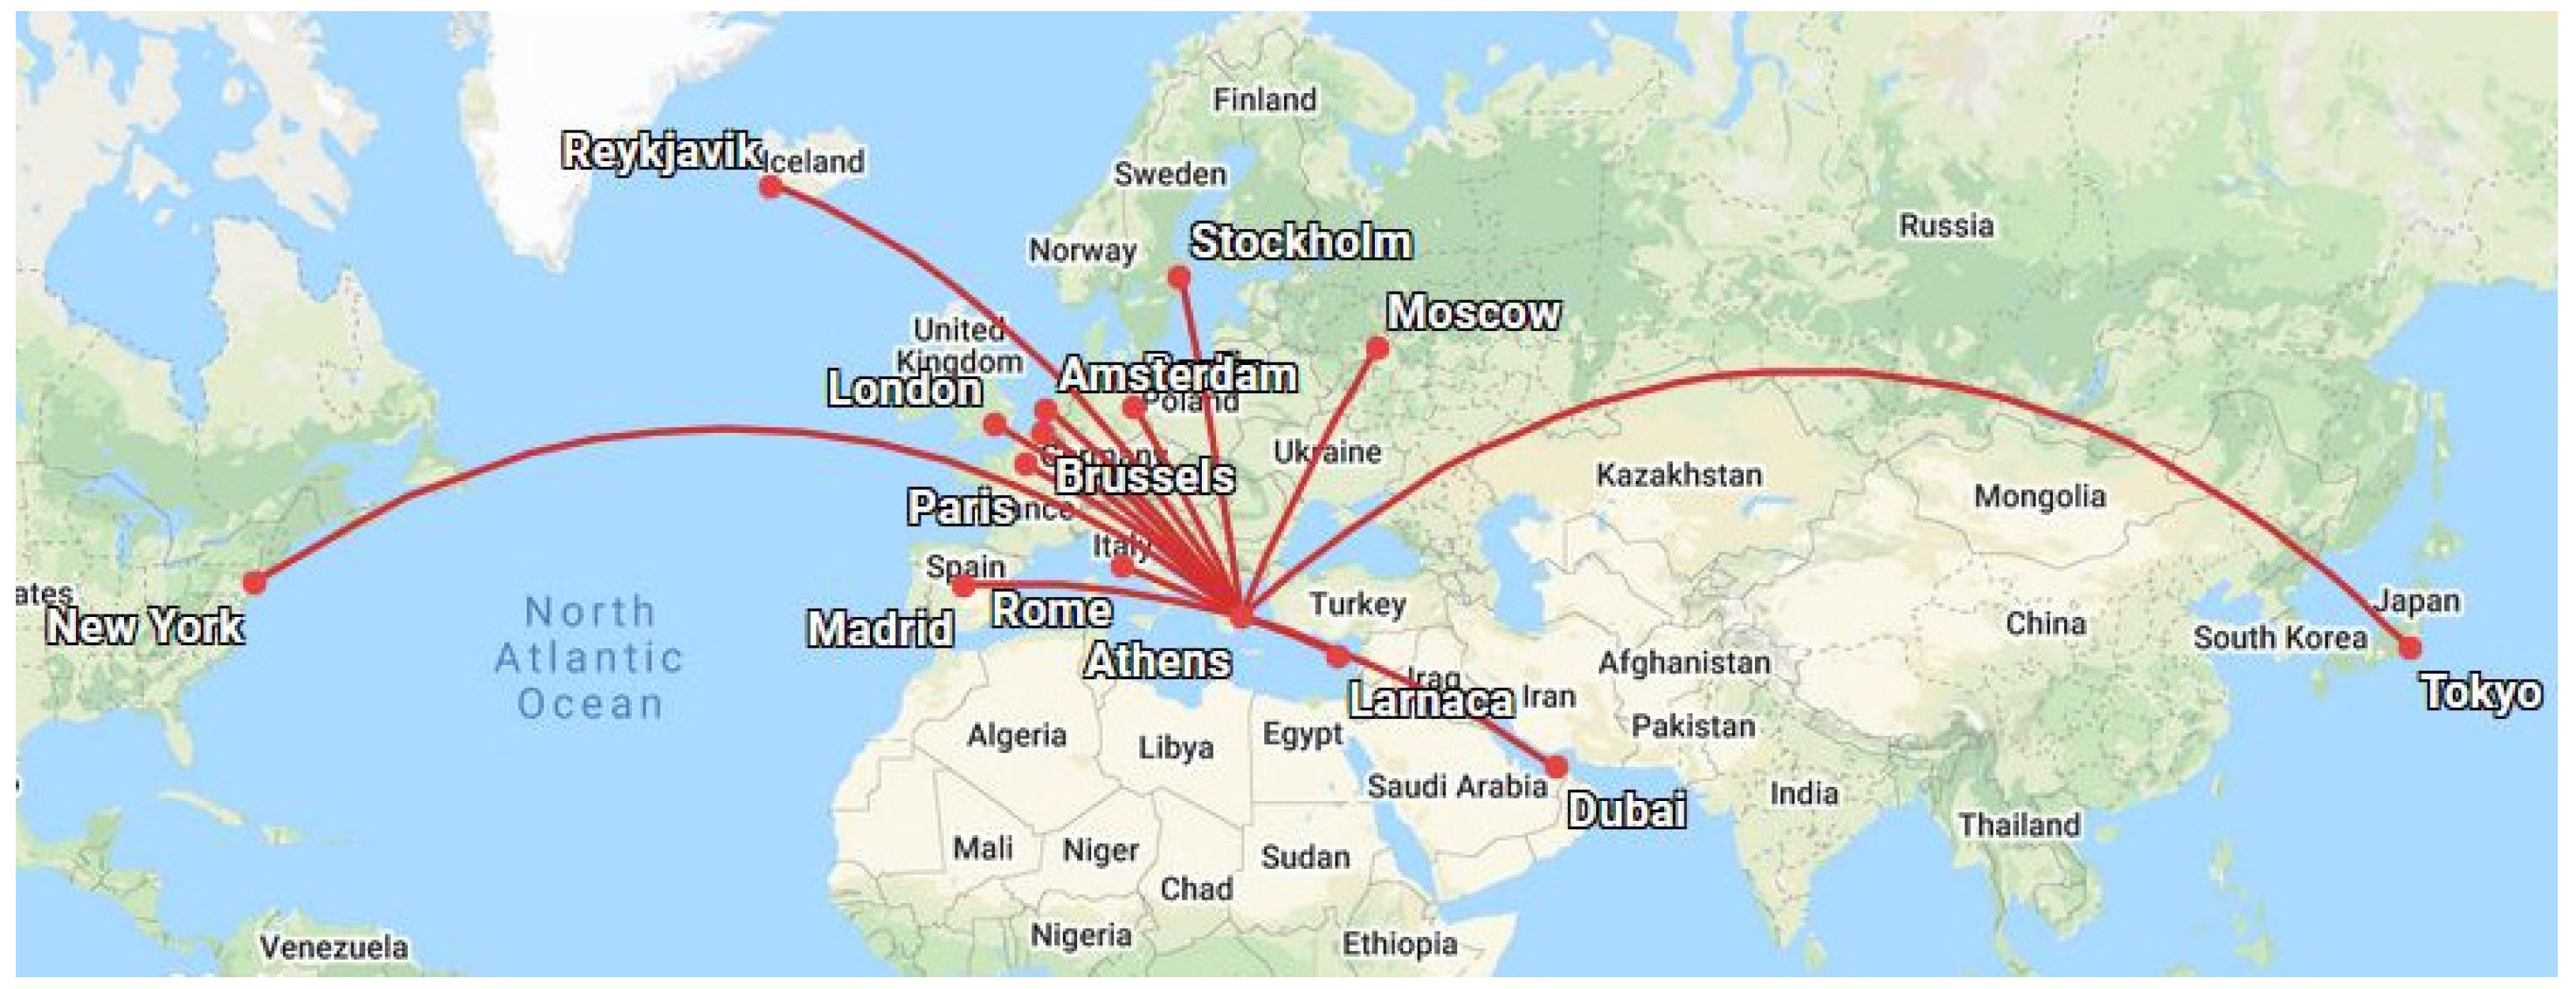
Figure 1. Flights from Athens International Airport used in this study.
Atmosphere 15 00149 g001
Figure 2. The total ambient dose equivalent H*(10) for international flights from Athens for solar maximum and solar minimum conditions (2001 and 2009, respectively) as estimated by DYASTIMA-R.
Atmosphere 15 00149 g002
Figure 3. The ambient dose equivalent rate dH*(10)/dt during international flights from Athens as calculated by DYASTIMA-R.
Atmosphere 15 00149 g003
Figure 4. Comparison of the total ambient dose equivalent H*(10) for international flights from Athens for 2001 (upper panel) and 2009 (lower panel), respectively, as calculated by DYASTIMA-R (blue) and CARI-7 (red).
Atmosphere 15 00149 g004
Table 1. Airports used in this study including their geographical coordinates.
CityAirportICAOGeogr. Coordinates
AthensEleftherios Venizelos AirportLGAV37:9° N; 23:9° E
LarnacaLarnaca International AirportLCLK34:9° N; 33:6° E
RomeLeonardo Da Vinci—Fiumicino AirportLIFR41:8° N; 12:2° E
MadridAdolfo Suarez Madrid—Barajas AirportLEMD40:5° N; 3:6° W
ParisChales de Gaulle AirportLFPG49:0° N; 2:5° E
BerlinBerlin Tegel AirportEDDT52:6° N; 13:3° E
AmsterdamAmsterdam Airport SchipholEHAM52:3° N; 4:8° E
BrusselsMelsbroek Air BaseEBMB50:5° N; 4:3° E
LondonHeathrow AirportEGLL51:5° N; 0:5° W
MoscowSheremetyvo International AirportUUEE56:0° N; 37:4° E
StockholmStockholm Arlanda AirportESSA59:6° N; 17:9° E
ReykjavikReykjavik AirportBIRK64:1° N; 21:9° W
DubaiDubai International AirportOMDB25:3° N; 55:4° E
New YorkJFK International AirportKJFK40:6° N; 73:8° W
TokyoNarita International AirportRJAA35:8° N; 140:4° E
Table 2. Duration of flights used in this study.
FlightDurationFlightDuration
Athens–Larnaca1 h 38 minAthens–Madrid3 h 27 min
Athens–Rome1 h 49 minAthens–London3 h 29 min
Athens–Berlin2 h 44 minAthens–Stockholm3 h 30 min
Athens–Brussels3 h 6 minAthens–Dubai4 h 35 min
Athens–Paris3 h 7 minAthens–Reykiavik5 h 41 min
Athens–Amsterdam3 h 11 minAthens–New York10 h 22 min
Athens–Moscow3 h 16 minAthens–Tokyo12 h 21 min
Disclaimer/Publisher’s Note: The statements, opinions and data contained in all publications are solely those of the individual author(s) and contributor(s) and not of MDPI and/or the editor(s). MDPI and/or the editor(s) disclaim responsibility for any injury to people or property resulting from any ideas, methods, instructions or products referred to in the content.