Article

On the Possible Climatic Consequences of the Large Oil Spills in Oceans

by
Nina Prokopciuk
1,*,
Nikolaj Tarasiuk
1,
Ulrich Franck
1,2,
Dean Ernest Schraufnagel
3,
Algirdas Valiulis
4,
Marina Kostantinova
5,
Tymon Zielinski
6 and
Arunas Valiulis
1
1
Human Ecology Multidisciplinary Research Group, Institute of Health Sciences and Institute of Clinical Medicine, Medical Faculty, Vilnius University, M.K. Ciurlionio Str. 21, LT03101 Vilnius, Lithuania
2
Helmholtz Centre for Environmental Research—UFZ, Permoserstrasse 15, E04318 Leipzig, Germany
3
Department of Medicine M/C 719, University of Illinois, 840 S. Wood St., Chicago, IL 60612-7323, USA
4
Institute of Health Sciences, Medical Faculty, Vilnius University, Ciurlionio Str. 21, LT03101 Vilnius, Lithuania
5
SRI Center for Physical Science and Technology, Savanoriu Av. 231, LT02300 Vilnius, Lithuania
6
Institute of Oceanology, Polish Academy of Sciences, 81-712 Sopot, Poland
*
Author to whom correspondence should be addressed.
Atmosphere 2024, 15(10), 1216; https://doi.org/10.3390/atmos15101216
Submission received: 30 July 2024 / Revised: 5 October 2024 / Accepted: 7 October 2024 / Published: 12 October 2024
(This article belongs to the Section Climatology)

Abstract

:
In the North Atlantic and the Northern Ocean, from the second half of 2010 to 2014, satellite imagery data showed increased surface water temperatures (in the Icelandic Depression area in September–October 2010, it was 1.3 °C higher than in 2009). The peak of the annual sum of mean monthly ocean surface temperatures near the Icelandic Depression in 2010 (109.3 °C), as well as the negative values of the monthly averaged North Atlantic Oscillation (NAO) indices, estimated in the second half of 2010 and until March 2011, can be explained by the appearance of an additional film of oil origin on the water surface, formed after an oil spill accident at the Deepwater Horizon drilling rig in the Gulf of Mexico. Insufficient evaporative cooling of surface waters near the Icelandic Depression related to the formation of an additive film due to the influence of pollution of the North Sea by oil can explain the earlier peak in the annual sum of mean monthly ocean surface temperatures near the Icelandic Depression in 2003 (107.2 °C). Although global warming is usually ascribed to increased greenhouse gases in the atmosphere, ocean surface water pollution could increase the heat content of the ocean and explain the steady temperature stratification and desalination of these waters due to the melting of Greenland’s glaciers. Thus, when analyzing the concept of global warming, it is necessary to take into account the aspects of pollution of the ocean surface waters to assess the changes in their capacity to accumulate solar radiation, as well as the changes in the heat content of the ocean mixing zone (~200 m).

1. Introduction

The Kyoto Protocol (2005) and the Paris Agreement (2016) are based on a scientific consensus that greenhouse gases (carbon dioxide (CO2), methane (CH4), nitrous oxide (N2O), hydrofluorocarbons (HFCs), perfluorocarbons (PFCs)), and emissions of sulfur hexafluoride (SF6)) are primarily responsible for the current climate warming. Between 2030 and 2050, climate change is projected to cause a quarter of a million deaths per year [1,2]. However, it is possible to identify other areas of human activity that can influence climatic effects. It is known [3] that the climate warming in high-latitude regions of the planet is twice as high as the global average. Climate models that take into account only greenhouse gas effects are not able to explain this effect. Therefore, it is necessary to identify additional mechanisms affecting climate warming in high latitudes.
The Earth’s oceans are the main accumulators of solar radiation and distributors of heat. Thin films of autochthonous origin cover the surface of water bodies. Human activities in seas and oceans, such as the passage of ships, oil spills, the settling of aerosol products, and phytoplankton and algal blooms affect the water surface and its thin upper layer [4,5,6]. This film changes the process of water evaporation and heat flux at the water–air interface, causing climatic changes at high latitudes of the Earth, which are most sensitive to the processes of heat redistribution since they receive significantly less solar radiation than the equatorial regions of the planet; here, the climate significantly depends on the meridional heat flows.
Numerous cases of oil spills in the world’s oceans are known (Figure 1).
The disaster that occurred in the Gulf of Mexico on the Deepwater Horizon drilling platform on 20 April 2010 was the largest oil spill at sea in history (Figure 1) [4]. The total oil discharge was estimated at 4.9 million barrels [7]. To limit the spread of oil on the sea surface, ship oil skimmers, floating booms, and oil dispersants were used. The wellhead was not closed until July 2010. From this disaster, oil slicks were transferred by the Gulf Stream into the Atlantic Ocean. Deep plumes of dissolved oil at the bottom of the Gulf of Mexico were not completely trapped here, and light fractions appeared on the sea surface, creating additional layers of oil slicks [8,9], which became a long-term source of the surface film in the Atlantic Ocean.
Oil slicks on the sea surface are thick surface layers of the lightest oil fractions, visible from satellite and to the naked eye. Modelling the movement of these slicks on the sea surface [10] does not allow us to say anything about the movement of the surface film, the source of which are these slicks. Due to wetting, the lightest components of oil quickly spread over the sea surface, moving away to great distances from the oil slicks [11]. This is how an invisible microlayer of surface film is formed. Wind and sea currents also contribute to the movement of the surface film. In the surf zone, under the influence of wind, the sea surface is cleared of the surface film with the formation of foam, which is thrown by the wind onto the seashore. This is a unique self-cleaning mechanism of the sea surface [6,12,13,14,15].
The presence of oil in the surface film can be determined by sulfur compounds—the most common impurity element of oil—which are also present in aerosols of marine origin. Due to the long-range transport of marine aerosol particles, the proportion of sulfate concentration at Preila station in Lithuania increased to 22% over the period 2010–2017 [16]. An elevated sulfate concentration in sea aerosols was also recorded in the Norwegian Sea in 2011–2012 during the summer Arctic expeditions aboard the research vessel Oceania (the Institute of Oceanology of the Polish Academy of Sciences) [17].
The aim of our work is to show the relationship between Atlantic Ocean pollution with oil products and global warming. In this work, temperature anomalies of the water surface in the Icelandic Depression area [18,19] after the major oil spill in the Gulf of Mexico in April 2010, changes in the North Atlantic Oscillation indices [18,19], and temperature changes at weather stations in northern latitudes in Europe and Canada following this disaster are used. We also show how far the warm waters of the Gulf Stream penetrate into the Northern Ocean during the period 1995–2019, using the course of the annual sums of the mean monthly eastern longitudes of the 4 °C and 8 °C isotherms for this period.

2. Study Methodology

In this work, data on monthly averaged sea surface temperatures (SSTs), North Atlantic Oscillation (NAO) indices and average annual temperatures (AATs) at selected weather stations in Europe, North America (Canada), Greenland and Iceland were used. Data on the surface water temperatures in the Icelandic Depression and in the Northern Ocean were obtained from the Extended Reconstructed Sea Surface Temperature (ERSST) database. For this purpose, ERSST maps were used [20]. Data on the annual mean monthly eastern longitudes of the Northern Ocean surface water 8 °C and 4 °C isotherms, as well as ice melt data, were taken from the National Oceanic and Atmospheric Administration (NOAA) Optimum Interpolation SST (OISST) Version 2.1 [21]. Information on North Atlantic Oscillation (NAO) indices was retrieved from the National Oceanic and Atmospheric Administration (NOAA) website [22]. Data on AAT at selected weather stations were taken from the site TuTiempo.net [23]. These data were used to establish interrelationships.
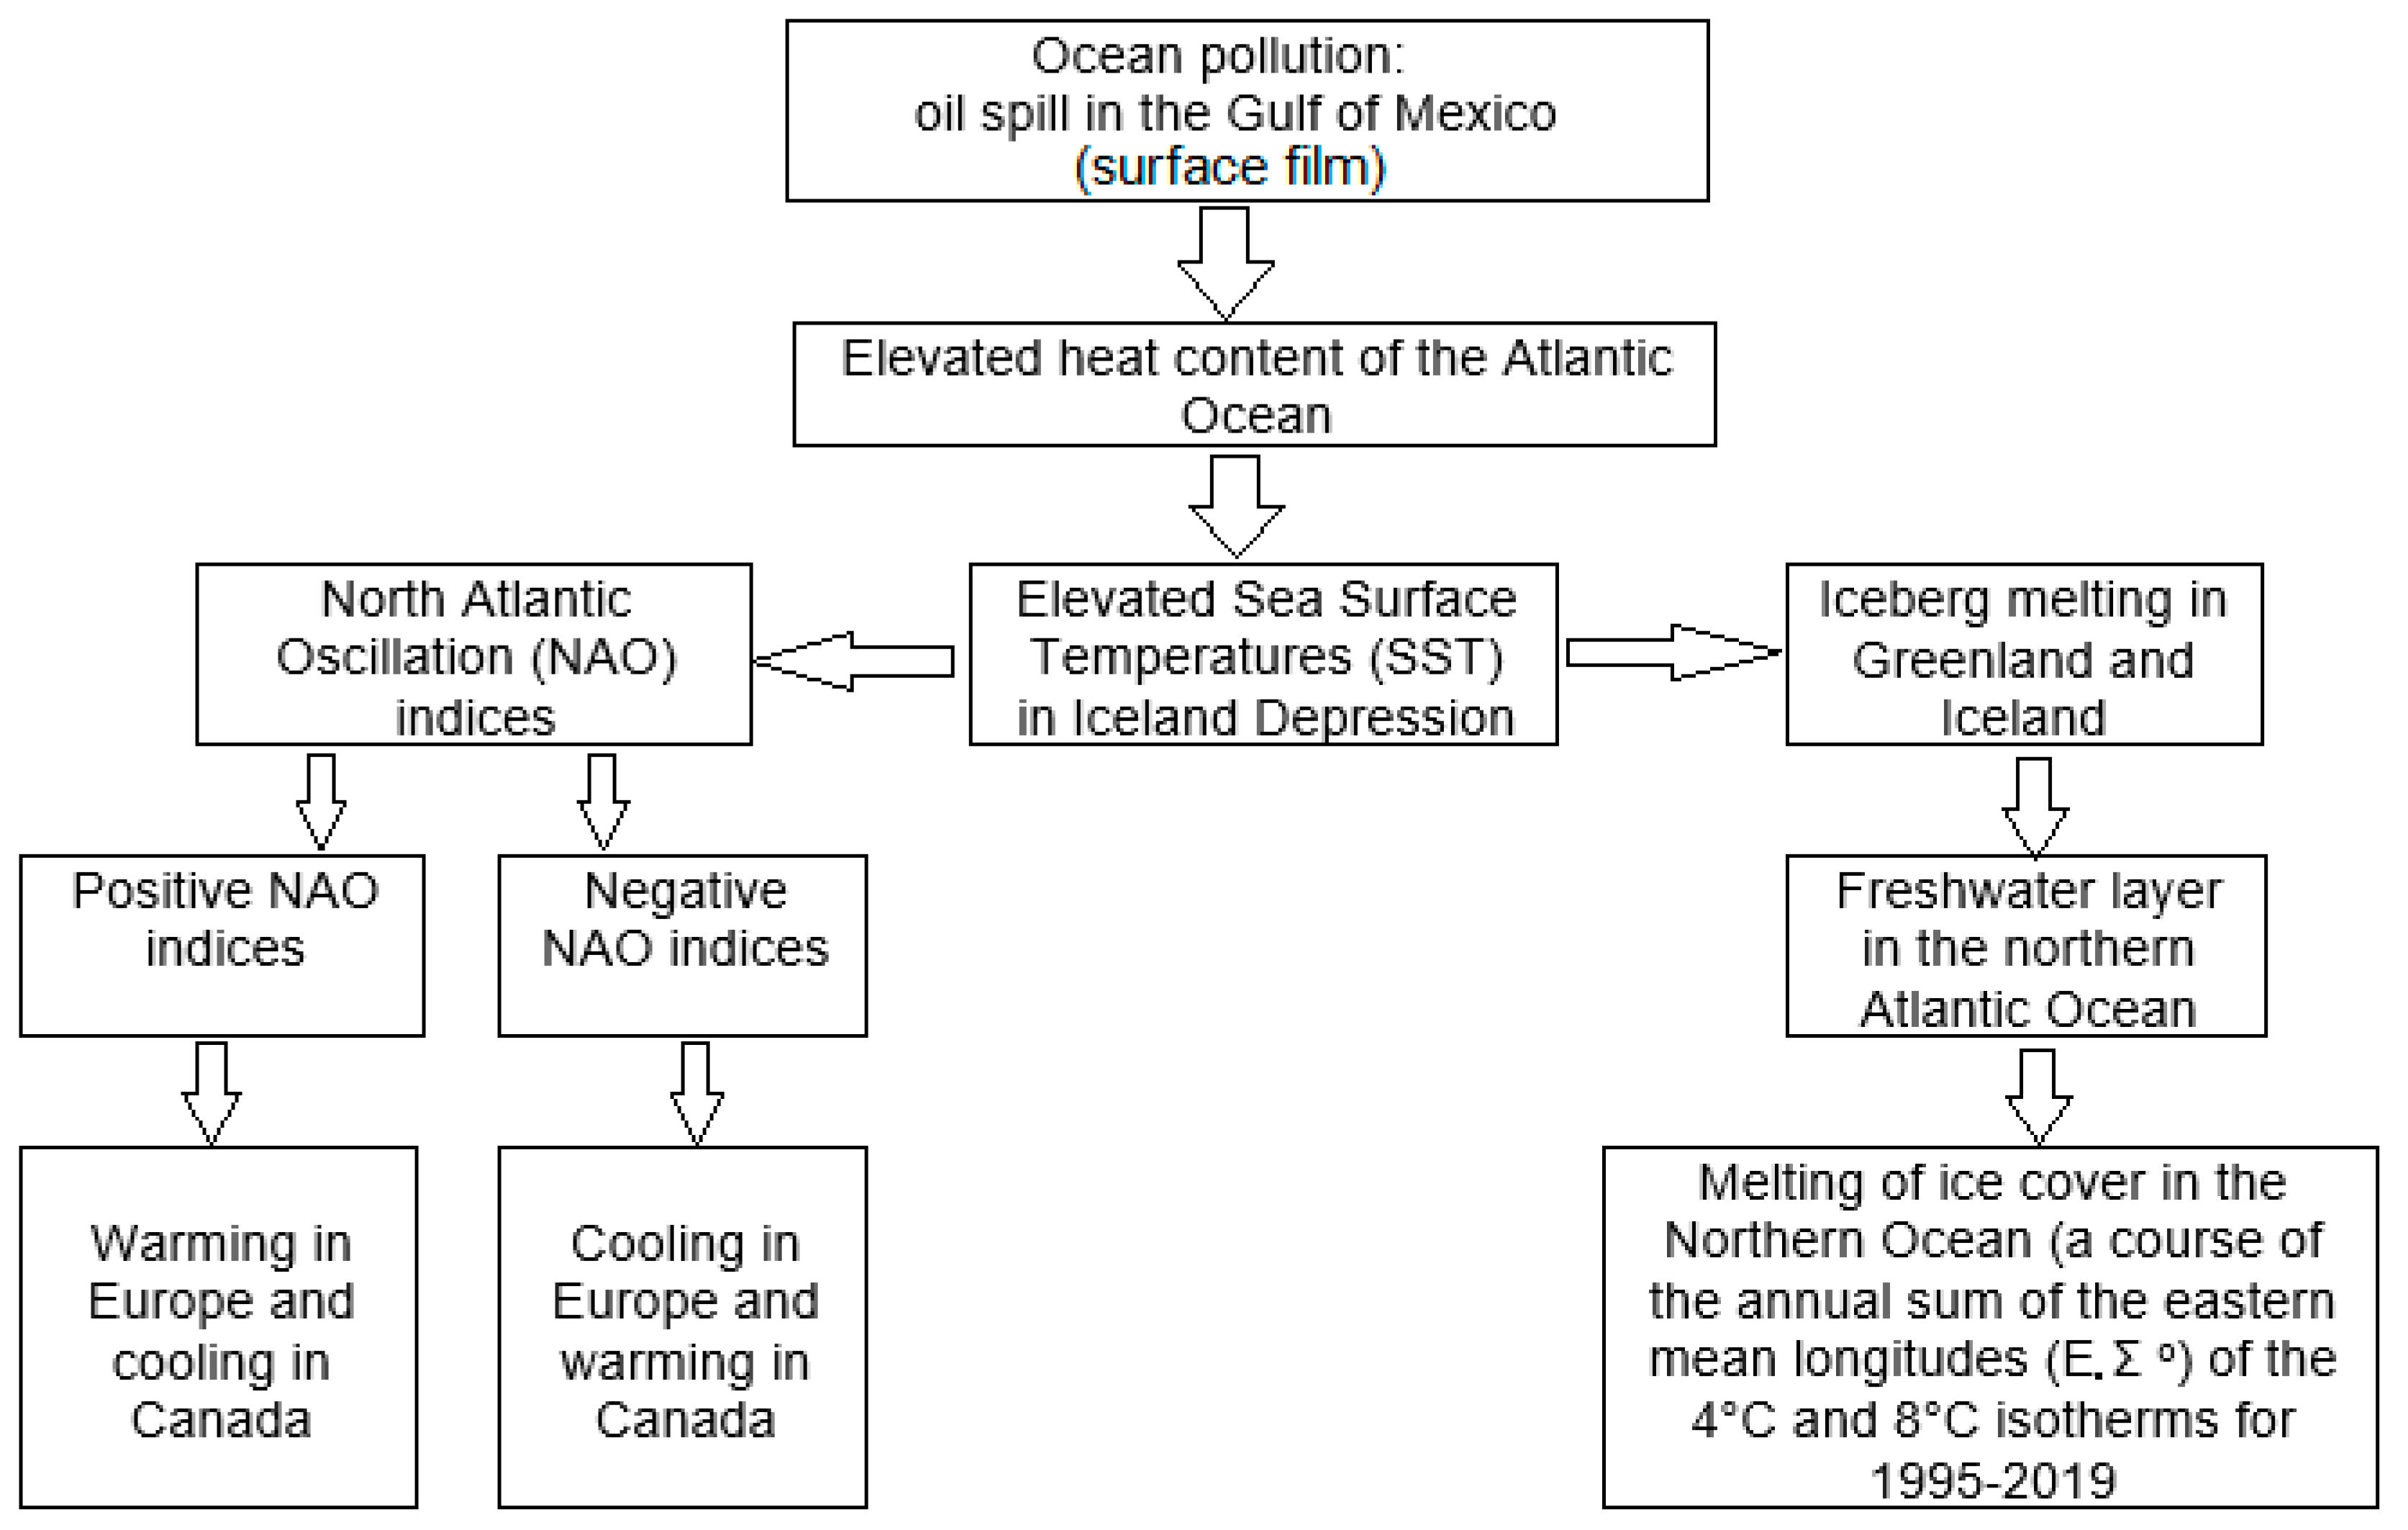
The research steps used and the results achieved in our study are shown in Figure 2.
The main consequence of the oil spill in the Gulf of Mexico was the formation of a surface film of oil origin that was carried by the Gulf Stream, which originates in the Gulf of Mexico, to the northern latitudes of the Atlantic Ocean, including to the Icelandic Depression (Figure 3).

3. Results

3.1. Temperature Anomalies in the Northern Atlantic near the Icelandic Depression

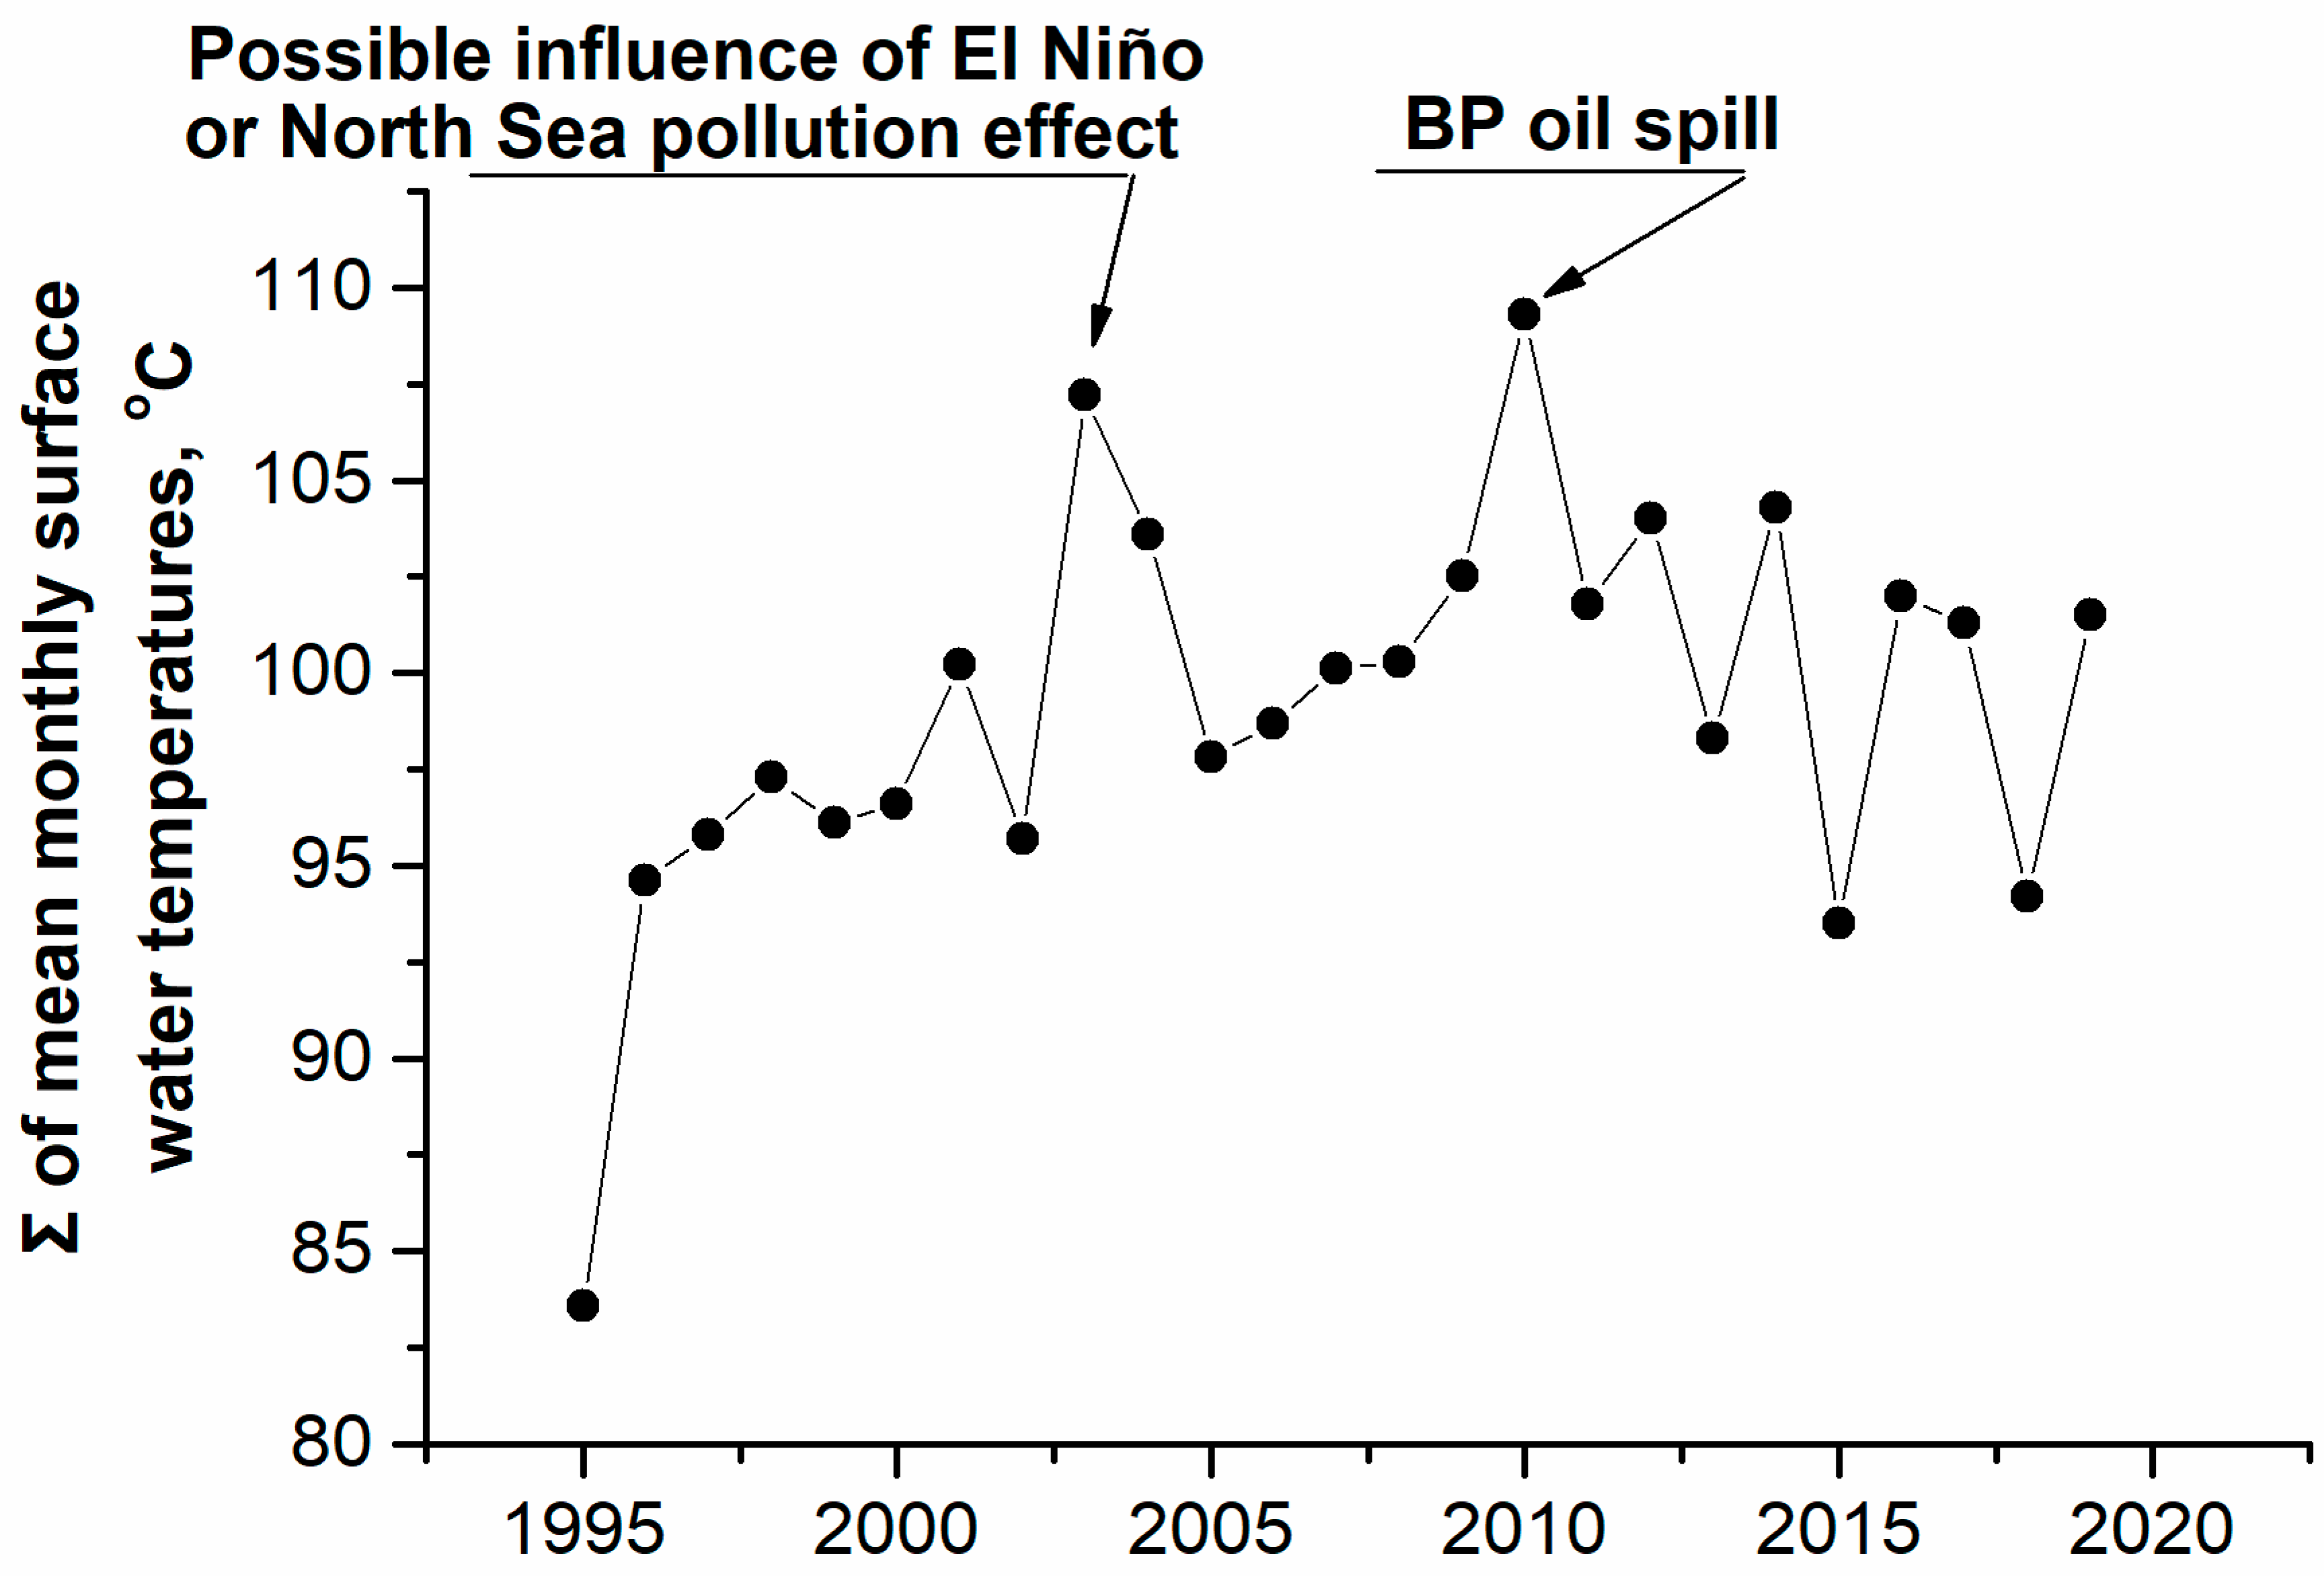
The elevated mean monthly sea surface temperatures (SSTs) in the North Atlantic near the Icelandic Depression (Reykjavik) were determined using a satellite imaging system [20] from November 2002 to December 2004 and from June 2010 to December 2014 (Table 1). These data are highlighted in bold (Table 1) based on the peak value of the annual sum of mean monthly sea surface temperatures in 2003, as well as the corresponding peak values in the interval 2010–2014 in Figure 4. Fluctuations in peak values in the interval 2010–2014 are due to biennial oscillations in the interaction of the Gulf Stream with the Northern Ocean.
Water surface temperatures affect the rise of air masses and pressure fluctuations in the Icelandic Depression, which influence the values of the North Atlantic oscillation (NAO) indices [25,26]. Before the major oil spill in the Gulf of Mexico, the sum of mean monthly surface water temperatures near the Icelandic Depression varied between 95.7 °C and 107.2 °C. There are two main peaks for the sums of the mean monthly surface water temperatures near the Icelandic Depression (Figure 4). After the Gulf of Mexico oil spill in June 2010, the surface water temperatures near the Icelandic Depression increased. The temperature increment in September and October 2010 compared to the same months in 2009 was 1.3 °C (Table 1).
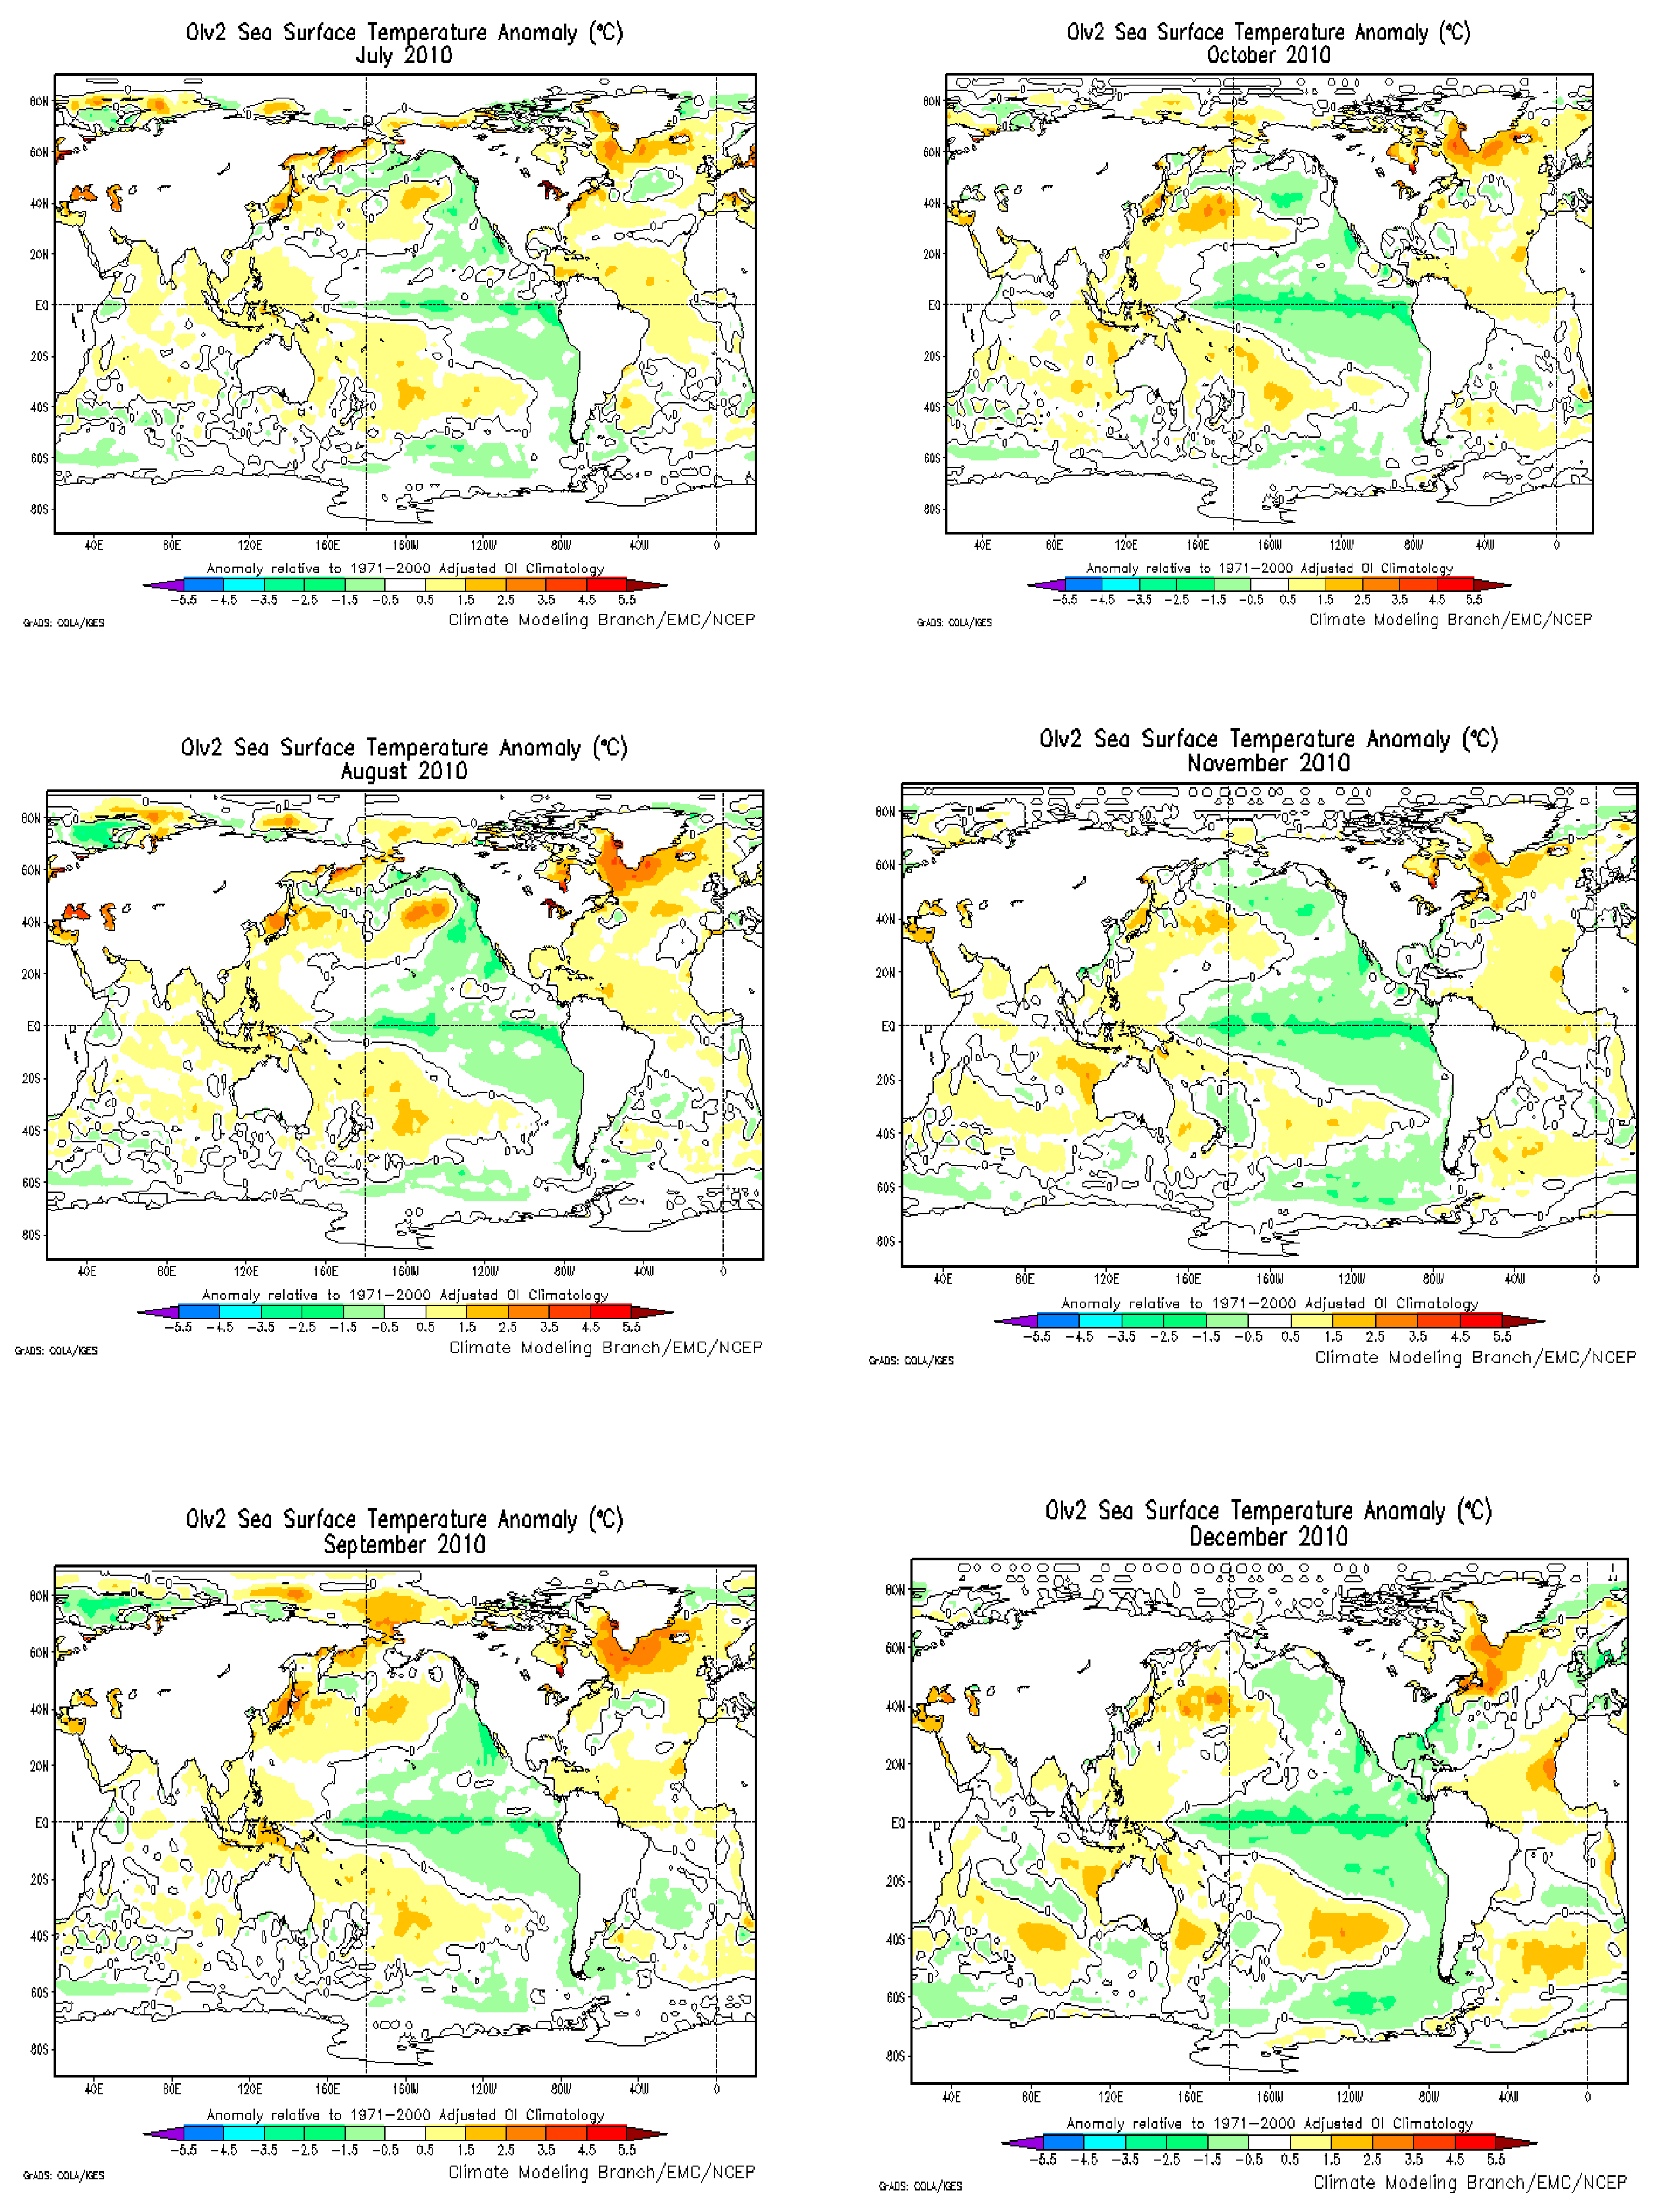
The normal course of the mean surface water temperatures in the area resumed only in 2015 (Table 1), which correlates with the disappearance of the oil spill in the Gulf of Mexico. The annual sum of mean monthly surface water temperatures reached its maximum in 2010 (about 109.3° C, Table 1). Given that the surface current speed of the Gulf Stream is about 2.5 m/s [27], the surface film from the Gulf of Mexico oil spill could have reached the North Atlantic region in June and July 2010 [28] (Appendix A).
Table 1 and Figure 4 show that the annual sum of mean monthly surface water temperatures was also maximal in 2003–2004. The rise in the mean monthly surface water temperature in the Icelandic Depression began in November 2002 and peaked in August 2003 (12.8 °C), which was 2.3 °C higher than in the same month of the previous year (Table 1).
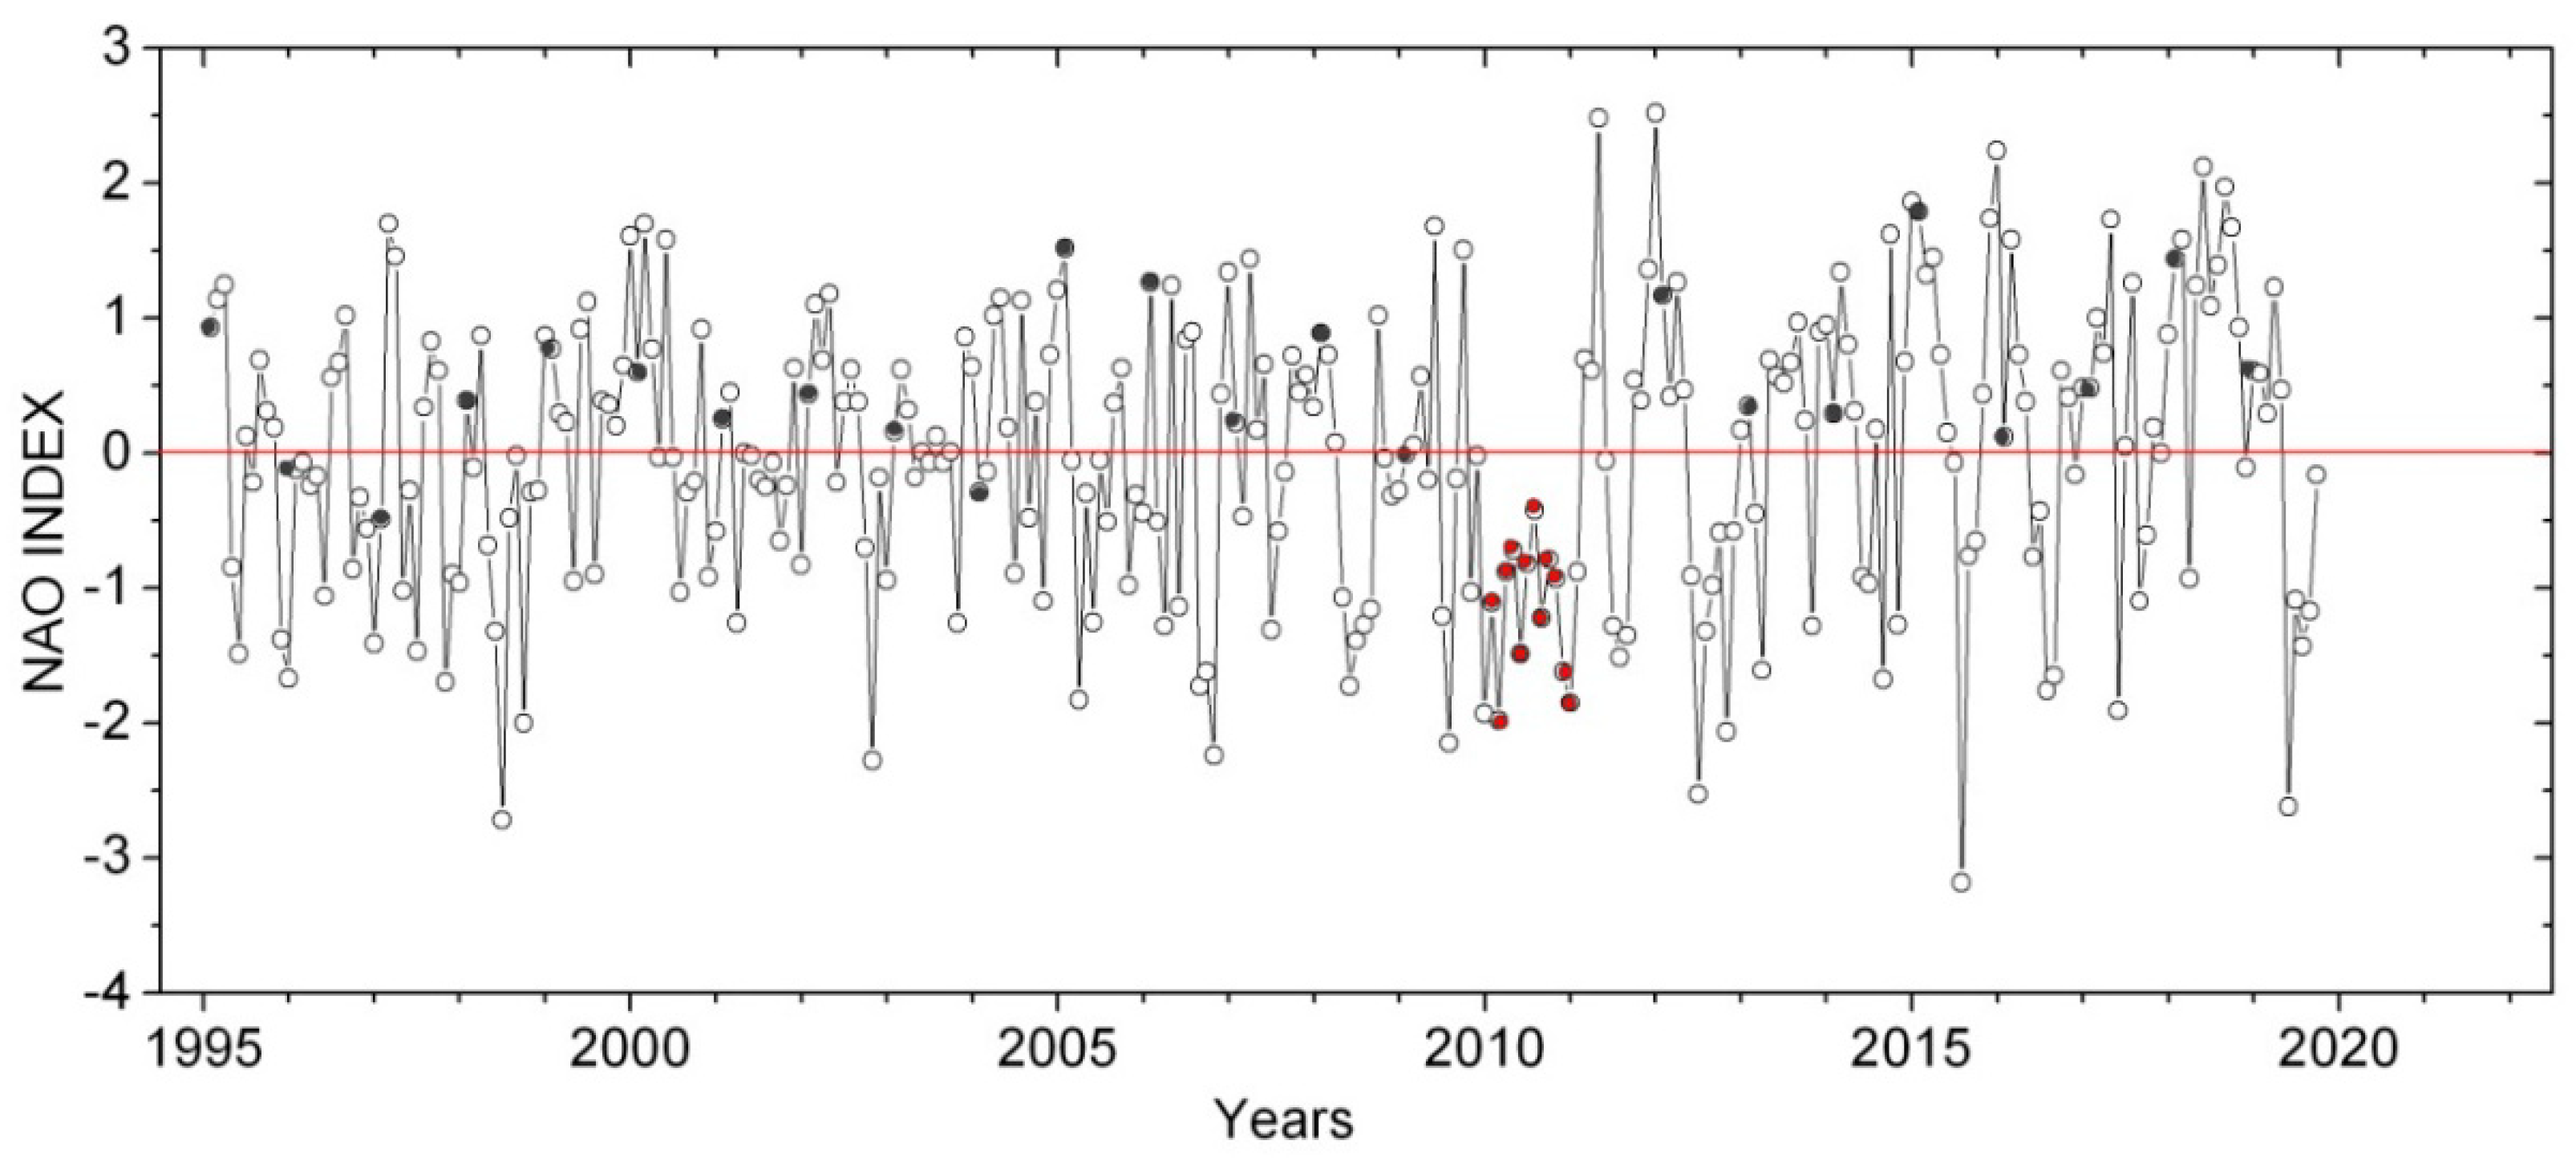
In November 2002, the tanker Prestige sank in the Atlantic Ocean about 210 km off the northwestern coast of Spain. It contained more than 70,000 tons of heavy fuel oil, of which 63,000 tons spilled [29]. However, the oil slick moved not north, but south to the coast of Africa, because the accident occurred in the Gulf Stream branch directed to the south. The course of the NAO index values in 2003 differed significantly from the corresponding course at the end of 2010 and 2011 as a result of the accident on the BP platform in the Gulf of Mexico (Figure 5). Thus, it is likely that in the case of the first peak of the annual sum of mean monthly temperatures (Figure 4), there was no surface film in the Icelandic Depression, which raises the likelihood that another effect was in play.
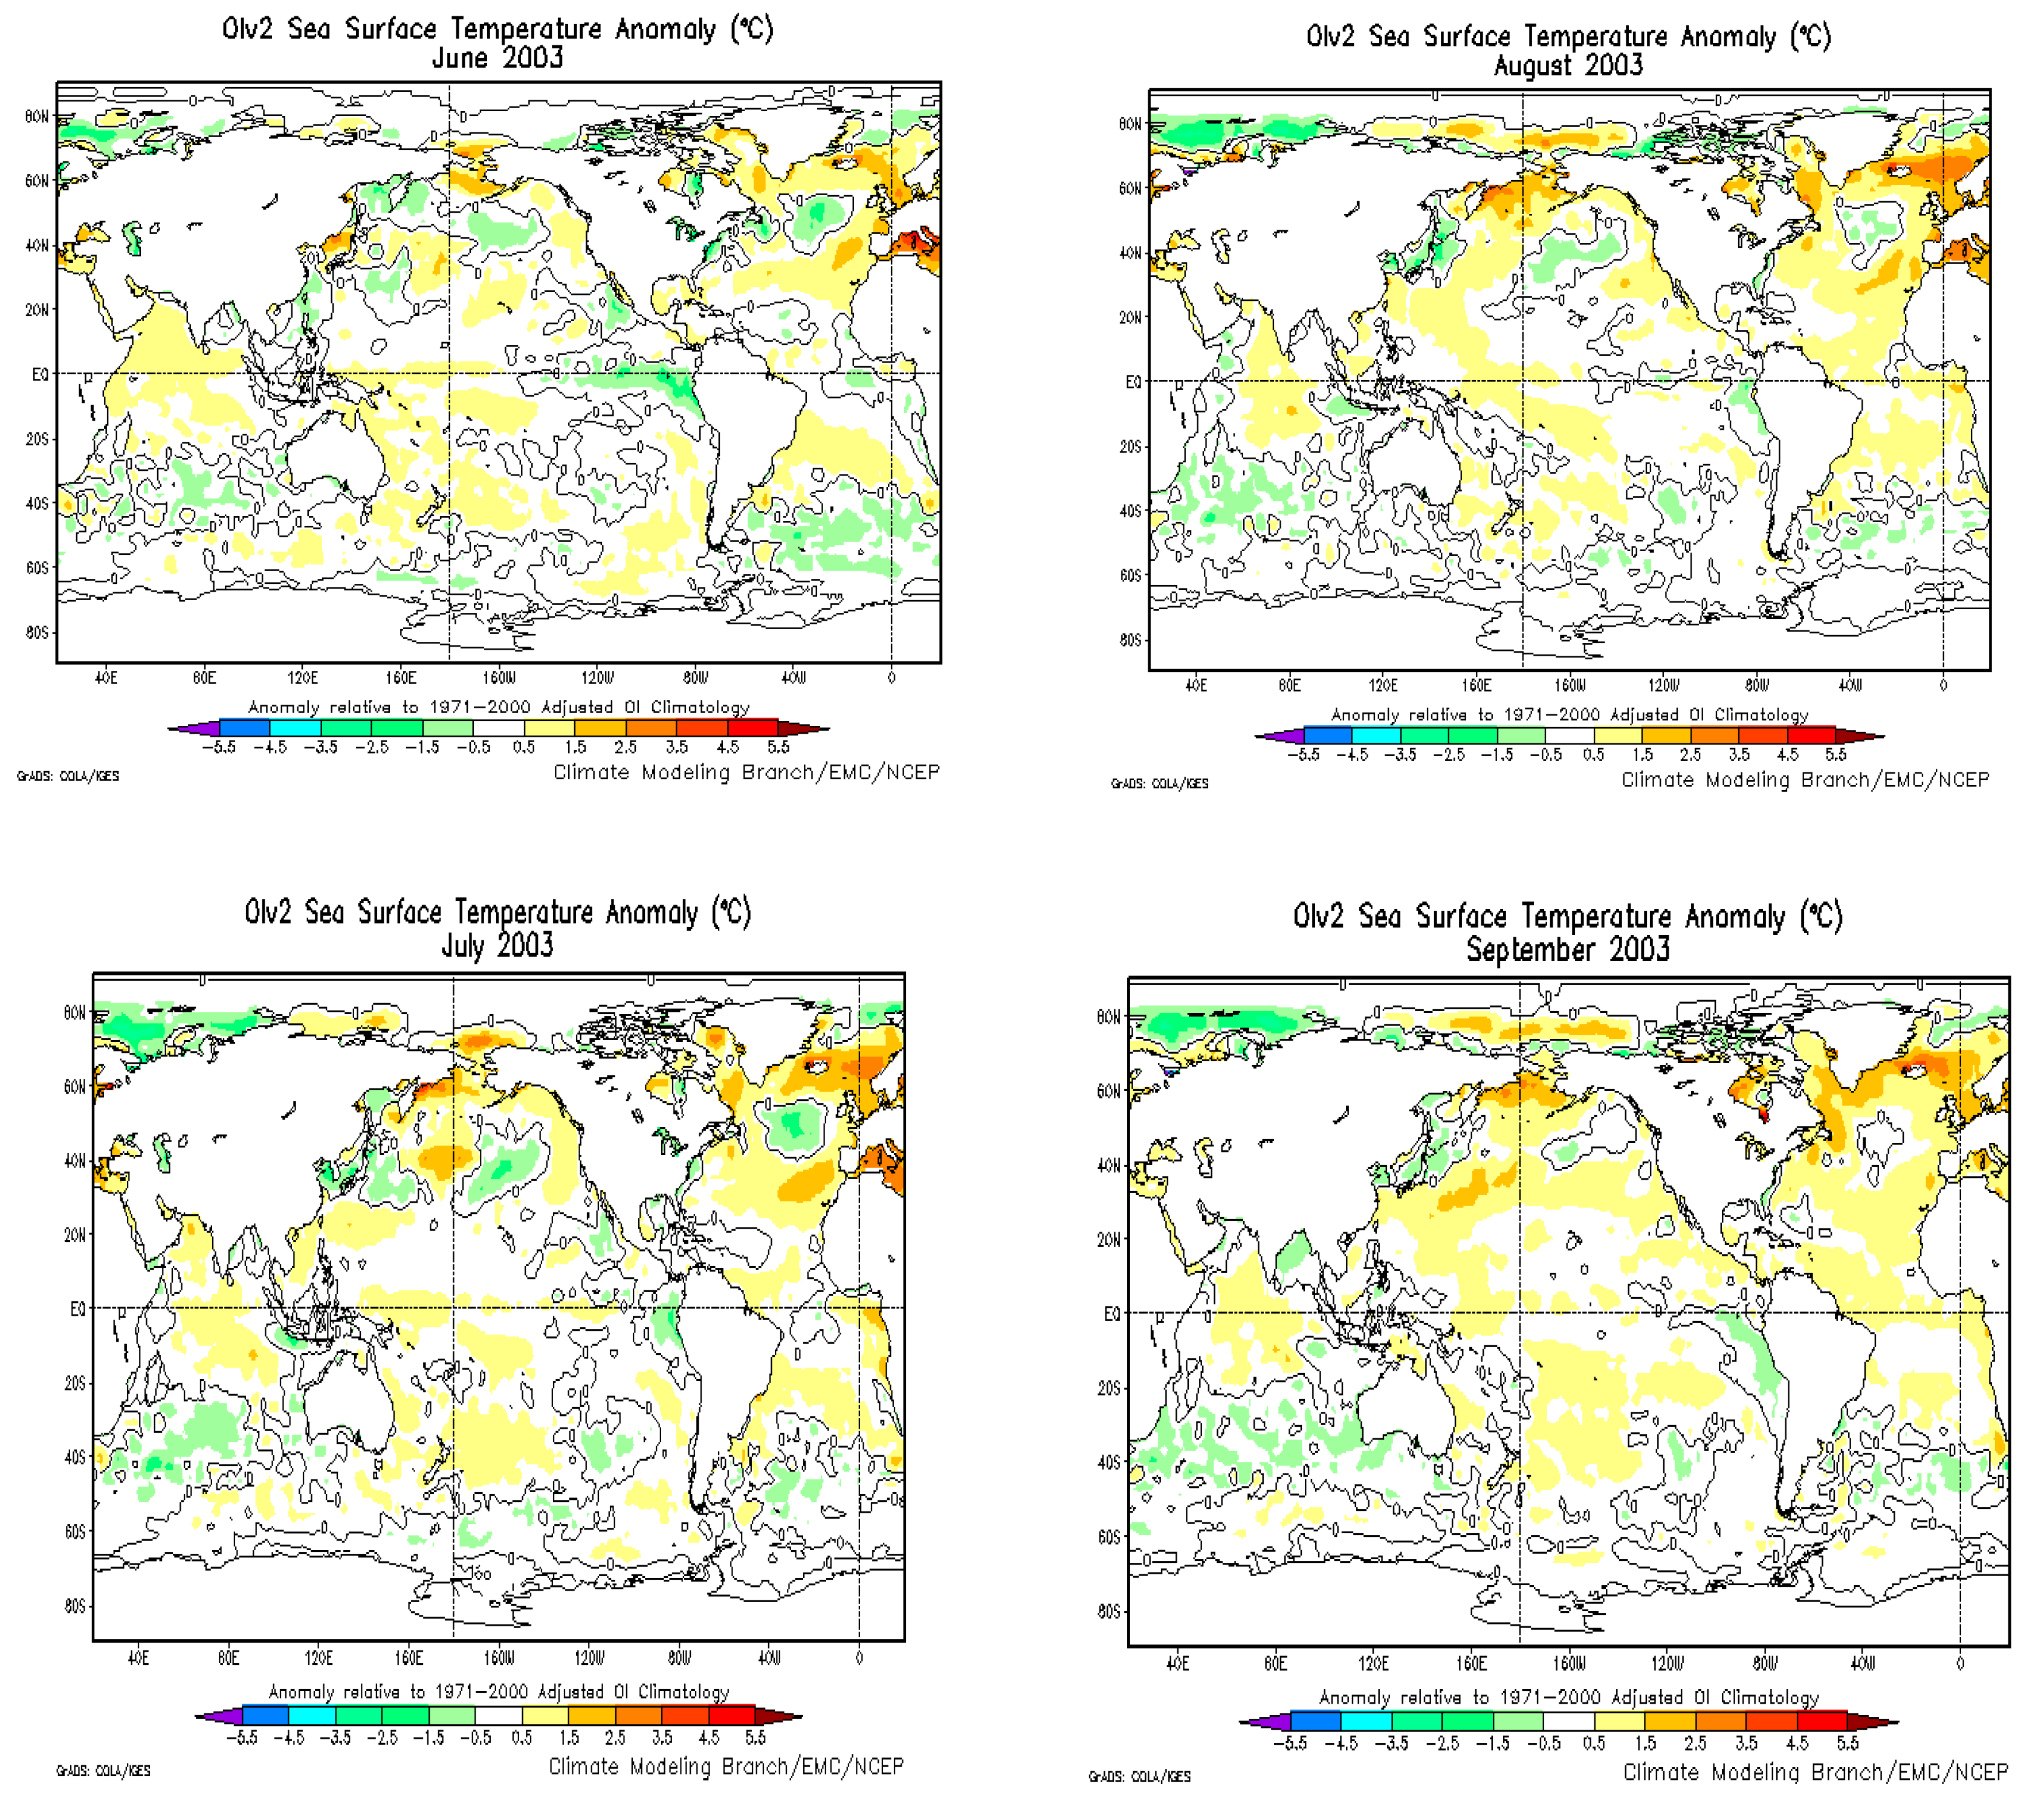
However, the patterns of anomalous mean monthly ocean surface temperatures [20] show that this phenomenon may also be associated with the influence of elevated surface temperatures in the North Sea, which, in August 2003, increased by 2.5 °C to 3.5 °C due to oil pollution on the sea surface (Appendix B) [28]. Since the 1960s, the North Sea has become an intensive oil and gas production area.
The use of production water on drilling platforms to increase pressure in aging oil wells and consequently increase oil recovery is accompanied by significant oil leaks. Production water is trapped in underground formations and comes to the surface as a by-product of oil and gas extraction and contains hazardous substances. In 2001, along with the operational discharge of almost 400 million tons of production water, about 14 million tons of oil poured into the North Sea.
The North Sea is also the zone with the most intensive ship routes serving the largest ports in Europe. Oil products enter the sea from ships through legal and accidental discharges. In 2003, 640 accidental spills were registered [30]. These spills contribute to the formation of surface films that reduce evaporation and increase sea surface temperatures. Thus, the negative NAO indices recorded in the second half of 2003 can also be explained by surface pollution of the North Atlantic waters with oil products, despite the anomalously elevated water surface temperatures (Figure 5).
This additional surface film reduces the heat losses of the Gulf Stream water to the atmosphere due to evaporation (evaporative cooling). At the same time, slightly elevated surface temperatures increase the heat flux into the atmosphere due to the thermal conductivity of the near-surface air layer. However, in terms of heat balance, changes in evaporative cooling can be most significant during the warmer months. Reducing evaporation due to additional surface film is also important for the leverage effect on the raised near-water air layer because water molecules are lighter than nitrogen molecules. Consequently, the increased temperatures of water covered with an additional surface film in the North Atlantic in warm seasons may be followed by pressure increases at the Icelandic Depression and, consequently, negative indices of the North Atlantic Oscillation (NAO).
The emergence of the additional surface film in the North Atlantic causes increased foam generation in the surf zone on the seashore [12,13,14,15]. The presence of spilled oil products in the surface film after July 2010 should indicate a change in the ratio of sulfur isotopes in sea aerosol samples, but such studies were not carried out in 2010–2015.

3.2. The Course of the North Atlantic Oscillation (NAO) Indices

The NAO and East Atlantic Oscillation (EAO) indices determine the strength and direction of cyclones, as well as the location of storm tracks over the North Atlantic region [31,32]. With positive NAO and EAO indices, eastward winds prevail over the North Atlantic, resulting in mild and humid winters in Europe and cool and rainy summers. At the same time, this leads to colder winters in Canada due to the involvement of Arctic air masses in atmospheric circulation. Positive NAO indices arise when there is a zone with increased evaporation in the North Atlantic near Iceland. This is a zone with elevated ocean surface water temperatures.
This phenomenon can arise due to both the transport of warmer water masses due to the Gulf Stream, and the heated melt waters of Greenland. In connection with the warming of the climate there in the summer months, glacial melting has increased [33,34]. Positive NAO indices and westerly winds always correlate with strong polar jet currents keeping cold polar air in the polar vortex. Disruption and weakening of the polar vortex and polar jet stream are always associated with sudden stratospheric warming (SSW) events [35].
Negative NAO indices, on the contrary, are associated with a decrease in energy exchange between the ocean and the atmosphere. These indices show that westerly winds are suppressed, easterly winds prevail, and cold Arctic air can penetrate southward through Europe. This can result in extreme and dry summers and cold and less snowy winters. Significant negative NAO indices, which lead to cold winters in Europe, are also explained by the simultaneous occurrence of the warm phase of the El Niño Southern Oscillation, the strong easterly phase of the Quasi-Biennial Oscillation, and low solar activity [36]. NAO index variation for the period 1995–2020 [22] at an altitude of 500 mb is shown in Figure 5.
Negative NAO indices persisted throughout 2010. In the first half of 2010, these negative values were associated with a major sudden stratospheric warming event starting on 21 January 2010 [37]. Negative NAO indices in the second half of 2010 can be explained by the consequences of an increase in water surface temperature in the Icelandic Depression area due to a decrease in evaporative cooling owing to the additional surface film.
In the winter of 2010–2011, there were fewer eastward winds than expected over the North Atlantic, and they resumed with positive NAO indices only in April 2011. The negative NAO indices in winter 2010–2011 may have been associated with a decrease in heat fluxes into the atmosphere due to the surface film, despite the increased temperature gradients at the water–air interface.
Further major sudden stratospheric warming occurred in 2012 and 2013 [37], which was also reflected in the corresponding negative NAO indices. The influence of the surface film in warm seasons (negative NAO indices) gradually decreased until 2015. Sudden stratospheric warming on 5 January 2013 [37] occurred at low positive NAO index values (Figure 5). Such a slow increase from low positive values of the NAO index to high regular values in winter during 2013–2014 may be associated with warming in the Northern Ocean due to the elevated temperatures of the Norwegian Stream. This warming could explain the high negative NAO index in the summer of 2015 (Figure 5).
In the case of the oil spill from the tanker MV Prestige in the autumn of 2002, NAO indices at 500 mb in 2003 did not show any features like those in 2010. As a rule, energy transfer during large sudden stratospheric warming through tropopause breaks can be recorded due to an increase in the Be-7 concentrations in the surface air [38], which is always followed by a corresponding increase in the concentrations of other components in stratospheric air.

3.3. Climatic Consequences in Europe and Canada

The climatic consequences of the Gulf of Mexico oil spill were estimated using data from weather stations in Europe, North America, Greenland and Iceland. The locations of the stations in this study are shown in Figure 6.
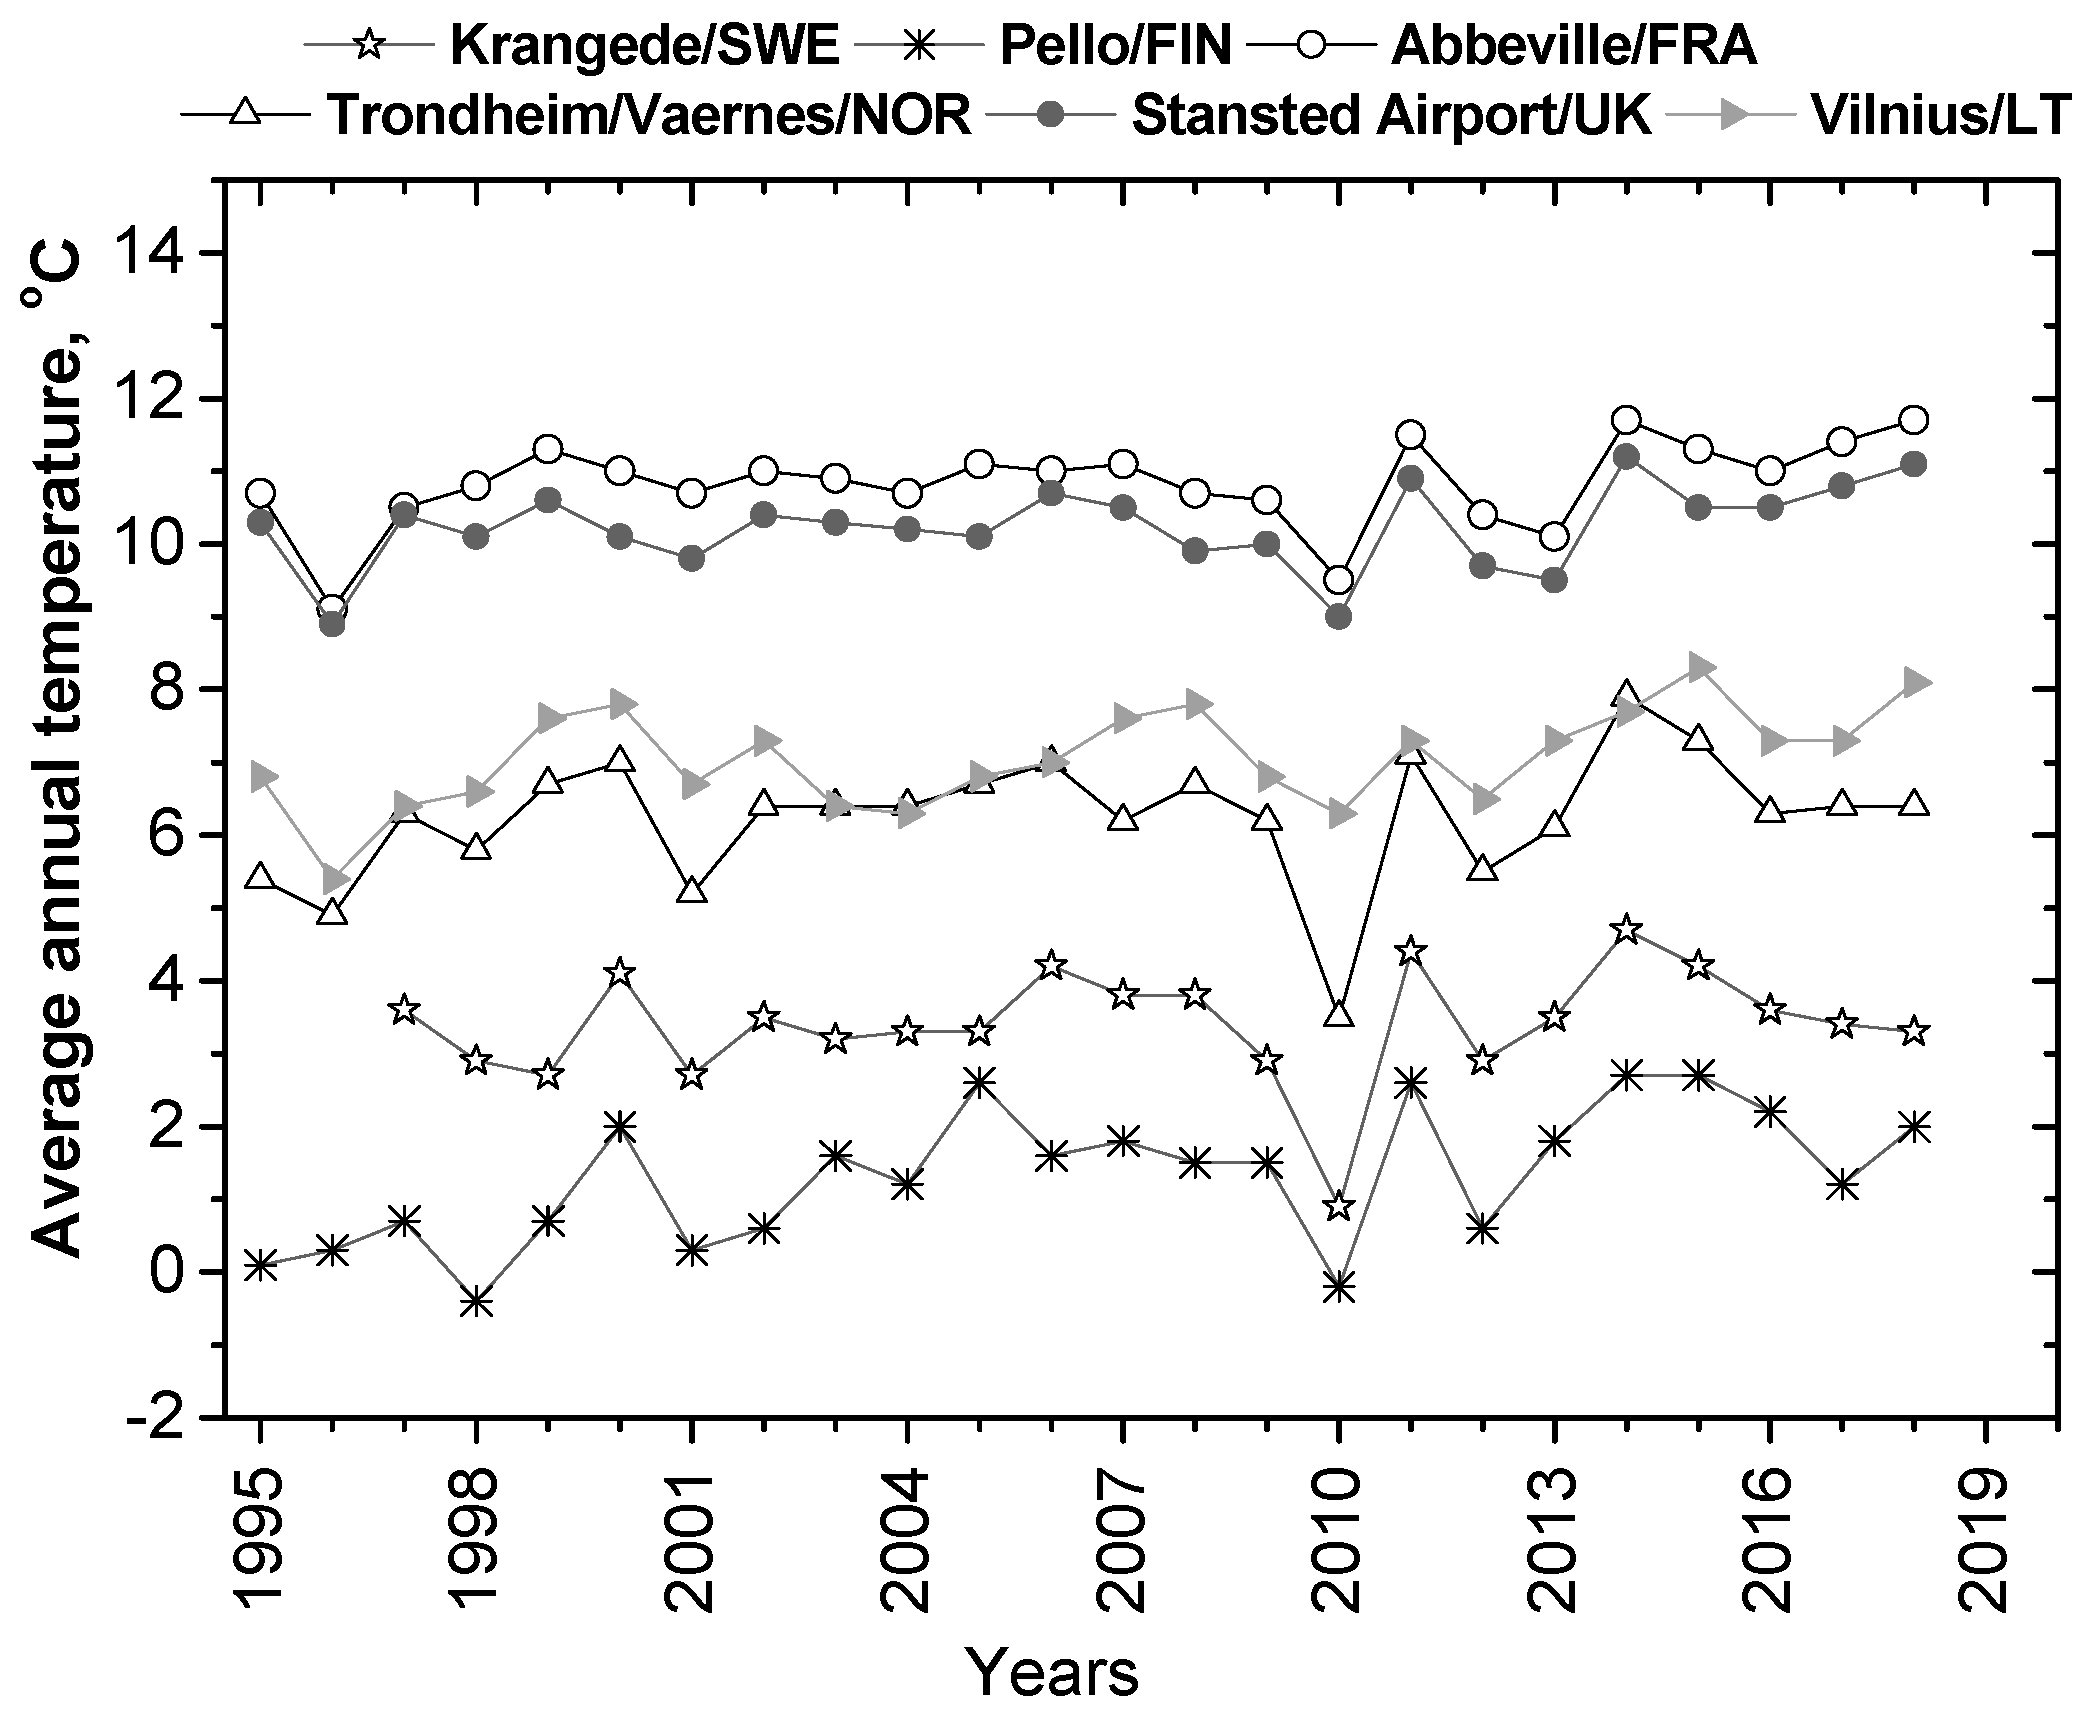
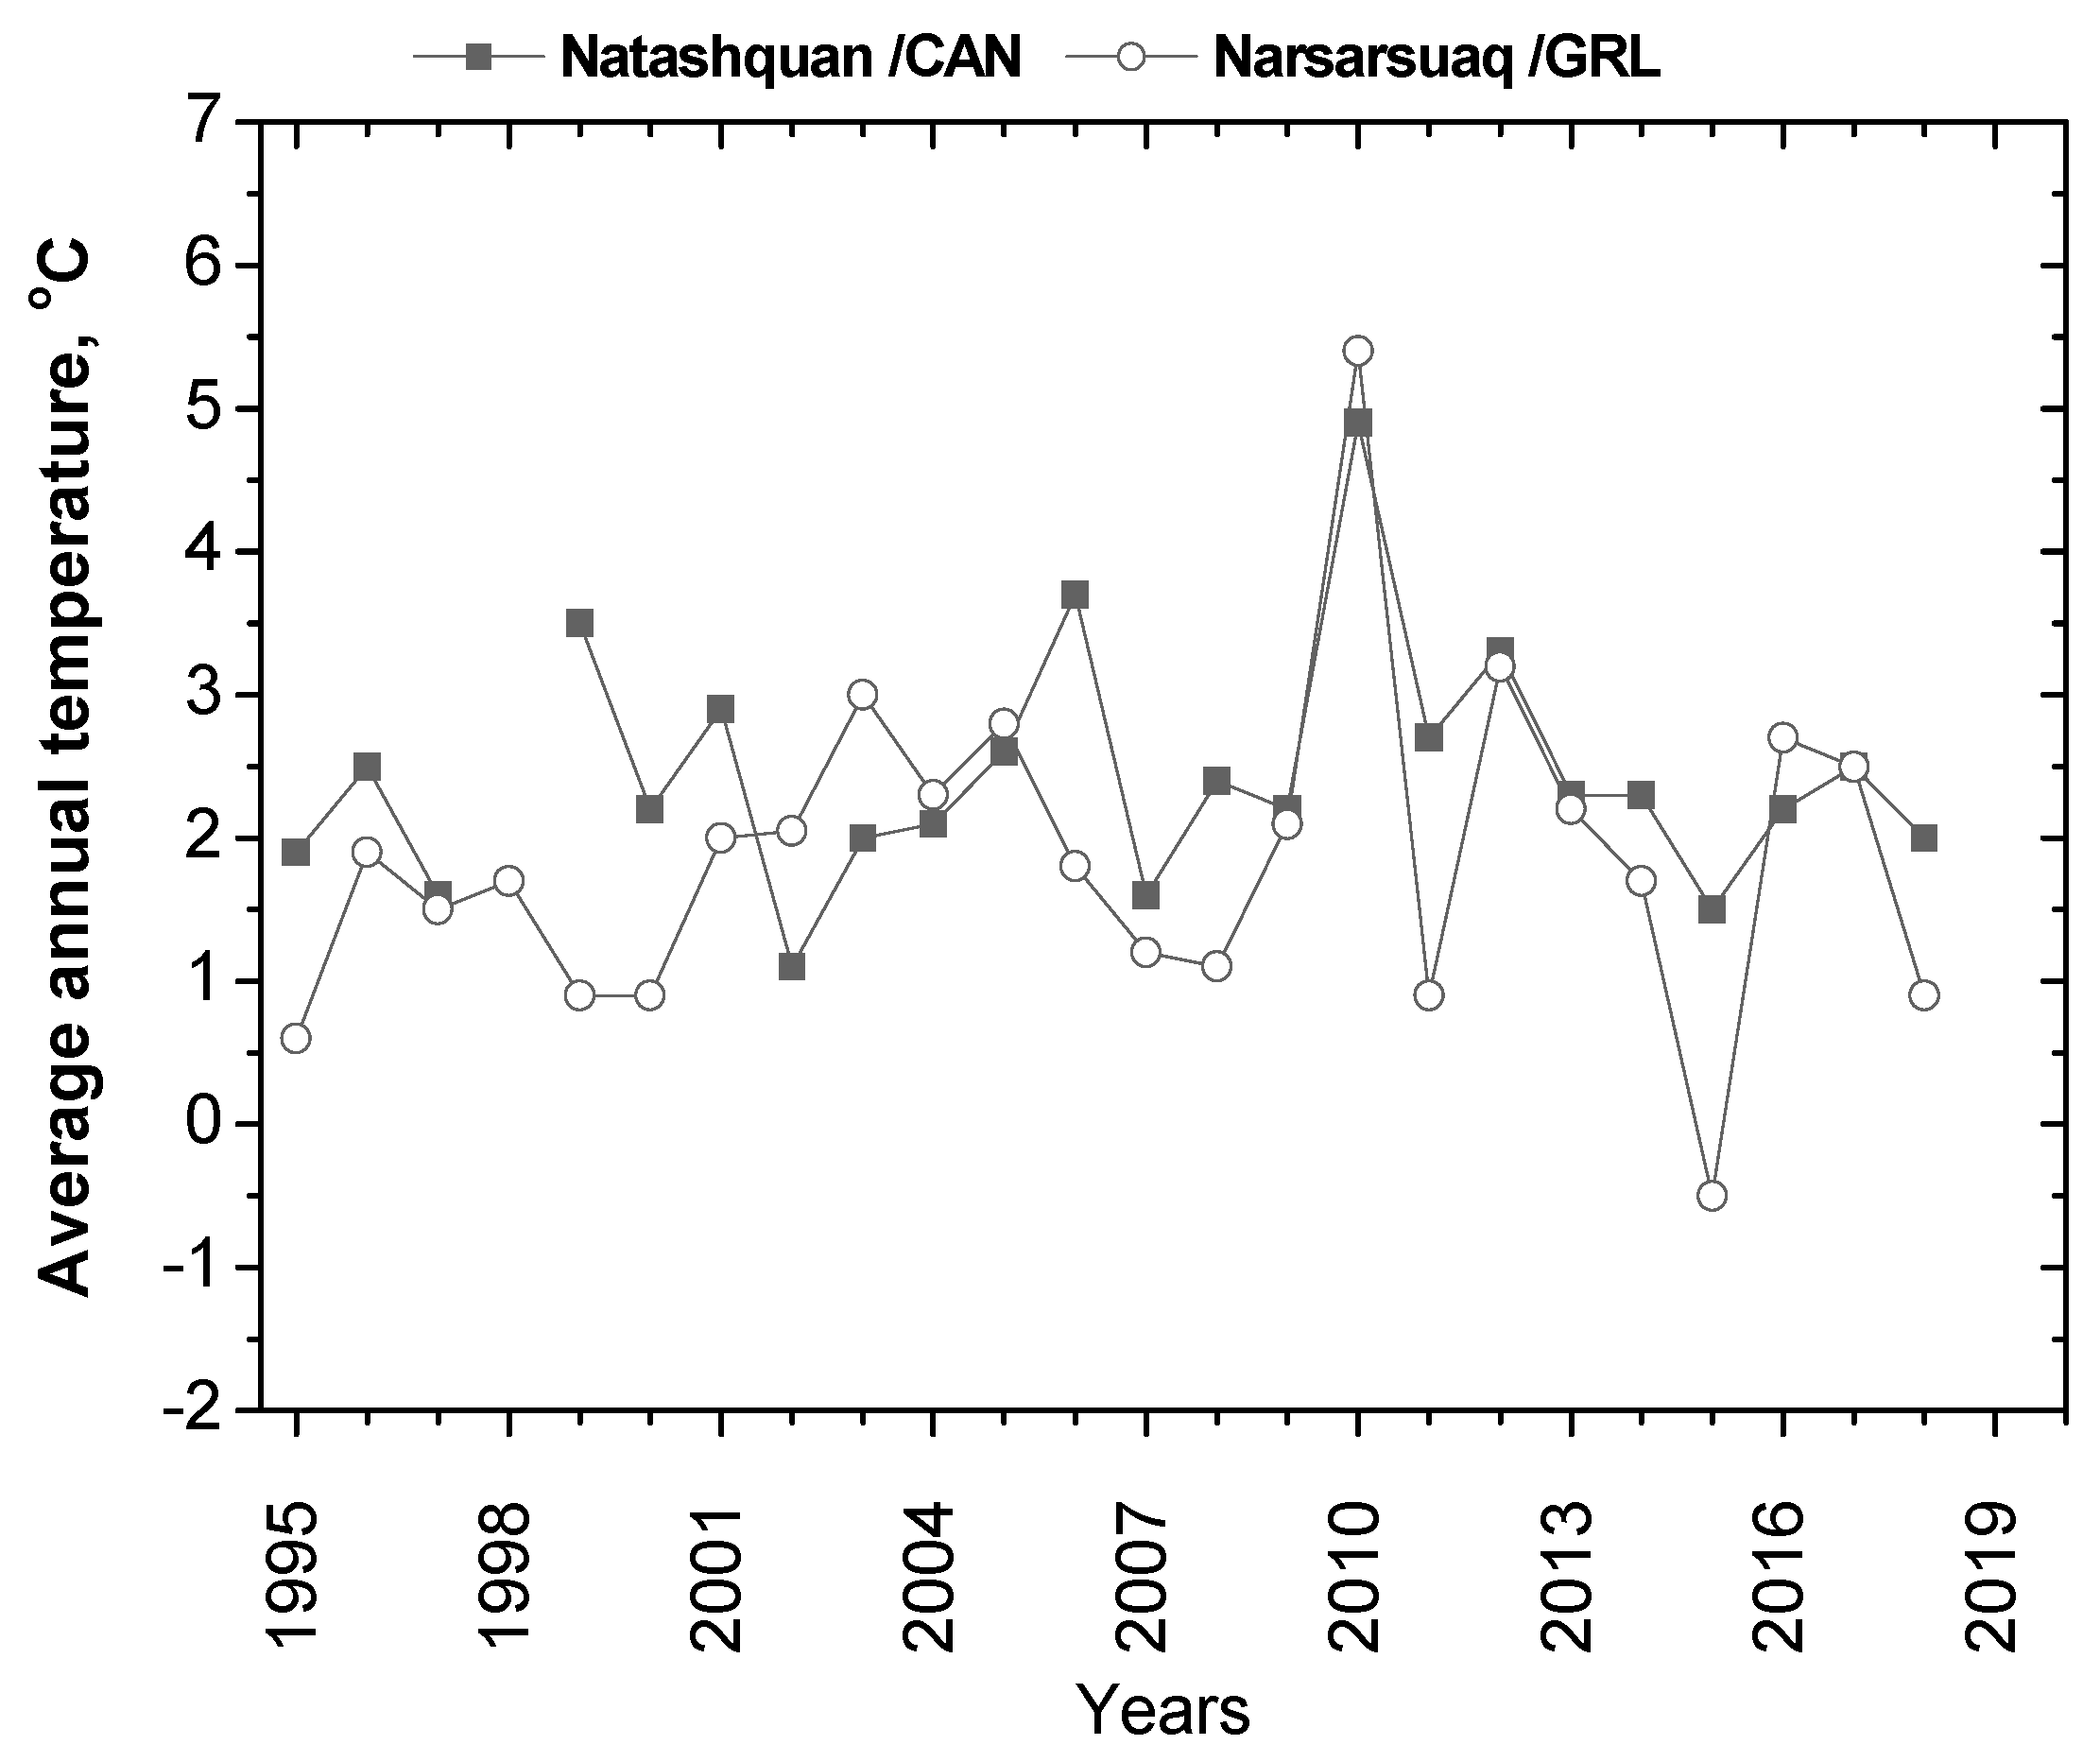
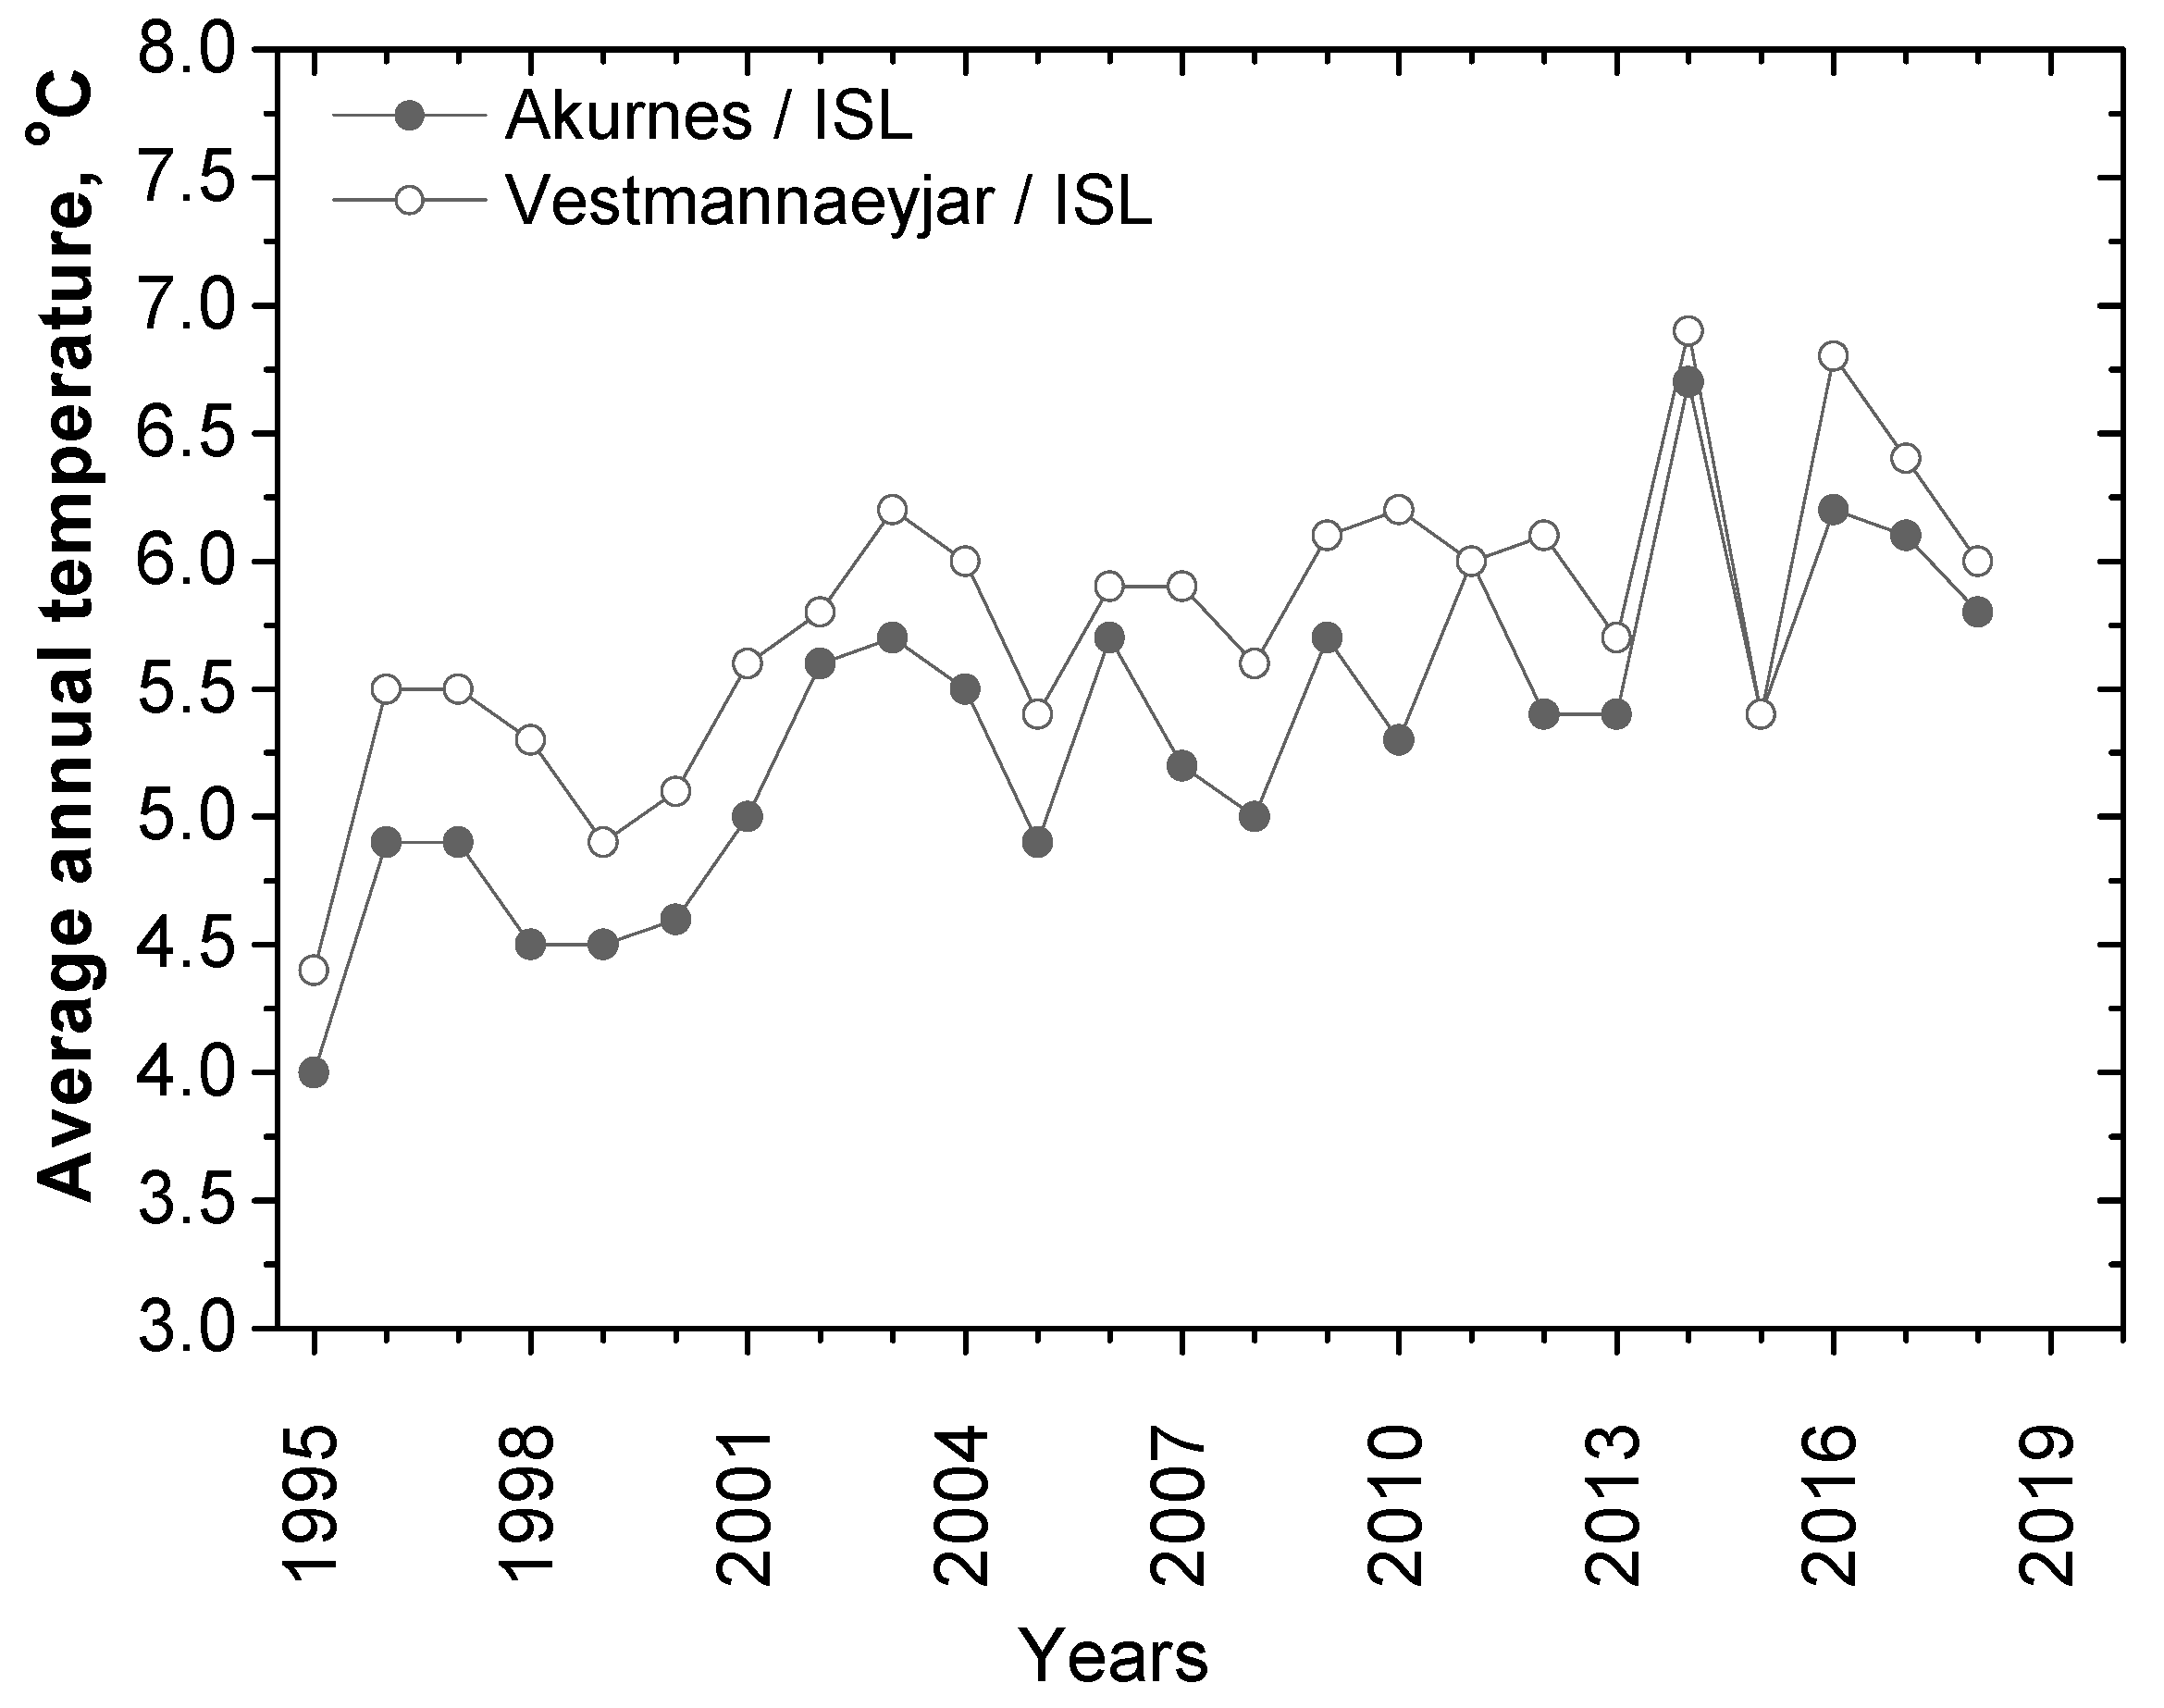
The course of average annual temperatures (AAT) [23] at selected stations from 1995 to 2018 is shown in Figure 6, Figure 7 and Figure 8.
Figure 7 shows the course of AATs at the following stations: Trondheim (Norway; N 63.46°, E 10.93°; 1 m above sea level), Pello (Finland; N 66.8°, E 24°; 84 m above sea level), Krangede (Sweden; N 63.15°, E 16.16°; 184 m above sea level), Stansted Airport (United Kingdom; N 51.88°, E 0.23°, 106 m above sea level), Abbeville (France; N 50.13°, E 1.83°; 74 m above sea level), Vilnius (Lithuania; N 54.63°, E 25.28°; 162 m above sea level). In Figure 8, data from the stations Natashquan (Canada; N 50.18°, E −61.81°; 7 m above sea level) and Narsarsuag (Greenland; N 61.13°, E −45.41°; 34 m above sea level) are shown.
While the phases of the AAT variations in Europe and Iceland coincide, they are opposite in Canada and Greenland. The lowest AAT values in 2010 were recorded at all stations shown in Figure 7. In contrast, the maximum values of these temperatures were recorded at stations in Canada and Greenland (Figure 8). Figure 9 shows the AAT data at the Icelandic stations Vestmannaeyjar (N 63.4°, E −20.28 °; 118 m above sea level) and Akurnes (N 64.3 °, E −15.18 °; 15 m above sea level).
A consistent upward trend in AAT from 1995 to 2018 is evident at stations in Iceland (Figure 9). The stations in Iceland are located in the transition zone between regions with different AAT phases, and this trend may indicate permanent warming of the North Atlantic. An elevated sum of mean monthly water temperatures near the Icelandic Depression in 2003 coincides well with the AAT rise at Icelandic stations (Figure 9). An increased mean annual temperature in 2003 was also recorded at Narsarsuag station in Greenland. However, at Canadian (Natashquan station) and European stations, there were no noticeable changes in the average annual temperature in 2003 (Figure 7 and Figure 8).
According to negative NAO indices in 2010, despite the increased surface water temperatures in the North Atlantic, climatic conditions in Europe were determined by the prevailing winds from the Northern Ocean. Positive NAO indices in April 2011 and autumn 2011 (prevailing westerly winds) with elevated surface water temperatures in the North Atlantic provided increased AAT in Europe (Figure 7) and their decrease in Canada and Greenland (Figure 8). The data in Figure 7 and Figure 8 also show that the climatic conditions of Northern Europe and Greenland are most sensitive to the NAO indices.
The differences in AATs at the Greenland station in 2010–2011 were almost 4.5 °C and 3 °C compared to the Trondheim station in Norway. At stations located at lower latitudes, this difference decreases. At Abbeville station (France), it is almost 1.5 °C, and at Vilnius (Lithuania), it is approximately 1 °C. This also means that processes in northern latitudes are a source of changes in atmospheric circulation at the abovementioned stations. Under the conditions of the prevalence of westerly winds, the zone of the thermohaline circulation in the Norwegian Stream could be displaced to the east, and later, the inflow of warm waters into the Northern Ocean could cause abundant melting of the oceanic ice cover over long distances from northern Europe along the coast of Siberia to Alaska and the Bering Strait [20,21].
The disappearance of the Arctic ice also caused a decline in polar bear populations because they could not hunt seals, their main source of food. Under the conditions of prevailing easterly winds (negative NAO indices), the desalinated water, due to the melting of the Northern Ocean’s ice cover, could also push the thermohaline circulation zone in the Norwegian Stream westward. These facts are known as specific auto-oscillations in the interaction between the Gulf Stream and the Northern Ocean: the more heat merges with the waters of the Gulf Stream into the Northern Ocean, the colder and freshened waters with debris ice flow in the opposite direction from the Northern Ocean to the northern part of the Gulf Stream, reducing the surface water temperature of the Golf Stream.
Lowering the water temperature of the Gulf Stream reduces the processes of the ice melting in the Northern Ocean and the outflow of ice and cold desalinated waters. Model calculations [39] showed that a decrease in sea ice cover in summer in the Arctic is accompanied by a decrease in the NAO indices and subsequent cold winters in Europe. Open water areas in the Arctic Ocean accumulate solar radiation in summer due to decreased sea ice cover. This leads to unstable meteorological conditions in autumn due to large heat fluxes into the atmosphere, which cause negative NAO indices following next winter.
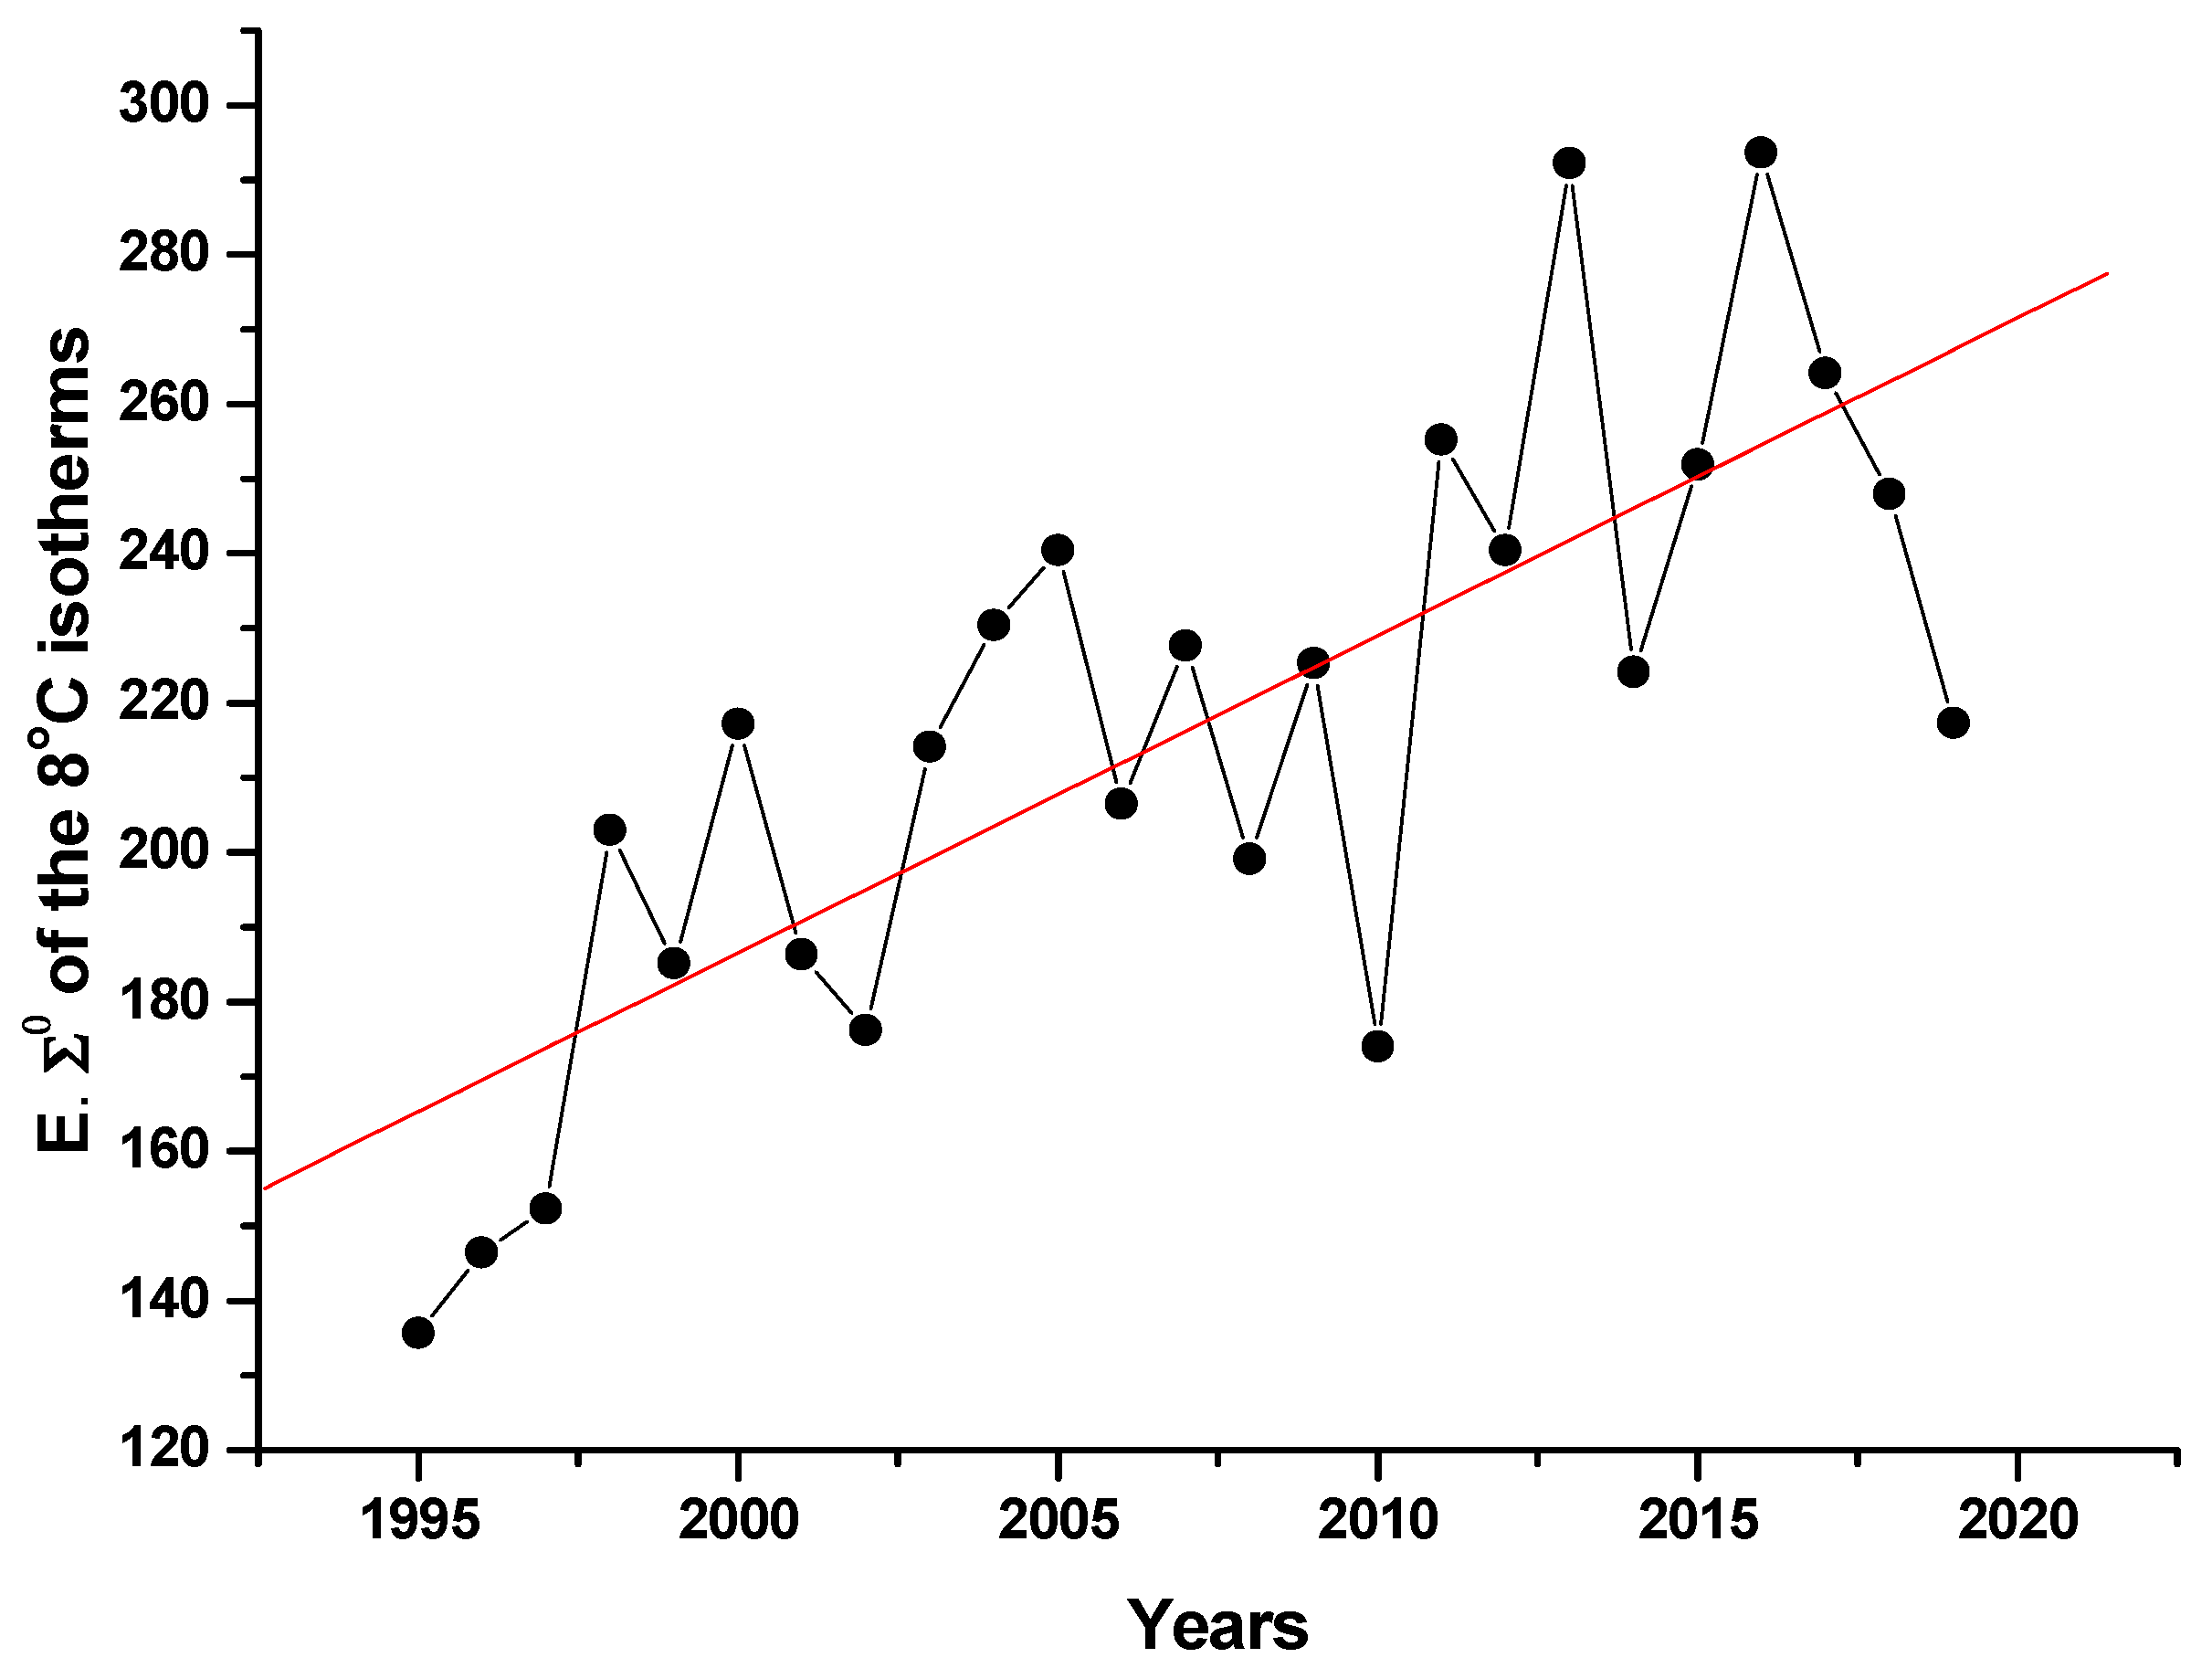
The data on NAO indices (Figure 5) show that from the summer of 2012, the absolute values of the negative indices until the summer of 2014 constantly decreased. This may indicate a weakening of the warming effect in the Northern Ocean. The course of the annual sums of the eastern mean monthly longitudes (E. Σ°) of the 8 °C isotherms in the period 1995–2019 is shown in Figure 10. A linear approximation of the course shows a monotonic spread of warm waters from the Atlantic Ocean to the east, apparently causing the presence of open water areas in winter: Σ° (−8342.96° + 4.265° per year), (R = 0.76, p < 0.0001). In 2010, this spread was minimal due to negative NAO indices and a short-term interval of westerly winds, respectively.
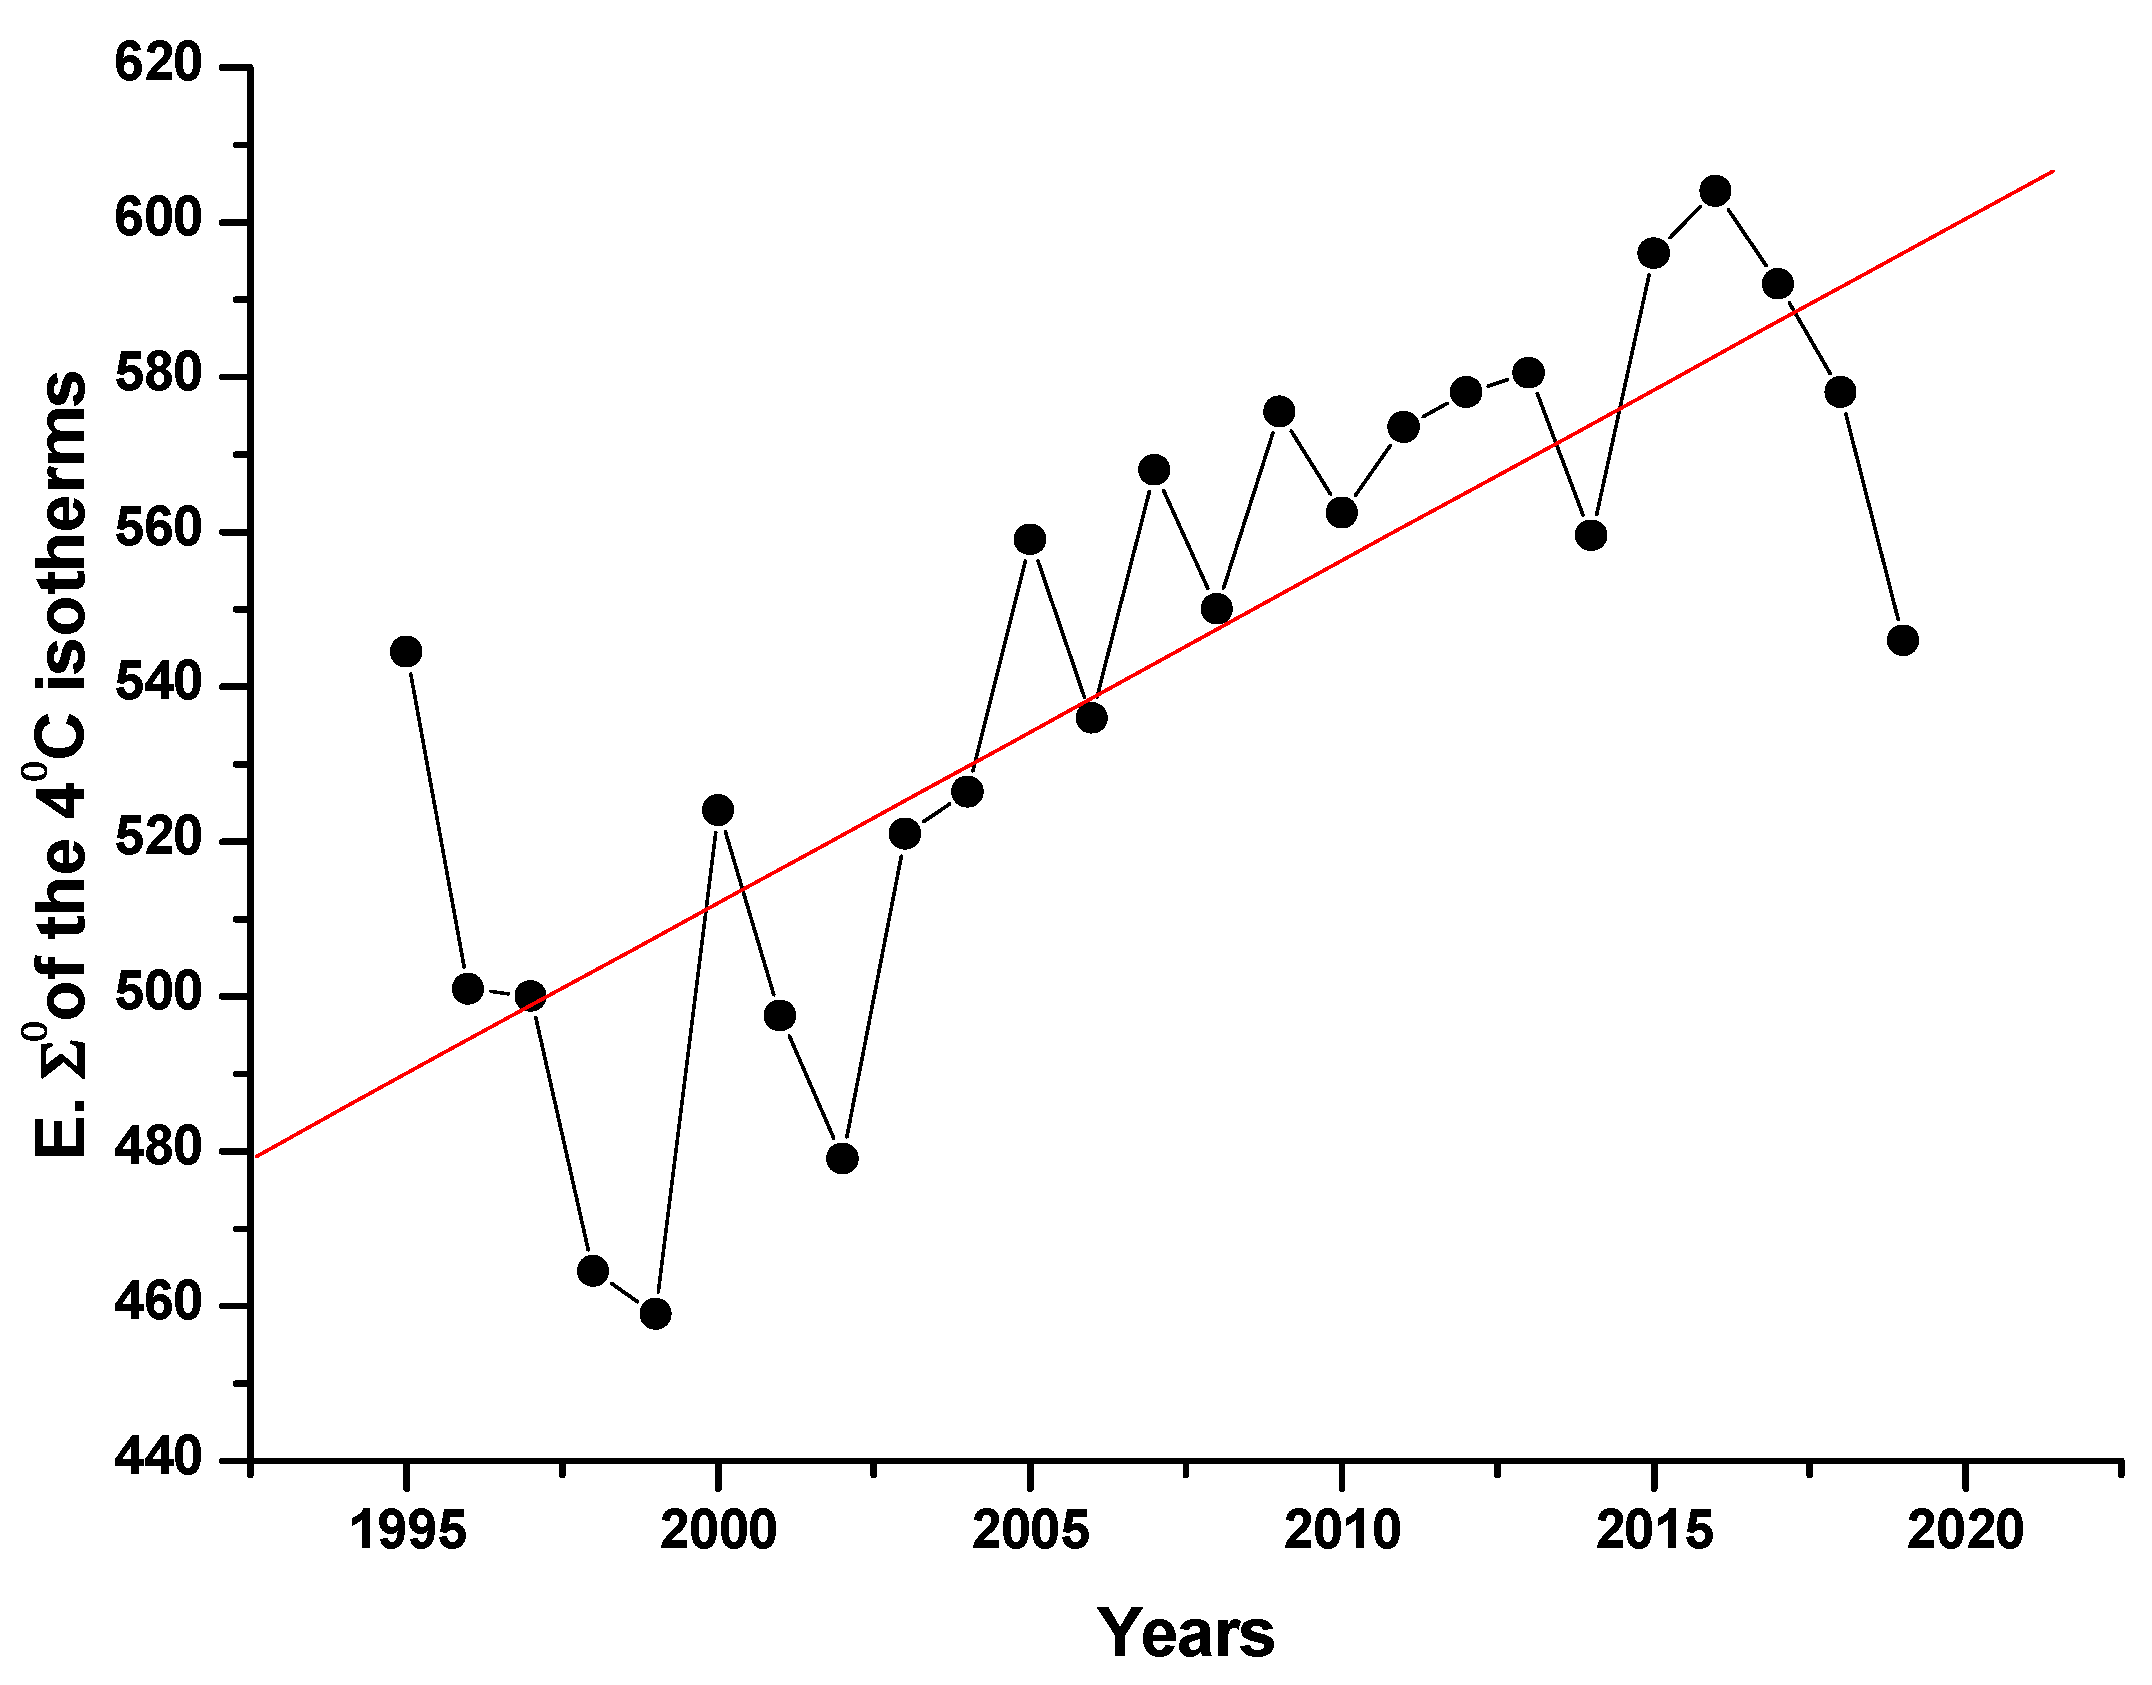
The same tendency of the annual sum of the eastern mean monthly longitudes (E. Σ°) of the 4 °C isotherms is shown in Figure 10 (Σ° (−8323.3° + 4.42° per year), R = 0.79, p < 0.0001). The spread of the 4 °C isotherms to the east is more intensive. Thus, the proportionality coefficient in the equation is higher (4.42) than in the case of the 8 °C isotherm (4.265).
The annual sums of the monthly mean eastern longitudes of 8 °C and 4 °C isotherms (Figure 10 and Figure 11) show how far the warming of the Northern Ocean waters is progressing. In 2010, as can be seen from Figure 10, the annual sum of the monthly mean eastern longitudes of the 8 °C isotherm significantly deviated to the west, down to 175° E. Apparently, this was caused by the abundant melting of the ice cover of the Northern Ocean due to the inflow of the Gulf Stream with its elevated surface water temperatures. Accordingly, the abundance of meltwater led to a certain decrease in the annual sum of the monthly mean eastern longitudes of the 4° isotherms (Figure 11). However, in subsequent years, further eastward movement of the 8° and 4° isotherms was observed in the open waters of the Northern Ocean (Figure 10 and Figure 11).
According to satellite data, elevated values (up to 1.8 °C) for Northern Ocean surface water temperatures along the coastal zone of Siberia were recorded in August and September 2010 and repeated in the summer months (July–September) of 2011, 2012, 2013, and 2014. In the summer of 2015, normal surface water temperatures (0 °C) resumed [20]. Apparently, the effect of surface water warming in the Northern Ocean was caused by increased surface water temperatures in the North Atlantic in 2010–2014. Due to the gradual decrease in and disappearance of the surface film in the North Atlantic, the warming of the Northern Ocean stopped until the beginning of 2015.
Corresponding AATs at European stations increased and peaked in 2014 and 2015 (Figure 7). This can be seen as a temporary warming of the climate. In contrast, in Canada and Greenland, the AAT declined from 2012 (Figure 8) to a minimum in 2015, when the ice sheet in the Northern Ocean began to renew.

4. Discussion

In recent years, zones of anomalously elevated surface water temperatures have occurred in the world’s oceans [40], although the causes of such phenomena are not well known. Zhu et al. [41], created a hybrid model for predicting the surface temperature of the Baltic Sea using ambient temperature data. Their simulation showed that the sea surface temperature follows, with some delay, changes in air mass temperature. However, this approach can only be acceptable for inland water bodies, since the temperature of air masses is itself a consequence of energy transfer processes in the ocean–atmosphere system.
The ocean is the main accumulator of solar radiation, and further redistribution of heat on the planet occurs via sea currents. Energy transfer to the atmosphere results from water vapor flows and the thermal conductivity of the air layer. However, the appearance of extreme ocean surface water temperatures may also be associated with an increase in the ability of to absorb solar radiation due to ocean pollution, causing rapid growth of phytoplankton and algae. This also contributes to the formation of a film of superficial active substances. This should also be taken into account by researchers.
Although there may be several causes, possible ones may be the influence of surface films formed by natural oil seeps in hydrocarbon-rich regions, spills from accidents on drilling platforms and tankers, oil spills from ships and drilling production water. Surface films reduce evaporation from the ocean surface. Other causes of increased solar radiation absorption by the ocean surface include particulate matter contamination of the ocean surface waters due to aerosol fallout, phytoplankton blooms [42], and increased microplastic pollution of seawater. In this case, thermohaline circulation should lead to the appearance of higher temperatures in the deep layers of the ocean’s exchange surface layer (~200 m). This is easy to determine using a vertical temperature profile. In general, this means an increase in thermal content in the ocean’s exchange layer, which also leads to increased ocean surface temperatures in high latitudes. Although these changes in the thermal content of the ocean exchange layer do not indicate specific variations in the NAO index, they may indicate their predominant role in the warming of the planet’s climate. A review [43] of modern models that estimate changes in the ocean surface temperatures and heat content in the exchange layer does not take into account the possibility of changes in the ocean surface layer’s capacity to absorb solar radiation due to ocean pollution. This information can be obtained in laboratory studies and long-term measurements of vertical temperature profiles in the ocean exchange layer by weather ships.
Since such temperature anomalies due to the surface film formation can be patchy, areas with enhanced evaporation (without a surface film), experience significant pressure changes in the ascending streams of water vapor. This involves significant masses of moist air rising, creative conditions favorable for hurricane formation. In the presence of a film of superficial active substances on the surface of the ocean and a decrease in the flow of water vapor, pressure changes in such ascending flows will be significantly lower than in the case of a clean ocean surface. This leads to the appearance of negative NAO indices in the North Atlantic.
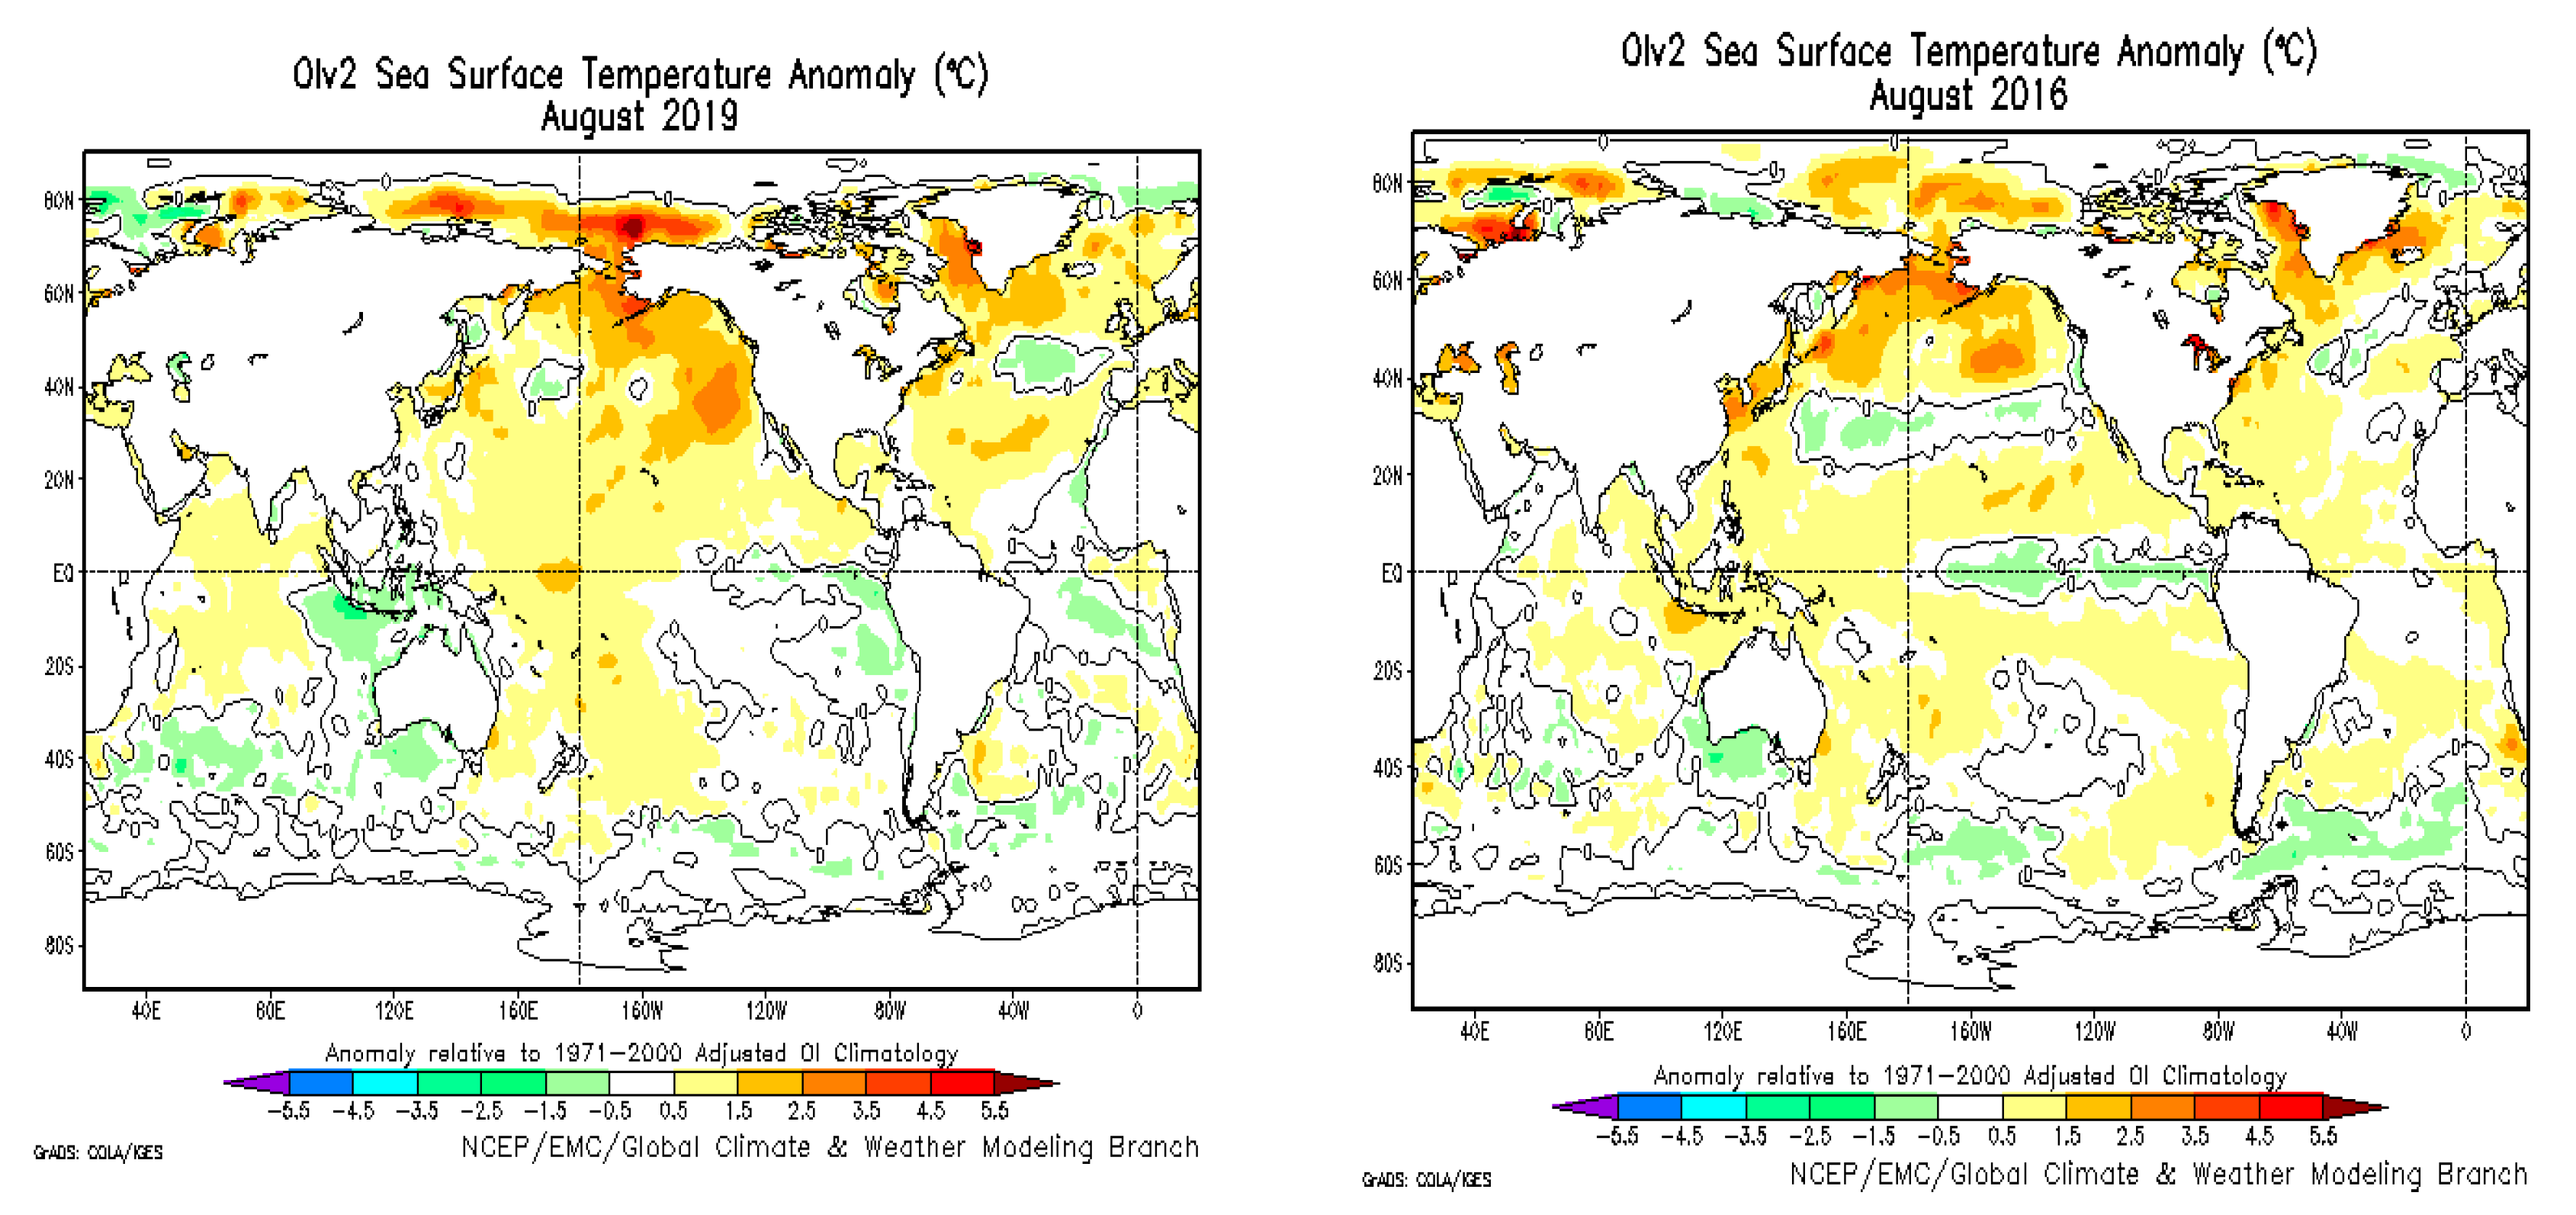
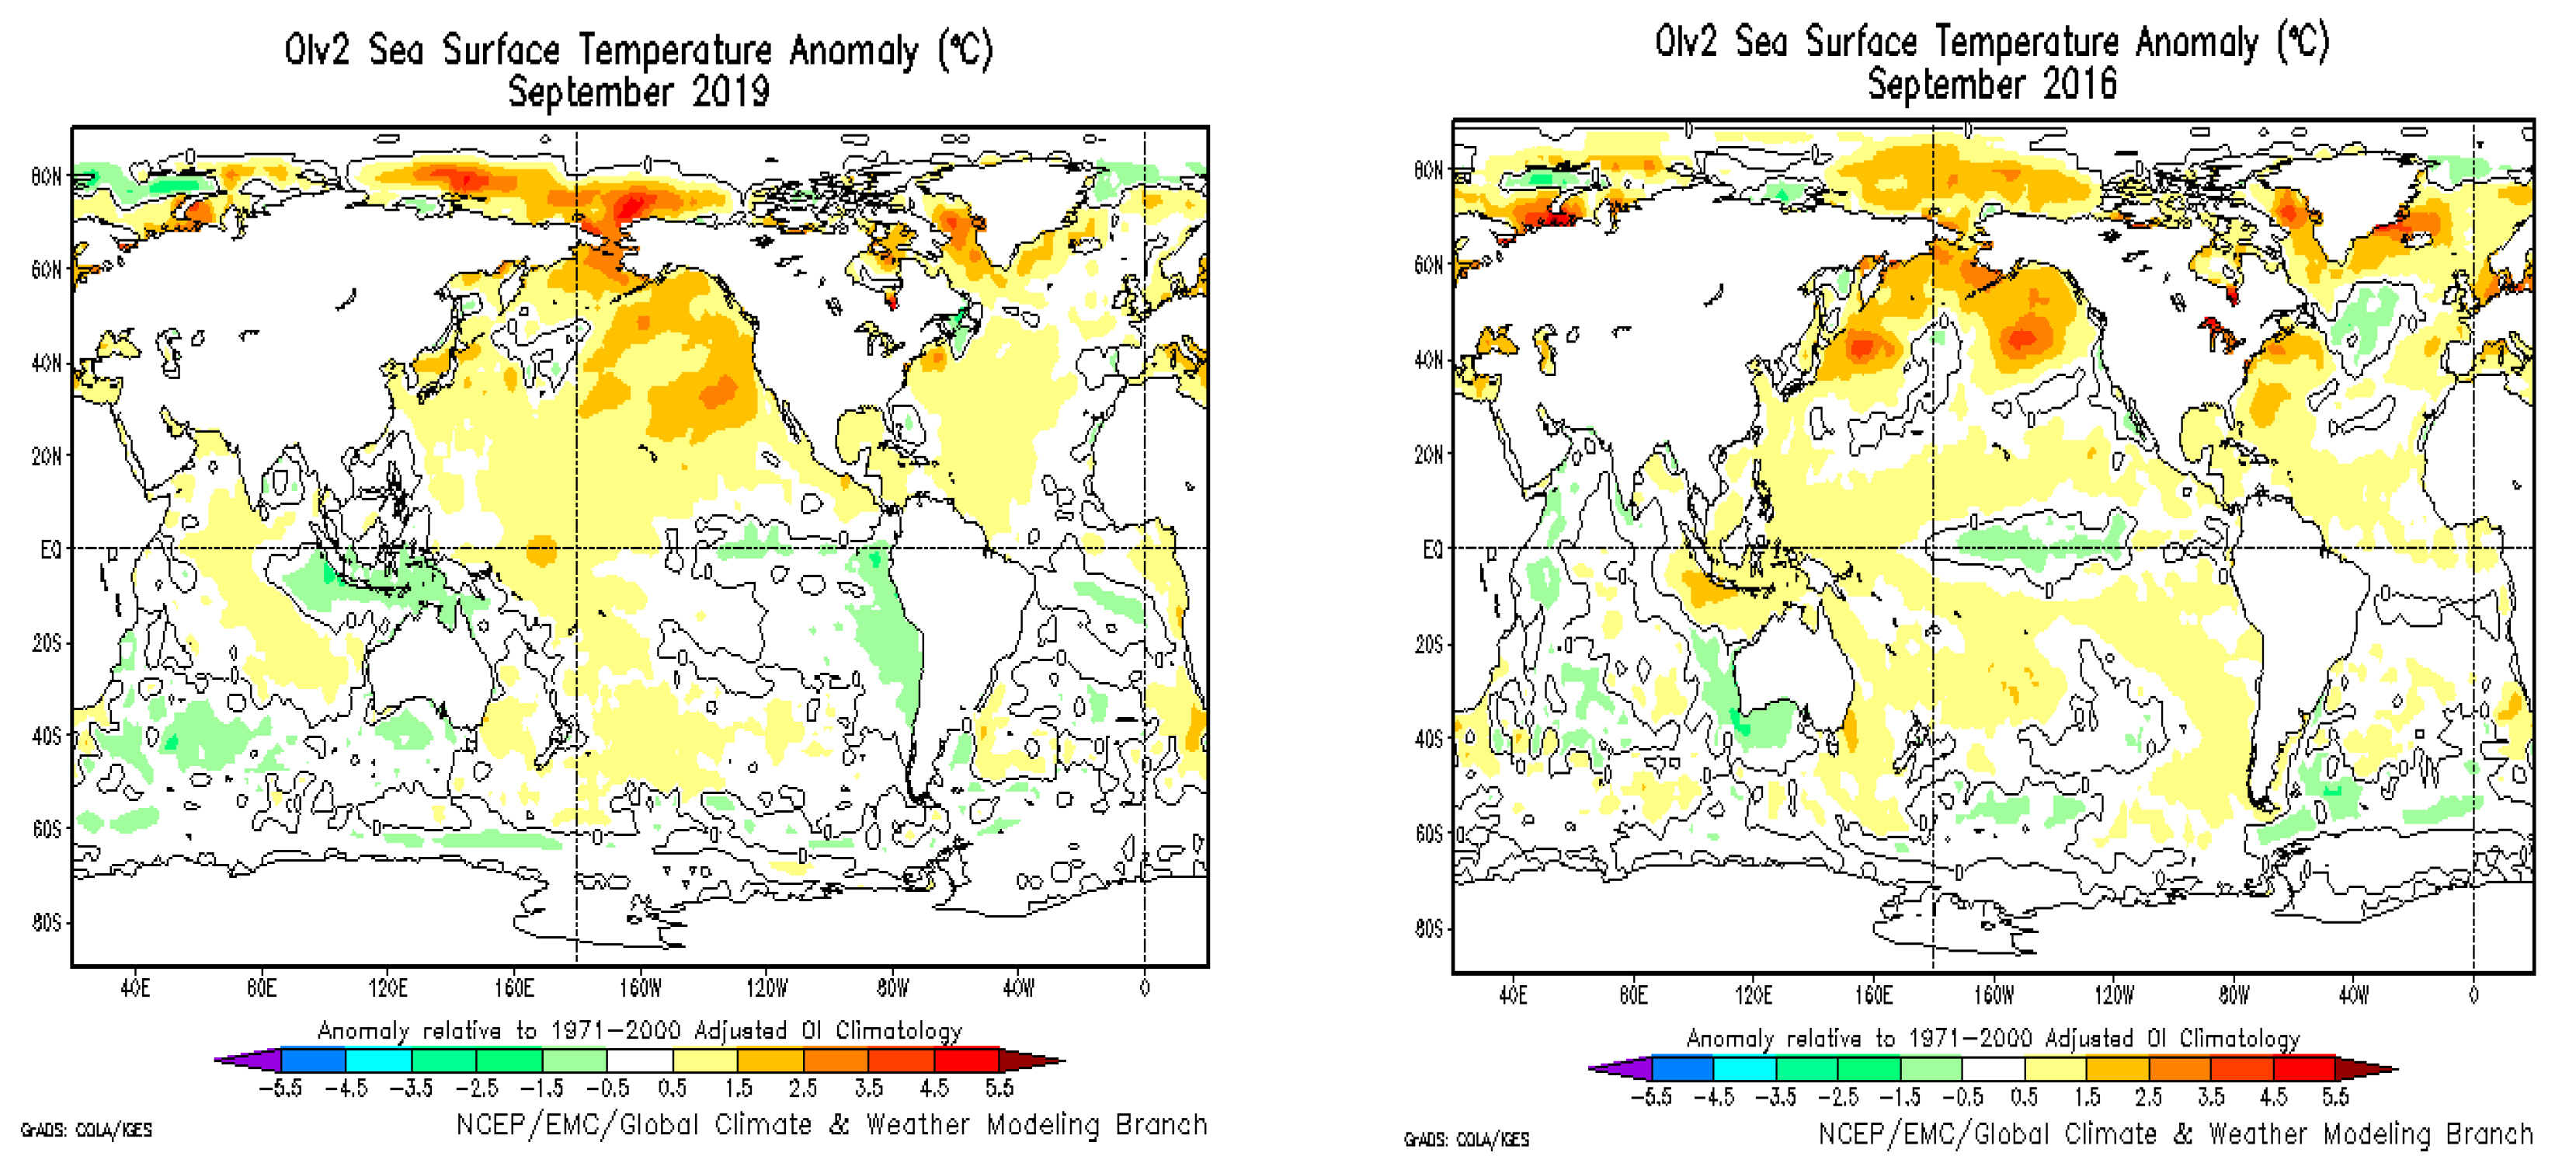
An analysis of the average monthly temperature anomalies of the ocean surface allows the identification of the appearance of zones with elevated surface temperatures, as occurred in the North Atlantic near the coast of Greenland in August and September of 2016 and 2019 (Appendix C) [28]. In connection with the warming of the climate, such zones appear in summer with an approximate periodicity corresponding to the auto-oscillatory process.
The abundant melting of glaciers in Greenland is accompanied by the exposure of rocks and their subsequent heating, as well as the heating of meltwater due to the absorption of solar radiation. The heating of rocks in Greenland in the summer, in turn, contributes to a further increase in glacier melting. This significantly increases the rate of climate warming and rising sea levels and leads to the desalination of the Atlantic Ocean surface waters.
The density of fresh water is much lower than that of salty ocean water, so there is a violation of the vertical mixing processes, and desalinated water can remain on the surface for a long time. The heating of this desalinated layer and the formation of an abnormally elevated temperature zone on the ocean surface gradually occur. Parts of these waters, carried by the Gulf Stream, are transferred to the banks of Scandinavia, and another part flows with the Labrador Current, thus arriving to the eastern coast of the United States.
Elevated surface water temperatures in the North Atlantic, in the absence of the surface films, lead to increased evaporation. This corresponds to the appearance of positive NAO indices. Similar zones of desalinated surface water with abnormally elevated temperatures can be observed in the Pacific Ocean, where these waters enter the Bering Strait from the Arctic Ocean as a result of the ice cover melting.
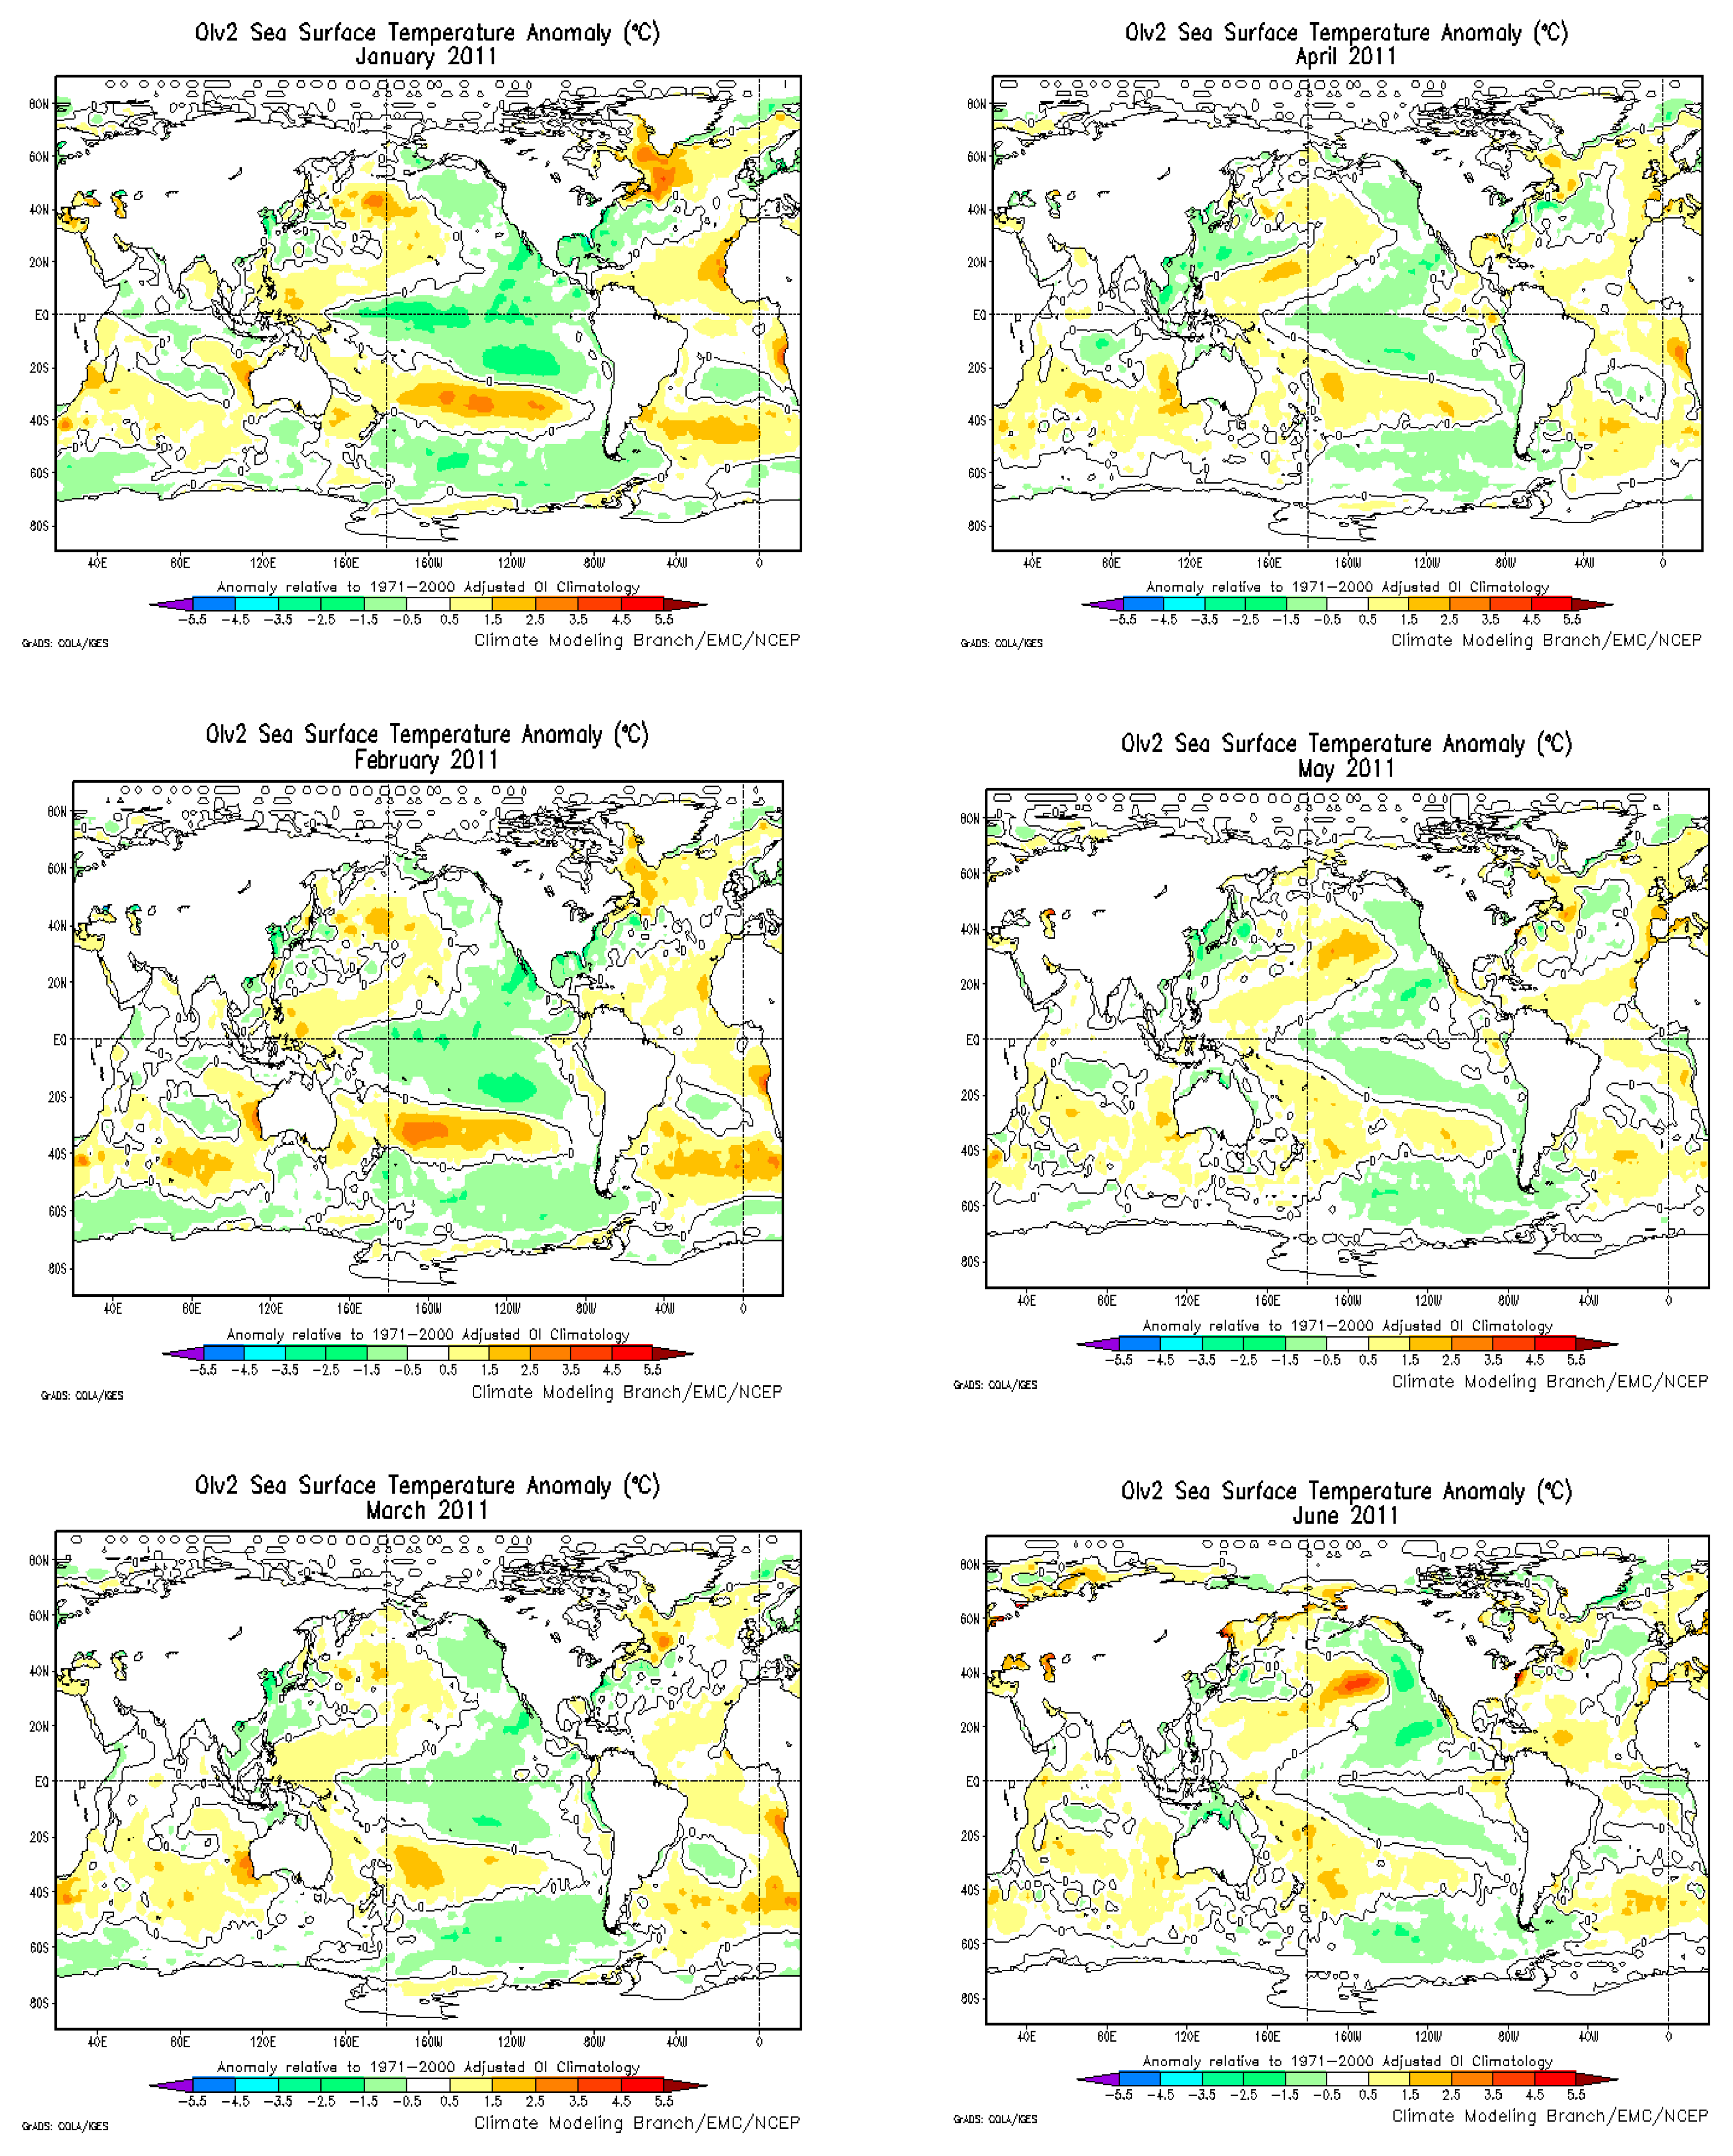
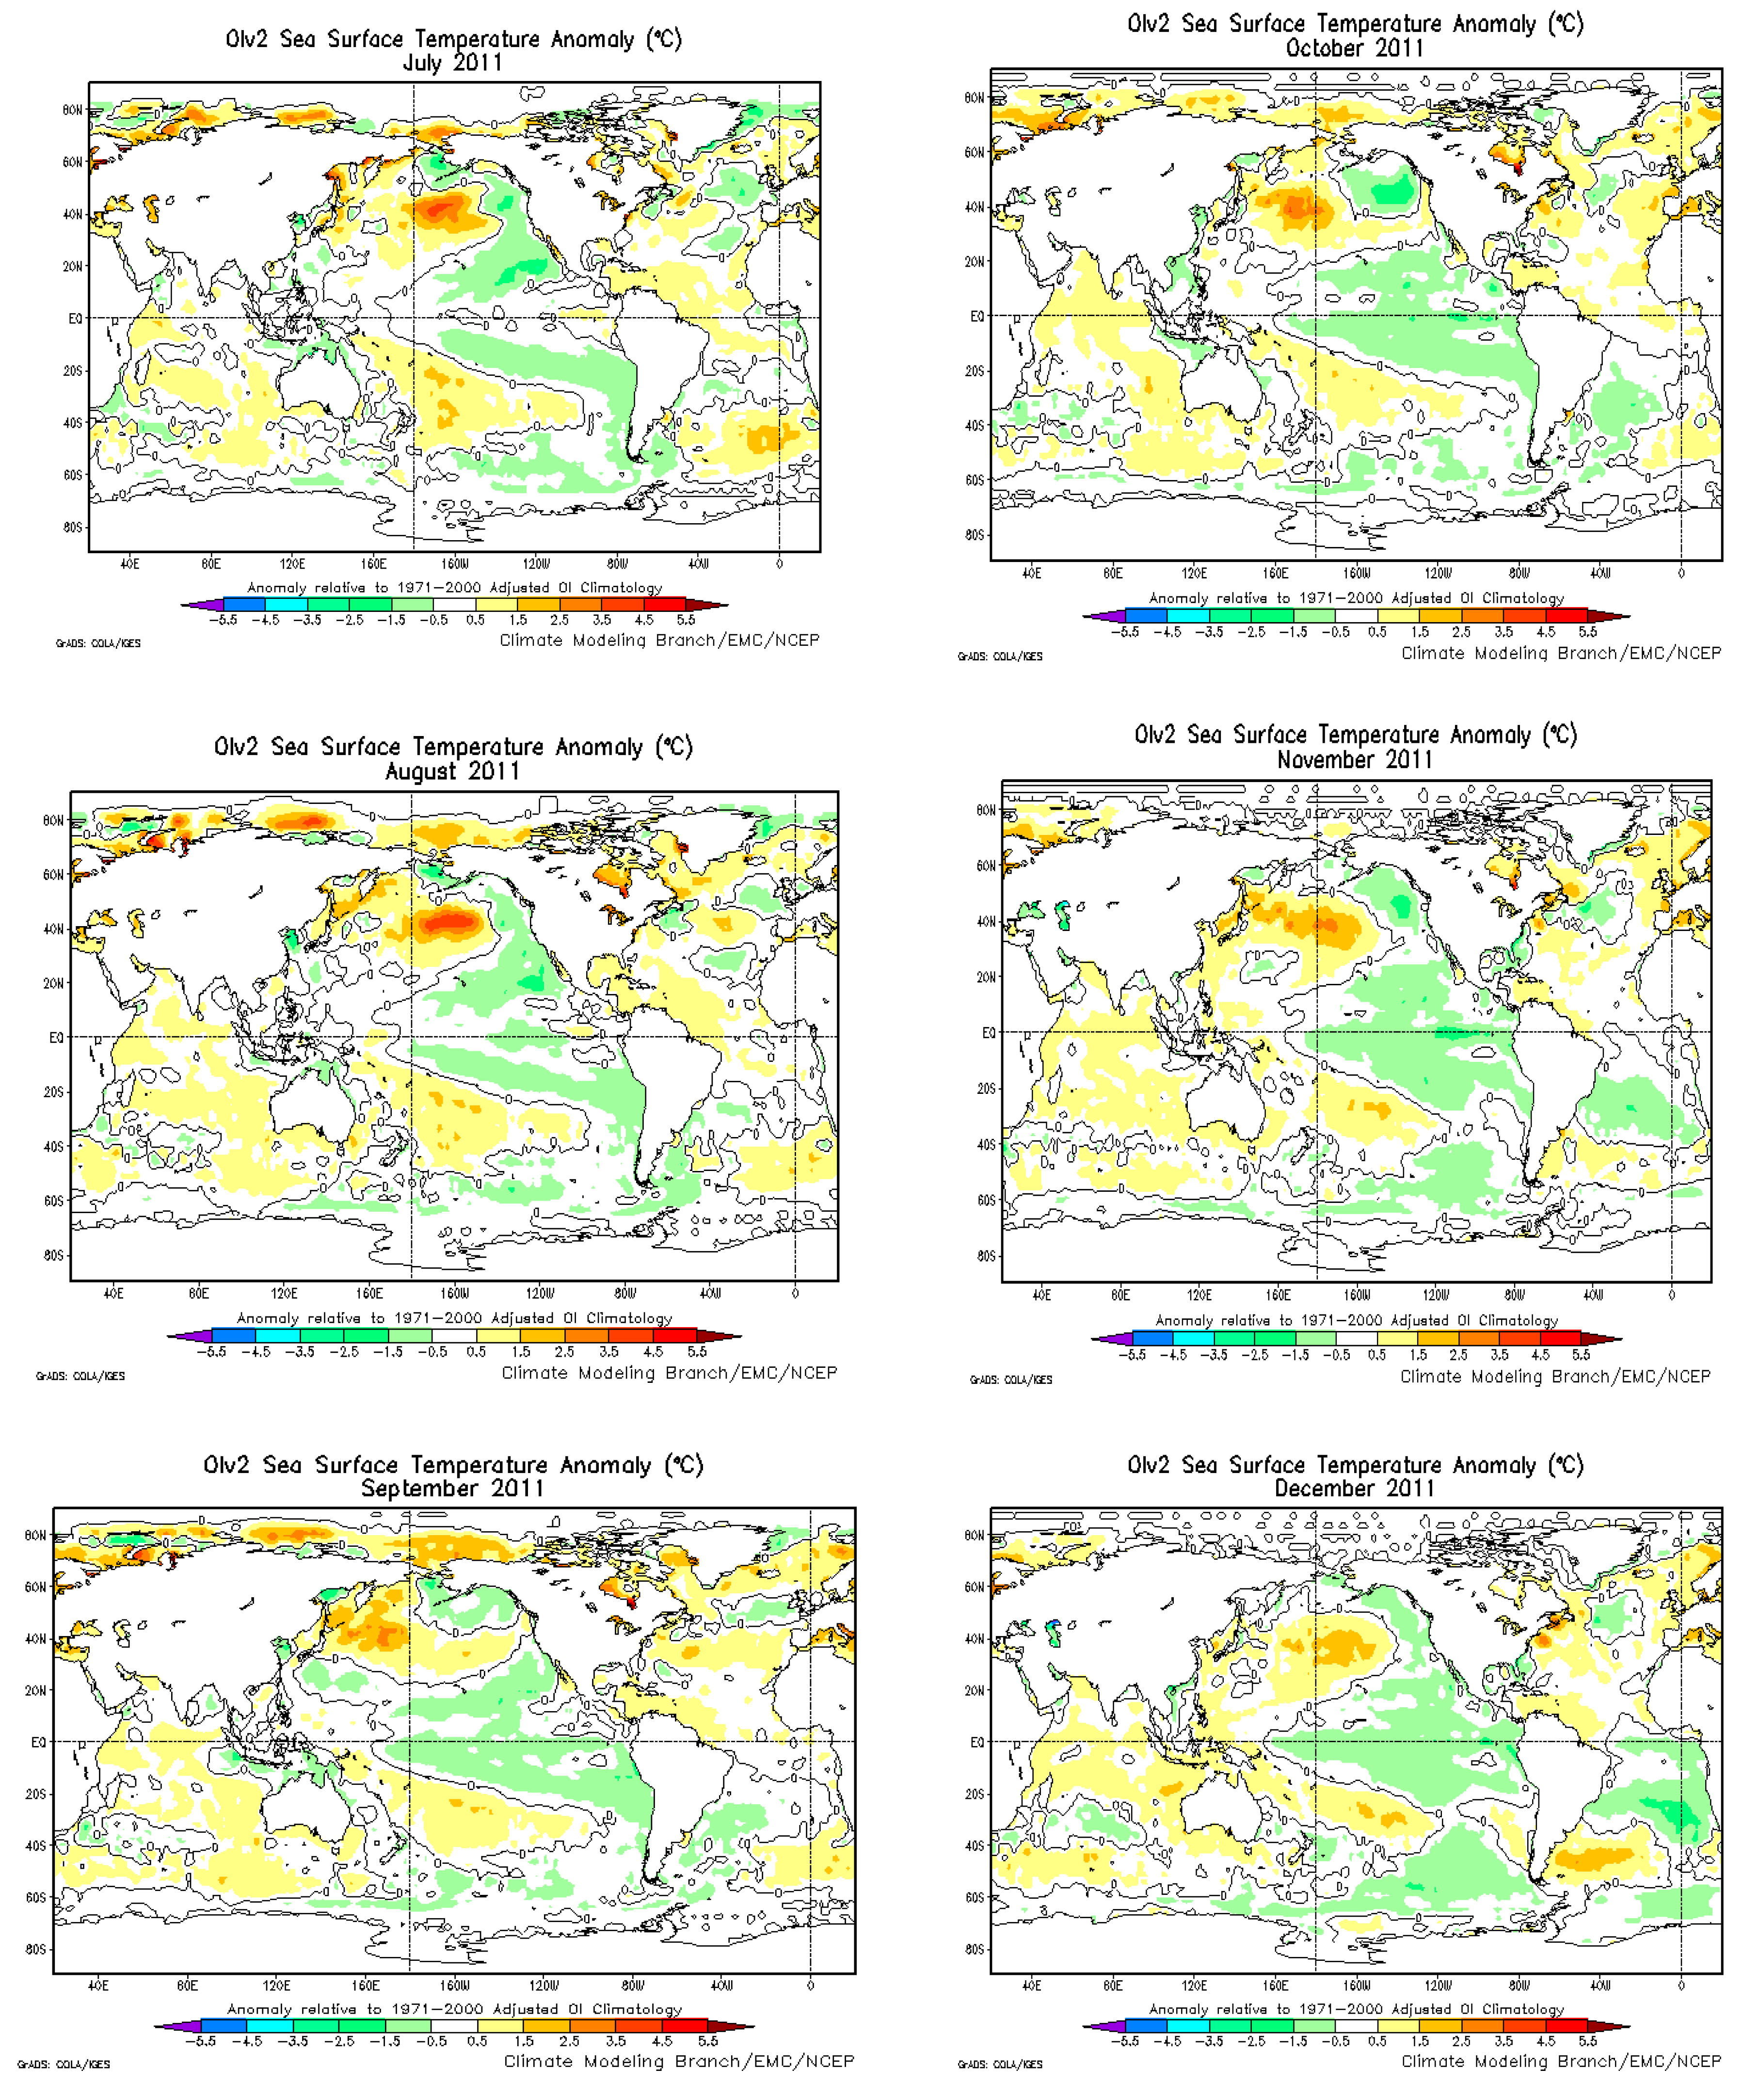
An analysis of the patterns of anomalies in the average monthly temperatures of the North Atlantic surface waters in 2010–2011 [28] (Appendix A) also shows the presence of a freshwater layer due to the melting of the Greenland glaciers. However, in the presence of elevated temperatures and a clean ocean surface, the freshwater layer should have contributed to an increase in evaporation and, as a consequence, the appearance of positive NAO indices in 2010–2011. Thus, the presence of negative NAO indices indicates that the surface of the desalinated water layer was also covered with a surface film that reduced evaporation. As can be seen from the data in Appendix A, the zone of abnormally high sea surface temperatures has shifted from Iceland to Greenland since January 2011. Throughout 2011, the average monthly sea surface temperatures near Reykjavik were lower than the corresponding temperatures in 2010. This led to a reduced value of the sum of average monthly temperatures in 2011 (Table 1). A similar decrease in temperatures occurred 2 years later in 2013. This is probably a result of the well-known auto-oscillating process between the Gulf Stream and the Northern Ocean, whereby fresh water from the melting ice cover in the Northern Ocean penetrates the northern part of the Gulf Stream, reducing the surface temperature of the Gulf Stream. The contribution of ocean pollution to global warming requires further research.

5. Conclusions

After a major oil spill in the Gulf of Mexico in April 2010, elevated mean monthly sea surface temperatures in the Icelandic Depression were recorded in 2010, 2012, and 2014. Despite these elevated temperatures, the NAO indices were negative, indicating a weakening of the exchange processes between the ocean and the atmosphere due to a decrease in vapor fluxes from the ocean surface, despite an increase in the heat content of the Gulf Stream exchange layer. Such a decrease in evaporation, in this case, could have occurred if a surface film of oil origin was transported here by the Gulf Stream from the Gulf of Mexico. Negative NAO indices indicated cooling in Europe and warming in Canada. In 2011, 2013, and 2015, mean monthly sea surface temperatures in the Icelandic Depression decreased. This biennial periodicity was the result of auto-oscillating interactions between the warm waters of the Gulf Stream and the Northern Ocean when fresh water, due to the melting of its ice cover, penetrated into the Icelandic Depression. This layer of fresh water isolated the surface of the Gulf Stream from contact with the atmosphere and disrupted thermohaline mixing in its exchange layer. This allowed the Gulf Stream waters with a higher heat content to enter the Northern Ocean. Thus, warming was observed in the Northern Ocean in 2011, 2013 and 2015. Warming was also observed in Europe, as indicated by the positive values of the NAO indices. Thus, during the period 2010–2015, after the Gulf of Mexico oil spill, there was an increased thermal impact on the Northern Ocean. The abundance of oil-producing platforms on the ocean shelf using production water and polluting the ocean with oil products necessitates studying the impact of this pollution on the planet’s climate. It also demands studying the impact of pollution on the heat content of the ocean’s exchange layer and its ability to absorb solar radiation. Furthermore, it is necessary to study the composition and origin of the surface films and sea foam, as well as the area and thickness of freshwater layers that arise on the ocean surface during the melting of glaciers and Northern Ocean ice cover. The impact of oil spillages on the climate necessitates restrictions on offshore oil production, oil transportation by tankers, jet fuel dumping, and the use of seawater in drilling (production water) operations, as well as its discharge into the sea. Greater care must be taken to avoid spillage, and more timely measures must be implemented to improve cleanup efforts. A permanent, open program for monitoring and researching the surfaces of Earth’s oceans must be established.

Author Contributions

N.P., N.T. and A.V. (Arunas Valiulis) contributed to the study’s conception and design. N.P. and N.T. performed data analyses. The manuscript was written by N.P. and N.T., with considerable contributions from A.V. (Arunas Valiulis), U.F. and D.E.S. A.V. (Algirdas Valiulis), M.K. and T.Z. reviewed and corrected the manuscript. All authors have read and agreed to the published version of the manuscript.

Funding

This research received no external funding.

Institutional Review Board Statement

Not applicable.

Informed Consent Statement

Not applicable.

Data Availability Statement

The original contributions presented in the study are included in the article/Appendix A, Appendix B and Appendix C, further inquiries can be directed to the corresponding author.

Conflicts of Interest

The authors declare no conflicts of interest.

Appendix A

Figure A1. Additional information on the North Atlantic surface temperature anomalies (°C) for July 2010–December 2011 [28].
Atmosphere 15 01216 g0a1aAtmosphere 15 01216 g0a1bAtmosphere 15 01216 g0a1c

Appendix B

Figure A2. Additional information on the North Atlantic surface temperature anomaly in June 2003–September 2003 due to North Sea pollution [28].
Atmosphere 15 01216 g0a2

Appendix C

Figure A3. Additional information on the North Atlantic surface temperature anomalies due to the freshwater inflows from Greenland ice melting [28].
Atmosphere 15 01216 g0a3aAtmosphere 15 01216 g0a3b

References

  1. World Health Organization. Climate Change. Available online: https://www.who.int/health-topics/climate-change#tab=tab_1 (accessed on 18 March 2023).
  2. Valiulis, A.; Bousquet, J.; Veryga, A.; Suprun, U.; Sergeenko, D.; Cebotari, S.; Borelli, D.; Pietikainen, S.; Banys, J.; Agache, I.; et al. Vilnius declaration on chronic respiratory diseases: Multisectoral care pathways embedding guided self-management, mHealth and air pollution in chronic respiratory diseases. Clin. Transl. Allergy 2019, 9, 7. [Google Scholar] [CrossRef] [PubMed]
  3. Cohen, J.; Screen, J.A.; Furtado, J.C.; Barlow, M.; Whittleston, D.; Coumou, D.; Francis, J.; Dethloff, K.; Entekhabi, D.; Overland, J.; et al. Recent Arctic amplification and extreme mid-latitude weather. Nat. Geosci. 2014, 7, 627–637. [Google Scholar] [CrossRef]
  4. Gobler, C.J. Climate Change and Harmful Algal Blooms: Insights and Perspective. Harmful Algae 2020, 91, 101731. [Google Scholar] [CrossRef] [PubMed]
  5. Al Fartoosi, F.M. The Impact of Maritime Oil Pollution in the Marine Environment: Case Study of Maritime Oil Pollution in the Navigational Channel of Shatt Al-Arab. Master’s Thesis, World Maritime University, Malmö, Sweden, 2013; p. 318. Available online: https://commons.wmu.se/cgi/viewcontent.cgi?params=/context/all_dissertations/article/1317/&path_info=MSEA_2013_AL_FARTOOSI.pdf (accessed on 4 October 2024).
  6. Tarasiuk, N.; Stelingis, K.; Gudelis, A. The water bodies surface self-cleaning mechanisms after the Chernobyl accident. Atmos. Phys. 1989, 14, 67–79. (In Russian) [Google Scholar]
  7. King, H.M. World’s Largest Oil Spills Map. Available online: https://geology.com/articles/largest-oil-spills-map (accessed on 3 September 2024).
  8. Aeppli, C.; Reddy, C.M.; Nelson, R.K.; Kellermann, M.Y.; Valentine, D.L. Recurrent oil sheens at the deepwater horizon disaster site fingerprinted with synthetic hydrocarbon drilling fluids. Environ. Sci. Technol. 2013, 47, 8211–8219. [Google Scholar] [CrossRef]
  9. Aljazeera. BP Settles While Macondo “Seeps”. 2012. Available online: https://www.aljazeera.com/features/2012/3/4/bp-settles-while-macondo-seeps (accessed on 9 February 2023).
  10. Zodiatis, G.; Lardner, R.; Alves, T.M.; Krestenitis, Y.; Perivoliotis, L.; Sofianos, S.; Spanoudaki, K. Oil spill forecasting (prediction). J. Mar. Res. 2017, 75, 923–953. [Google Scholar] [CrossRef]
  11. Ash, P.A.; Bain, C.D.; Matsubara, H. Wetting in oil/water/surfactant systems. Curr. Opin. Colloid Interface Sci. 2012, 17, 196–204. [Google Scholar] [CrossRef]
  12. Schilling, K.; Zessner, M. Foam in the aquatic environment. Water Res. 2011, 45, 4355–4366. [Google Scholar] [CrossRef]
  13. BBC News. Sea Foam Swamps Cars at Seaside Resort of Cleveleys. 2011. Available online: https://www.bbc.com/news/av/uk-england-lancashire-16354575 (accessed on 12 November 2022).
  14. BBC News. Foam Swept in as Gales Hit Scotland. 2012. Available online: https://www.bbc.com/news/uk-scotland-north-east-orkney-shetland-19716141 (accessed on 12 November 2022).
  15. BBC News. Sea Foam Chaos in Coastal Town. 2015. Available online: https://www.bbc.com/news/av/uk-34813623 (accessed on 12 November 2022).
  16. Davuliene, L.; Jasineviciene, D.; Garbariene, I.; Andriejauskiene, J.; Ulevicius, V.; Bycenkiene, S. Long-term air pollution trend analysis in the South-eastern Baltic region, 1981–2017. Atmos. Res. 2021, 247, 105191. [Google Scholar] [CrossRef]
  17. Ferrero, L.; Sangiorgi, G.; Perrone, M.G.; Rizzi, C.; Cataldi, M.; Markuszewski, P.; Pakszys, P.; Makuch, P.; Petelski, T.; Becagli, S.; et al. Chemical composition of aerosol over the Arctic Ocean from summer arctic expedition (AREX) 2011–2012 Cruises: Ions, amines, elemental carbon, organic matter, polycyclic aromatic hydrocarbons, n-alkanes, metals, and rare earth elements. Atmosphere 2019, 10, 54. [Google Scholar] [CrossRef]
  18. North Atlantic Oscillation (NAO). NAO Index Calculation. Available online: http://la.climatologie.free.fr/nao/NAO-english.htm#nao (accessed on 1 October 2024).
  19. Rogers, J.C. The association between the North Atlantic Oscillation and the Southern Oscillation in the Northern Hemisphere. Mon. Weather. Rev. 1984, 112, 1999–2015. [Google Scholar] [CrossRef]
  20. National Oceanic and Atmospheric Administration (NOAA). Monthly Global Sea Surface Temperature Plot Archive. (These Data Were Discontinued in 2020. The Original Data Can Be Provided on Request). Available online: https://www.emc.ncep.noaa.gov (accessed on 10 January 2020).
  21. Monthly Sea Surface Temperature (NOAA Optimum Interpolation SST (OISST) Version 2.1). Available online: https://iridl.ldeo.columbia.edu/maproom/Global/Ocean_Temp/Monthly_Temp.html?T=Jun%202009#tabs-2 (accessed on 1 October 2024).
  22. National Oceanic and Atmospheric Administration (NOAA). North Atlantic Oscillation (NAO). Available online: https://origin.cpc.ncep.noaa.gov/products/precip/CWlink/pna/nao.shtml (accessed on 26 December 2022).
  23. TuTiempo. Climate Data. Available online: https://en.tutiempo.net/ (accessed on 16 December 2022).
  24. What Is the Gulf Stream? Available online: https://scijinks.gov/gulf-stream/ (accessed on 1 October 2024).
  25. Wang, W.; Anderson, B.T.; Kaufmann, R.K.; Myneni, R.B. The relation between the North Atlantic oscillation and SSTs in the North Atlantic Basin. J. Clim. 2004, 17, 4752–4759. [Google Scholar] [CrossRef]
  26. Lindsey, R.; Dahlman, L. Climate Variability: North Atlantic Oscillation. National Oceanic and Atmospheric Administration (NOAA), 2009. Available online: https://www.climate.gov/news-features/understanding-climate/climate-variability-north-atlantic-oscillation (accessed on 7 March 2023).
  27. Stommel, H. The Gulf Stream: A Physical and Dynamical Description; Cambridge University Press: London, UK, 1965; p. 248. [Google Scholar]
  28. National Oceanic and Atmospheric Administration (NOAA). Sea Surface Temperature Anomaly. (These Data Were Discontinued in 2020. The Original Data Can Be Provided on Request). Available online: https://www.emc.ncep.noaa.gov (accessed on 10 January 2020).
  29. International Tanker Owners Pollution Federation (ITOPF). Oil Tanker Spill Statistics 2002. Available online: https://www.itopf.org/in-action/case-studies/prestige-spain-france-2002/ (accessed on 7 November 2022).
  30. Carpenter, A. Oil pollution in the North Sea: The impact of governance measures on oil pollution over several decades. Hydrobiologia 2019, 845, 109–127. [Google Scholar] [CrossRef]
  31. Nesterov, E.S. East Atlantic oscillation of the atmospheric circulation. Russ. Meteorol. Hydrol. 2009, 34, 794–800. [Google Scholar] [CrossRef]
  32. Mikhailova, N.V.; Yurovsky, A.V. The East Atlantic Oscillation: Mechanism and Impact on the European Climate in Winter. Phys. Oceanogr. 2016, 4, 27–36. [Google Scholar] [CrossRef]
  33. Bauer, J. Climate Change Is Weakening the Ocean’s Currents. Here’s Why That Matters. 2019. Thompson Earth Systems Institute. Available online: https://www.floridamuseum.ufl.edu/earth-systems/blog/climate-change-is-weakening-the-oceans-currents-heres-why-that-matters/ (accessed on 12 November 2022).
  34. Timmermans, M.-L.; Marshall, J. Understanding Arctic Ocean Circulation: A Review of Ocean Dynamics in a Changing Climate. JGR Ocean. 2020, 125, e2018JC014378. [Google Scholar] [CrossRef]
  35. Butler, A.H.; Sjoberg, J.P.; Seidel, D.J.; Rosenlof, K.H. A sudden stratospheric warming compendium. Earth Syst Sci Data 2017, 9, 63–76. [Google Scholar] [CrossRef]
  36. Fereday, D.; Maidens, A.; Arribas, A.; Scaife, A.A.; Knight, J.R. Seasonal Forecasts of Northern Hemisphere Winter 2009/10. Environ. Res. Lett. 2012, 7, 034031. [Google Scholar] [CrossRef]
  37. Zhang, L.; Chen, Q. Analysis of the variations in the strength and position of stratospheric sudden warming in the past three decades. Atmos. Ocean. Sci. Lett. 2019, 12, 147–154. [Google Scholar] [CrossRef]
  38. Lujanas, V. Cosmogenic Radionuclides in the Atmosphere; Mokslas: Vilnius, Lithuania, 1979; p. 179. (In Russian) [Google Scholar]
  39. Jaiser, R.; Dethloff, K.; Handorf, D.; Rinke, A.; Cohen, J. Impact of sea ice cover changes on the Northern Hemisphere atmospheric winter circulation. Tellus A Dyn. Meteorol. Oceanogr. 2012, 64, 11595. [Google Scholar] [CrossRef]
  40. Tanaka, K.R.; Van Houtan, K.S. The recent normalization of historical marine heat extremes. PLoS Clim. 2022, 1, e0000007. [Google Scholar] [CrossRef]
  41. Zhu, S.; Luo, Y.; Ptak, M.; Sojka, M.; Ji, Q.; Choinski, A.; Kuang, M. A hybrid model for the forecasting of sea surface water temperature using the information of air temperature: A case study of the Baltic Sea. All Earth 2022, 34, 27–38. [Google Scholar] [CrossRef]
  42. National Oceanic and Atmospheric Administration (NOAA). CoastWach Data Portal. Chlorophyll-a Anomaly. Available online: https://coastwatch.noaa.gov/cw_html/cwViewer.html# (accessed on 12 November 2022).
  43. Buckley, M.W.; DelSole, T.; Susan Lozier, M.; Li, L. Predictability of North Atlantic Sea surface temperature and upper-ocean heat content. J. Clim. 2019, 32, 3005–3023. [Google Scholar] [CrossRef]
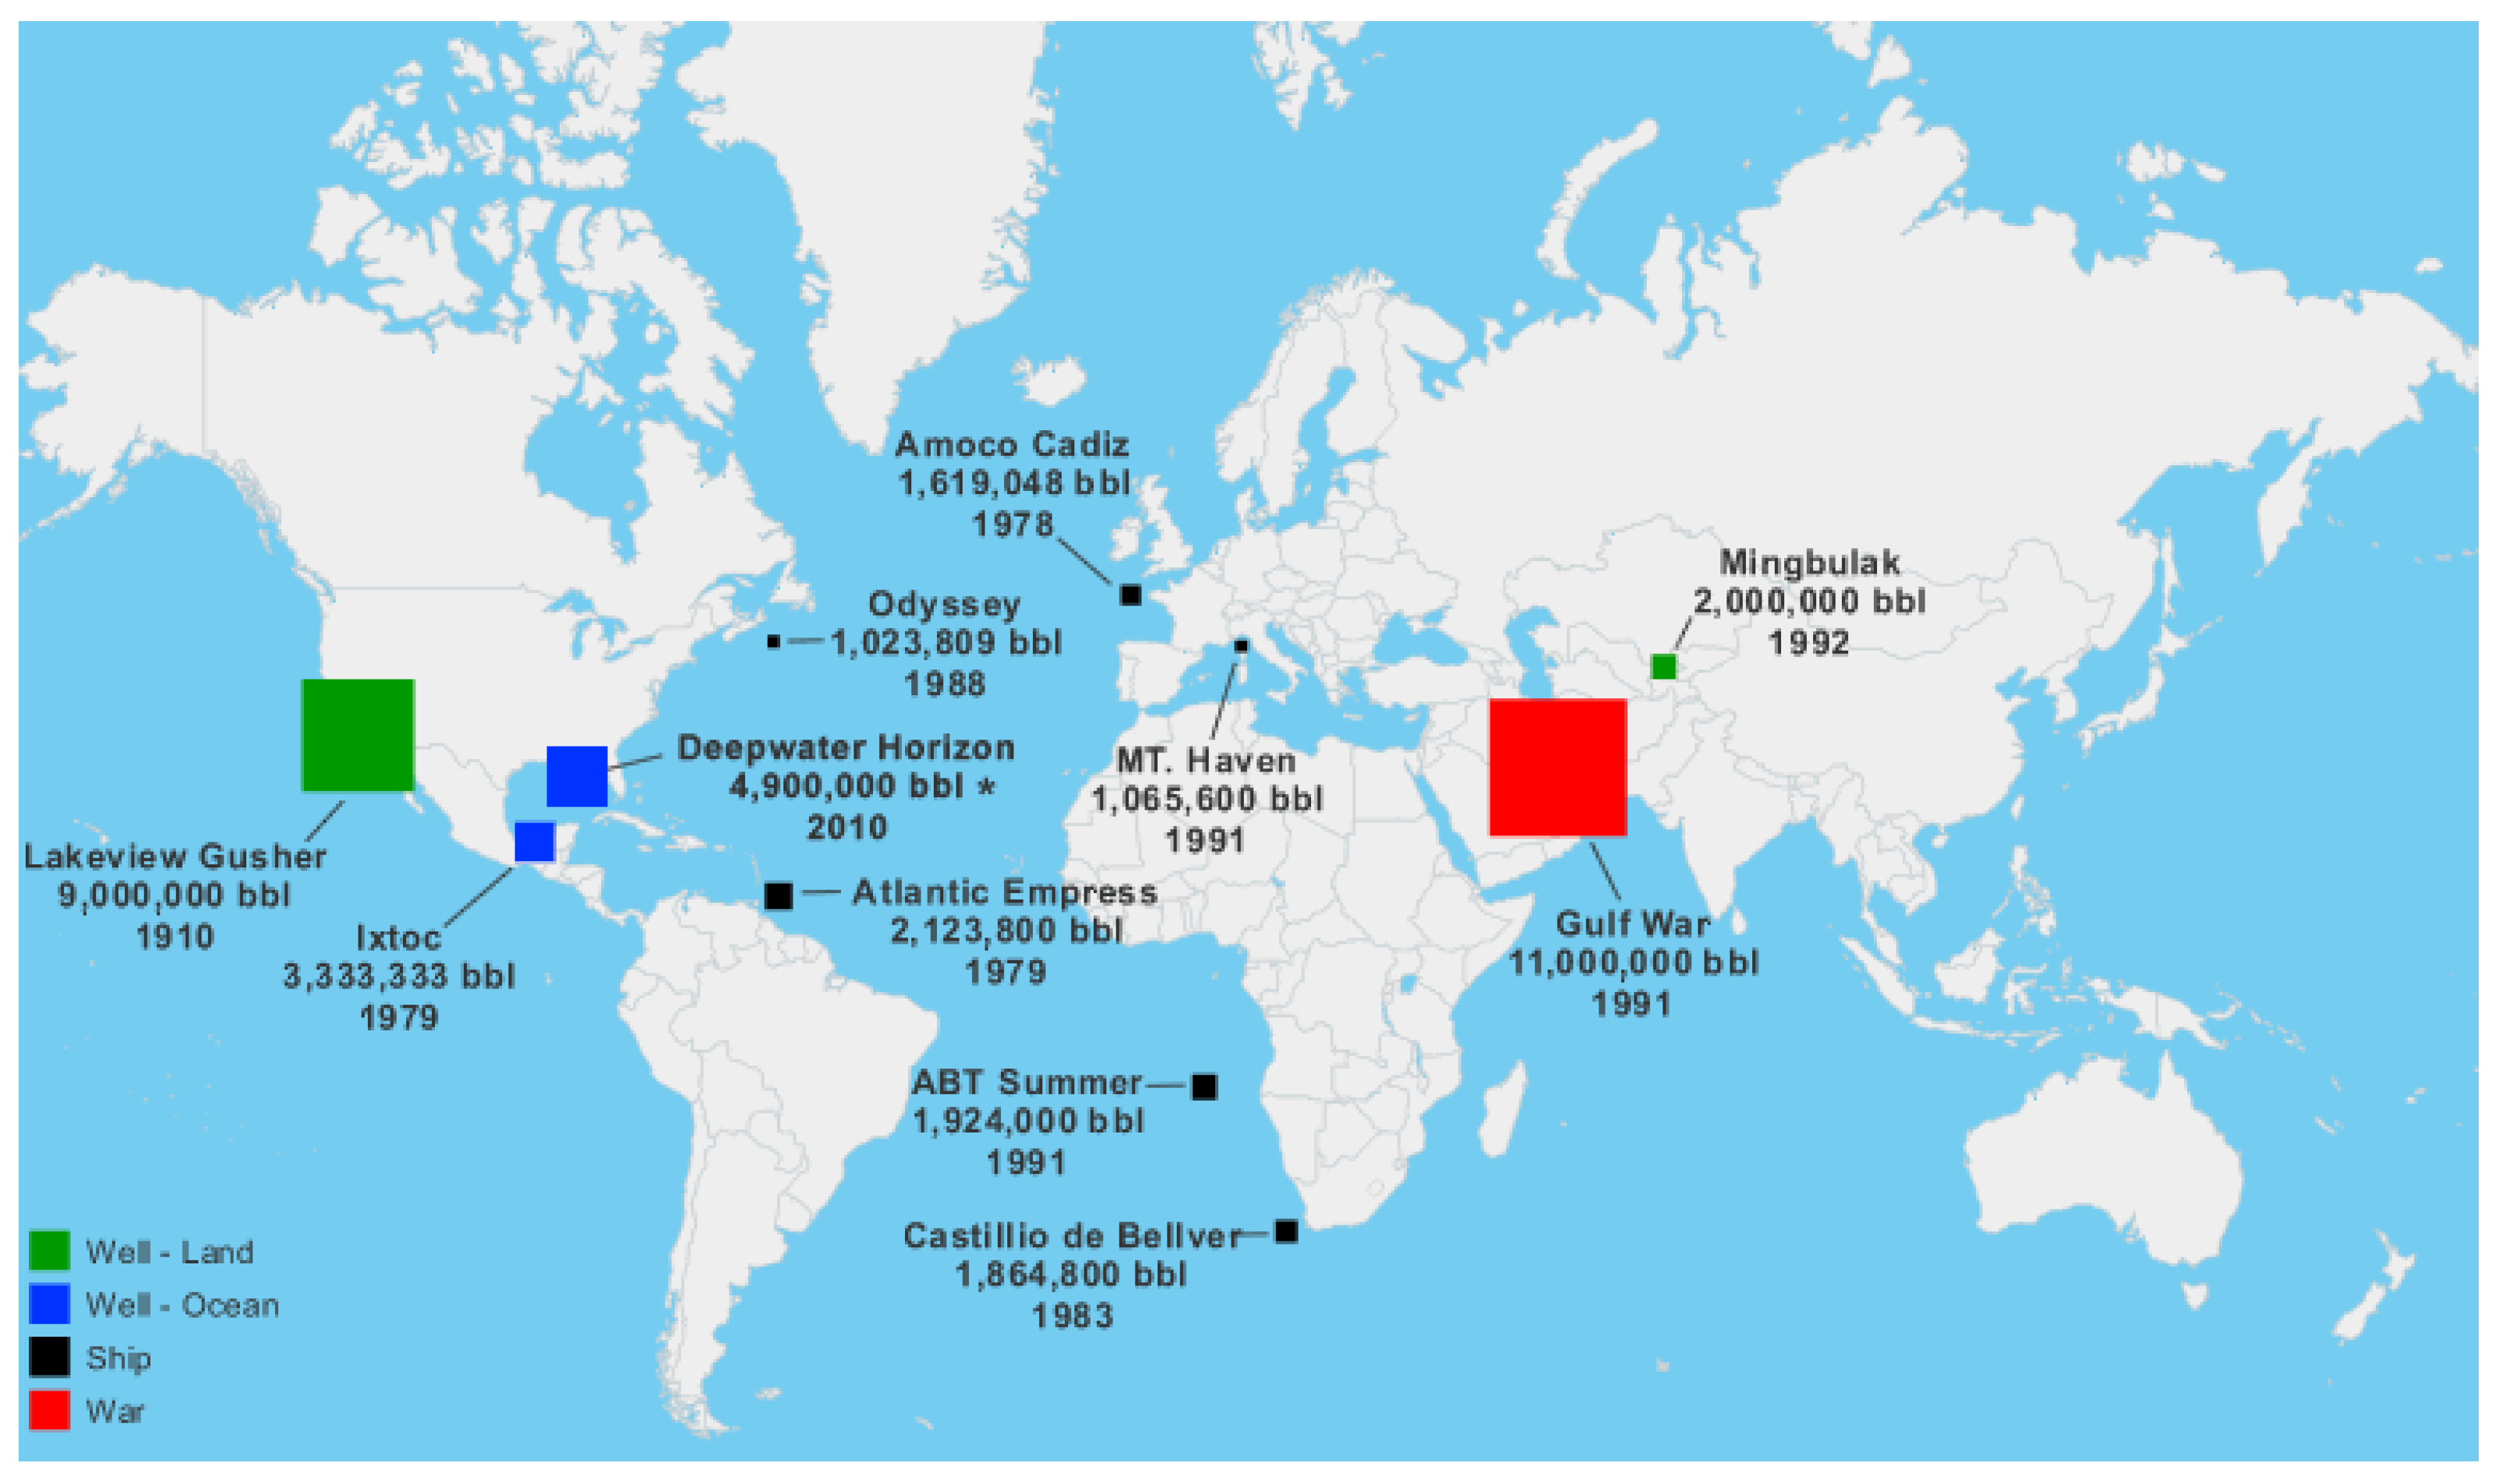
Figure 1. A schematic map of the largest oil spills globally [7]. * Estimated 15 July 2010 (assumes 60,000 bbl per day).
Atmosphere 15 01216 g001
Figure 2. A scheme showing the relationships between events resulting from the Atlantic Ocean pollution following the major oil spill in the Gulf of Mexico in April 2010.
Atmosphere 15 01216 g002
Figure 3. A schematic map of the Gulf Stream [24].
Atmosphere 15 01216 g003
Figure 4. The annual sum of mean monthly surface water temperatures (Σ °C) near the Icelandic Depression (Reykjavik).
Atmosphere 15 01216 g004
Figure 5. The course of the average monthly NAO index (500 mb) for 1995–2020.
Atmosphere 15 01216 g005
Figure 6. Locations of the weather stations used in the study: 1—Natashquan/CAN, 2—Narsarsuaq/GRL, 3—Reykjavik (Icelandic Depression), 4—Vestmannaeyjar/ISL, 5—Akurnes/ISL, 6—Trondheim/Vaernes/NOR, 7—Krangede/SWE, 8—Pello/FIN, 9—Vilnius/LT, 10—Stansted Airport/UK, 11—Abbeville/FRA.
Atmosphere 15 01216 g006
Figure 7. The course of AATs at European weather stations: Krangede (Sweden), Pello (Finland), Abbeville (France), Trondheim (Norway), Stansted Airport (United Kingdom) and Vilnius (Lithuania) for the period 1995–2019.
Atmosphere 15 01216 g007
Figure 8. The course of AATs at the stations Natashquan (Canada) and Narsarsuag (Greenland) for the period 1995–2019.
Atmosphere 15 01216 g008
Figure 9. The course of AAT at the stations Akurnes and Vestmannaeyjar (Iceland) for the period 1995–2019.
Atmosphere 15 01216 g009
Figure 10. The course of the annual sum of the eastern mean monthly longitudes (E. Σ °) of the 8 °C isotherms for the period 1995–2019.
Atmosphere 15 01216 g010
Figure 11. The course of the annual sum of the eastern mean monthly longitudes (E. Σ°) of the 4 °C isotherms for the period 1995–2019.
Atmosphere 15 01216 g011
Table 1. The mean monthly surface water temperatures (°C) in the region of the Icelandic Depression (Reykjavik) according to the satellite imaging system from January 1995 to December 2019.
Jan.Feb.Mar.Apr.MayJuneJulyAug.Sept.Oct.Nov.Dec. (Σ °C)
19955.85.15.14.86.08.08.69.79.77.86.86.2 (83.6)
19966.05.85.56.07.49.210.911.010.28.87.26.6 (94.6)
19976.25.65.35.86.98.710.911.810.111.87.97.8 (95.8)
19987.06.45.75.86.99.811.011.010.28.97.76.9 (97.3)
19996.75.95.96.27.18.910.211.89.98.87.86.9 (96.1)
20006.45.95.55.66.58.81111.911.39.27.66.9 (96.6)
20016.36.26.06.16.77.710.111.810.89.77.97.1 (100.2)
20026.66.05.76.16.79.010.010.59.99.18.37.8 (95.7)
20037.26.76.76.97.910.011.912.811.39.58.67.7 (107.2)
20046.86.36.56.77.59.811.312.011.39.78.27.5 (103.6)
20056.66.36.06.77.39.011.011.910.18.37.57.1 (97.8)
20066.76.36.25.97.48.710.711.711.09.57.67.0 (98.7)
20076.56.46.16.37.39.911.211.910.48.97.87.4 (100.1)
20086.96.56.06.97.59.411.71210.28.47.77.2 (100.3)
20096.76.56.16.17.61011.912.010.79.18.17.7 (102.5)
20107.06.76.76.67.910.212131210.497.8 (109.3)
20116.86.76.26.57.48.811.211.4119.78.47.7 (101.8)
20126.76.56.36.67.710.51312.910.79.07.77.4 (104)
20136.96.86.76.87.29.210.2119.98.97.86.9 (98.3)
20146.66.76.46.58.210.911.311.710.99.38.47.4 (104.3)
20156.55.85.75.86.48.11010.910.19.386.9 (93.5)
20166.46.15.96.37.19.311.212.711.89.48.47.4 (102)
20176.56.15.86.27.69.211.111.911.79.88.47.0 (101.3)
20186.55.75.76.17.48.69.910.99.98.87.67.1 (94.2)
20196.75.75.76.17.89.811.811.810.69.58.47.6 (101.5)
Σ °C—an annual sum of mean monthly surface water temperatures.
Disclaimer/Publisher’s Note: The statements, opinions and data contained in all publications are solely those of the individual author(s) and contributor(s) and not of MDPI and/or the editor(s). MDPI and/or the editor(s) disclaim responsibility for any injury to people or property resulting from any ideas, methods, instructions or products referred to in the content.