Article

A Method for the Ambient Equivalent Dose Estimation in a Wide Range of Altitudes during SEP and GLE Events

Pushkov Institute of Terrestrial Magnetism, Ionosphere and Radio Wave Propagation, Russian Academy of Sciences (IZMIRAN), Kaluzhskoe hw., 4, Troitsk, 108840 Moscow, Russia
*
Authors to whom correspondence should be addressed.
Atmosphere 2024, 15(1), 92; https://doi.org/10.3390/atmos15010092
Submission received: 10 December 2023 / Revised: 6 January 2024 / Accepted: 8 January 2024 / Published: 10 January 2024
(This article belongs to the Special Issue Novel Insights into the Effects of Space Weather on Human Health)

Abstract

:
The paper considers the modeling of proton transport through the Earth’s atmosphere during several SEP events (12 August 1989, 23 March 1991, and 8 November 2000), as well as during the GLE73 event. Solar sources and interplanetary medium conditions during these events are described in detail. Calculations are carried out using own model implemented with GEANT4. As the main results, quantitative estimates of the calculated ambient dose equivalent for altitudes in a wide range (also including civil aircraft flight altitudes of 10–11 km) for the geomagnetic cutoff rigidity values Rc = 0.13 GV are given.

1. Introduction

Galactic cosmic rays (GCRs) continuously interact with matter in the Earth’s atmosphere, ionizing the air and giving rise to cascades of secondary particles [1]. Solar cosmic ray (SCR) protons (in the energy range of E < 1 GeV) produced by the activity of the Sun have significantly higher fluxes than GCRs, but SCRs are also able to influence the atmosphere at higher altitudes (>50 km). The difference can reach several orders of magnitude. As a result, some of the secondary particles during powerful solar events can reach the Earth surface and cause a Ground-level enhancement (GLE). GLE is a very interesting event, observed as an increase in the count rate of the ground-based detectors. Such detectors can be ordinary Geiger counters, scintillation spectrometers, muon telescopes, etc., but the main, of course, are neutron monitors (NM). The first key feature of these detectors is that they mainly detect neutrons, which have a large mean free path in the Earth’s atmosphere and very well represent the state of the primary particle flux through a simple count rate. The second difference from other detecting devices is that NMs operate as a network of stations (https://www.nmdb.eu/, accessed on 7 January 2024), each NM is located at a point with its own geomagnetic cutoff rigidity and reception cone. This approach makes it possible to determine an important parameter, such as the anisotropy of the primary proton flux. It should be noted that today, spacecraft make it possible to measure the primary proton spectrum very well (e.g., PAMELA [2,3], AMS-02 [4], HEPD [5]). NMs are also important tools for determining a high-energy part of the energy spectrum of primary SCR protons. The main advantage of the NM network is the coverage of a large range of geomagnetic cutoff rigidities, as well as a continuous series of data covering several decades. Since the count rate increases at NMs are very noticeable (from a few percent to several hundred percent), this detector serves as a very good indicator of the GLE onset [6,7,8,9].
However, there are events in which a number of conditions for the occurrence of a GLE are not met (mainly due to the “softer” energy spectrum of solar protons—up to hundreds of MeV), despite high particle fluxes and rather sharp profiles. Such events are called Solar energetic particle (SEP) events and are not analyzed as much as the GLEs in the literature but are still of interest for assessing the impact on the upper and lower Earth’s atmosphere.
One of the main tasks connected with the study of the interaction of both GCR and SCR particles with the Earth’s atmosphere is the calculation of the spectra of secondary particles, their fluxes, as well as the calculation of the equivalent dose, especially at civil aircraft flight altitudes (10–11 km) [7]. Such research is carried out using numerical modeling, in which the main input parameters are the geomagnetic cutoff rigidity and the energy spectrum of primary protons. These works are based on the fact that protons of cosmic rays interacting with the Earth’s atmosphere deposit their energy both for ionization and inelastic collisions. In the upper atmosphere layers, where the air is rarefied and its density is low, ionization processes prevail. However, from about an altitude of 30 km and lower to the sea level, the air density increases significantly, and the probability of an inelastic collision of a proton with nitrogen and oxygen nuclei is also growing. As a result of such collisions, secondary particles are generated; some are able to path free down to sea level, depositing their energy in the surrounding matter. The main scientific-practical aim of the presented work is to estimate the effect of SCR protons on the Earth’s atmosphere and objects in it during SEP and GLE events. Such information is useful, e.g., in ensuring the radiation safety of the aircrews during flights in areas of low geomagnetic cutoff rigidity. The desired result in our case depends on the altitude profile, which describes the amount of energy deposited per unit of matter mass.
In this work, we consider several SEP events (with maximum fluxes of protons with energy > 10 MeV exceeding 5000 pfu (particle flux unit, 1 particle per square centimeter per second per steradian) and protons with energy > 100 MeV exceeding 20 pfu: 1989.08.12, 1991.03.23, and 2000.11.08) and the recent GLE 73 event. Considering different types of events will allow us to study in detail the nature of the particle flux impact on the atmosphere and objects in it. All the events are carefully analyzed, and their main features are described. For each SEP a differential spectrum is determined according to the GOES satellite data—https://www.ncei.noaa.gov/data/goes-space-environment-monitor/access/avg/ (accessed on 7 January 2024), and for GLE—according to ground-based measurements. The main result of the work is the assessment of the energy spectra of secondary particles (neutrons, protons, e+, e, γ, μ, μ+), as well as the ambient dose equivalent in a wide range of altitudes (0–98 km), including civil aircraft flight altitudes (~10 km).

2. Data and Methods

The work is performed with the X-ray flare and proton enhancement databases [10]. SCR flux enhancements were selected on the basis of measurements of protons with energy >10 MeV (P10), >50 MeV (P50), and >100 MeV (P100) by satellites IMP-8 and GOES (https://www.ngdc.noaa.gov/stp/space-weather/solar-data/solar-features/solar-flares/x-rays/ (accessed on 7 January 2024), https://www.swpc.noaa.gov/products/goes-x-ray-flux (accessed on 7 January 2024)). We also used the data of the world network of neutron monitors (NMDB, http://www.nmdb.eu/ (accessed on 7 January 2024)). The parameters of solar wind (SW) and interplanetary magnetic field (IMF) were taken from the OMNI database (https://omniweb.gsfc.nasa.gov/ (accessed on 7 January 2024)), data on geomagnetic activity from https://kp.gfz-potsdam.de/en/ (accessed on 7 January 2024) [11], https://wdc.kugi.kyoto-u.ac.jp/dstdir/index.html (accessed on 7 January 2024), and list of shock waves—http://isgi.unistra.fr/data_download.php (accessed on 7 January 2024).
For modeling CR protons’ transport through the Earth’s atmosphere and calculating the secondary CR spectra and the ambient dose equivalent, the RUSCOSMICS model was used, based on the GEANT4 software development toolkit [12,13,14]. This software package is conceptually very similar to PLANETOCOSMICS [15]. Application of the GEANT4 for the creation of the model allows to use the principles of object-oriented programming and implement own geometry classes, connect the necessary interaction models, and also determine the sources of primary particles with the defined energy and angular distribution. Parameterization of density, temperature, and mass percentage of different air elements was carried out using the NRLMSISE-00 model [16]. Thus, a model of the Earth’s atmosphere is obtained, which is a volume divided into layers so that each layer contains an equal proportion of the total atmosphere mass. Practical experience shows that the most optimal value is 5% per layer. This value was chosen according to the requirements of the calculation speed increase while maintaining acceptable agreement of the obtained results with experimental data. To verify the model, data from compact Geiger counters during flights on civil aircraft were used, as well as the count rate profiles obtained during the balloon experiments [17]. The deviation of the profiles under consideration from the model values ranged from 5 to 18% at altitudes of 10–15 km. For the presented task, we consider this to be a good agreement. However, it should be noted that verification based on experimental data is continuously performed in order to improve the quality of our model.
To implement the physics of elementary particles’ interaction with matter, the models of standard electromagnetic processes included in GEANT4, the model of Bertini cascade [18], the Quark-Gluon string model [19,20], and the high-precision model for neutrons are used [21]. The model generator of primary particles is specified as a point source at the top of the Earth’s atmosphere (100 km). The probability density for choosing the primary particle energy is set in accordance with the energy spectrum of the primary protons. For GCRs, such a spectrum is determined using the technique described in GOST 25645.104-84 “Cosmic rays. Terms and definitions (1985)” for solar protons during GLEs—according to the method defined by [22,23], for SEP events—as described in the results of the current work. Visualization of the passage of protons with an energy of 5 GeV and the creation of cascades of secondary particles is presented in Figure 1.
Such figures with secondary particle tracking make it possible to qualitatively evaluate the parameterization of the atmospheric model as well as the correctness of particle propagation and the generation of cascades in the atmosphere. For example, this figure clearly shows how primary protons, passing through the upper layers of the Earth’s atmosphere, spend their energy for ionization (protons, as positively charged particles, are indicated in red). On the track, this process is visible as blue dots (negatively charged particles are indicated in blue; in the case of ionization, these are electrons). Further, as the layers of the atmosphere become denser, processes of cascade formation are observed, since, as mentioned above, the probability of an inelastic collision increases. In these processes, particles are born that belong to the electromagnetic, muon, and hadronic components of secondary cosmic rays. As can be clearly seen from the figure, some of these particles become albedo radiation, and some can penetrate even deeper into the atmosphere, reaching the surface of the Earth and wasting energy on their track through various types of interactions.
The ambient dose equivalent is defined as the product of the absorbed dose (the energy deposited in the matter by a particle), expressed in J/kg (Sv), and a weighting factor called the radiation quality factor [24]. When calculating, it is convenient to represent the ambient dose equivalent as was shown in the work [7]:
H h ,   G = i E G ,   E , Ω J E C i E F i h ,   E , E , θ , φ d E d Ω d E  
where Ci(E′) is the conversion coefficient for a different type of secondary particles (i) with energies E′, Fi (h, E, E′, θ, φ) is the secondary particle flux, produced by a primary proton with energy E arriving from zenith angle θ and azimuth angle φ, J(E) is the differential primary proton spectrum at the top of the Earth’s atmosphere (100 km for this work), h is the given altitude, G is geomagnetic cutoff rigidity, and Ω is the solid angle. The paper [7] also shows that the conversion coefficients Ci(E′) were obtained by many groups of researchers. In our work, these coefficients (also including the radiation quality factor) are taken into account using our own GEANT4 model, which implements the irradiation of a volume (elementary andromorphic phantom) with a secondary particle flux Fi (h, E, E′, θ, φ) at a given height h (0–98 km). This formula is a mathematical convolution of several functions, one of which is a set of secondary particle differential energy spectra, depending not only on the altitude but also on the angular distribution. Such information in our model is collected using special layers located at fixed depths (g/cm2) and having an infinitesimal thickness (10 mm) relative to the height of the atmosphere, the so-called “combined detection layers”. Each of them implements the energy-binned scorer function, integral flux scorer, angle-distribution scorer, and total energy deposit scorer. Passing through such a layer, the particle does not interact with matter in most of the layer volume (this part is modeled as a vacuum), and “pure” information about particle state (energy and angular distribution) is collected in it. The part of the detector responsible for the total energy deposit is filled with air, and a particle passing through it leaves part of the energy through a series of interactions. At the end of the simulation, all information is structurally stored in arrays, which are then put out into a file and can be used in further calculations.

3. Results and Discussions

SEP flux values often show a good correlation with the speed of the corresponding coronal mass ejections (CME) and the power and location of the X-ray flares. The works [25,26,27,28] demonstrated a fairly good correlation between the enhanced proton fluxes and the magnitude of X-ray flares. Moreover, in [10,27,29,30,31], an equally good relationship is shown with the speed of the corresponding CME. However, the state of the interplanetary medium is also of great importance, influencing the conditions for the propagation of particles accelerated in the solar corona, since, for example, additional magnetic barriers may exist [32,33,34,35]. In this regard, it seems important to consider and describe both solar sources and the interplanetary (including near-Earth) medium for the selected events.

3.1. SEP on 12 August 1989

The first of the events under consideration is mentioned in the paper by [36]. The authors consider that the sharp increase and first peak in the flux of protons of different energies observed early on 13 August 1989 (see Figure 2) do not have an established source (solar flare or interplanetary shock responsible for such a SEP event), but the source of the second peak (which occurred on the evening of 13 August) is the X2.6 solar flare that happened on 12 August at 13:57 UT (S16W37 in AR 5629).
However, we believe that the first peak, on the contrary, is associated precisely with this flare, and the authors of the catalog [37] come to a similar conclusion; they also note a possible additional influence on the profile of this event from the X3.5 flare (S16W60), which occurred on 14 August at 00:31 UT in the same active region. Note that this event started under quiet conditions: before the beginning, the proton fluxes were at the background level. Unfortunately, there are no data on IMF and SW near the Earth during the described period, but from the analysis of available data on geomagnetic activity and GCR fluxes recorded by a network of neutron monitors, it follows that on August 12–13, 1989, the Earth was not in any significant interplanetary disturbances. Maxima of proton fluxes were registered 15–17 h after the first X2.6 solar flare (P10 = 6000 pfu for particles with energies > 10 MeV; P50 = 875 pfu for particles with energies > 50 MeV; P100 = 23.7 pfu for particles with energies >100 MeV). Then the flux intensities decreased until the arrival of a shock wave at 06:12 UT on 15 August 1989, after which a slight increase was again recorded, subsequently enhanced by the next proton event (on 16 August 1989). Despite the rather hard spectrum, the SEP on 12–13 August 1989 did not result in a GLE registration.

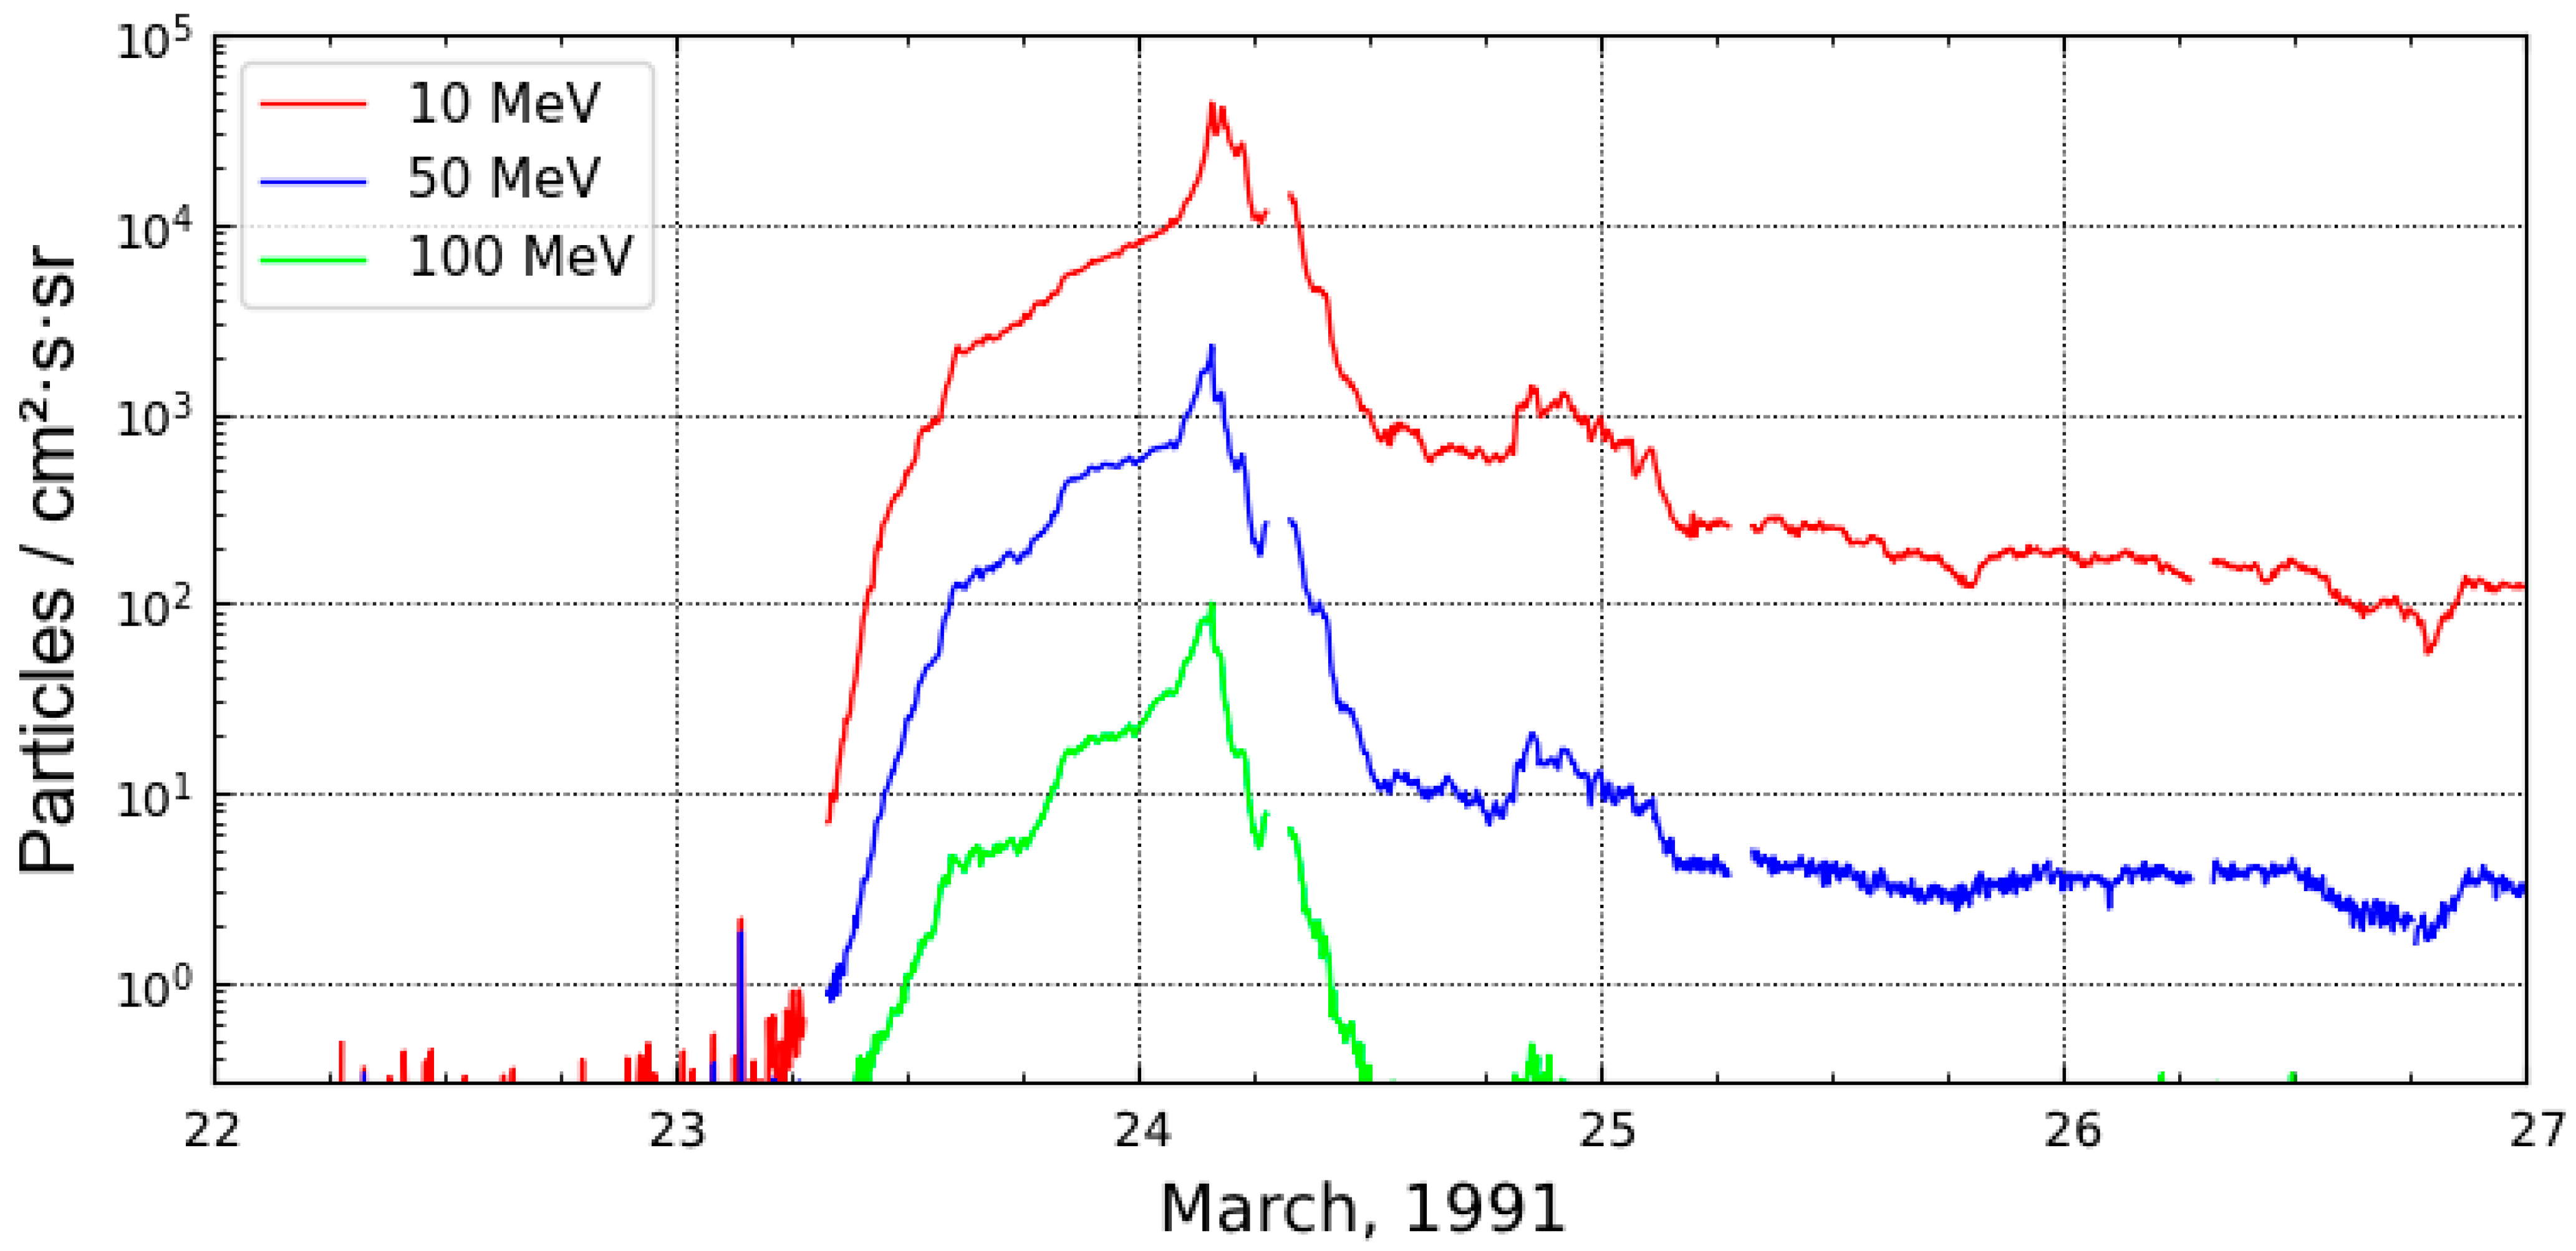
3.2. SEP on 23 March 1991

This event was associated with the X9.4 solar flare (S26E28, AR 6555) on 22 March 1991 at 22:43 UT. A sharp increase in fluxes of protons of different energies from the background level began in the first half of the day on 23 March and reached maximum values with the arrival of a shock wave from the corresponding interplanetary disturbance in the first hours of 24 March. Particle flux profiles for the period 22–26 March 1991 according to GOES satellite data are shown in Figure 3. The maximum proton fluxes were P10 = 43,000 pfu, P50 = 866 pfu, and P100 = 100 pfu. According to the catalog [38], this event could also have an additional contribution from a flare that occurred several hours later from the above-mentioned one in the same active region (M6.8 at 03:05 UT on 23 March).
Despite the lack of coronagraphic and interplanetary (IMF strength and SW velocity) data during the described period, it can be assumed that fast and powerful coronal mass ejections were associated with these flares because a severe and long-lasting magnetic storm (more than two days) and a significant modulation of the GCR flux (up to −20%) were observed according to data from ground-based detectors.

3.3. SEP on 9 November 2000

Figure 4 shows the behavior of different energies of proton fluxes during the period 8–12 November 2000. According to El-Borie [36] and the catalog by Logachev et al. [38] this event is the largest in terms of peak values of SEP fluxes in the 23rd solar cycle. Maximum particle fluxes were recorded in the first 4–8 h and were P10 = 14,800 pfu, P50 = 1580 pfu, and P100 = 451 pfu. The solar flare M7.4 (N10W77, AR 9213) that caused this proton flux enhancement occurred at 22:42 UT on 8 November and the associated coronal mass ejection (at 23:06 UT with an initial speed of 1738 km/s) became a source of interplanetary disturbance, registered near the Earth’s orbit on 10 November at 06:28 UT.

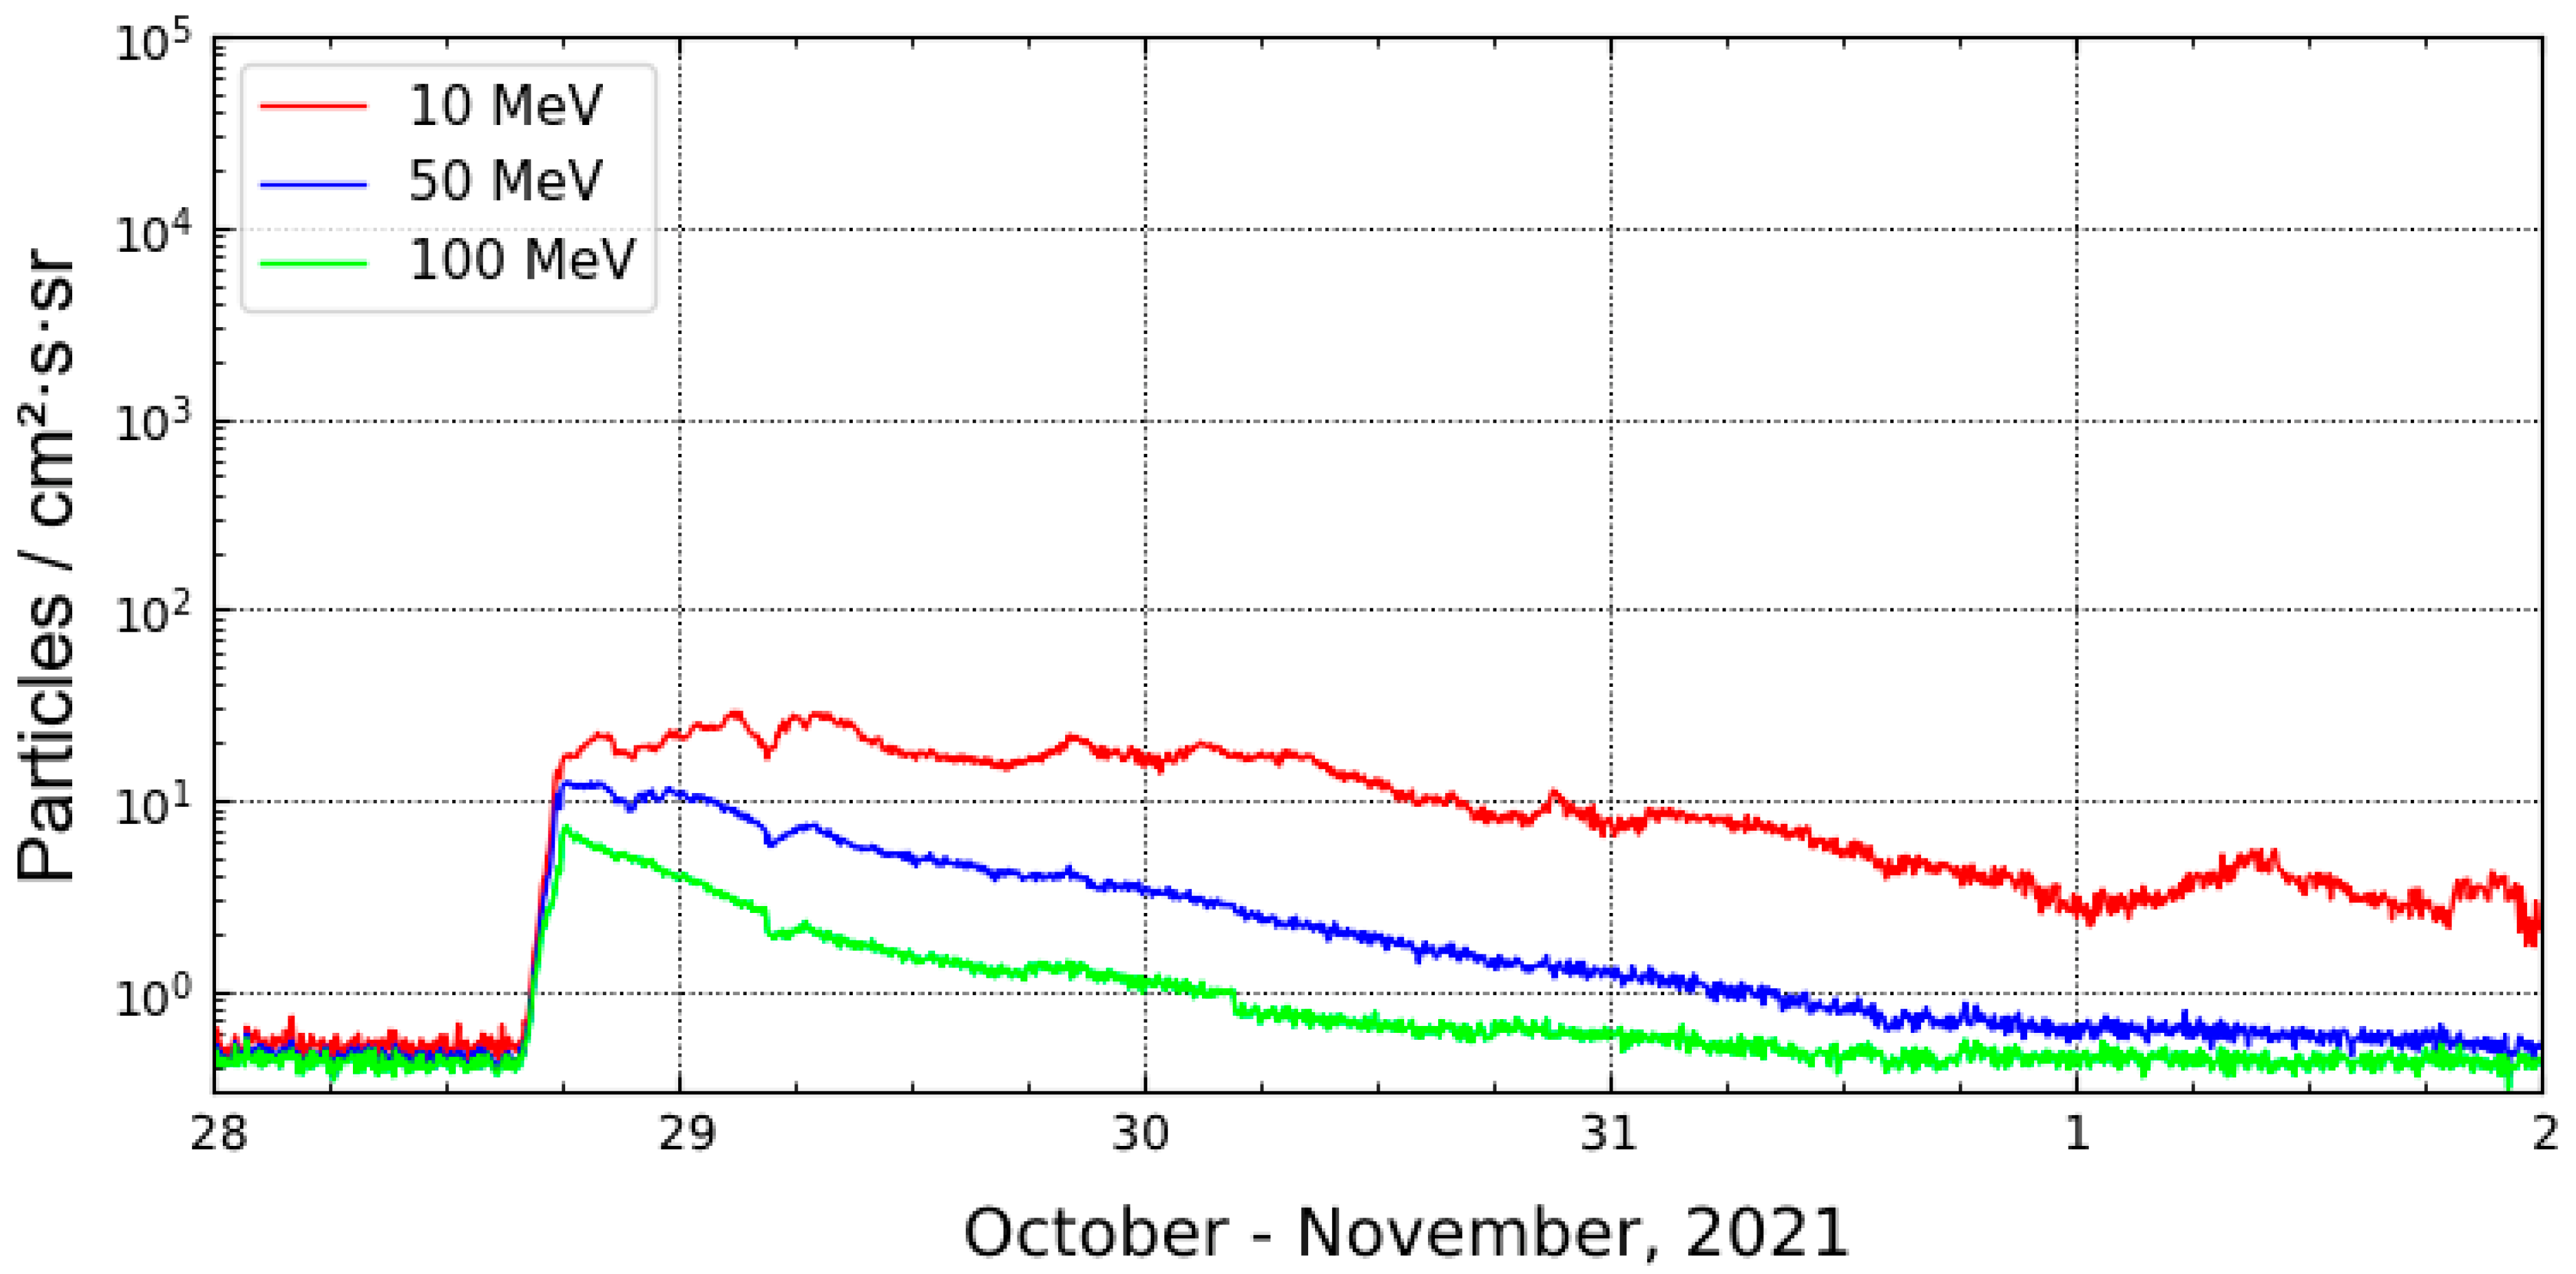
3.4. GLE 73 on 28 October 2021

In addition to the SEP events discussed above that did not result in a GLE registration, the recent GLE 73 was also considered, which differs significantly from previous events. This event was discussed in detail in [39,40]. Figure 5 shows data on proton fluxes from the GOES satellite for 28 October–1 November 2021. The source of this proton flux enhancement was the X1.0 flare (S26W05, AR 12887), which occurred on 28 October at 15:17 UT, and successive halo-CME (15: 48 UT, with an initial speed of 1519 km/s). The maximum fluxes for particles of different energies were P10 = 29 pfu, P50 = 11 pfu, and P100 = 7 pfu. At the South Pole neutron monitor station, a ground-level enhancement of 1% magnitude was recorded. Note that the corresponding interplanetary disturbance and geomagnetic activity turned out to be atypically weak in comparison to other GLE-associated events: the SW speed did not exceed 450 km/s, the maximum IMF value was about 11 nT, not a single magnetic storm interval was recorded, and GCR modulation according to neutron monitor data was about −1%.
The main characteristics of all events under consideration are given in Table 1.

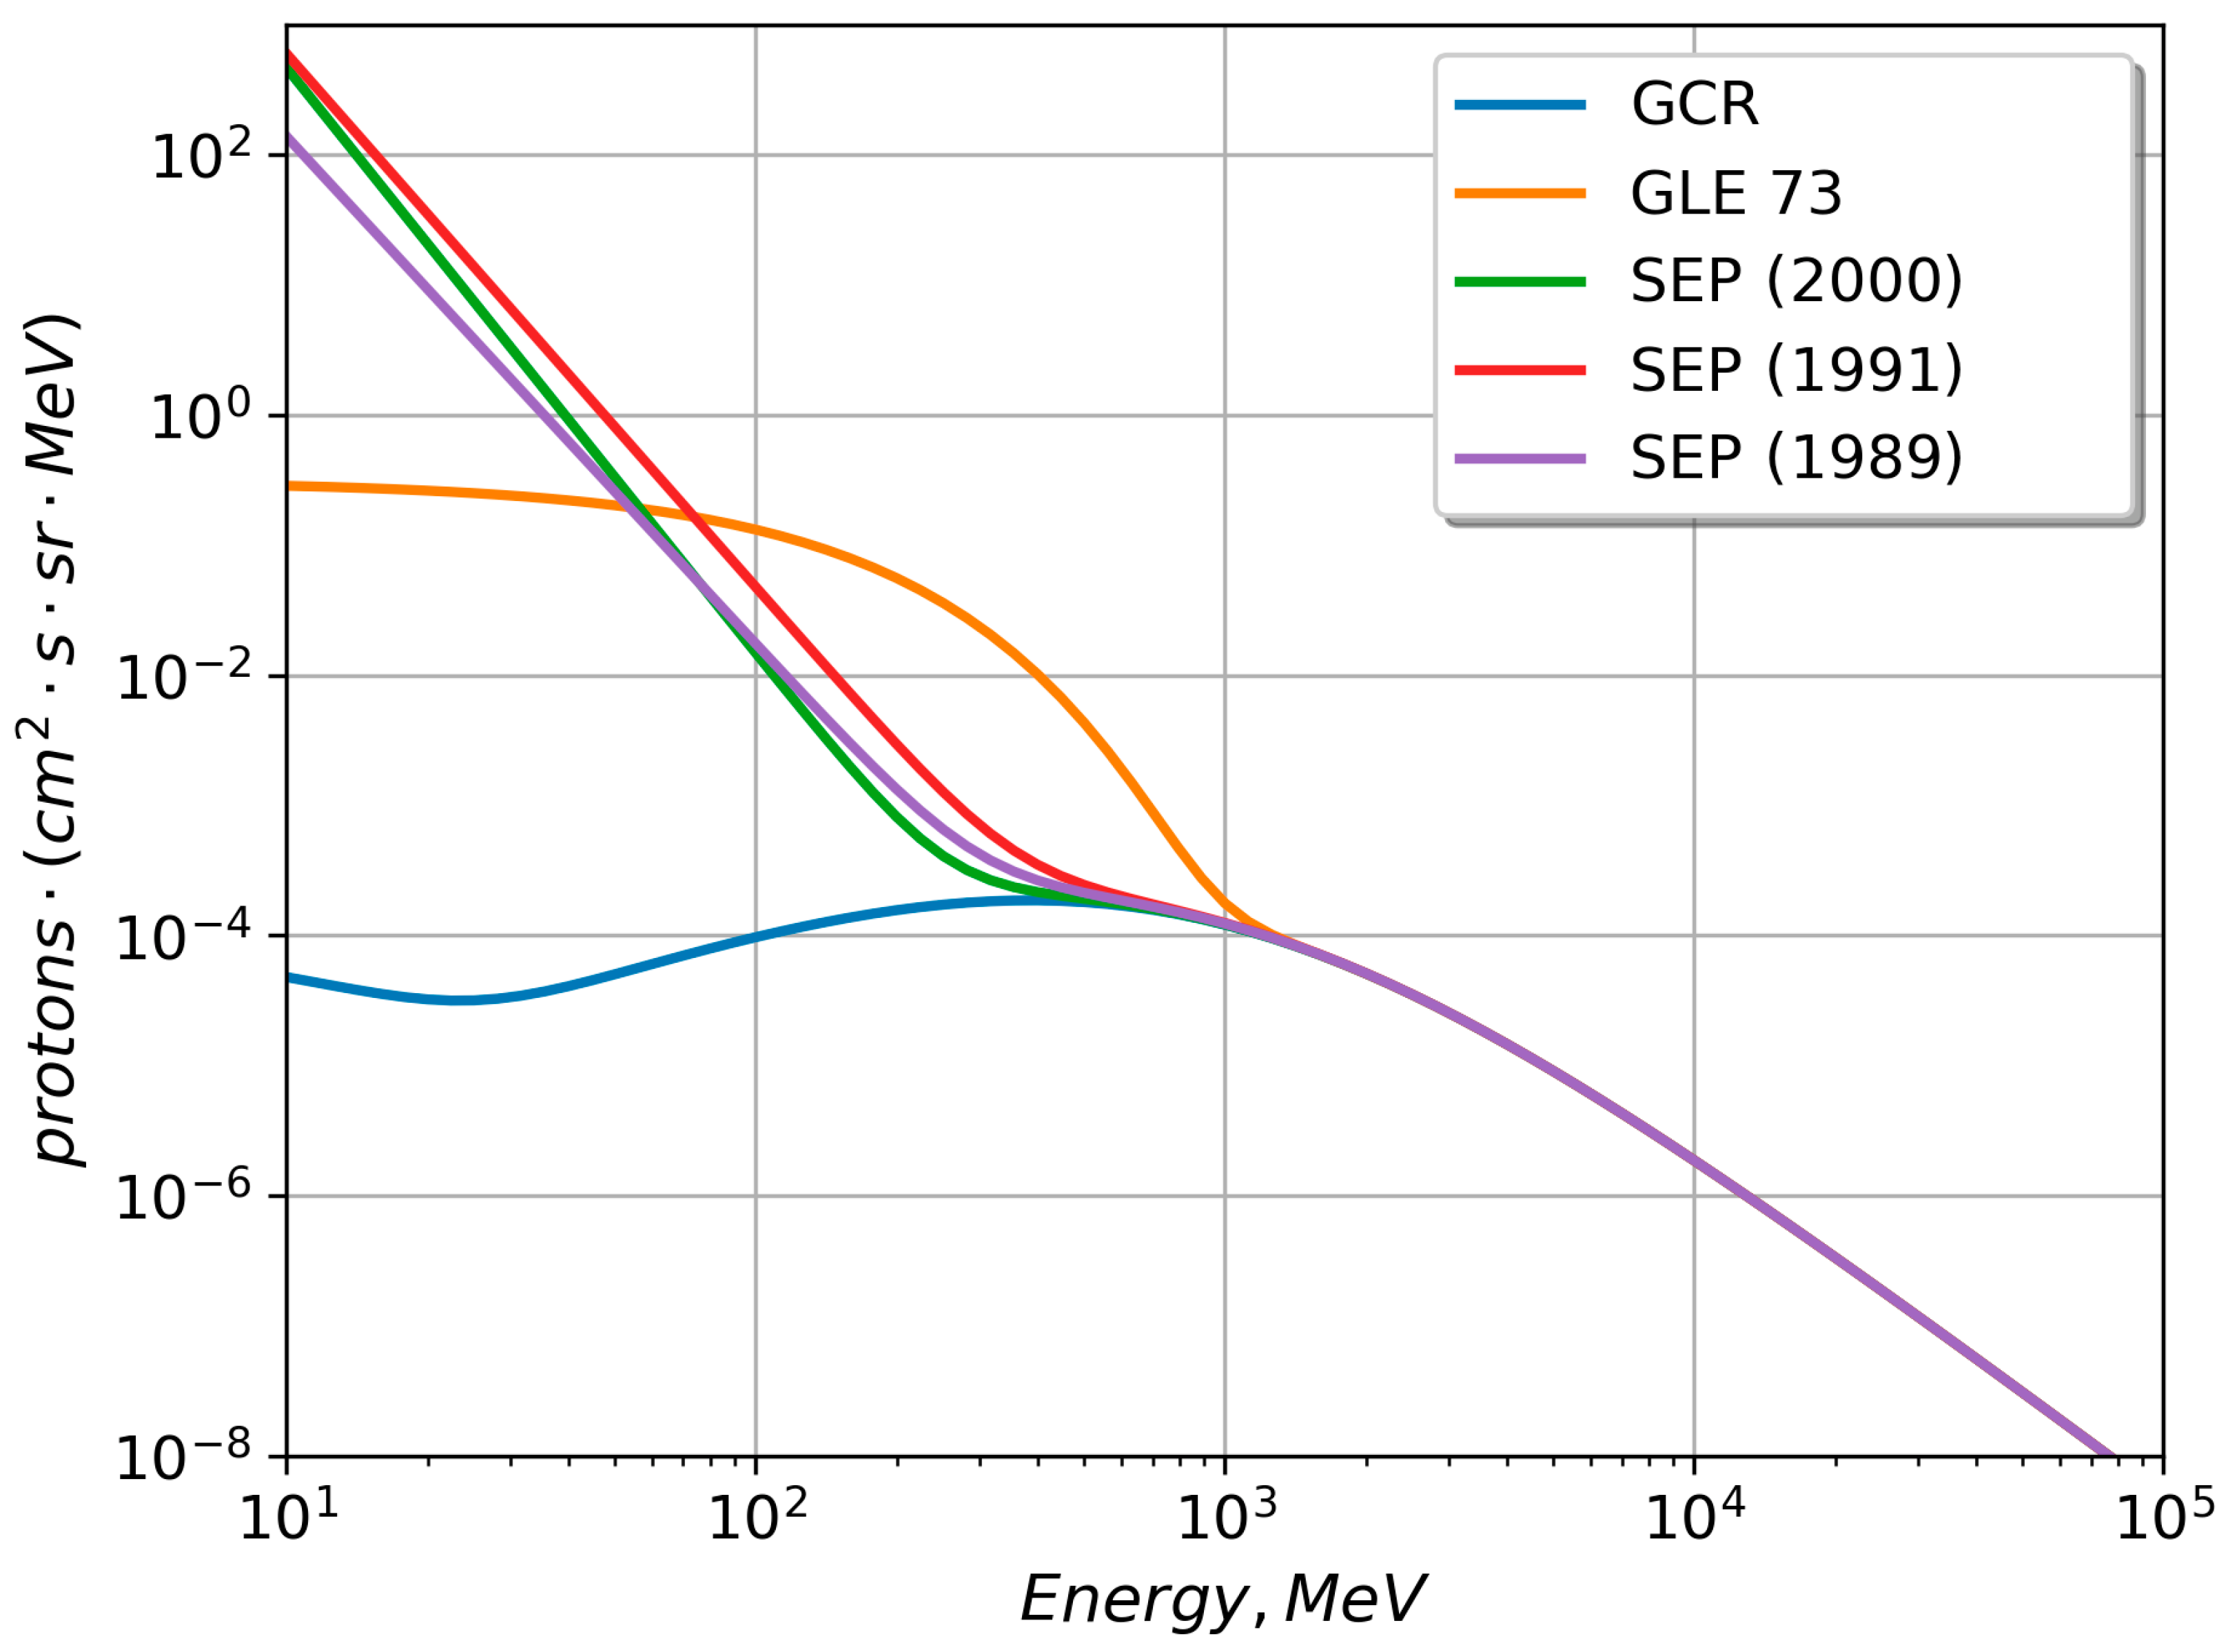
3.5. Primary Protons Differential Energy Spectra

In our work, the lower energy threshold for primary protons was defined as 10 MeV, which corresponds to a geomagnetic cutoff rigidity value of ~0.13 GV. This choice was made on the assumption that the maximum impact of SCR particles during SEP events will be in the polar regions. However, the influence of SCR protons during a GLE can have a significant effect on the Earth’s atmosphere up to 1 GV.
The GOES data used for differential spectra are provided in the form of energy-binned spectra. The first bin has a range of 15–44 MeV (29 MeV width), the second has 44–80 MeV (36 MeV width), the third has 80–165 MeV (85 MeV width), and the fourth has 165–500 MeV (335 MeV width). In the differential spectra data, a fixed value is relevant to each energy bin. The task was to define such a dependence that provides the best concordance with the experimental data. In order to achieve this, a power-law relation was used as the first approximation. Note that determining the real spectrum is a complex problem, and it will be considered in future works. This is because depending on the event characteristics, the spectrum can be expressed not only in a power-law relation but also, for instance, in an exponential one. The polynomial approximation does not currently seem to be appropriate since four experimental data points are insufficient, and the resulting spectrum shape may be a strong misrepresentation. Finding the minimum value for the sum of squared deviations from the experimental data for all four bins was a choice criterion for the best coefficient a and the degree γ of F(E) = a∙E−γ dependence. That is, using own program, a set of a and γ combinations was sampled, the integral for four intervals as well as the sum of squared deviations were calculated and the best value was chosen at the final stage. Figure 6 shows an example of the obtained spectrum with the specified deviation intervals. It is clearly seen that deviations from the second and fourth channels are significant and the solution of this problem is the subject of future research.
For the GLE 73 event, the spectra were calculated according to the technique described in [9] and extracted for the moment with the hardest spectrum. It should be noted that this work implies the calculations for the atmospheric region, where the geomagnetic cutoff rigidity allows particles with energies E > 10 MeV to penetrate the boundary of 100 km in polar regions. This is because the largest fluxes are observed in proton energies with the order of tens MeV for SEP events. Therefore, the lower energy threshold in the spectra corresponds to a value of 10 MeV. The extension of the obtained spectra to a high-energy part is performed assuming that GCR protons are always present in this spectrum. As was mentioned above, since SCR protons are responsible for the spectrum part with E < 1 GeV, then the part E ∈ [1 GeV,100 GeV] is defined according to the GOST 25645.104-84 Cosmic rays; Terms and definitions (1985). All spectra with the inclusion of the GCR high-energy part are presented in Figure 7.

3.6. Secondary Particles Energy Spectra and the Ambient Dose Equivalent

The energy spectra of secondary particles (neutrons, protons, e+, e, γ, μ, μ+) are obtained from the modeling of CR proton transport through the Earth’s atmosphere. These spectra are used for the ambient dose equivalent calculation in the altitude range of 0–98 km. Typical plots of e and γ spectra are presented in Figure 8. From these graphs, one can clearly see the “character” of particles depositing their energy: starting from 30 km the fluxes become smaller since with increasing atmospheric density, the particle energy rapidly decreases. Starting from a height of 15 km, muons, gamma rays, and neutrons mostly reach the Earth’s level. Additionally, these energy spectra already show the difference in the influence of protons on the atmosphere recorded for SEP and GLE events. During SEPs, energy is wasted mainly in the upper atmosphere due to the soft spectrum of the primary particles. For the GLE, on the contrary, due to the harder spectrum of primary protons, particles penetrate deeper into the atmosphere and generate a greater number of secondary particles there. Along with the dependencies for SEPs and the GLE, data for GCR are also presented. This is done to enable relative quantification.
It should be noted that it is not possible to present all the spectra obtained since the data volumes are very large. The ambient dose equivalent calculated in this work is shown in Figure 9. The nature of the presented profile reflects well the abovementioned features regarding the differential energy spectra of secondary particles in the Earth’s atmosphere.

4. Discussion

The work analyzed several SEP events and the GLE 73 event and presented their main characteristics. Differential energy spectra of protons in these events were also obtained. Using the RUSCOSMICS software toolkit, calculations were carried out for the transport of primary CR protons through the Earth’s atmosphere. As a result of the modeling, ambient dose equivalent values were obtained over a wide range of altitudes, including civil aircraft flight altitudes. The main results are presented in Figure 9 and Table 2.
As can be clearly seen from the table, during the considered SEPs, the value of the ambient dose equivalent is practically no different from the GCR for altitudes intended for flights of civil aircraft. For the GLE event, these values can be several times higher and affect the dose received by the crew and passengers. For SEPs, a significant difference in the ambient dose equivalent value is observed in the altitude range from 20 to 100 km and can reach several orders of magnitude, which, in turn, can affect, e.g., atmospheric chemistry [41].
The results presented here are in good agreement with [7]; a small difference may be caused by the fact that in our work we used a lower value of the geomagnetic cutoff rigidity and also did not consider helium nuclei. Helium nuclei can make a significant contribution to ionization and subsequent contributions to the ambient dose equivalent. It is planned to take into account the contribution of heavier nuclei in future works. Additionally, the obtained equivalent dose values for civil aircraft flight altitudes with only the GCR spectrum presence are in good agreement with the calculations using the MIRA (the difference is ~9.1%) and PANDOCA (the difference is ~22%) [42]. It is important to emphasize that the difference between the obtained results is frequently due to the various calculation methods or model input parameters. For example, this type of discrepancy can be estimated in the works that were carried out by other scientific groups and were devoted to the equivalent dose calculations for earlier GLE events (e.g., [7,43]).
It should be noted that the methodology presented in this work can be expanded not only to analyze existing events but also to predict the ambient dose equivalent at altitudes of civil aircraft flights, as well as assess the state of the upper atmosphere. This will be possible if there is a good technique that provides spectra of primary protons in near-real time. Such an instrument can be useful both for the practical purpose of ensuring flight safety at different altitudes and in fundamental research concerning the state of the Earth’s upper atmosphere.

Author Contributions

Conceptualization, E.M. and A.B.; methodology, E.M. and A.B.; software, E.M. and A.A.; validation, A.A. and K.D.; formal analysis, N.S. and M.A.; investigation, N.S., E.M., K.D. and M.A.; writing—original draft preparation, E.M. and N.S.; writing—review and editing, N.S., M.A. and K.D.; visualization, M.A. and E.M.; supervision, A.B. and A.A. All authors have read and agreed to the published version of the manuscript.

Funding

This research received no external funding.

Data Availability Statement

Conflicts of Interest

The authors declare no conflict of interest.

References

  1. Dorman, L. Cosmic Ray Interactions, Propagation, and Acceleration in Space Plasmas; Springer: Dordrecht, The Netherlands, 2006; 847p. [Google Scholar]
  2. Adriani, O.; Barbarino, G.C.; Bazilevskaya, G.A. PAMELA Measurements of Cosmic–Ray Proton and Helium Spectra. Science 2011, 332, 69–72. [Google Scholar] [CrossRef] [PubMed]
  3. Adriani, O.; Barbarino, G.C.; Bazilevskaya, G.A. Time dependence of the proton flux measured by PAMELA during 2006 July–2009 December solar minimum. Astrophys. J. 2013, 765, 91. [Google Scholar] [CrossRef]
  4. Aguilar, M.; Cavasonza, L.A.; Alpat, B.; Ambrosi, G.; Arruda, L.; Attig, N.; Aupetit, S.; Azzarello, P.; Bachlechner, A.; Barao, F.; et al. Observation of Fine Time Structures in the Cosmic Proton and Helium Fluxes with the Alpha Magnetic Spectrometer on the International Space Station. Phys. Rev. Lett. 2018, 121, 051101. [Google Scholar] [CrossRef]
  5. Martucci, M.; Ammendola, R.; Badoni, D.; Bartocci, S.; Battiston, R.; Beolè, S.; Burger, W.J.; Campana, D.; Castellini, G.; Cipollone, P.; et al. Time Dependence of 50–250 MeV Galactic Cosmic-Ray Protons between Solar Cycles 24 and 25, Measured by the High-energy Particle Detector on board the CSES-01 Satellite. Astrophys. J. Lett. 2023, 945, L39. [Google Scholar] [CrossRef]
  6. Mishev, A.; Usoskin, I.G. Numerical model for computation of effective and ambient dose equivalent at flight altitudes: Application for dose assessment during GLEs. J. Space Weather Space Clim. 2015, 5, A10. [Google Scholar] [CrossRef]
  7. Mishev, A.L.; Adibpour, F.; Usoskin, I.G.; Felsberger, E. Computation of dose rate at flight altitudes during ground level enhancements no. 69, 70 and 71. Adv. Space Res. 2015, 55, 354–362. [Google Scholar] [CrossRef]
  8. Mishev, A.L.; Kocharov, L.G.; Koldobskiy, S.A. High-Resolution Spectral and Anisotropy Characteristics of Solar Protons during the GLE N◦73 on 28 October 2021 Derived with Neutron-Monitor Data Analysis. Sol. Phys. 2022, 297, 88. [Google Scholar] [CrossRef]
  9. Kocharov, L.; Mishev, A.; Riihonen, E.; Vainio, R.; Usoskin, I. A Comparative Study of Ground-level Enhancement Events of Solar Energetic Particles. Astrophys. J. 2023, 958, 122. [Google Scholar] [CrossRef]
  10. Belov, A.V. Flares, ejections, proton events. Geomagn. Aeron. 2017, 57, 727–737. [Google Scholar] [CrossRef]
  11. Matzka, J.; Stolle, C.; Yamazaki, Y.; Bronkalla, O.; Morschhauser, A. The geomagnetic Kp index and derived indices of geomagnetic activity. Space Weather 2021, 19, e2020SW002641. [Google Scholar] [CrossRef]
  12. Agostinelli, S.; Allison, J.; Amako, K.; Apostolakis, J.; Araujo, H.; Arce, P.; Asai, M.; Axen, D.; Banerjee, S.; Barrand, G.; et al. GEANT4-a simulation toolkit. Nucl. Instrum. Methods Phys. Res. Sect. A 2003, 506, 250–303. [Google Scholar] [CrossRef]
  13. Allison, J.; Amak, K.; Apostolakis, J.; Arce, P.; Asai, M.; Aso, T.; Bagli, E.; Bagulya, A.; Banerjee, S.; Barrand, G.; et al. Recent developments in Geant4. Nucl. Instrum. Methods Phys. Res. Sect. A 2016, 835, 186–225. [Google Scholar] [CrossRef]
  14. Maurchev, E.A.; Balabin, Y.V. RUSCOSMICS—The new software toolbox for detailed analysis of cosmic ray interactions with matter. Sol. Terr. Phys. 2016, 2, 3–10. [Google Scholar]
  15. Picone, J.M.; Hedin, A.E.; Drob, D.P.; Aikin, A.C. NRLMSISE-00 empirical model of the atmosphere: Statistical comparison and scientific issues. J. Geophys. Res. 2002, 107, 1468. [Google Scholar] [CrossRef]
  16. Truscott, P.; Heynderickx, D.; Nartallo, R.; Lei, F.; Sicard-Piet, A. Application of PLANETOCOSMICS to Simulate the Radiation Environment at the Galilean Moons. EPSC Abstr. 2010, 5, EPSC2010-808. [Google Scholar]
  17. Maurchev, E.A.; Balabin, Y.V.; Germanenko, A.V. Compact Geiger Counters as Additional Tools for Verifying Models of Cosmic Ray Transport through the Earth’s Atmosphere. Bull. Russ. Acad. Sci. Phys. 2021, 85, 1294–1296. [Google Scholar] [CrossRef]
  18. Heikkinen, A.; Stepanov, N.; Wellish, J.P. Bertini intra–nuclear cascade implementation in Geant4. In Proceedings of the 13th International Conference on Computing in High-Enery and Nuclear Physics (CHEP 2003), La Jolla, CA, USA, 24–28 March 2003. [Google Scholar]
  19. Amelin, N.S.; Armesto, N. Monte Carlo model for nuclear collisions from SPS to LHC energies. Eur. Phys. J. C Part. Fields 2001, 22, 149–163. [Google Scholar] [CrossRef]
  20. Amelin, N.S.; Gudima, K.K.; Toneev, V.D. Quark–Gluon String Model and Ultrarelativistic Heavy Ion Interactions. Sov. J. Nucl. Phys. 1990, 51, 327–333. [Google Scholar]
  21. Garny, S.; Leuthold, G.; Mares, V.; Paretzke, H.G.; Ruhm, W. GEANT4 Transport Calculations for Neutrons and Photons below 15 MeV. IEEE Trans. Nucl. Sci. 2009, 56, 2392–2396. [Google Scholar] [CrossRef]
  22. Vashenyuk, E.V.; Balabin, Y.V.; Gvozdevsky, B.B. Features of relativistic solar proton spectra derived from ground level enhancement events (GLE) modeling. Astrophys. Space Sci. Trans. 2011, 7, 459–463. [Google Scholar] [CrossRef]
  23. Balabin, Y.V.; Gvozdevsky, B.B.; Germanenko, A.V.; Maurchev, E.A.; Michalko, E.A. GLE73 Event (October 28, 2021) in Solar Cosmic Rays. Bull. Russ. Acad. Sci. Phys. 2022, 86, 1542–1548. [Google Scholar] [CrossRef]
  24. Kellerer, A.M. Weighting factors for radiation quality: How to unite the two current concepts. Radiat. Prot. Dosim. 2004, 110, 781–787. [Google Scholar] [CrossRef] [PubMed]
  25. Belov, A.; Garcia, H.; Kurt, V.; Mavromichalaki, H.; Gerontidou, M. Proton Enhancements and Their Relation to the X-ray Flares During the Three Last Solar Cycles. Sol. Phys. 2005, 229, 135–159. [Google Scholar] [CrossRef]
  26. Cliver, E.W.; Ling, A.G.; Belov, A.; Yashiro, S. Size distributions of solar flares and solar energetic particle events. Astrophys. J. Lett. 2012, 756, L29. [Google Scholar] [CrossRef]
  27. Dierckxsens, M.; Tziotziou, K.; Dalla, S.; Patsou, I.; Marsh, M.S.; Crosby, N.B.; Malandraki, O.; Tsiropoula, G. Relationship between Solar Energetic Particles and Properties of Flares and CMEs: Statistical Analysis of Solar Cycle 23 Events. Sol. Phys. 2015, 290, 841–874. [Google Scholar] [CrossRef]
  28. Bazilevskaya, G.A.; Sladkova, A.I.; Svirzhevskaya, A.K. Features of the solar X-ray bursts related to solar energetic particle events. Adv. Space Res. 2006, 37, 1421–1425. [Google Scholar] [CrossRef]
  29. Kahler, S.W. The correlation between solar energetic particle peak intensities and speeds of coronal mass ejections: Effects of ambient particle intensities and energy spectra. J. Geophys. Res. Space Phys. 2001, 106, 20947–20956. [Google Scholar] [CrossRef]
  30. Gopalswamy, N.; Makela, P.; Akiyama, S.; Yashiro, S.; Xie, H.; Thakur, N.; Kahler, S.W. Large Solar Energetic Particle Events Associated with Filament Eruptions Outside of Active Regions. Astrophys. J. Lett. 2015, 806, 8. [Google Scholar] [CrossRef]
  31. Miteva, R.; Klein, K.L.; Malandraki, O.; Dorrian, G. Solar Energetic Particle Events in the 23rd Solar Cycle: Interplanetary Magnetic Field Configuration and Statistical Relationship with Flares and CMEs. Sol. Phys. 2013, 282, 579–613. [Google Scholar] [CrossRef]
  32. Richardson, I.G.; Cane, H.V.; Von Rosenvinge, T.T. Prompt Arrival of Solar Energetic Particles from Far Eastern Events: The Role of Large-Scale Interplanetary Magnetic Field Structure. J. Geophys. Res. Space Phys. 1991, 96, 7853–7860. [Google Scholar] [CrossRef]
  33. Lario, D.; Aran, A.; Gómez-Herrero, R.; Dresing, N.; Heber, B.; Ho, G.C.; Decker, R.B.; Roelof, E.C. Longitudinal and Radial Dependence of Solar Energetic Particle Peak Intensities: STEREO, ACE, SOHO, GOES, and MESSENGER Observations. Astrophys. J. 2013, 767, 41. [Google Scholar] [CrossRef]
  34. Cohen, C.M.S.; Mason, G.M.; Mewaldt, R.A. Characteristics of Solar Energetic Ions as a Function of Longitude. Astrophys. J. 2017, 843, 132. [Google Scholar] [CrossRef]
  35. Zhang, J.; Temmer, M.; Gopalswamy, N.; Malandraki, O.; Nitta, N.V.; Patsourakos, S.; Shen, F.; Vršnak, B.; Wang, Y.; Webb, D.; et al. Earth-affecting solar transients: A review of progresses in solar cycle 24. Prog. Earth Planet. Sci. 2021, 8, 56. [Google Scholar] [CrossRef] [PubMed]
  36. El-Borie, M.A. Major solar-energetic particle fluxes: I. Comparison with the associated ground level enhancements of cosmic rays. Astropart. Phys. 2003, 19, 549–558. [Google Scholar] [CrossRef]
  37. Sladkova, A.I.; Bazilevskaya, G.A.; Ishkov, V.N.; Nazarova, M.N.; Pereyaslova, N.K.; Stupishin, A.G.; Ulyev, V.A.; Chertok, I.M. Catalog of Solar Proton Events 1987–1997; Logachev, Y.I., Ed.; Moscow University Press: Moscow, Russia, 1998; 246p, Available online: http://www.wdcb.ru/stp/data/SPE/SPE_1987-1996.pdf (accessed on 8 December 2023).
  38. Logachev, Y.I.; Bazilevskaya, G.A.; Vashenyuk, E.V.; Daibog, E.I.; Ishkov, V.N.; Lazutin, L.L.; Miroshnichenko, L.I.; Nazarova, M.N.; Petrenko, I.E.; Stupishin, A.G.; et al. Catalog of Solar Proton Events in the 23rd Cycle of Solar Activity (1996–2008). 2016. Available online: http://www.wdcb.ru/stp/data/SPE/SPE_1997-2009/Catalog_SPE_23_cycle_SA.pdf (accessed on 8 December 2023).
  39. Papaioannou, A.; Kouloumvakos, A.; Mishev, A.; Vainio, R.; Usoskin, I.; Herbst, K.; Rouillard, A.P.; Anastasiadis, A.; Gieseler, J.; Wimmer-Schweingruber, R.; et al. The first ground-level enhancement of solar cycle 25 on 28 October 2021. Astron. Astrophys. 2022, 660, L5. [Google Scholar] [CrossRef]
  40. Mavromichalaki, H.; Paschalis, P.; Gerontidou, M.; Papailiou, M.-C.; Paouris, E.; Tezari, A.; Lingri, D.; Livada, M.; Stassinakis, A.N.; Crosby, N.; et al. The Updated Version of the A.Ne.Mo.S. GLE Alert System: The Case of the Ground-Level Enhancement GLE73 on 28 October 2021. Universe 2022, 8, 378. [Google Scholar] [CrossRef]
  41. Kirillov, A.S.; Belakhovsky, V.B.; Maurchev, E.A.; Balabin, Y.V.; Germanenko, A.V.; Gvozdevsky, B.B. Vibrational Kinetics of NO and N2 in the Earth’s Middle Atmosphere during GLE69 on January 20, 2005. JGR Atmos. 2003, 128, e2023JD038600. [Google Scholar] [CrossRef]
  42. Copeland, K.; Matthiä, D.; Meier, M.M. Solar cosmic ray dose rateassessments during GLE 72 using MIRA and PANDOCA. Space Weather 2018, 16, 969–976. [Google Scholar] [CrossRef]
  43. Matthiä, D.; Heber, B.; Reitz, G.; Sihver, L.; Berger, T.; Meier, M. The ground level event 70 on December 13th, 2006 and related effective doses at aviation altitudes. Radiat. Prot. Dosim. 2009, 136, 304–310. [Google Scholar] [CrossRef]
Figure 1. Example of a 5 GeV proton transport through the Earth’s atmosphere in the RUSCOSMICS model. The picture shows so-called “flat” geometry, a point-defined primary particle source with an isotropic angle distribution, and secondary particle tracking. The Earth’s atmosphere is divided into layers and parametrized with the NRLMSISE-00 model. Red—positive charged particles, blue—negative charged particles, green—neutrons, yellow—photons.
Atmosphere 15 00092 g001
Figure 2. Fluxes of protons of different energies on 12–16 August 1989.
Atmosphere 15 00092 g002
Figure 3. Fluxes of protons of different energies on 22–26 March 1991.
Atmosphere 15 00092 g003
Figure 4. Fluxes of protons of different energies on 8–12 November 2000.
Atmosphere 15 00092 g004
Figure 5. Fluxes of protons of different energies on 28 October–1 November 2021.
Atmosphere 15 00092 g005
Figure 6. Example of the spectra fitting from GOES experimental data for SEP event 8 November 2000. Derived relation is expressed in the power-law form with a = 1.5∙107 and γ = −4.5. A relatively large deviation in the second and fourth channels is clearly visible.
Atmosphere 15 00092 g006
Figure 7. The derived differential proton energy spectra for SEP and GLE events used in modeling the CR transport through the Earth’s atmosphere and estimation of the ambient dose equivalent.
Atmosphere 15 00092 g007
Figure 8. The differential energy spectra of the secondary electrons (A) and photons (B) were obtained as the modeling result of the proton transport through the Earth’s atmosphere.
Atmosphere 15 00092 g008
Figure 9. The dependence of the calculated ambient dose equivalent on altitude in km.
Atmosphere 15 00092 g009
Table 1. Main characteristics of the considered events.
Solar Flare Date and TimeCoordX-FlareMax P10, pfuMax P50, pfuMax P100, pfuGLE, %CME Speed, km/s
12 August 1989 13:57S16W37X2.6600087523.7--
22 March 1991 22:43S26E28X9.443,000866100--
8 November 2000 22:42N10W77M7.414,8001580451-1738
28 October 2021 15:17S26W05X1.02911711519
Table 2. The calculated ambient dose equivalent for altitudes 0–10 km.
AltitudeGCR, µSv∙h−1SEP (1989), µSv∙h−1 SEP (1991), µSv∙h−1SEP (2000), µSv∙h−1GLE 73, µSv∙h−1
00.010.010.010.010.02
10.030.030.030.030.05
20.060.060.060.060.15
30.130.140.140.140.34
40.270.270.280.270.69
50.50.510.520.51.41
60.880.910.920.892.65
71.451.511.551.484.73
82.292.372.472.347.94
93.483.623.793.5512.68
105.075.265.65.1819.16
Disclaimer/Publisher’s Note: The statements, opinions and data contained in all publications are solely those of the individual author(s) and contributor(s) and not of MDPI and/or the editor(s). MDPI and/or the editor(s) disclaim responsibility for any injury to people or property resulting from any ideas, methods, instructions or products referred to in the content.

