Article

Evaluation of Daily Temperature Extremes in the ECMWF Operational Weather Forecasts and ERA5 Reanalysis

by
Francisco M. Lopes
1,2,*,
Emanuel Dutra
1,2 and
Souhail Boussetta
3
1
Instituto Dom Luiz (IDL), Faculty of Sciences, Campo Grande, 1749-016 Lisbon, Portugal
2
Portuguese Institute for Sea and Atmosphere (IPMA), Rua C do Aeroporto, 1749-077 Lisbon, Portugal
3
European Centre for Medium-Range Weather Forecasts, Reading RG2 9AX, UK
*
Author to whom correspondence should be addressed.
Atmosphere 2024, 15(1), 93; https://doi.org/10.3390/atmos15010093
Submission received: 27 November 2023 / Revised: 29 December 2023 / Accepted: 9 January 2024 / Published: 11 January 2024
(This article belongs to the Special Issue Weather and Climate Extremes: Observations, Modeling, and Impacts)

Abstract

:
In weather forecasting and climate monitoring, daily maximum and minimum air temperatures (TMAX and TMIN) are fundamental for operational and research purposes, from early warning of extreme events to climate change studies. This study provides an integrated evaluation of TMAX and TMIN from two European Centre for Medium-range Weather Forecasts (ECMWF) products: ERA5 reanalysis (1980–2019) and operational weather forecasts (2017–2021). Both products are evaluated using in situ observations from the Global Historical Climatology Network (GHCN). While the analyses span globally, emphasis is given to four key regions: Europe, East and West United States, and Australia. Results reveal a general underestimation of TMAX and overestimation of TMIN in both operational forecasts and ERA5, highlighting the limitation of the ECMWF model in estimating the amplitude of the diurnal cycle of air temperature. ERA5′s accuracy has improved over the past decade, due to enhanced constrain of land–atmosphere analysis streaming from more and higher-quality satellite data. Furthermore, ERA5 outperforms one-day-ahead weather forecasts, indicating that non-real-time dependent studies should rely on ERA5 instead of real-time operational forecasts. This study underscores the importance of ongoing research in model and data assimilation, considering the relevance of daily temperature extremes forecasting and reanalysis for operational meteorology and climate monitoring.

1. Introduction

To accurately represent the physical and dynamical processes near and above the Earth’s surface, a correct characterization of land–atmosphere interactions is fundamental. These interactions establish the basis for understanding and analyzing our climate system variability [1,2]. This includes one of the most relevant near-surface meteorological variables in weather forecasting and climate monitoring: near-surface air temperature, and in particular, the daily maximum and minimum temperatures. The spatial and temporal evolution of these daily temperature extremes ranges from synoptical to decadal scales, being driven by several complex physical processes and climate feedbacks.
Interest in temperature extremes has grown significantly over the last decades, driven by the increased frequency and intensity of extreme temperature events due to climate change [3,4]. These extreme events have diverse impacts on society, the economy, and ecosystems [5,6]. Heatwaves [7,8], in particular, which are linked to human-induced greenhouse gas forcing [9], can cause elevated human mortality and food shortages. Conversely, despite a global decline in frost days and cold spells, severe cold spells have been increasing (in frequency and intensity) over midlatitude regions [10]. Such low temperatures, like heatwaves, can also significantly impact, for instance, agriculture and energy production, as well as cause human mortality. Therefore, accurate temperature forecasts are fundamental for early warning to reduce extreme event impacts.
Since the 2000s, there has been an exponential improvement in computational capacity, accompanied by swift progress in numerical modelling. However, despite significant advances in weather forecasting over the last decades [11], systematic model biases are still present in extreme temperature forecasts: for instance, in those from the European Centre for Medium-range Weather Forecasts (ECMWF) global model [12,13] and the latest ECMWF-ERA5 reanalysis [14,15,16], although the latter has been shown to produce lower biases compared to its predecessor [17]. These biases can result from dynamical processes in the land surface, boundary layer, clouds, and radiation, which exhibit complex spatial and seasonal variations. In [18,19,20], temperature extreme biases were identified in the radiative land surface temperature that were partially attributed to land cover characteristics and vegetation. For instance, systematic cold biases for daily maximum temperatures were detected by [12] in ECMWF forecasts across all leading times (up to sub-seasonal scales) during spring in most midlatitude regions of the Northern Hemisphere (NH). In continental Europe, cold biases were observed during summer, leading to an underestimation of the diurnal cycle temperature amplitude. Additionally, warm biases for daily minimum temperatures were generally found in the United States (U.S.) and in the Caspian Sea region. In [13], ECMWF’s model accuracy was assessed in forecasting daily temperature extremes at multiple lead times (from 1 to 10 days ahead). The authors observed a linear decrease between 2007 and 2013 in Ireland, where the ECMWF model exhibited worse performances in predicting daily minimum temperatures. In [14], warm (cold) biases were observed in ERA5 for daily minimum (maximum) temperatures in Australia from 1979 to 2020, along with an underestimation of decadal warming trends in both temperature extremes. In another study [16], a worse performance of ERA5 was found in computing extreme minimum temperatures in Europe, with a significant overestimation in the northern region. Furthermore, in [15], ERA5 hourly data (1979–2018) were used to derive daily maximum (minimum) temperatures, from which a general underestimation (overestimation) in comparison to observations was found in Southeast Asia.
In this study, we aim at evaluating the daily maximum and minimum temperatures at 2 m (TMAX and TMIN, respectively), produced by the ECMWF operational weather forecasts and ERA5 reanalysis. This analysis represents an integrated evaluation of both forecasted daily temperature extremes of ECMWF global weather forecasts and ERA5 analysis over a multiyear period with a global perspective, complementing a vast literature evaluating either ERA5 or operational weather forecasts on regional/national scales [12,13,14,15,16]. The evaluation of TMAX and TMIN forecasts is performed on a global scale, but due to the distribution and temporal availability of in situ observations, the analyses focus on four regions with the highest sampling rates: Europe, Australia, and East and West U.S. The first part of this study consists in performing a long-term evaluation of ERA5 analysis against 40 years of observations (1980–2019). This includes an interdecadal comparison between the first decade (1980–1989) and the last decade (2010–2019). The second part of this study is focused on analyzing the performance of ECMWF operational forecasts (lead times from 1 to 5 days ahead), also including ERA5, focusing in a 5-year period (2017–2021). The evaluation is performed using standard error metrics for numerical weather prediction (NWP) scoring, being independently computed at each observation location, and applied to seasonal mean values.
The structure of this paper is as follows: Section 2 presents the data and the adopted methodology. In Section 3, we present our main results for the two-part evaluation, while respective discussions are added in Section 4, with the final conclusions in Section 5. Additional results regarding the analyses are included in the Supplementary Materials.

2. Materials and Methods

2.1. GHCN Observations

In this study, we use in situ daily temperature observations from the Global Historical Climatology Network (GHCNd) version 3.29 database [21] to evaluate TMAX and TMIN estimates produced in both ERA5 and operational forecasts. The data used are freely accessible from the National Centers for Environmental Information (NCEI) archive (https://www.ncei.noaa.gov/products/land-based-station/global-historical-climatology-network-daily, accessed on 17 November 2023). GHCNd is a large database that comprises over 100,000 stations worldwide, created for climate analysis and a variety of research studies (e.g., [22,23,24,25]). However, there is an uneven spatial coverage, since the majority of these stations are located near coastal or urban areas to allow for more accessible instrumentation maintenance, with most stations being located within the U.S. Additionally, various studies have reported inconsistencies in GHCNd 24-h summaries of air temperature due to variations in observation time, station, location, and equipment used (e.g., [4,21,25,26,27,28,29,30]). In particular, these inconsistencies notably impact the analysis of daily temperature extremes in the U.S. (e.g., [4,25,27,28,30]), specifically for TMAX [29]. GHCNd summaries over the U.S. consist of 12 independent sub-networks archived at the National Climatic Data Center (NCDC) from the National Oceanic and Atmospheric Administration (NOAA). Amongst these, different methods of data acquisition have been used through the years, from paper forms to synoptic reports produced by automated stations [26]. Observation volunteers are categorized into three groups by [29]: A.M. readers record 24-h daily maximum/minimum temperatures at 8 a.m. (or sunrise); P.M. readers record daily maximum temperatures at 4 p.m. (or sunset); and MID readers record daily values at midnight. Despite variations, GHCNd data are widely used for model validation covering a variety of locations, vegetation types, and climates (e.g., [23,26,31,32]).
To address variations in observation times, prior to the forecast evaluation analyses, we apply a simple time correction. The adopted procedure reduces potential discrepancies between forecasted data and observations by implementing a one-day time-shift correction, as described in detail in Supplementary Materials.

2.2. ECMWF Forecasts and Reanalysis

Operational weather forecasts of TMAX and TMIN from the ECMWF global forecasting system are used covering a 5-year period (2017–2021). Data acquisition includes daily forecasts initialized at 00 UTC with a lead time of up to 5 days ahead, in which TMAX and TMIN forecasts are computed from the forecasts’ post-processed maximum and minimum temperatures (computed at each model time-step). Although during the selected 5-year period, there was no change in the model horizontal (9 km) and vertical (137 levels) resolutions, multiple changes were introduced to the forecast system (https://confluence.ecmwf.int/display/FCST/Changes+to+the+forecasting+system, accessed on 17 November 2023) with the latest model upgrade evaluation, as described in detail by [33].
TMAX and TMIN from ERA5 reanalysis [34] are used for a 40-year period (1980–2019). ERA5 hourly 2-m temperature analyses are obtained from the Copernicus Data Store (https://cds.climate.copernicus.eu, accessed on 17 November 2023), being then used to compute TMAX and TMIN. ERA5 hourly air temperature analysis is derived from an optimal interpolation analysis system. This procedure consists in producing hourly analyses with a three-hour observation window, i.e., for a particular analysis hour, all observations falling within +/−1 h are used. Consequently, daily temperature extremes are not directly assimilated in ERA5.

2.3. Methodology

2.3.1. Observation Processing

The GHCNd temperature original dataset (1980–2021) includes 29,884 stations worldwide (Figure S1, Supplementary Materials). Most of these stations are in the NH, predominantly in the U.S., followed by Europe and Australia. Strict conditions were enforced for the station selection to ensure a robust evaluation. The first step consisted in mapping ERA5 and operational forecast data to each station location by selecting the nearest grid-point. Subsequently, two screening criteria were implemented: (i) locations with a model land sea-mask below 0.9 were excluded to avoid coastlines from affecting the analysis; and (ii) locations with an absolute altitude difference exceeding 100 m between model orography and station elevation were excluded to prevent systematic differences associated with altitude. The second step was the application of a screening criterion based on available observations at each station. For the long-term ERA5 evaluation (1980–2019), stations with at least 365 days of valid data in each decade (1980–1989, 1990–1999, 2000–2009, and 2010–2019) were retained. This guarantees that all stations used had at least 4 years of data, spread in the 4 decades considered. For the operational forecast evaluation (2017–2021), only stations with at least 4 years of valid data in the entire period were retained. Following these filters, a group of high sampling regions was selected for a more detailed analysis between forecasts and observations (Figure S2, Supplementary Materials): East and West U.S., Europe, and Australia. Finally, data from each station were also corrected for the two separate analyses to avoid temporal inconsistencies due to observation time, as described in detail in Supplementary Materials.

2.3.2. Evaluation Metrics

In this study, the assessment of forecasts against ground observations is performed with standard error metrics in NWP scoring: bias, root mean square error (RMSE), and unbiased root mean square error (ubRMSE), calculated using the following equations:
b i a s = 1 N i = 1 N s i ,   s i = y i o i
R M S E = 1 N i = 1 N s i 2 ,
u b R M S E = 1 N i = 1 N s i b i a s 2 .
Here, yi represents the ERA5 analysis or the operational forecast of the i-th temporal sample, oi corresponds to the observation, si denotes the difference between the model and observation, and N represents the number of samples. These metrics are computed independently for each station and are then aggregated spatially for each model grid-point and season (DJF: December to February; MAM: March to May; JJA: June to August, SON: September to November). When calculating regional averages, the spatial aggregation of each station metric to the nearest model grid-point partially reduces the spatial representativity sampling by ensuring that regions with a high station density near a single grid-point do not carry more weight, as compared to a single station near a grid-point.

3. Results

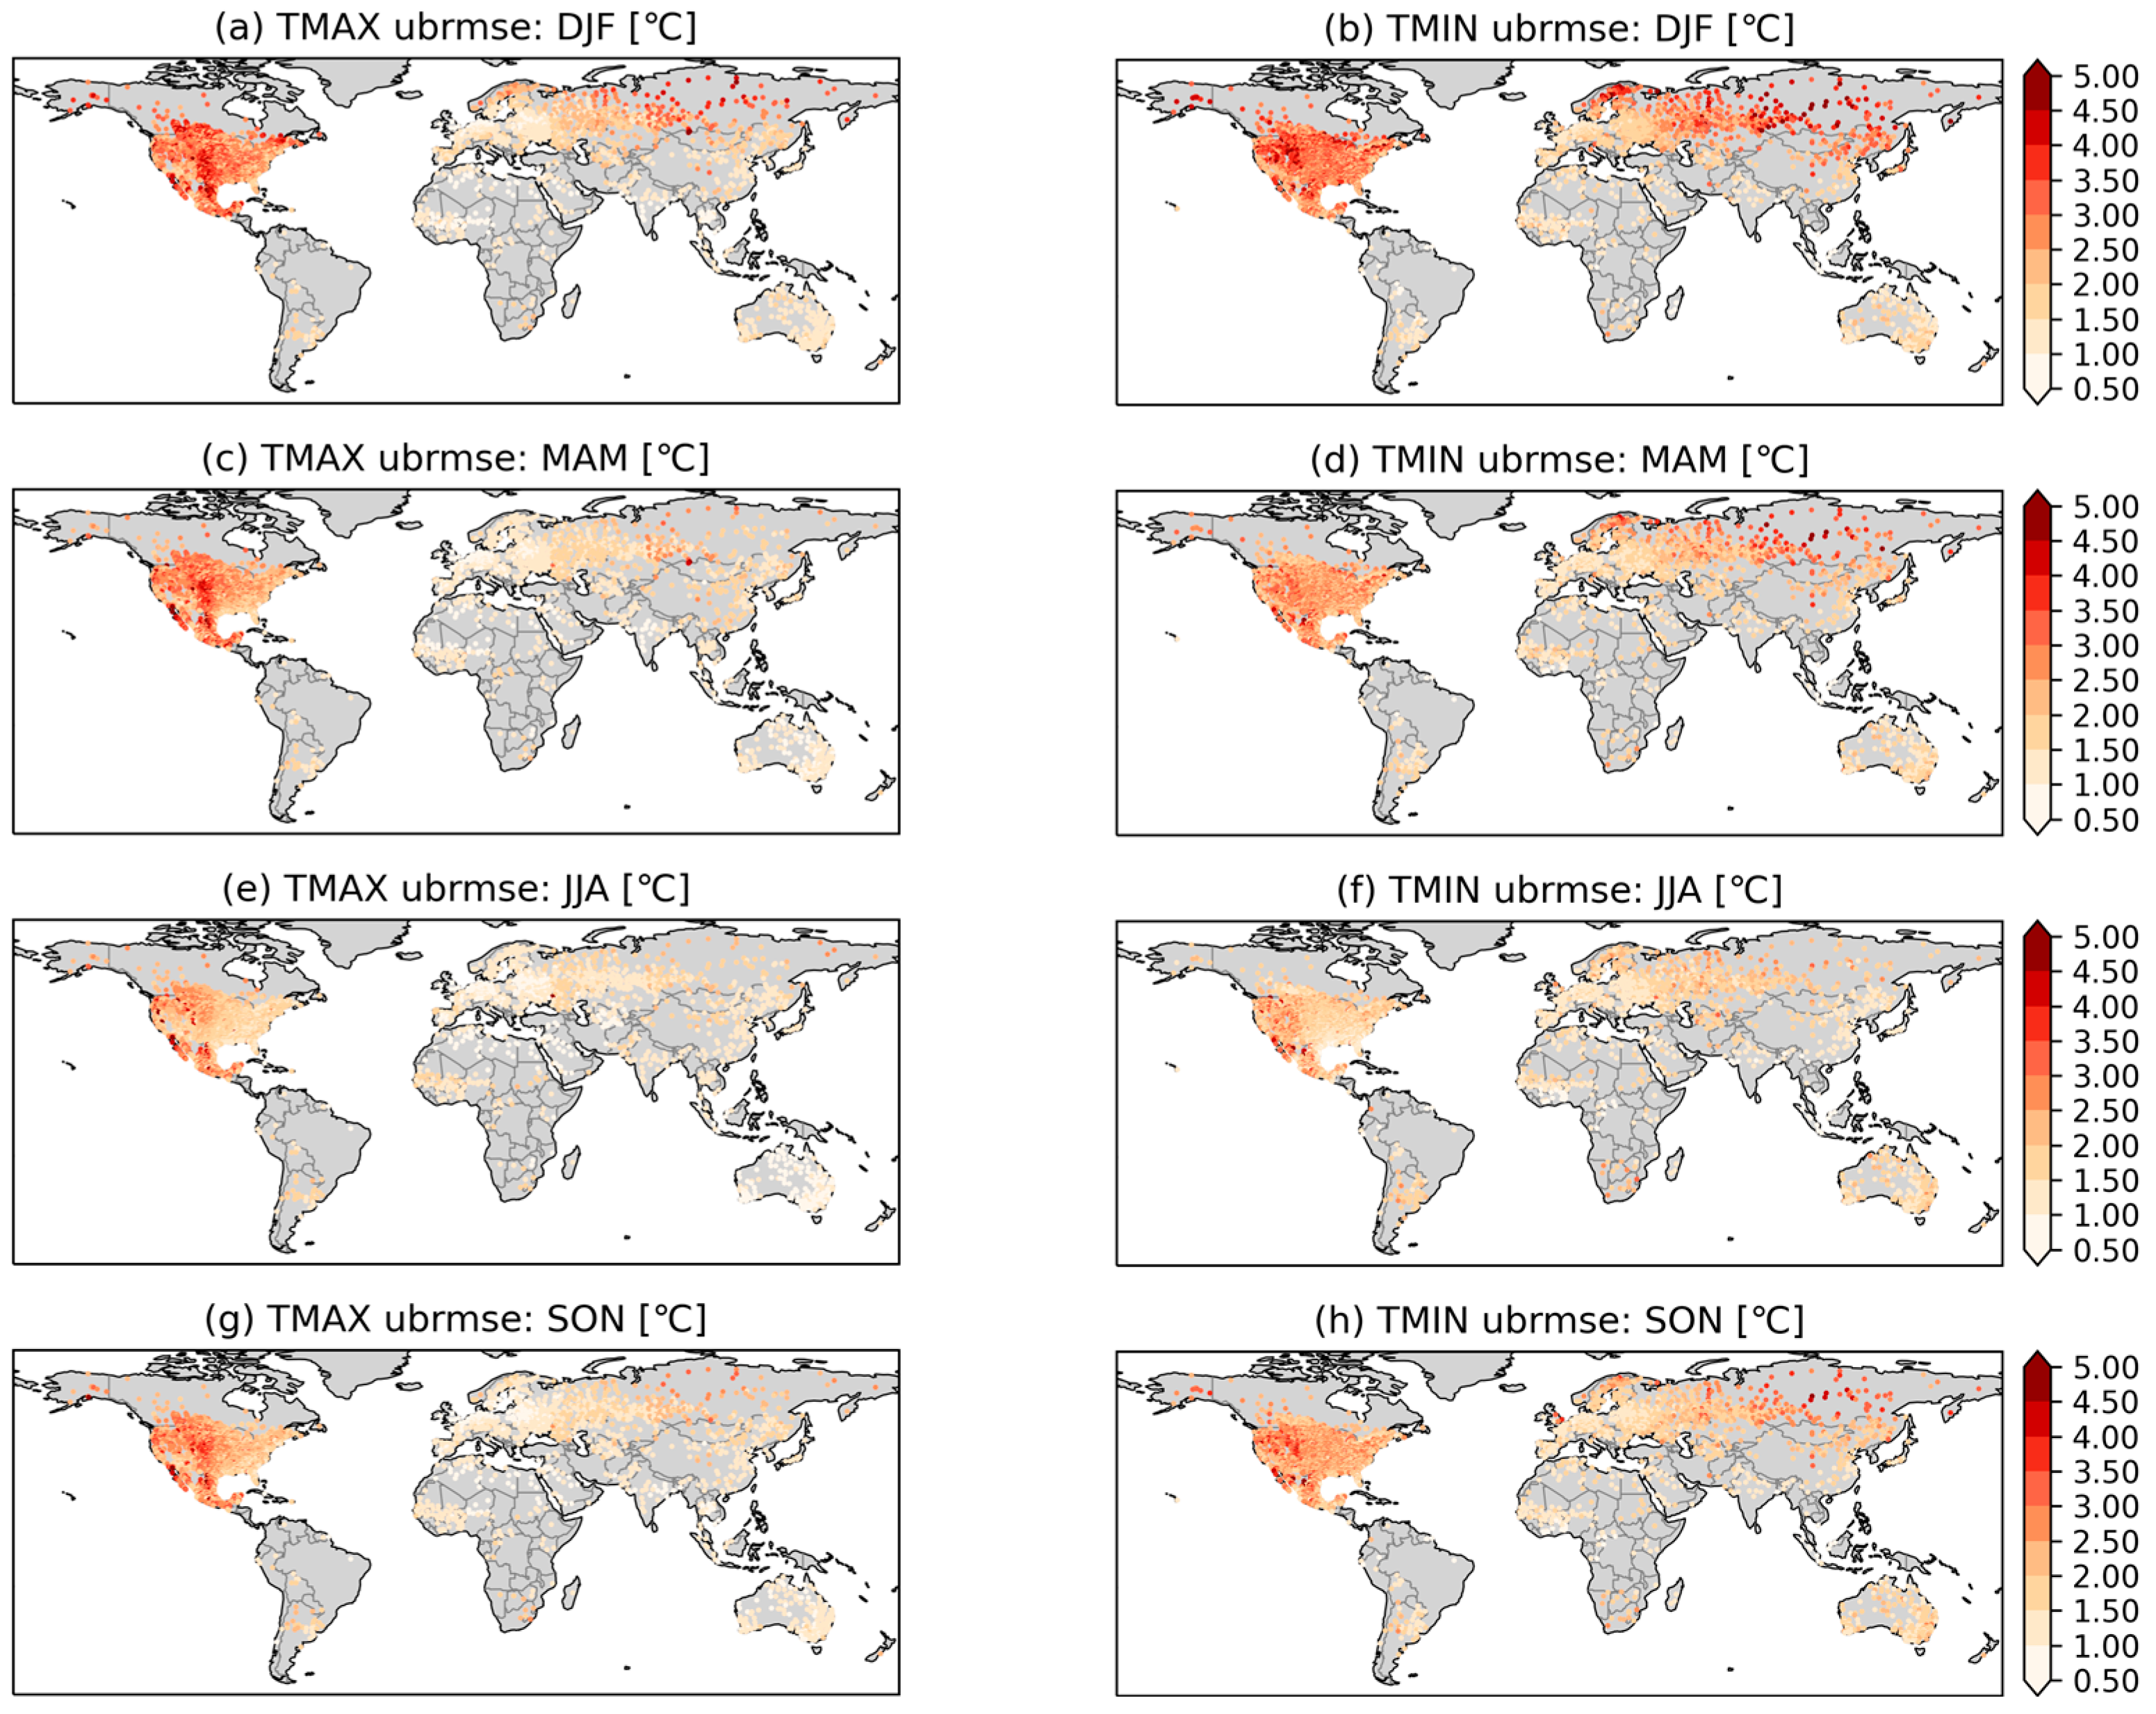
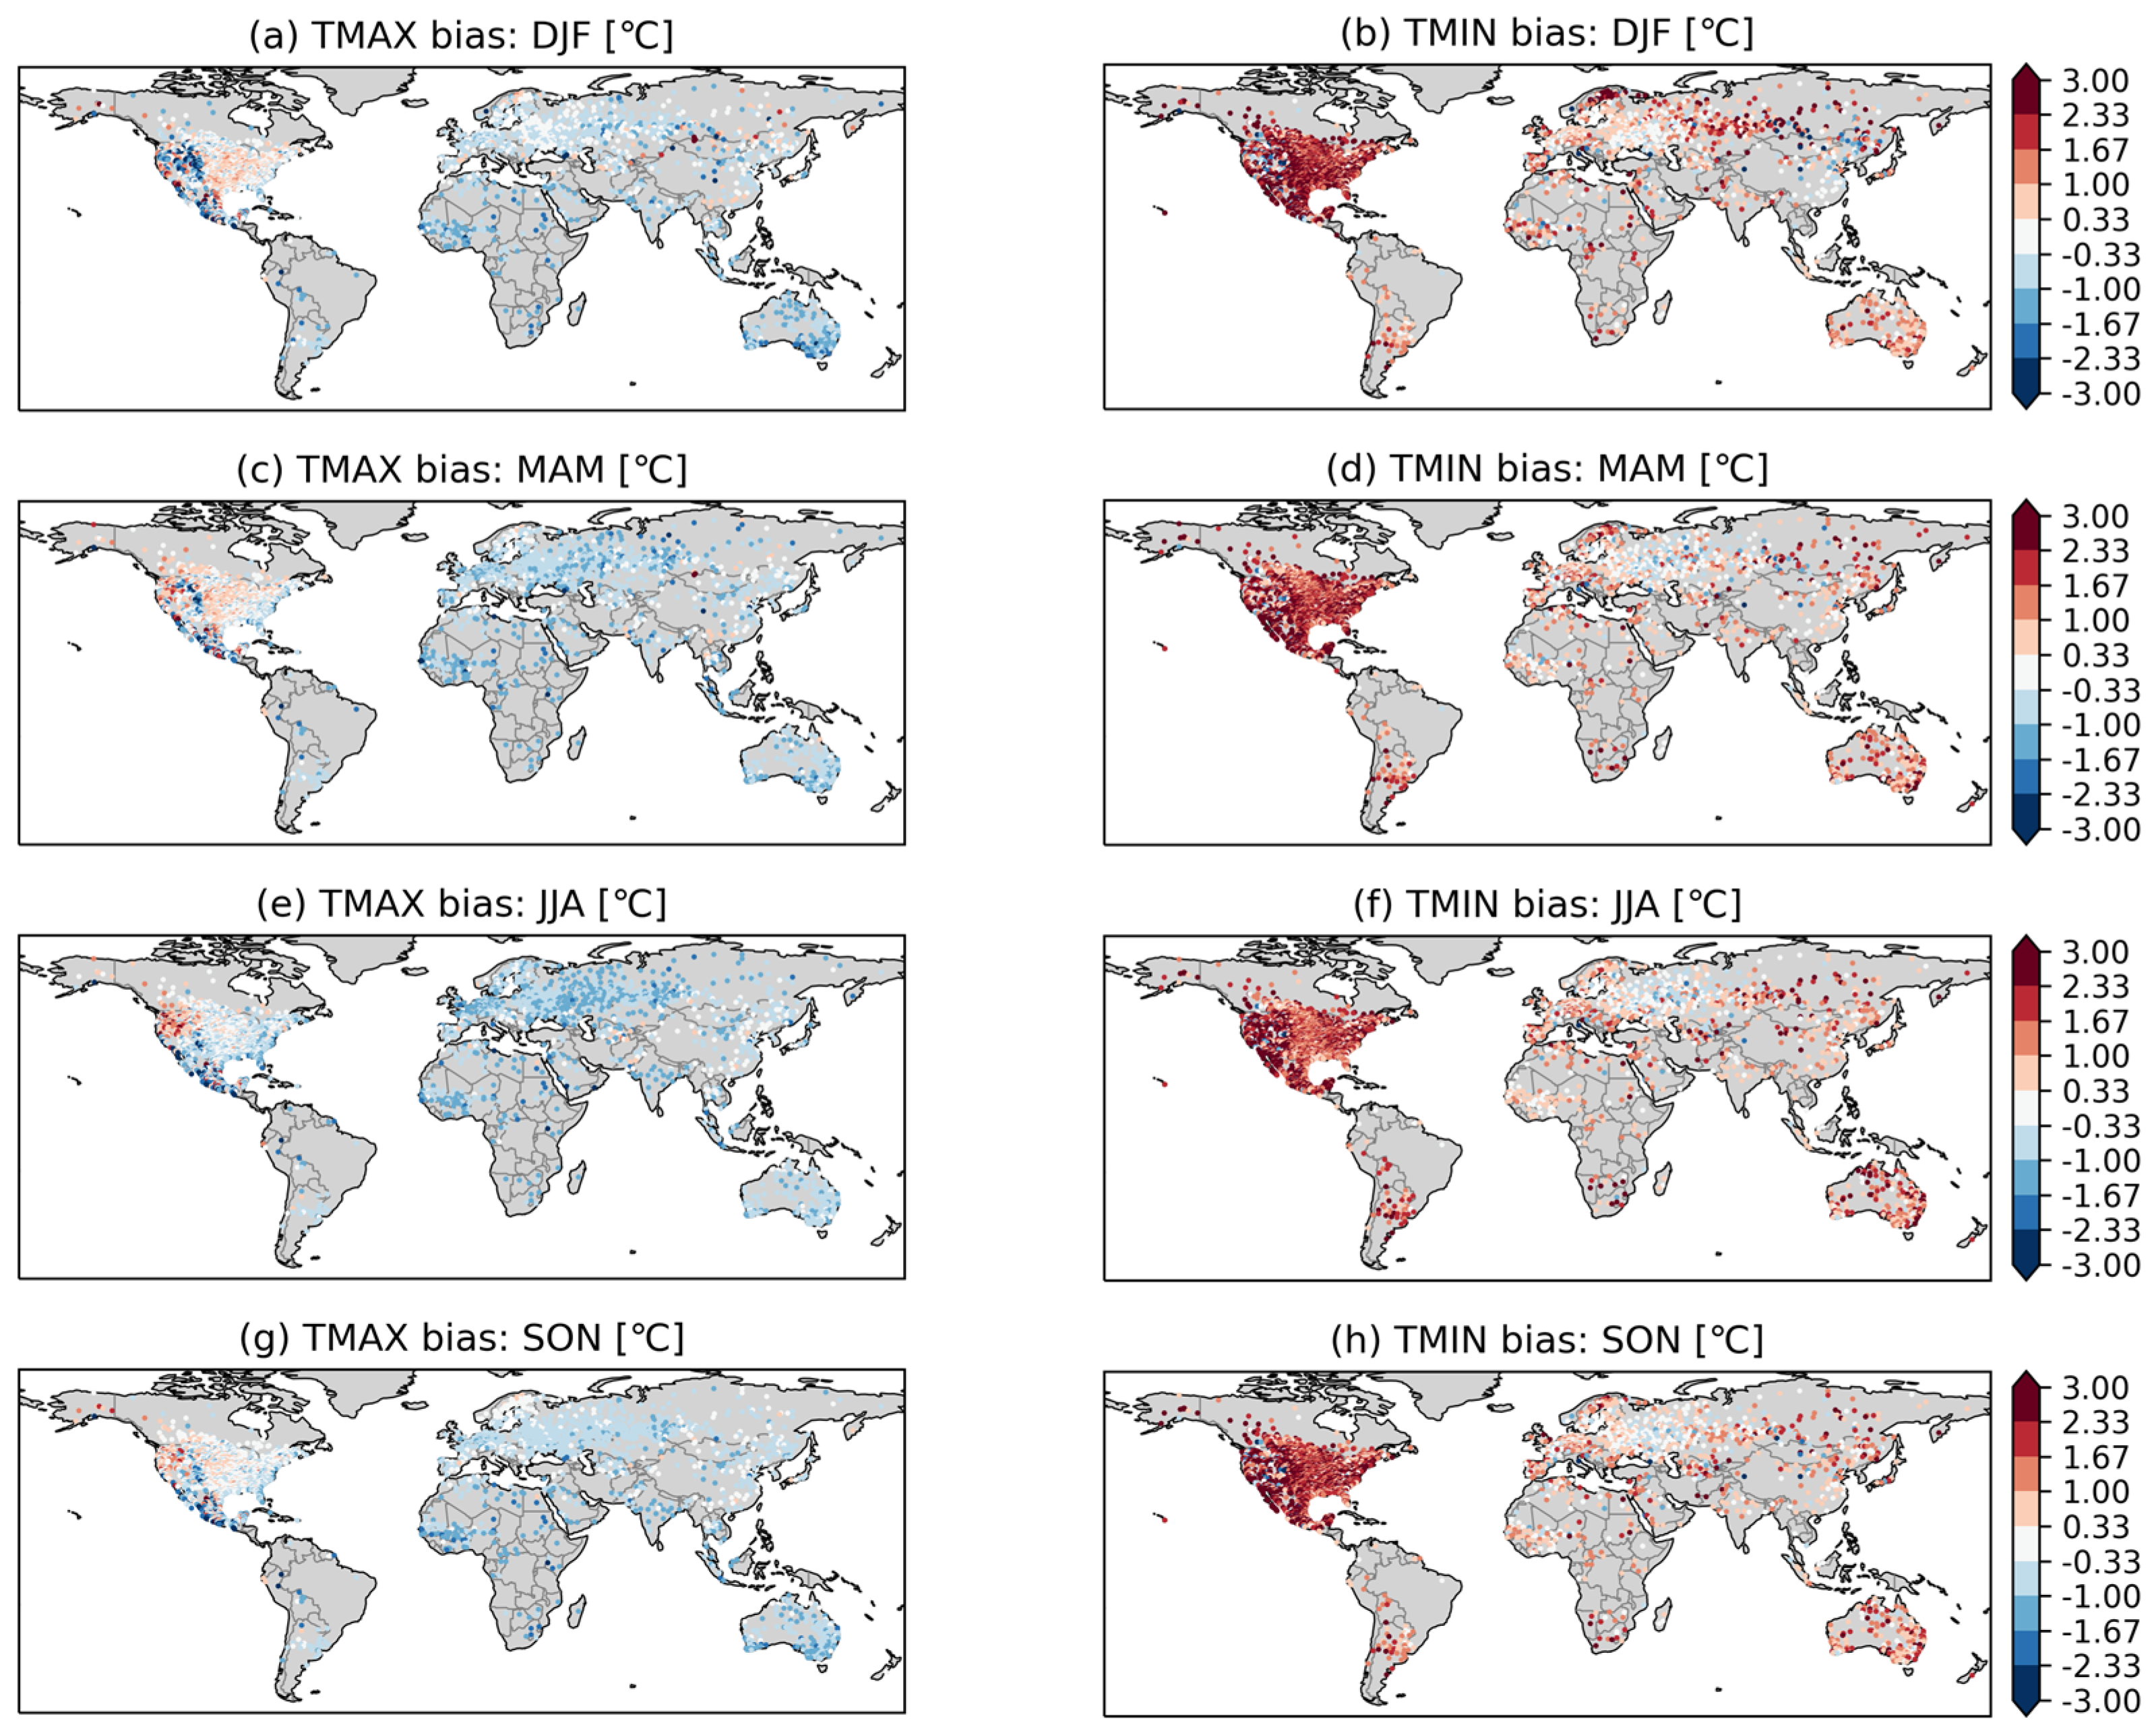
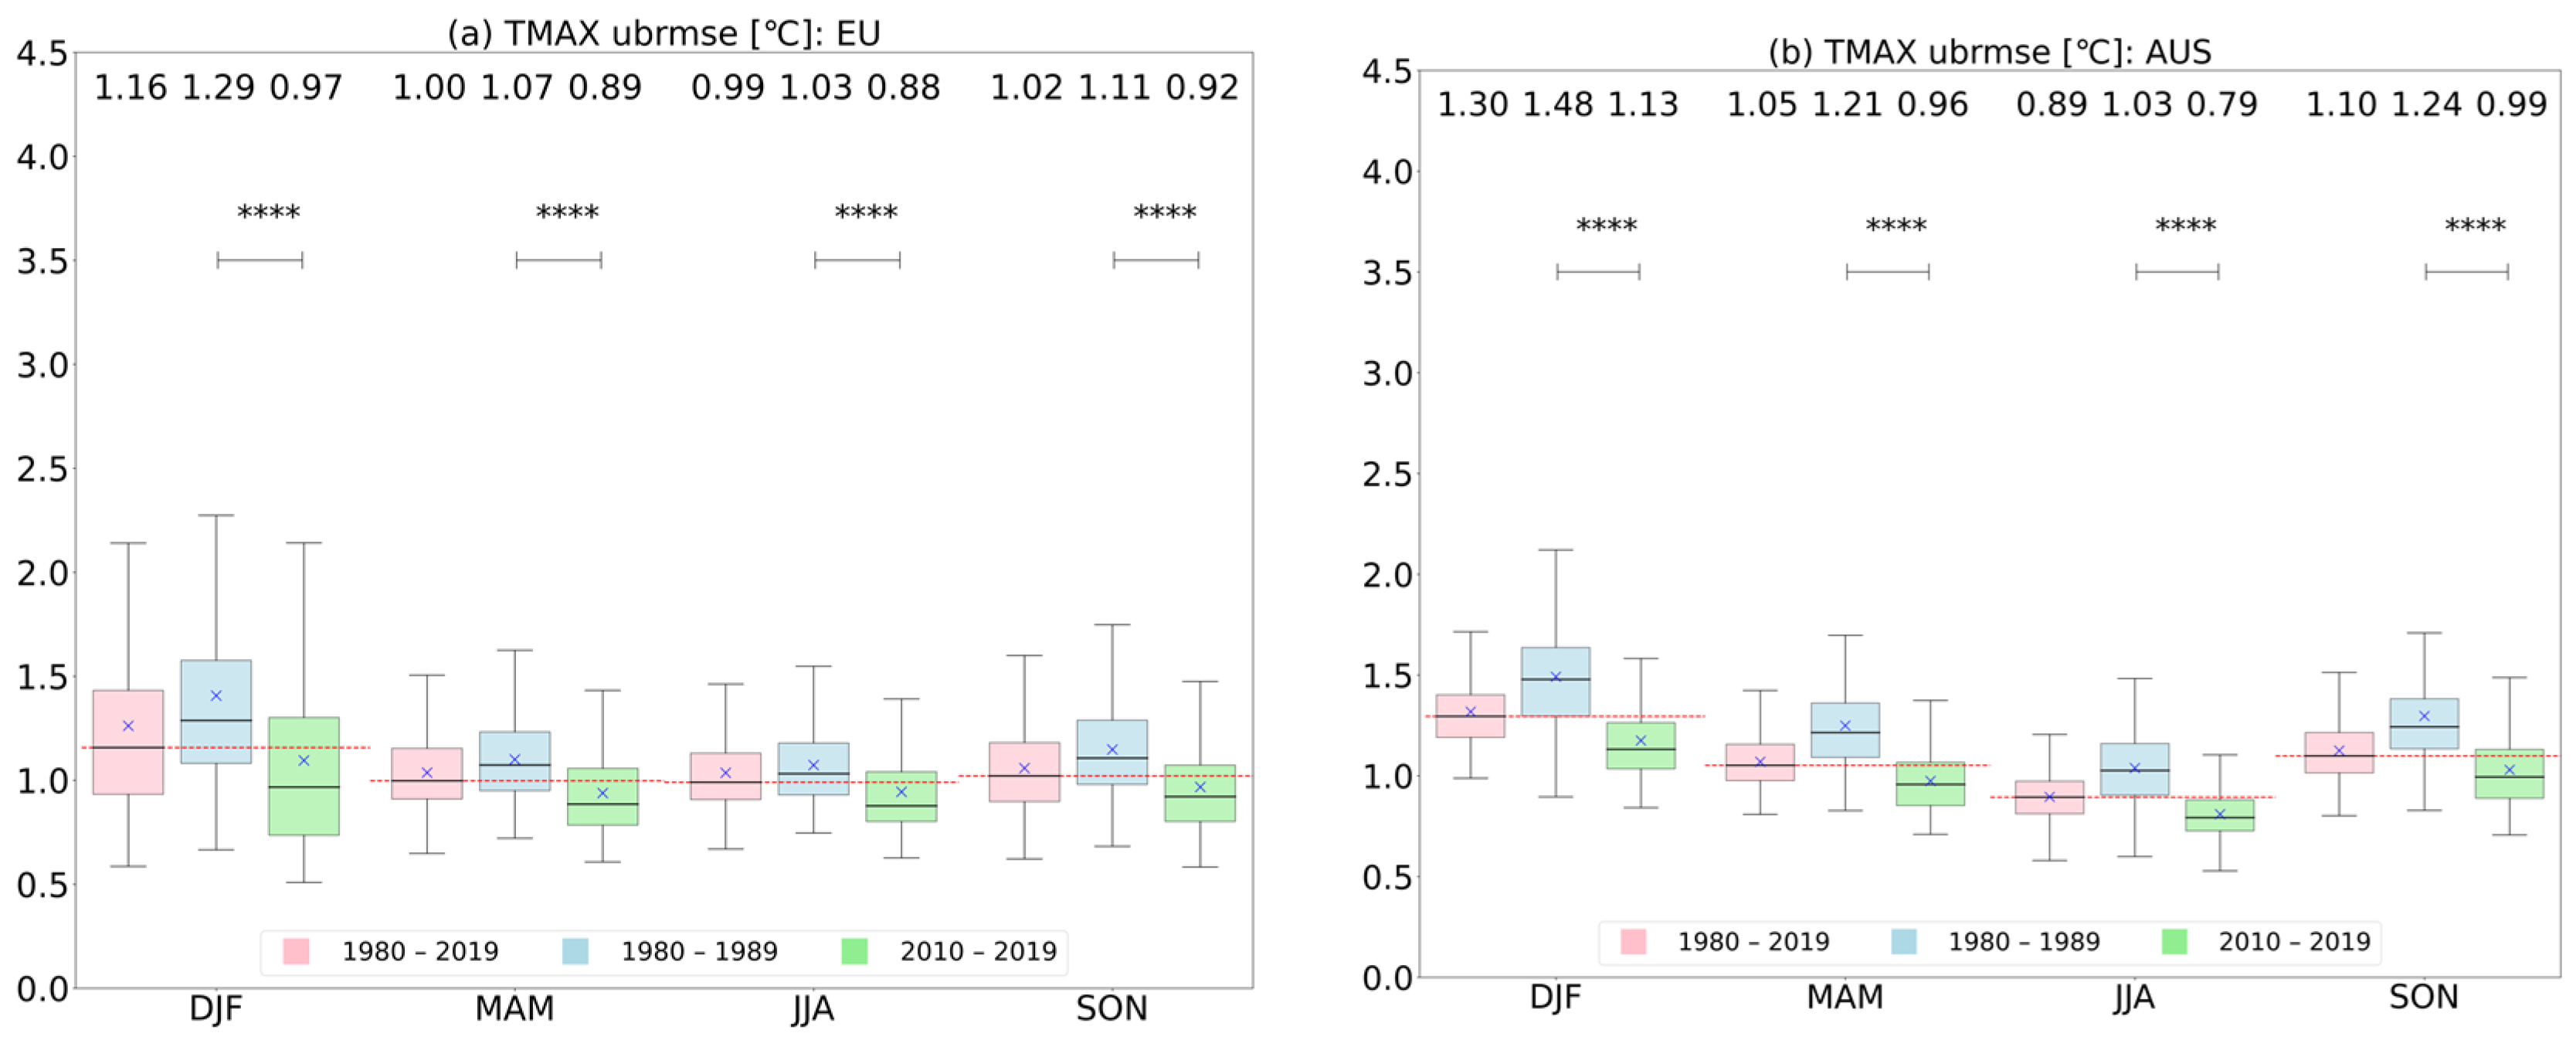
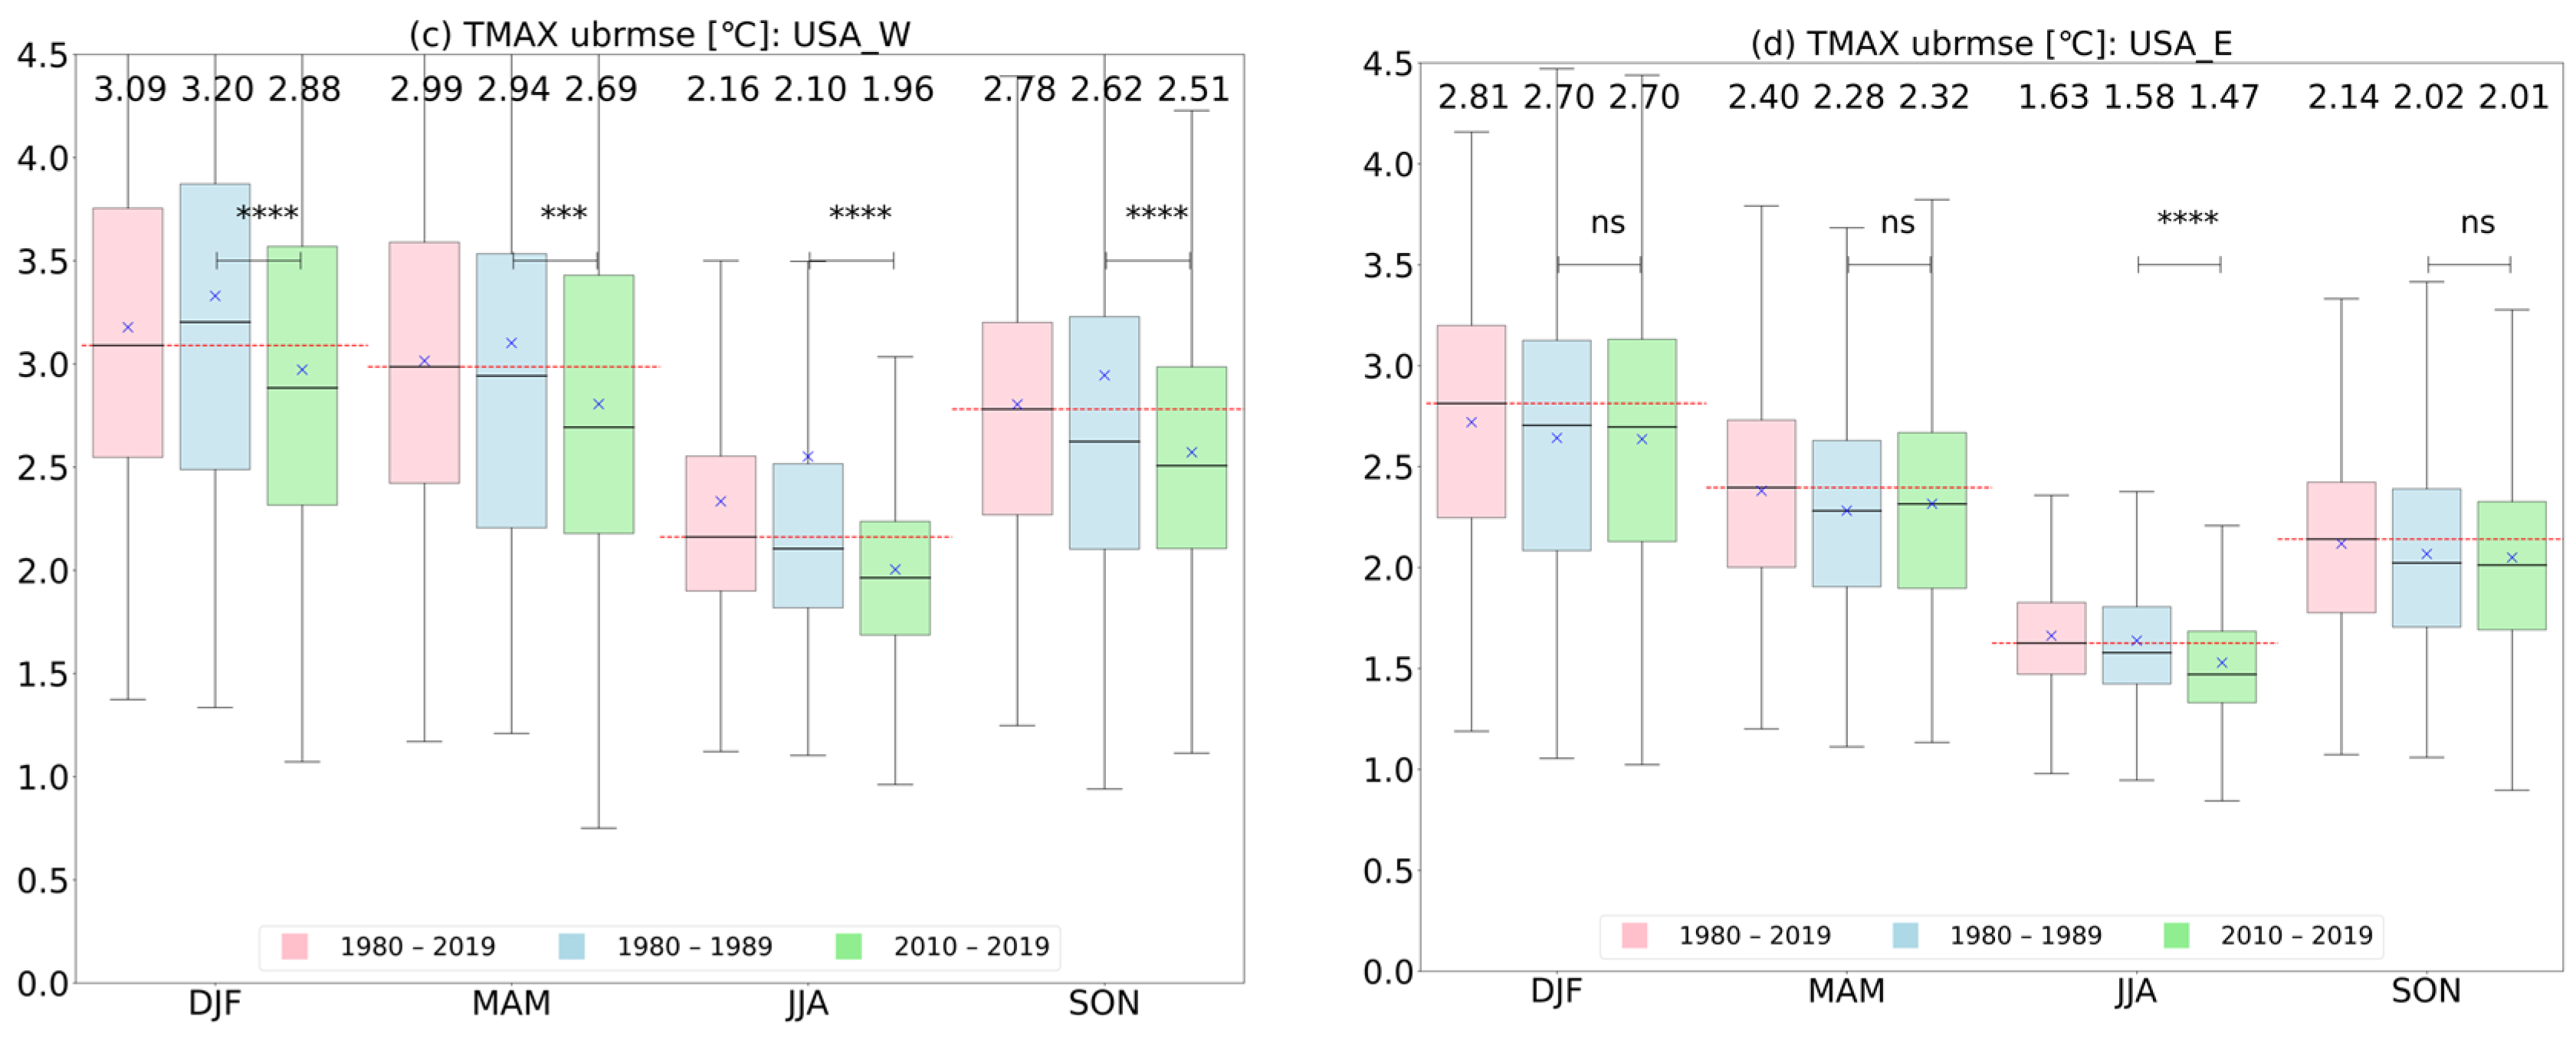
3.1. ERA5 Long-Term Evaluation

We start with the long-term evaluation of ERA5, with Figure 1 showing ubRMSE seasonal mean values for TMAX and TMIN covering a 40-year period (1980–2019). Higher ERA5 errors are found in the NH, particularly in the U.S. across all seasons, as well as in the northern Eurasian region during DJF. For TMAX (Figure 1, left panel), ERA5 shows higher ubRMSEs (1–5 °C) during DJF and MAM over the central-western U.S., with a general error reduction occurring during JJA. Under the same conditions, ERA5 highest ubRMSEs for TMIN (Figure 1, right panel) exceed 5 °C during DJF. In Europe, South America, South Africa, and Australia, ERA5 shows good agreement with observations, with lower ubRMSEs (about 0.50 °C) for TMAX and TMIN. It is worth noting that, in the central-western U.S., ERA5 TMAX bias (Figure 2, left panel) shows a mixed behavior, underestimating temperatures (about −3 °C) in DJF and overestimating (about 1 to 2 °C) in JJA, particularly in the northwestern region. In other regions, ERA5 forecasts of TMAX show a cooling signal extending into SON. This warm/cold bias effect is less visible in TMIN (Figure 2, right panel), showing a predominant ERA5 overestimation (red colors) of more than 3 °C compared to GHCNd throughout the entire period. Conversely, ERA5 TMAX values generally exhibit underestimation (blue colors), except in the U.S. region where the warm/cold bias patterns are visible.
The evaluation is complemented by comparing the ubRMSEs of ERA5 between the decades 2010–2019 and 1980–1989 for TMAX (Figure 3) and TMIN (Figure 4) within the four highest sampling regions. Boxplots are used to display the metric distribution in the selected regions for each season. Each boxplot displays on top the corresponding median value for each period, as well as p-value tests computed for the difference between the 1980s and 2010s. Significance levels are indicated here as follows: significant, when p ≤ 0.0001 (‘****’); less significant, when p ≤ 0.001 (‘***’), 0.01 (‘**’), and 0.05 (‘*’); and not significant, when p > 0.05 (‘ns’). Additionally, the blue cross represents the mean, the thick black solid line denotes the median, and the red dashed line signals the median of the total 40-year period within each season.
Similar behavior is observed for TMAX in Europe (Figure 3a) and Australia (Figure 3b), showing a significant decrease in the ubRMSE from the 1980s to the 2010s through all seasons. This behavior is consistent with the corresponding global ubRMSE differences (Figure S3 left panel, Supplementary Materials), where higher errors usually occur in the 1980s (blue colors). In these two regions, the highest errors are found during DJF (i.e., medians of 1.29 and 1.48 °C, respectively), while lower errors are found during JJA, particularly in the 2010s (i.e., medians of 0.88 and 0.79 °C, respectively). The higher error variation in Europe than in Australia is also noticeable (as depicted by the larger boxplots), particularly during DJF. Generally, ERA5 TMAX analyses for the West and East U.S. regions show higher errors (Figure 3c and Figure 3d, respectively), especially the former, where the highest ubRMSEs are found during DJF in the 1980s (i.e., median of 3.20 °C) and lowest during JJA in the 2010s (i.e., median of 1.96 °C). There is a significant overall error decrease from the 1980s to the 2010s (about 10.00%) in the western region; however, for the eastern region, ubRMSE reduction (with significance) only occurs during JJA (about 6.67%).
ERA5 TMIN analysis exhibits a similar behavior to those of TMAX in Europe and Australia (Figure 4a and Figure 4b, respectively), with a slight increase in ubRMSE magnitude for TMIN, as well as an overall (statistically significant) error decrease between the 1980s and the 2010s. For instance, the ubRMSE decreases from 1.37 to 1.13 °C (about 17.52%) during JJA in Europe, and from 1.61 to 1.39 °C (about 13.66%) during DJF in Australia (corresponding to the austral summer months). In West and East U.S. (Figure 4c and Figure 4d, respectively), ERA5 shows higher errors, particularly in the former during DJF, as well as an overall higher variation (i.e., larger boxplots), being consistent with the TMAX findings. However, lower ubRMSEs are observed in both regions during JJA, although not statistically significant. In terms of TMIN interdecadal variation, a non-significant ubRMSE decrease is observed during JJA, while error increases (statistically significant) typically occur in the remaining seasons. In particular, in East U.S. during DJF, the ubRMSE increases from 2.63 to 3.10 °C, corresponding to an increase of about 17.87%. Overall, TMIN error changes are consistent with global ubRMSE differences (Figure S3 right panel, Supplementary Materials), indicating lower errors in the 2010s (blue colors), except for the Central/Eastern U.S. region from SON to MAM.

3.2. Operational Forecast Evaluation

In this section, we address the evaluation of the ECMWF operational forecasts. Figure 5 presents the seasonal mean differences in ubRMSE between one-day-ahead (1 lead day) operational forecasts and ERA5 analysis over the 5-year period (2017–2021). These results indicate higher errors (red color) in the operational forecasts compared to the reanalysis. Particularly, regions with significantly higher ubRMSEs include high-latitude regions during DJF for TMAX (Figure 5a) and, most noticeably, for TMIN (Figure 5b), where ubRMSE differences exceed 1 °C. Lower ubRMSEs for TMAX and TMIN (blue colors) are observed in the ECMWF forecasts compared to ERA5, especially in West U.S. throughout the entire period, being more pronounced during DJF with ubRMSE differences of about −1 °C. This behavior is reflected in the corresponding bias seasonal mean (absolute value) differences, as shown in Figure S4 (Supplementary Materials). These show that 1-lead-day forecasts generally overestimate (red contours) observations by 1 °C.
Bias time series for TMAX (Figure 6) and TMIN (Figure 7) are shown for the four high-sample regions. A rolling mean (100-day window) is applied for smoothing, along with backward filling for missing values. In this analysis, operational forecasts with up to 5 days lead time are considered, along with ERA5 analysis for comparison purposes. The results show a stable TMAX temporal variation between the different forecast lead times over Europe (Figure 6a), exhibiting higher deviations for larger forecast horizons. Both operational forecasts and reanalysis of TMAX show a similar seasonal cycle, including an overall underestimation with larger biases during JJA (about −1.25 and −1.0 °C, respectively). Similarly, the bias variation in Australia (Figure 6b) follows the seasonal cycle, with the operational forecasts showing a much less pronounced seasonal cycle than ERA5. There is an overall underestimation, with larger biases during the SON periods (about −1.60 °C) that tend to decrease from 2018 onwards. In West U.S. (Figure 6c), operational forecasts of TMAX generally underestimate observations, while ERA5 exhibits the opposite signal with an overall overestimation. From 2018 onwards, operational forecasts show relatively stable biases, with higher values during DJF (around −1.5 °C) and lower values during JJA (between 0.25–0.5 °C). ERA5 analysis shows higher bias variation, with higher values during JJA (around 0.5 °C) and lower values during DJF (close to zero). In East U.S. (Figure 6d), there is a noticeably higher TMAX bias variation compared to other regions, particularly in the operational forecasts, with mixed warm/cold bias signals in the entire period. In comparison, ERA5 shows an overall overestimation, with a well-defined bias seasonal variation, exhibiting higher values during DJF (around 0.6 °C) and lower during JJA (close to zero).
For TMIN (Figure 7), both operational forecasts and ERA5 analysis show a distinct bias variation with an overall overestimation in all regions (as opposed to TMAX), which is consistent with previous results. In Europe (Figure 7a), operational forecasts show higher biases during JJA (between 1–1.5 °C), while lower values are found during DJF, particularly for 4- and 5-lead-day forecasts (close to zero). The operational forecasts tend to exhibit higher TMIN biases than ERA5, with a seasonal variation between 1–2.5 °C. In the U.S., TMIN biases show lower variations than TMAX, with overall larger magnitudes. For West U.S. (Figure 7c), operational forecasts exhibit higher biases during SON (between 2.5–3.5 °C), while those in ERA5 show a more stable behavior for the entire period (around 2 °C). In East U.S. (Figure 7d), TMIN biases are slightly lower than in the western region, with the operational forecasts’ highest values occurring in DJF (between 1.6–2.7 °C), while ERA5′s highest biases are found in MAM (about 2.3 °C).
Following the biases results, the ubRMSE temporal variation for TMAX (Figure 8) and TMIN (Figure 9) is also assessed. Generally, operational forecasts show higher errors (proportional to the forecast horizon) than ERA5 analysis. TMAX error variations in Europe (Figure 8a) and Australia (Figure 8b) are relatively stable, with higher ubRMSE amplitudes in the latter. For 1-lead-day forecasts, higher errors occur during JJA and lower during DJF, with values between 1–1.5 °C (slightly lower in Australia). It is worth noting that there is a higher approximation between 1-lead-day forecasts and ERA5 in Australia than in Europe. Significantly higher TMAX ubRMSEs are found in West and East U.S. (Figure 8c and Figure 8d, respectively). In the former, 1-lead-day and ERA5 forecast error varies between 2.3–3.6 °C (up to 4.3 °C for 5-lead-day forecasts), while in the latter, a slightly lower ubRMSE range between 1.6–2.8 °C (up to 3.7 °C for 5-lead-day forecasts) is observed.
TMIN (Figure 9) ubRMSE variation follows the seasonal cycle with low deviations, particularly between the different lead times. Operational forecasts in Europe (Figure 9a) and Australia (Figure 9b) show higher errors than ERA5, with a closer approximation between 1-lead-day forecasts and ERA5 in Europe. ubRMSEs are higher during DJF (up to 2.4 °C for 1-lead-day forecasts) and lower during JJA (down to 1.6 °C for 1-lead-day forecasts). Higher TMIN errors occur in West and East U.S. (Figure 9c and Figure 9d, respectively), particularly in the former. In both regions, operational forecasts generally have higher errors than ERA5, despite a very close approximation between the two time series, with ubRMSEs oscillating between 2.5–4.5 °C (West U.S.) and between 1.7–3.6 °C (East U.S.).
There is consistency amongst these results and respective TMAX and TMIN ubRMSE seasonal mean values (Figure S5, Supplementary Materials), where the operational forecast error increase (m) grows with the forecast horizon. Other findings include (i) consistently higher ubRMSEs in operational forecasts compared to ERA5; (ii) TMAX minimal ubRMSE variation in Europe (Figure S5a); (iii) the highest increase (0.16 K/day) for TMAX ubRMSEs during DJF in Australia (Figure S5c) and MAM in East U.S. (Figure S5g); (iv) overall higher TMAX ubRMSE during DJF and MAM, particularly in West U.S. (Figure S5e); (v) generally lower error increases for TMIN ubRMSE, except during DJF in Europe with an error increase of 0.13 K/day (Figure S5b); and (vi) the highest TMIN ubRMSEs during DJF, particularly in West U.S. (Figure S5f).

4. Discussion

To assess TMAX and TMIN of ERA5 analysis and ECMWF’s operational forecasts, observations from the GHCN were used. Forecast accuracy is assessed using the ubRMSE metric, which focuses on the non-systematic error component. Due to inherent inconsistencies in GHCN observation time recording, observations were initially submitted to a +/−1 day shift correction based on the lowest ubRMSE at each station. This time-shift correction leads to a substantial error reduction between forecast and observation, particularly for TMAX in the U.S. and for TMIN in Australia and East Asia, while being neutral in the other regions. However, this approach assumes that the time shift is constant in each station throughout the entire period, which might not be the case for several stations. Therefore, errors due to the exact reporting day of the observations are likely to still affect the current analysis.
The ERA5 long-term evaluation (1980–2019) shows systematic TMAX (TMIN) seasonal mean underestimations (overestimations) compared to observations (Figure 2). This is consistent with other results in the literature, including those in Australia [14], Europe [16], and Southeast Asia [15]. Furthermore, TMAX and TMIN ERA5 analyses in the U.S. exhibit mixed biases, with intertwined over- and underestimations throughout the entire period. In this region, where most observations exist, TMAX and TMIN analysis depict higher ubRMSEs in comparison to other regions (Figure 1). This suggests that, despite the time-shift corrections, errors that could be partially attributed to observational uncertainties and model error still exist. There is also a range of GHCN stations in this region that are not assimilated by ERA5. According to [21], GHCNd records include several World Meteorological Organization (WMO) stations, available to be used in ERA5 assimilation. An additional analysis (not detailed here) using the original GHCNd database indicated that out of the initial 29,884 globally distributed stations, 8082 were WMO stations. In Figure S2 (Supplementary Materials), WMO stations are concentrated in Europe and Australia, while the U.S. region has significantly less and unevenly distributed WMO stations (with fewer stations in the western than the eastern region). It is worth noting that determining the exact number of WMO stations used in each ERA5 data assimilation cycle is challenging due to the complexity of the procedure. Nevertheless, in Table S1 (Supplementary Materials), we show the percentage of WMO stations available, which can contribute to increased error, particularly in West U.S., where higher ubRMSEs occur for TMAX and TMIN forecasts (Figure 1, Figure 3, Figure 4, Figure 8, Figure 9 and Figure S5). Specifically, in the western region, only about 5.96 and 5.43% of WMO stations exist for TMAX and TMIN evaluation, while in the eastern region about 12.29 and 9.26% are WMO stations (respectively). In fact, if only WMO stations are considered for analysis, a significant overall error reduction in TMAX (Figure S6) and TMIN (Figure S7) occurs in the U.S. region, particularly in West U.S. Therefore, these results suggest that in Europe and Australia, ERA5 analysis is much more constrained by the same observations used in this study than over the U.S.
The evaluation of change in ERA5 analysis errors between the 2010s and 1980s showed a consistent error reduction in both TMAX and TMIN in all regions, except for TMIN in East U.S (Figure 3 and Figure 4). We hypothesize that the error reduction between the 2010s and 1980s can be primarily attributed to improved constrain of the ERA5 analysis associated with an increased use of satellite data in the data assimilation system. The increased error of TMIN in East U.S. could be attributable to observational errors, but further analyses, which are beyond the scope of this study, are required to clearly understand the causes of the error change.
The ECMWF operational forecasts (2017–2021) generally exhibit higher TMAX and TMIN ubRMSEs from the first day of the forecasts when compared to ERA5 analyses (Figure 5). These can be attributed to the difference between ERA5 analyses that contain observation information, while the forecasts only have the initial conditions constrain. An exception occurs in West U.S., where ERA5 has higher ubRMSEs than operational forecasts, particularly during DJF (Figure 5a), This further supports our hypothesis that in this region, fewer stations were available for assimilation in ERA5 as compared to the eastern region. Daily biases time series in Europe exhibit significant underestimations (overestimations) of TMAX (TMIN) throughout the different forecast lead times and ERA5, as shown in Figure 6a (Figure 7a). In Australia, high deviations occur, particularly for the operational forecasts, resulting in overall underestimation (overestimation) of TMAX (TMIN), as shown in Figure 6b (Figure 7b). TMAX and TMIN ubRMSE time series generally exhibit higher errors in operational forecasts than in ERA5 (Figure 8 and Figure 9, respectively). These clearly show the close relation between WMO station availability (Figure S2) and ERA5 low ubRMSEs. This relation is especially pronounced in Australia, where all stations used for TMAX (Figure 8b) and TMIN (Figure 9b) evaluation are WMO. In this region, in addition to ERA5 lower errors, the ubRMSE differences between ERA5 and operational forecasts are larger in comparison to other regions. In the U.S., the operational forecasts of TMAX and TMIN consistently exhibit larger ubRMSEs than ERA5. In particular, higher errors are observed in West U.S. (Figure 8c and Figure 9c, respectively) as compared to the eastern region (Figure 8d and Figure 9d, respectively). These differences are likely associated with: (i) higher terrain complexity in West U.S. and (ii) higher observational errors in West U.S.

5. Conclusions

In this study, we assessed the performance of daily maximum and minimum temperature forecasts (TMAX and TMIN, respectively) in ERA5 reanalysis and the ECMWF global forecasts, using as reference the Global Historical Climatology Network daily (GHCNd) observations. Two separate analyses were conducted: the ERA5 long-term evaluation (1980–2019) and the ECMWF operational forecasts evaluation (2017–2021), including forecast lead times up to 5 days ahead. Over the 40-year period, ERA5 showed an overall underestimation of TMAX and overestimation of TMIN, as found in other research works [14,15,16]. Mixed warm/cold biases and higher errors (ubRMSEs) prevail in the U.S. region, where GHCNd WMO class station availability for ERA5 assimilation is low, especially in West U.S., as compared to other regions. An interdecadal comparison showed ERA5 errors decreasing from the 1980s to the 2010s, which can be primarily attributed to the increased usage of satellite information. The ECMWF operational forecasts of TMAX and TMIN yield higher ubRMSEs compared to ERA5 analysis. Higher errors for TMAX during the warm season and TMIN during the cold seasons suggest that some of the errors could be partially associated with land–atmosphere interactions: (i) land-cover/vegetation in the warm season and (ii) snow presence and stable boundary layer in the cold season. Moreover, since many stations are located near urban areas, the lack of a specific representation of urban environments in ERA5 and ECMWF forecasts likely impacts the performance of the daily temperature extremes. This aspect is expected to be improved with the upcoming introduction of an urban scheme in the ECMWF model [35].
This work highlighted several consistent systematic errors in ERA5 analysis and ECMWF global forecasts of TMAX and TMIN. Currently, ECMWF is preparing the next IFS cycle, which will include 2-m air temperature assimilation in the 4D-VAR. Therefore, further research towards model refinement and data assimilation is fundamental, particularly due to the relevance of daily air temperature extremes forecasts and reanalysis for operational meteorology and climate monitoring. Future works focusing on extreme events such as heat waves and cold spells are also very relevant to further document and understand the limitations of ERA5 and ECMWF weather forecasts.

Supplementary Materials

The following supporting information can be downloaded at: https://www.mdpi.com/article/10.3390/atmos15010093/s1, The data material includes a list of all GHCNd stations with corresponding time-shift indicators based on ERA5 TMAX and TMIN lowest unbiased root mean square errors (ghcnd_temperature_correction.csv). File content consists in a single.csv file that contains GHCNd stations used for daily temperature extremes evaluation (1980–2019), including original GHCNd headers with station identification, latitude, longitude, elevation, state, name, quality flags, and WMO identification number; and one-day time-shift correction identifiers, corresponding to backward (−1), forward (+1), and no (0) shift; while unused stations are considered as missing number. Additionally, additional results found during the evaluation analysis are provided in a separate Supplementary Materials file, including Figures S1–S7 and Tables S1 and S2.

Author Contributions

Conceptualization, E.D.; Methodology, E.D., F.M.L. and S.B.; Software, F.M.L.; Validation, F.M.L.; Formal Analysis, F.M.L.; Investigation, E.D., F.M.L. and S.B.; Resources, E.D.; Data Curation, F.M.L.; Writing—Original Draft Preparation, F.M.L.; Writing—Review and Editing, F.M.L., E.D. and S.B.; Visualization, F.M.L.; Supervision, E.D.; Project Administration, E.D.; Funding Acquisition, E.D. All authors have read and agreed to the published version of the manuscript.

Funding

This study was funded by the European Union’s Horizon 2020 research and Innovation Programme under Grant Agreement No 958927 “CoCO2—Prototype system for a Copernicus CO2 service”.

Institutional Review Board Statement

Not applicable.

Informed Consent Statement

Not applicable.

Data Availability Statement

The data presented in this study are available on request from the corresponding author. The analyses carried out in this work are based on public and private datasets, which support the results presented. The data are not publicly available due to privacy and restrictions.

Acknowledgments

The authors are thankful to Copernicus and ECMWF, for the availability in providing the needed data produced by ERA5 reanalysis through the climate data store website (https://cds.climate.copernicus.eu, accessed on 17 November 2023) and by the IFS, and to the NOAA’s NCEI for providing access to the GHCN daily database (https://www.ncei.noaa.gov/products/land-based-station/global-historical-climatology-network-daily, accessed on 17 November 2023). The initial support of Bryant Korzeniewski (on behalf of the NCEI’s GHCN-Daily Team) for recommendations in this work towards the observational data is recognized and appreciated. F.M.L. acknowledges the funding for his research grant (H2020-IBA-SPACE-CHE2-2019-958927) by the European Union Horizon 2020 research. The authors would like to thank the anonymous reviewers and editor for their efforts, comments, and suggestions.

Conflicts of Interest

The authors declare no conflicts of interest. The sponsors had no role in the design, execution, interpretation, or writing of the study.

References

  1. Seneviratne, S.I.; Lüthi, D.; Litschi, M.; Schär, C. Land–atmosphere coupling and climate change in Europe. Nature 2006, 443, 205–209. [Google Scholar] [CrossRef] [PubMed]
  2. Jach, L.L.; Schwitalla, T.; Branch, O.; Warrach-Sagi, K.; Wulfmeyer, V. Sensitivity of land-atmosphere coupling strength to perturbations of early-morning temperature and moisture profiles in the European summer. Earth Syst. Dyn. Discuss. 2021, 1–32. [Google Scholar] [CrossRef]
  3. Clarke, B.; Otto, F.; Stuart-Smith, R.; Harrington, L. Extreme weather impacts of climate change: An attribution perspective. Environ. Res. Clim. 2022, 1, 012001. [Google Scholar] [CrossRef]
  4. Fall, S.; Watts, A.; Nielsen-Gammon, J.; Jones, E.; Niyogi, D.; Christy, J.R.; Pielke, R.A. Analysis of the impacts of station exposure on the U.S. Historical Climatology Network temperatures and temperature trends. J. Geophys. Res. Atmos. 2011, 116, 1–15. [Google Scholar] [CrossRef]
  5. Carleton, T.A.; Hsiang, S.M. Social and economic impacts of climate. Science 2016, 353, aad9837. [Google Scholar] [CrossRef] [PubMed]
  6. Quratulann, S.; Ehsan, M.M.; Rabia, E.; Sana, A. Review on climate change and its effect on wildlife and ecosystem. Open J. Environ. Biol. 2021, 6, 008–014. [Google Scholar] [CrossRef]
  7. Domeisen, D.I.V.; Eltahir, E.A.B.; Fischer, E.M.; Knutti, R.; Perkins-Kirkpatrick, S.E.; Schär, C.; Seneviratne, S.I.; Weisheimer, A.; Wernli, H. Prediction and projection of heatwaves. Nat. Rev. Earth Environ. 2022, 4, 36–50. [Google Scholar] [CrossRef]
  8. Russo, S.; Dosio, A.; Graversen, R.G.; Sillmann, J.; Carrao, H.; Dunbar, M.B.; Singleton, A.; Montagna, P.; Barbola, P.; Vogt, J.V. Magnitude of extreme heat waves in present climate and their projection in a warming world. J. Geophys. Res. Atmos. 2014, 119, 12500–12512. [Google Scholar] [CrossRef]
  9. Working Group I Contribution to the Sixth Assessment Report of the Intergovernmental Panel on Climate Change. In Weather and Climate Extreme Events in a Changing Climate; Cambridge University Press: Cambridge, UK, 2021. [CrossRef]
  10. Vautard, R.; van Oldenborgh, G.J.; Bonnet, R.; Li, S.; Robin, Y.; Kew, S.; Philip, S.; Soubeyroux, J.-M.; Dubuisson, B.; Viovy, N.; et al. Human influence on growing-period frosts like in early April 2021 in central France. Nat. Hazards Earth Syst. Sci. 2022, 23, 1045–1058. [Google Scholar] [CrossRef]
  11. Bauer, P.; Thorpe, A.; Brunet, G. The quiet revolution of numerical weather prediction. Nature 2015, 525, 47–55. [Google Scholar] [CrossRef]
  12. Dutra, E.; Johannsen, F.; Magnusson, L. Late Spring and Summer Subseasonal forecasts in the Northern Hemisphere midlatitudes: Biases and skill in the ECMWF model. Mon. Weather Rev. 2021, 149, 2659–2671. [Google Scholar] [CrossRef]
  13. McDonnell, J.; Lambkin, K.; Fealy, R.; Hennessy, D.; Shalloo, L.; Brophy, C. Verification and bias correction of ECMWF forecasts for Irish weather stations to evaluate their potential usefulness in grass growth modelling. Meteorol. Appl. 2018, 25, 292–301. [Google Scholar] [CrossRef]
  14. Biswas, M.R.; Alzubaidi, M.S.; Shah, U.; Abd-Alrazaq, A.A.; Shah, Z. A Scoping Review to Find out Worldwide COVID-19 Vaccine Hesitancy and Its Underlying Determinants. Vaccines 2021, 9, 1243. [Google Scholar] [CrossRef] [PubMed]
  15. Li, X.-X. Heat wave trends in Southeast Asia during 1979–2018: The impact of humidity. Sci. Total Environ. 2020, 721, 137664. [Google Scholar] [CrossRef]
  16. Velikou, K.; Lazoglou, G.; Tolika, K.; Anagnostopoulou, C. Reliability of the ERA5 in Replicating Mean and Extreme Temperatures across Europe. Water 2022, 14, 543. [Google Scholar] [CrossRef]
  17. Betts, A.K.; Chan, D.Z.; Desjardins, R.L. Near-Surface Biases in ERA5 Over the Canadian Prairies. Front. Environ. Sci. 2019, 7, 129. [Google Scholar] [CrossRef]
  18. Nogueira, M.; Boussetta, S.; Balsamo, G.; Albergel, C.; Trigo, I.F.; Johannsen, F.; Miralles, D.G.; Dutra, E. Upgrading Land-Cover and Vegetation Seasonality in the ECMWF Coupled System: Verification With FLUXNET Sites, METEOSAT Satellite Land Surface Temperatures, and ERA5 Atmospheric Reanalysis. J. Geophys. Res. Atmos. 2021, 126, e2020JD034163. [Google Scholar] [CrossRef]
  19. Nogueira, M.; Albergel, C.; Boussetta, S.; Johannsen, F.; Trigo, I.F.; Ermida, S.L.; Martins, J.P.A.; Dutra, E. Role of vegetation in representing land surface temperature in the CHTESSEL (CY45R1) and SURFEX-ISBA (v8.1) land surface models: A case study over Iberia. Geosci. Model Dev. 2020, 13, 3975–3993. [Google Scholar] [CrossRef]
  20. Johannsen, F.; Ermida, S.; Martins, J.P.A.; Trigo, I.F.; Nogueira, M.; Dutra, E. Cold Bias of ERA5 Summertime Daily Maximum Land Surface Temperature over Iberian Peninsula. Remote Sens. 2019, 11, 2570. [Google Scholar] [CrossRef]
  21. Menne, M.J.; Durre, I.; Vose, R.S.; Gleason, B.E.; Houston, T.G. An Overview of the Global Historical Climatology Network-Daily Database. J. Atmos. Ocean. Technol. 2012, 29, 897–910. [Google Scholar] [CrossRef]
  22. Alexander, L.V.; Zhang, X.; Peterson, T.C.; Caesar, J.; Gleason, B.; Tank, A.M.G.K.; Haylock, M.; Collins, D.; Trewin, B.; Rahimzadeh, F.; et al. Global observed changes in daily climate extremes of temperature and precipitation. J. Geophys. Res. Atmos. 2006, 111, 1042–1063. [Google Scholar] [CrossRef]
  23. Dutra, E.; Muñoz-Sabater, J.; Boussetta, S.; Komori, T.; Hirahara, S.; Balsamo, G. Environmental Lapse Rate for High-Resolution Land Surface Downscaling: An Application to ERA5. Earth Space Sci. 2020, 7, e2019EA000984. [Google Scholar] [CrossRef]
  24. McNicholl, B.; Lee, Y.H.; Campbell, A.G.; Dev, S. Evaluating the Reliability of Air Temperature From ERA5 Reanalysis Data. IEEE Geosci. Remote Sens. Lett. 2022, 19, 1–5. [Google Scholar] [CrossRef]
  25. Zhang, P.; Bounoua, L.; Imhoff, M.L.; Wolfe, R.E.; Thome, K. Comparison of MODIS Land Surface Temperature and Air Temperature over the Continental USA Meteorological Stations. Can. J. Remote Sens. 2014, 40, 110–122. [Google Scholar]
  26. Durre, I.; Menne, M.J.; Gleason, B.E.; Houston, T.G.; Vose, R.S. Comprehensive Automated Quality Assurance of Daily Surface Observations. J. Appl. Meteorol. Clim. 2010, 49, 1615–1633. [Google Scholar] [CrossRef]
  27. Menne, M.J.; Williams, C.N.; Vose, R.S. The U.S. Historical Climatology Network Monthly Temperature Data, Version 2. Bull. Am. Meteorol. Soc. 2009, 90, 993–1008. [Google Scholar] [CrossRef]
  28. Peterson, T.C.; Zhang, X.; Brunet-India, M.; Vázquez-Aguirre, J.L. Changes in North American extremes derived from daily weather data. J. Geophys. Res. Atmos. 2008, 113, 1–9. [Google Scholar] [CrossRef]
  29. Reek, T.; Doty, S.R.; Owen, T.W. A Deterministic Approach to the Validation of Historical Daily Temperature and Precipitation Data from the Cooperative Network. Bull. Am. Meteorol. Soc. 1992, 73, 753–762. [Google Scholar] [CrossRef]
  30. Vose, R.S.; Williams, C.N.; Peterson, T.C.; Karl, T.R.; Easterling, D.R. An evaluation of the time of observation bias adjustment in the U.S. Historical Climatology Network. Geophys. Res. Lett. 2003, 30, 1–4. [Google Scholar] [CrossRef]
  31. Kumar, S.; Mocko, D.; Vuyovich, C.; Peters-Lidard, C. Impact of Surface Albedo Assimilation on Snow Estimation. Remote Sens. 2020, 12, 645. [Google Scholar] [CrossRef]
  32. Mutti, P.R.; Dubreuil, V.; Bezerra, B.G.; Arvor, D.; De Oliveira, C.P.; Santos e Silva, C. Assessment of Gridded CRU TS Data for Long-Term Climatic Water Balance Monitoring over the São Francisco Watershed, Brazil. Atmosphere 2020, 11, 1207. [Google Scholar] [CrossRef]
  33. Haiden, T.; Janousek, M.; Vitart, F.; Ben-Bouallegue, Z.; Ferranti, L.; Prates, F.; Richardson, D. Evaluation of ECMWF Forecasts, Including the 2021 Upgrade; Technical Memorandum 902; ECMWF: Reading, UK, 2022. [Google Scholar] [CrossRef]
  34. Hersbach, H.; Bell, B.; Berrisford, P.; Hirahara, S.; Horányi, A.; Muñoz-Sabater, J.; Nicolas, J.; Peubey, C.; Radu, R.; Schepers, D.; et al. The ERA5 global reanalysis. Q. J. R. Meteorol. Soc. 2020, 146, 1999–2049. [Google Scholar] [CrossRef]
  35. McNorton, J.; Agustí-Panareda, A.; Arduini, G.; Balsamo, G.; Bousserez, N.; Boussetta, S.; Chericoni, M.; Choulga, M.; Engelen, R.; Guevara, M. An Urban Scheme for the ECMWF Integrated Forecasting System: Global Forecasts and Residential CO2 Emissions. Geosci. Model Dev. 2023, 15, e2022MS003286. [Google Scholar] [CrossRef]
Figure 1. Unbiased root mean square error (ubRMSE) for TMAX and TMIN seasonal mean values (°C) between ERA5 and GHCNd observations (1980–2019), computed independently at each station location. Results are provided for TMAX (a,c,e,g) and TMIN (b,d,f,h) respectively for DJF, MAM, JJA, SON.
Atmosphere 15 00093 g001
Figure 2. Same as Figure 1 but for the bias seasonal mean values (°C). Results are provided for TMAX (a,c,e,g) and TMIN (b,d,f,h) respectively for DJF, MAM, JJA, SON.
Atmosphere 15 00093 g002
Figure 3. Boxplots for unbiased root mean square errors (ubRMSEs) of TMAX (°C) between ERA5 and GHCNd observations over different periods (1980–2019, 1980s, and 1990s), computed independently for each season (DJF, MAM, JJA, SON) and region: Europe (a), Australia (b), West U.S. (c), and East U.S. (d). Each boxplot includes the mean (blue cross), median (thick black solid line), and median of the 40-year period (red dashed line). Significance tests (p-values) between the 2010s and 1980s are added above corresponding boxes, being attributed as: significant, when p ≤ 0.0001 (‘****’); less significant, when p ≤ 0.001 (‘***’); and not significant, when p > 0.05 (‘ns’). All panels share the same xx and yy axes.
Atmosphere 15 00093 g003aAtmosphere 15 00093 g003b
Figure 4. Same as Figure 3 but for TMIN (°C) over Europe (a), Australia (b), West U.S. (c), and East U.S. (d). Significance levels are indicated here as follows: significant, when p ≤ 0.0001 (‘****’); less significant, when p ≤ 0.05 (‘*’); and not significant, when p > 0.05 (‘ns’).
Atmosphere 15 00093 g004
Figure 5. Unbiased root mean square error (ubRMSE) for TMAX and TMIN seasonal mean differences (°C) between the one-day-ahead (lead 1) forecasts and ERA5 (2017–2021), computed independently at each GHCNd station location. Results are provided for TMAX (a,c,e,g) and TMIN (b,d,f,h) respectively for DJF, MAM, JJA, SON.
Atmosphere 15 00093 g005
Figure 6. Time series (rolling means, window size = 100 days) for TMAX bias (°C) between operational forecasts and ERA5 (April 2017–December 2021), using GHCNd observations. Metrics are computed independently for each region: Europe (a), Australia (b), West U.S. (c), and East U.S. (d). Different lead day forecasts include 1 lead (L1, blue line), 2 lead (L2, light-blue line), 3 lead–5 lead (L3–L5, in shades of green); in addition to ERA5 predictions (red line). All panels share different xx and yy axes.
Atmosphere 15 00093 g006
Figure 7. Same as Figure 6 but for TMIN (°C) bias over Europe (a), Australia (b), West U.S. (c), and East U.S. (d).
Atmosphere 15 00093 g007aAtmosphere 15 00093 g007b
Figure 8. Same as Figure 6 but for TMAX (°C) unbiased root mean square error (ubRMSE) over Europe (a), Australia (b), West U.S. (c), and East U.S. (d). All panels share the same xx and yy axes.
Atmosphere 15 00093 g008aAtmosphere 15 00093 g008b
Figure 9. Same as Figure 6 but for TMIN (°C) unbiased root mean square error (ubRMSE) over Europe (a), Australia (b), West U.S. (c), and East U.S. (d). All panels share the same xx and yy axes.
Atmosphere 15 00093 g009
Disclaimer/Publisher’s Note: The statements, opinions and data contained in all publications are solely those of the individual author(s) and contributor(s) and not of MDPI and/or the editor(s). MDPI and/or the editor(s) disclaim responsibility for any injury to people or property resulting from any ideas, methods, instructions or products referred to in the content.

