Abstract
Warm zone rainstorms and frontal rainstorms are two types of rainstorms that often occur in the rainy season in Jiangxi (located in the eastern part of China). The ability to correctly identify the type of rainstorms is important for accurate forecasting of rainstorms. Two heavy rainstorms took place in Jiangxi province. The first heavy rainstorm occurred from 20:00 BJT (Beijing Time) on 6 June to 20:00 BJT on 9 June (referred to as the “6.9” process) and another heavy rainstorm occurred from 20:00 BJT on 21 June to 20:00 BJT on 22 June (referred to as the “6.9” process), 2019. We analyzed the two rainstorms’ processes by using ground-based observation data, NCEP/FNL reanalysis data, ECMWF and CMA-SH9 numerical forecasting products. The results show that: “6.9” process is a warm area rainstorm, and a strong northeast cold vortex exists at 500 hPa geopotential height. The northwesterly flow behind the northeast cold vortex trough is stronger. The position of the northern edge of the subtropical high pressure is more south than that at “6.22” process. The rainstorm is in the precipitation zone of the warm temperature ridge over 925 hPa geopotential height, and with more convective character than “6.22” process. The process of “6.22” is a frontal rainstorm. The convective character of precipitation is weaker. The rainstorm precipitation zones are in a strong temperature front area at 925 hPa geopotential height and there is a tendency for vertical convection to develop into oblique upward convection in the late stage of the rainstorm. The precipitation location and intensity forecast by CMA-SH9 at the “6.9” process is better than that of ECMWF, while ECMWF’s prediction of the precipitation zone and weather condition of the “6.22” process is better.
1. Introduction
Heavy rainfall (total precipitation ≥ 50 mm·day−1) is a hazardous weather phenomenon that often leads to severe natural disasters, including landslides, debris flows, and flash floods, posing significant risks to human lives and property [1,2,3,4]. It is also a prominent meteorological hazard in Jiangxi province, China [5]. Located in the subtropical monsoon climate zone, the southern part of Jiangxi province is frequently affected by heavy rainfall associated with the warm zone in southern China, making it more prone to convective heavy rainfall processes [6,7]. In the north-central region of Jiangxi, the interaction between cold and warm air masses is frequent, resulting in more frequent frontal rainstorms and warm zone rainstorms [8,9]. Particularly during the rainy season in June and July, there is a frequent transition between rainy front storms and warm zone storms in the north-central region of Jiangxi, making the forecast of heavy rainfall in Jiangxi more complex.
In recent years, significant advancements in numerical forecasting and other key technologies have provided clearer insights into the structure and maintenance mechanisms of the Meiyu front in the middle and lower reaches of the Yangtze River [10,11,12]. Studies focusing on the evolution of small- and medium-scale systems associated with the Meiyu front have made notable progress [13,14], while weather models have continually improved [15,16,17]. Some studies have classified the circulation patterns of warm zone heavy rainfall in the middle and lower reaches of the Yangtze River, suggesting further subdivisions such as warm zone heavy rainfall ahead of the cold front, warm shear warm zone heavy rainfall, and other types [18,19,20]. An analysis of the main rainstorm processes in the Yangtze River basin from June to July 2016–2020 revealed that the primary influencing systems in the middle and lower layers are shear lines, low vortices, and typhoon-inverted troughs. Additionally, half of the precipitation processes in the boundary layer occur in the warm zone or under the influence of stationary fronts. This underscores the significance of frontal rainstorms and warm zone heavy rainfall in shaping the rainfall patterns during the flood season in the middle and lower reaches of the Yangtze River basin [21].
Despite the progress achieved in enhancing the understanding of frontal storms and warm zone rainfall through previous studies, a significant number of forecasters still face challenges in quickly distinguishing between the thermodynamic structures or weather systems associated with these two types of storms. Consequently, biased or even erroneous forecasts of storm precipitation zones occasionally occur [22,23]. One common mistake involves plotting the forecast precipitation zone of the storm near the location of low-level shear lines (particularly at 850 hPa geopotential height). Shear lines are prevalent weather-influencing systems in the lower atmosphere and are closely linked to heavy rainfall occurrences [24,25]. Moreover, they tend to facilitate the sustained formation of mesoscale system perturbations and train effects, resulting in a broader range of rainstorms [26,27,28].
However, heavy rainfall can arise from various weather circulation conditions and weather systems, not all of which precisely align with the location of the low-level shear line. For instance, warm zone heavy rainfalls often occur on the warm side of the shear line at 850 hPa geopotential height. Therefore, even in cases where the shear line is situated similarly, it is imperative to comprehensively consider the characteristics of the environmental field and the distribution of physical quantities to make a more accurate judgment regarding the rainstorm precipitation zone.
When the main rain band of a Meiyu front storm exhibits no significant spatial or temporal variation, both subjective and objective forecasting demonstrate high accuracy [29]. However, forecasting errors tend to be considerably larger when there is significant variation. The forecasting capabilities of different numerical models also differ for warm zone rainstorms and frontal rainstorms. In some cases, although the forecast of the rainfall area is incorrect, the forecast of the situation in the lower and middle atmosphere is accurate, providing valuable clues for revising the rainfall area [30,31]. This requires forecasters to thoroughly examine the performance of numerical model forecasts, considering the influencing systems and weather elements. Additionally, it is necessary to analyze the forecasting characteristics of different numerical models based on the formation conditions or mechanisms of heavy precipitation processes. This understanding can lead to improved revisions and forecasts of rainstorm precipitation zones.
In June 2019, Jiangxi had two regional heavy rainfall weather processes. The first heavy rainfall occurred from 20:00 BJT (Beijing Time) on 8 June to 20:00 BJT on 9 June (referred to as the “6.9” process). The second heavy rainfall occurred from 20:00 BJT on 21 June to 20:00 BJT on 22 June (referred to as the “6.22” process). The positions of the 850 hPa shear lines at the initial moments of the two heavy rainfalls were basically coincidental, but the two rainstorms were a warm zone storm and a frontal storm, respectively. Therefore, the rainfall zones of the heavy rainfall were 100–200 km apart. In order to analyze the differences between the two rainstorms and summarize forecasting methods for warm zone storms and frontal storms, we conduct diagnostic analyses of the weather conditions influencing weather systems, and the variability of some physical quantities of these two heavy rainfall processes to discuss the possible impact of differences in the thermal and dynamical structure near the location of the low-level shear line on the area of storm fallout. These research findings can offer technical support for weather forecasting in the future.
2. Data and Methodology
2.1. Data Introduction
The real-time observation data used in paper include ground-based observations from the National Information Center of the China Meteorological Administration. The data used in this research include the NCEP/FNL (National Centers for Environmental Prediction/Final Reanalysis Data) reanalysis data from NCAR (National Center for Atmospheric Research) with spatiotemporal resolutions of 1.0° × 1.0° and 6 h intervals across 31 vertical layers. This dataset can be accessed at https://rda.ucar.edu/datasets/ds083.2/dataaccess/ (accessed on 2 December 2023). ECMWF (The European Centre for Medium-Range Weather Forecasts) and CMA-SH9 (China Meteorological Administration-Shanghai Numerical Weather Prediction System of 9 km) numerical forecast products were provided by the National Information Center of the China Meteorological Administration. The detailed information can be found in Table 1.

Table 1.
The main parameters of reanalysis data and numerical forecast products.
2.2. Methodology
The threat score (TS) in the paper is a dichotomous score used for rainstorms. If a rainstorm was forecasted and the actual rainstorm occurred, it is marked as a hit (NA). If a rainstorm was forecasted but the actual rainstorm did not occur, it is marked as a false alarm (NB). If a rainstorm was not forecasted but the actual rainstorm occurred, it is marked as a miss (NC). The TS can be expressed as:
TS = (NA)/(NA + NB + NC)
Wu et al. [32] inferred from the wet-level vortex derivation that the key areas for vortex development and heavy rainfall occurrence were the northern part of the warm and humid zone in close proximity, as well as the area near the Meiyu front. In practical calculations, the horizontal variation of the atmospheric vertical velocity is much smaller than the vertical shear of the horizontal velocity. When the horizontal change of ω is ignored, the expression of the wet vortex in the P coordinate system is:
where MPV denotes wet vortex, is vertical vorticity, f is Koch’s parameter, Ω is the angular velocity of the Earth’s rotation, equal to 7.292 × 10⁻⁵ rad·s−1. is potential equivalent temperature, and u, v is longitude and latitude components of wind speed, respectively. Gao et al. [33] observed that MPV could be utilized to track rainstorm systems. Therefore, this method is also used in this paper to track rainstorm weather systems.
Shear line is a zone of strong horizontal or vertical wind shear, which is a rapid change in wind speed and/or direction over a short distance. Shear lines are often associated with weather fronts, dry lines, troughs, or jet streams. The southwesterly wind over the Yangtze River region with wind speeds exceeding 12 m/s at 850 and 925 hPa is defined as the low-level jet (LLJ). This system often carries a large amount of water vapor and appears in the area south of the shear line. It is an important weather system for heavy rain in Jiangxi.
3. Overview of the Rainfall Process
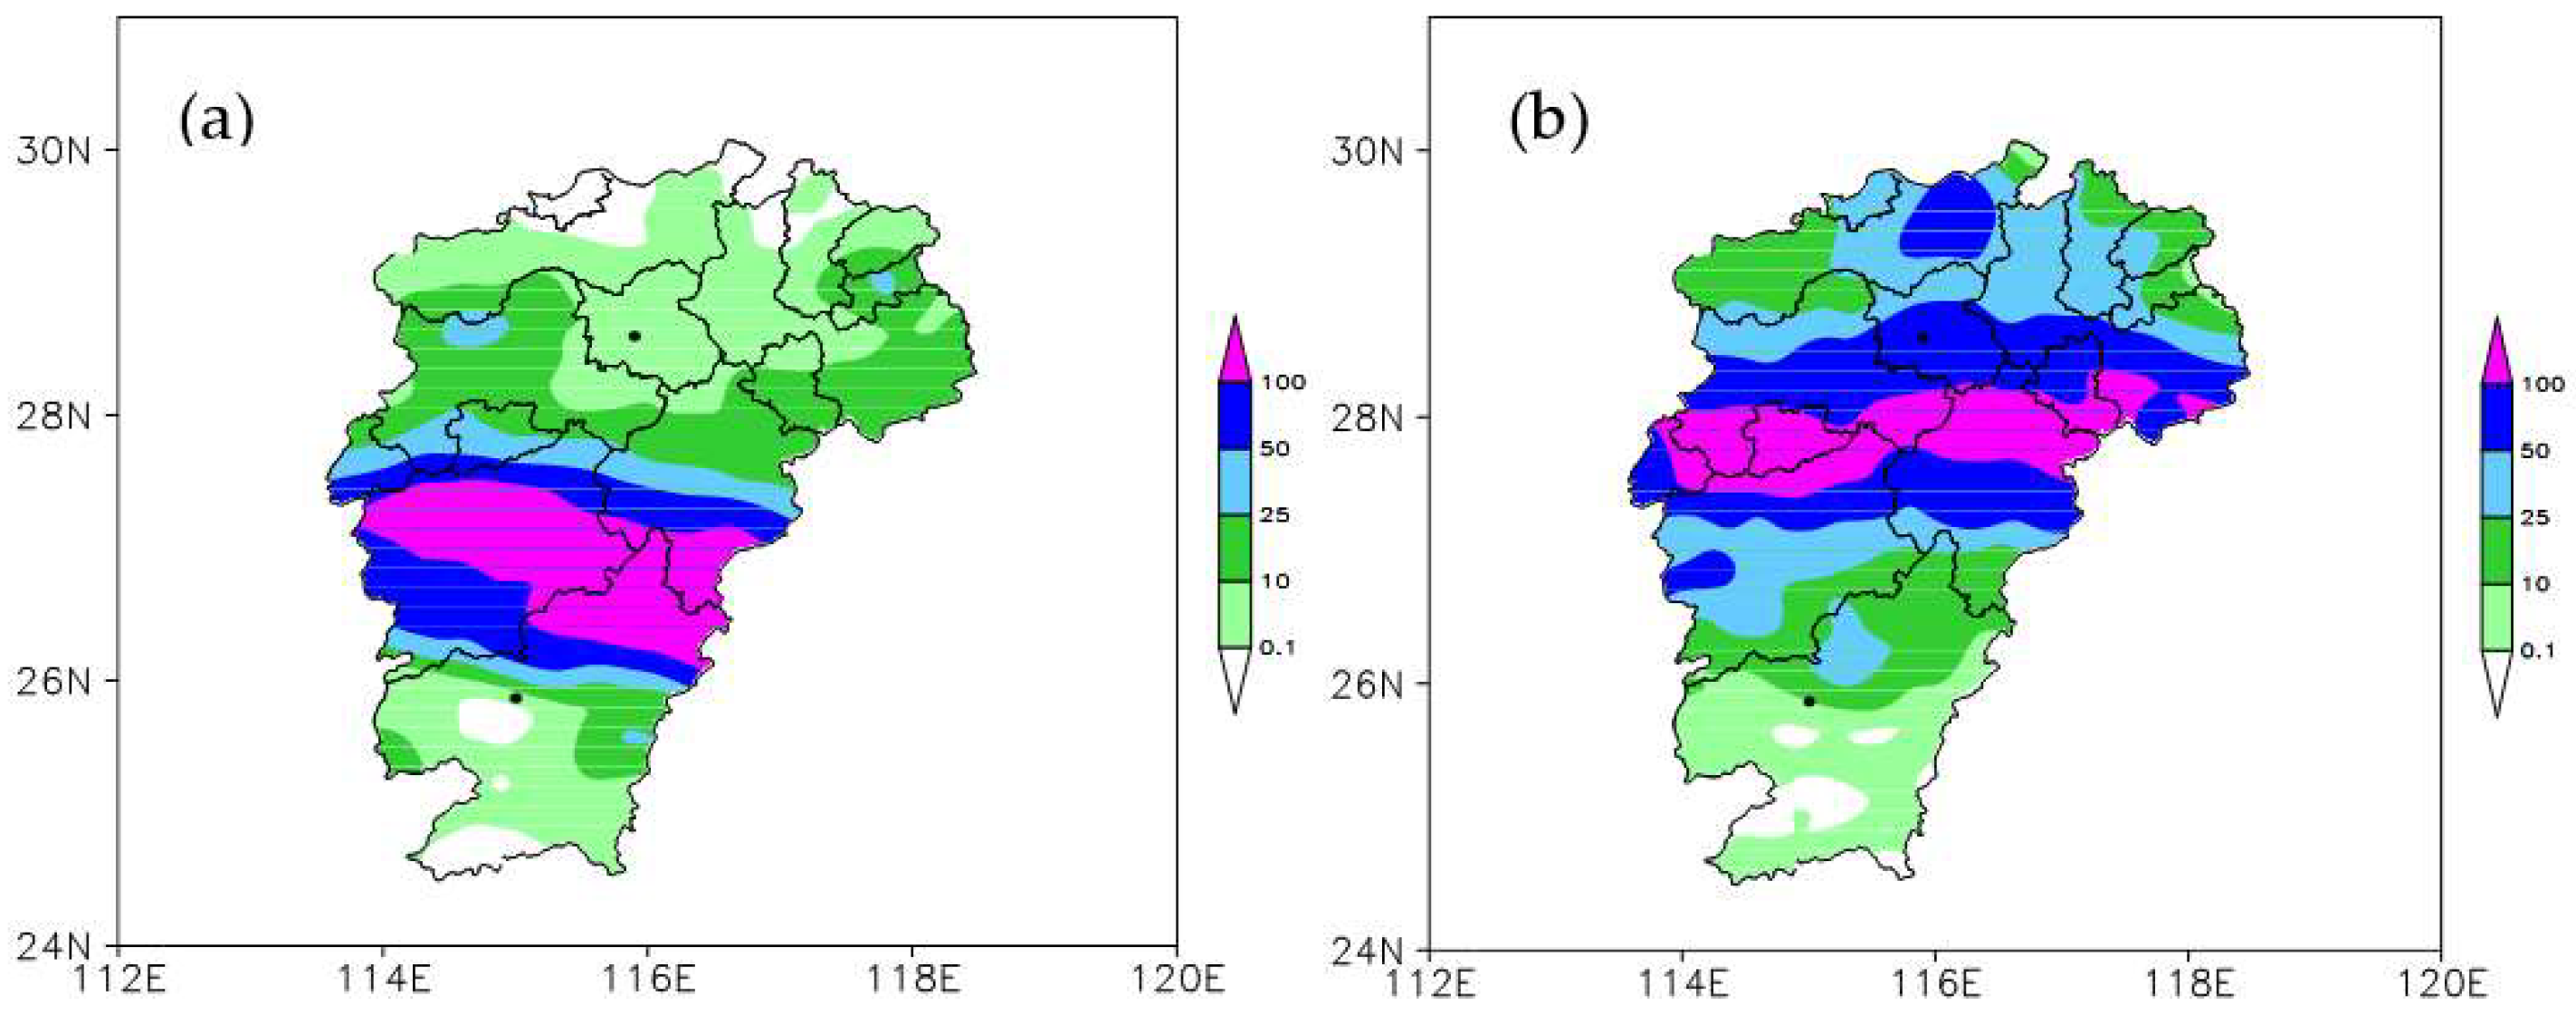
Significant differences exist between the “6.9”and “6.22” processes in terms of intensity, precipitation zone, and the direction of the rain band, as shown in Figure 1. Firstly, the heavy rainfall is located differently. The precipitation zone of heavy rainfall for the “6.9” process was primarily concentrated around 26–28° N, whereas for the “6.22” process, it extended from 27–29° N. Secondly, the rainstorm’s intensity differed. The precipitation zone of the “6.9” process was smaller compared to that of the “6.22” process. Thirdly, there was a slight discrepancy in the direction of the main rain band. The rain band in the “6.9” process extended from west-northwest to east-southeast, while in the “6.22” process, it was oriented in an east-west direction. Fourthly, there were differences in the characteristics of the rain band edges. In the “6.9” process, the edge of the rain band had a distinct boundary with a significant precipitation gradient, and its direction closely followed that of the main rain band. In contrast, the main rain band of the “6.22” process exhibited irregular edges, and there were localized areas of heavy rainfall to the north and south of it. Lastly, there were variations in the concentration period of precipitation. In the “6.9” process, heavy rainfall was mainly concentrated in the first 18 h, and the province experienced a transition to light rain from 14:00 BJT to 20:00 BJT on 9 June 2019. In the “6.22” process, the majority of heavy rainfall took place during the initial 18 h, and there were instances of localities receiving over 50 mm of heavy precipitation in the subsequent 6 h.
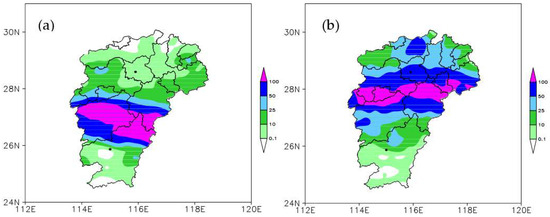
Figure 1.
Accumulated precipitation (unit: mm; black dots from north to south represent Nanchang and Ganzhou stations, respectively) (a) from 20:00 BJT on 8 June to 20:00 BJT on 9 June 2019, and (b) from 20:00 BJT 21 June to 20:00 BJT on 22 June 2019.
To evaluate the rain intensity of the two heavy rainfall processes, we define 3 h accumulated precipitation as R3, 6 h accumulated precipitation as R6, and 24 h accumulated precipitation as R24, and calculate the number of national meteorological observatories station with R3, R6, and R24 exceeding 50 and 100 mm, respectively. If the greater ratio between the R3 to R24 or R6 to R24, indicates the higher the proportion of short-duration heavy precipitation, the greater the intensity of the rainfall as well. A lower ratio implies a smaller proportion of short-duration heavy precipitation and lower rain intensity. In the “6.9” process, the ratio of stations with R3 ≥ 50 to R24 ≥ 50 mm was 46.2%, and the ratio of stations with R6 ≥ 50 to R24 ≥ 50 mm was 88.5%, while the ratio of stations with R6 ≥ 100 to R24 ≥ 100 mm was 19.6%. These corresponding ratios in the “6.22” process were 35.6%, 62.4%, and 17.4%, all smaller than those in the “6.9” process. Additionally, the ratio of stations with R24 ≥ 100 mm to those with R24 ≥ 50 mm in the “6.9” process was 55.8%, representing more than half, with the maximum precipitation recorded at 315.2 mm, indicating stronger rainfall. By contrast, the corresponding ratio in the “6.22” process was only 40.3%, less than half, with a maximum precipitation of only 215.6 mm, indicating relatively weaker rainfall than that in the “6.9” process.
4. Analysis of Environmental Conditions
Storms are primarily formed by mesoscale systems, which are, in turn, influenced by larger weather-scale systems [34]. In this section, the possible factors contributing to the significant differences in storm locations are analyzed, focusing on the weather-scale circulation background, dynamics, and thermal variations associated with the two heavy rainfall processes.
4.1. Environment of Middle- and Upper-Level Circulations
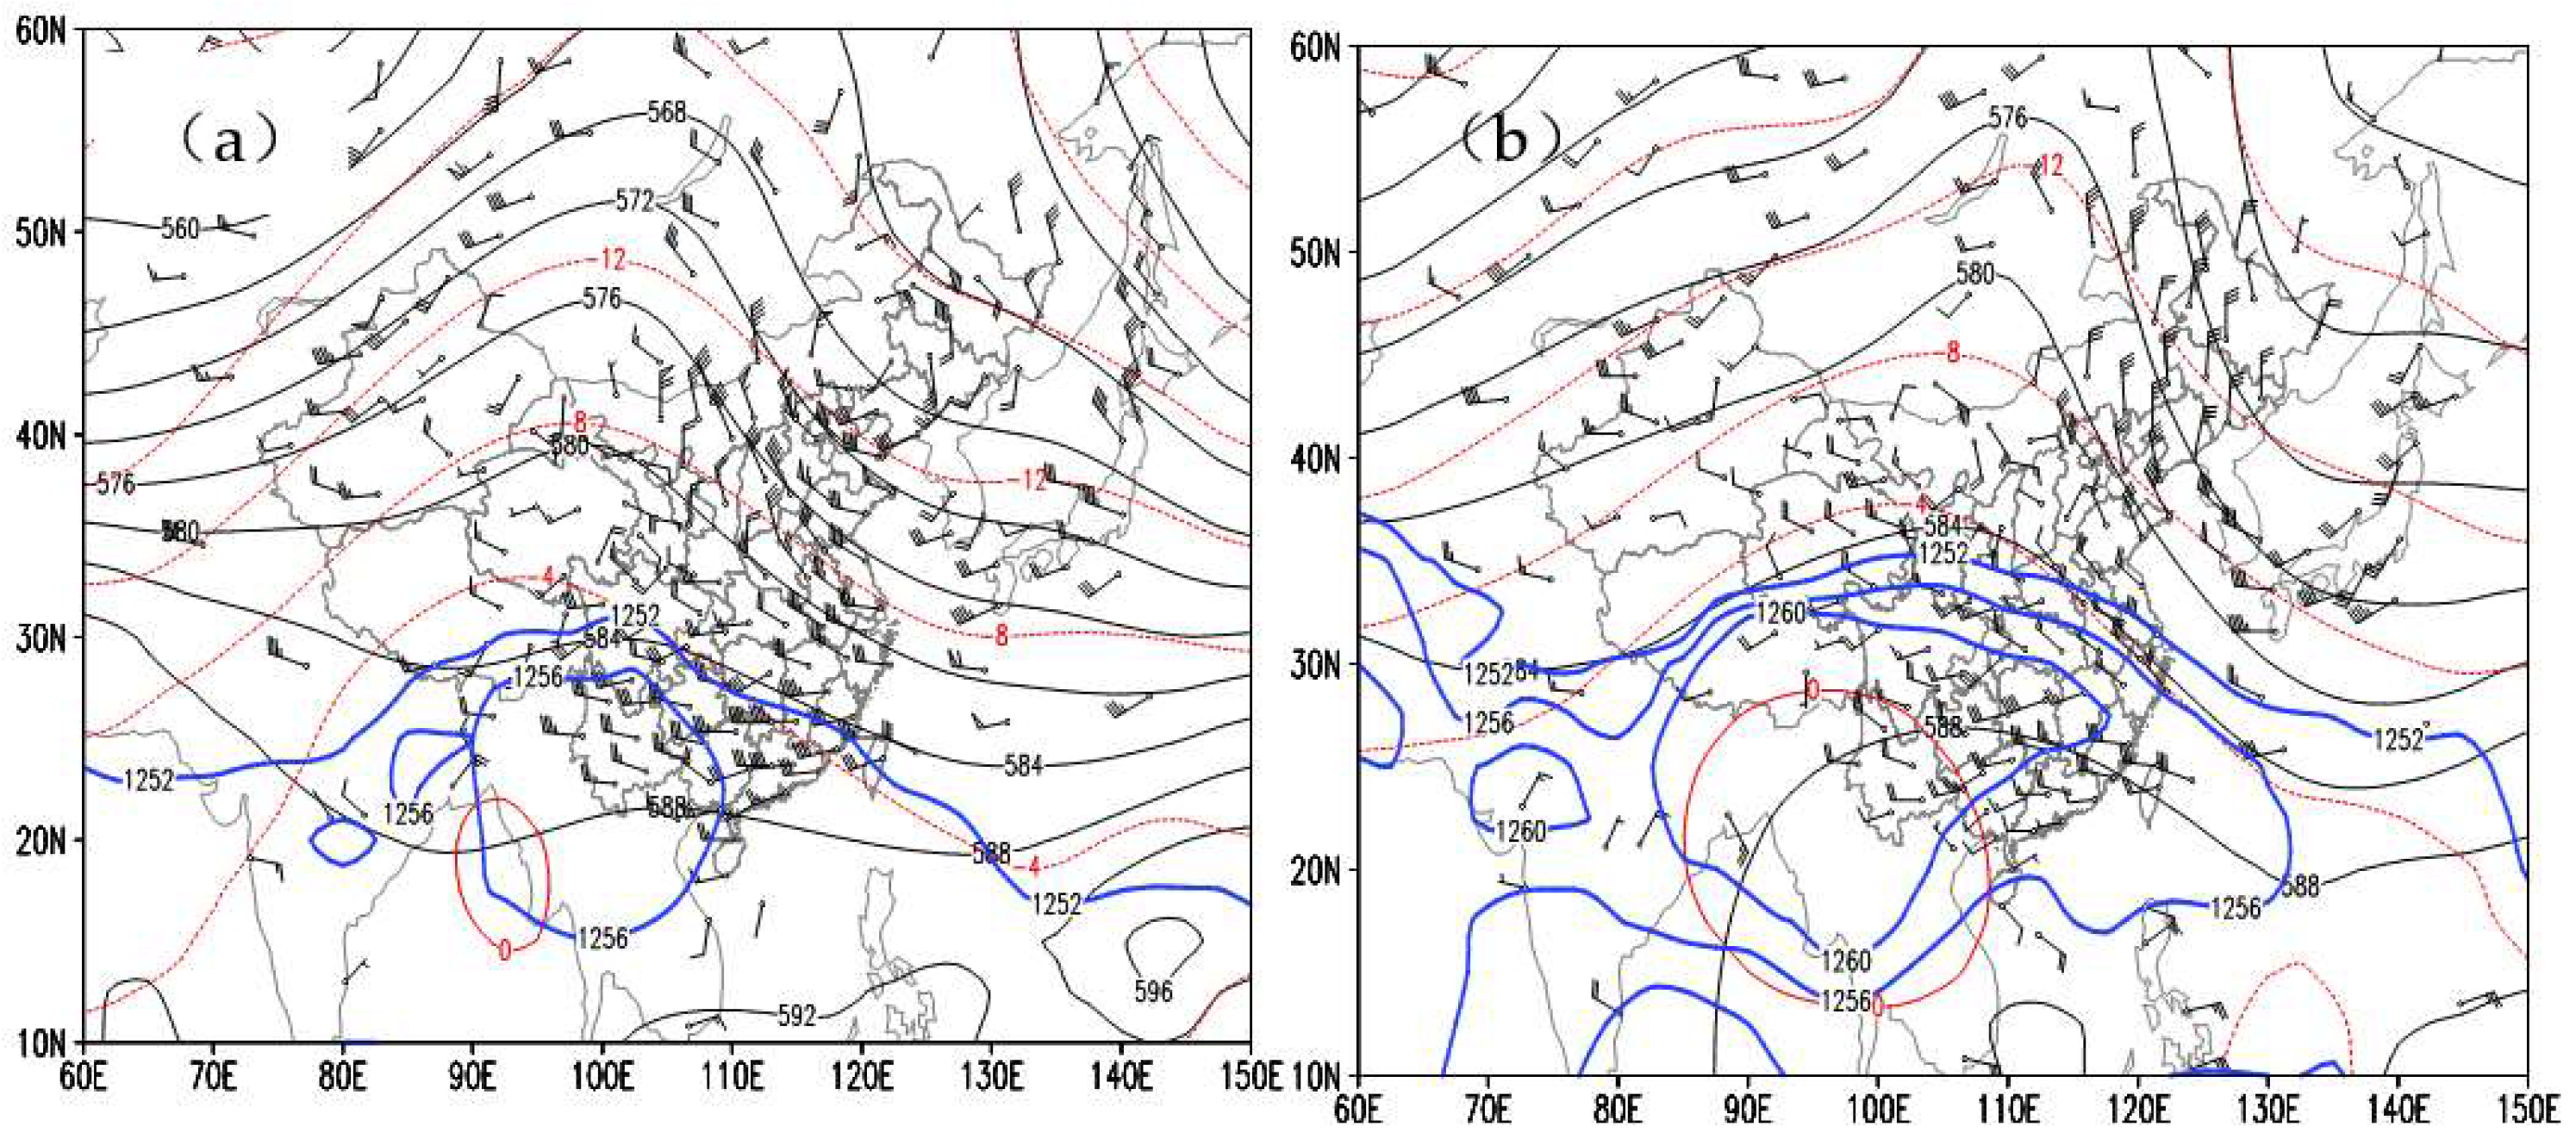
At 200 hPa geopotential height, the South Asian high-pressure ridge was positioned near 24° N with its center located around 95° E, 24° N in the northern part of the Central South Peninsula. At 20:00 BJT on 8 June 2019, there was a closed contour of 1256 dagpm in the central area (Figure 2a). During this time, a cold vortex extending from eastern Inner Mongolia to Jilin was moving in a southeasterly direction, bringing a consistent northwesterly flow to the middle and lower reaches of the Yangtze River in China. Additionally, there was a short-wave trough from central Hubei to central Hunan, contributing to the heavy rainfall in Jiangxi Province. The heavy rainfall area in Jiangxi was influenced by the front of the southwesterly airflow and the north side of the South Asian high-pressure ridge, resulting in the formation of an airflow divergence zone. This area exhibited a southeast-northwestward distribution, closely aligning with the shape and location of the rain band associated with the rainstorm. Between 08:00 BJT and 20:00 BJT on 9 June, as the short-wave trough moved eastward and weakened, the South Asian high-pressure ridge also weakened and shifted southward. Consequently, the divergent radial situation in central Jiangxi gradually weakened and disappeared, leading to the end of the heavy rainfall process.
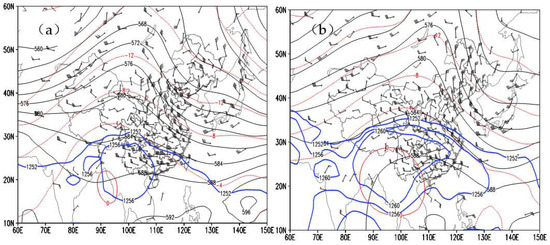
Figure 2.
Circulation condition (a) at 20:00 BJT on 8 June and (b) 20:00 BJT on 21 June at 500 hPa (Solid black lines represent potential heights; unit: dagpm. The red dotted line represents temperature, unit: °C. The wind bar represents a horizontal wind field, unit: m·s−1) and potential height above 1252 dagpm (represented by a blue solid line, unit: dagpm) at 200 hPa.
In the “6.22” process, the South Asian high-pressure ridge was positioned near 27° N, centered at 100° E, 27° N (Figure 2b), which was approximately 3° north of its position in the “6.9” process. It was directly over central Jiangxi. Northwesterly winds to the north of the ridge line and southwesterly winds to the south formed a convergence and airflow divergence region along the latitudinal axis. This region closely matched the shape and location of the storm’s rain bands. On 24 June, the South Asian high-pressure weakened, and the 200 hPa conditions transitioned to northwest airflow control, causing the dissipation of the irradiation region and the end of the rainstorm process. In the “6.22” process, the rainstorms mainly occurred near the 200 hPa ridge.
Both processes exhibit a “Two Troughs and a Ridge” pattern in the 500 hPa geopotential height field across the middle and high latitudes of Asia. However, there are significant differences in the location and intensity of the subtropical high-pressure ridge and the northeast cold vortex. From 08:00 BJT on 8 June to 20:00 BJT on 9 June, the cold structure of the northeast cold vortex remained intact and gradually shifted approximately 4° to the southeast. The trough on the southern side of the cold vortex was positioned near 120° E, and the northwesterly flow behind the trough was stronger, with a maximum wind speed of 26 m·s−1, extending southward to around 27° N. The subtropical high pressure was distributed in an east-west belt, with a ridge located at approximately 17° N. The 588 dagpm contour indicated a decrease in height from the southern part of northern South China to the coast of South China. Additionally, a weak south branch trough on the southern side of the Tibetan Plateau influenced the southern part of the Yangtze River and South China (Figure 2a).
During the “6.22” process, the high-altitude cold vortex was situated on the ocean surface east of North Korea, and its center was further east and north compared to the “6.9” process (by nearly 10° of longitude). The East Asian Trough guided the rear cold air southward, and the northerly flow behind the cold vortex was weaker than in the “6.9” process by 2–4 m/s. The 588 dagpm contour also shifted slightly southward, but the subtropical high-pressure ridge remained positioned at 19–20° N, approximately 2° north of its location in the “6.9” process (Figure 2b).
4.2. Thermal and Dynamic Structures near Low-Level Shear Lines
Shear lines play a significant role as common weather-influencing systems during rainstorms in Jiangxi. In both of these heavy rainfalls, the 850 hPa shear lines were situated around 28° N, in close proximity to each other. A low-level jet (LLJ) is typically present on the southern side of the shear in most cases [28,35]. Usually, the precipitation zones of heavy rainfalls occur between the southern side of the shear and the exit area of the low-altitude flow. However, in these two heavy rainfalls, the precipitation zones were positioned 100–200 km apart. Conducting a detailed examination of the LLJ and temperatures on both sides of the shear line will clarify the disparities in the dynamic and thermal characteristics near the shear line in these two processes, as well as their potential effects on the rainstorm precipitation zones.
4.2.1. Differences in Dynamic Structure near the Shear Line
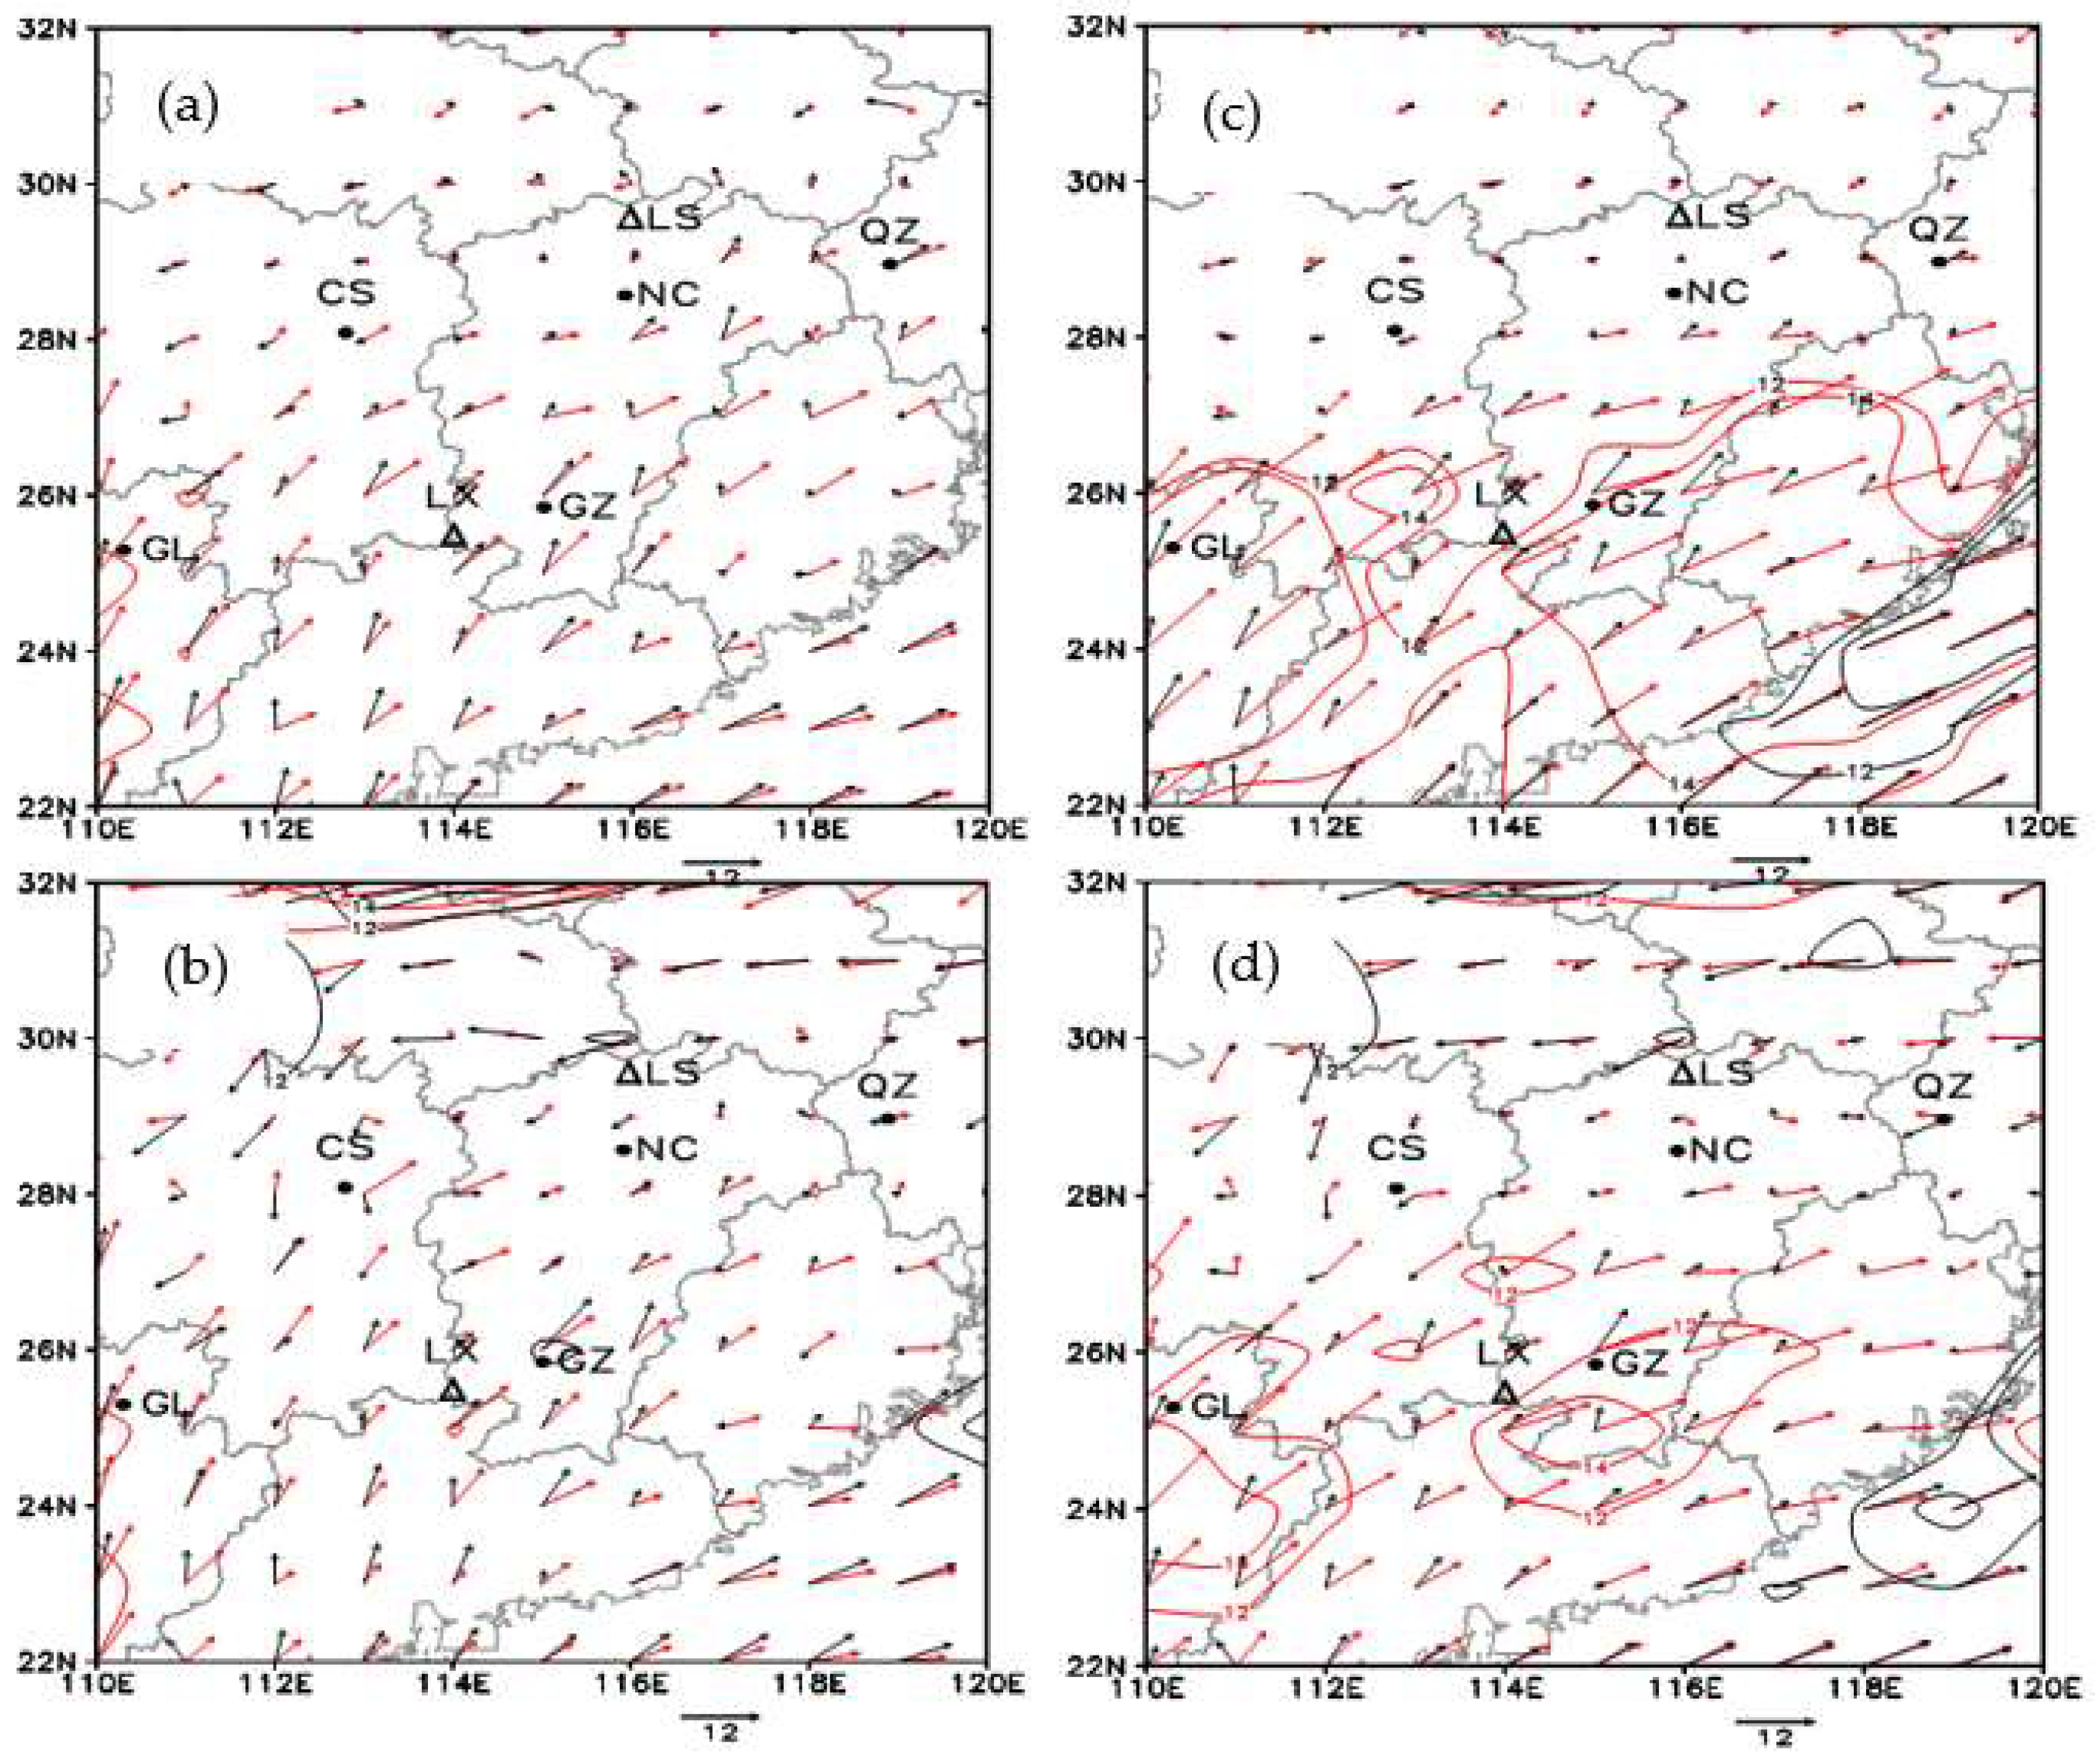
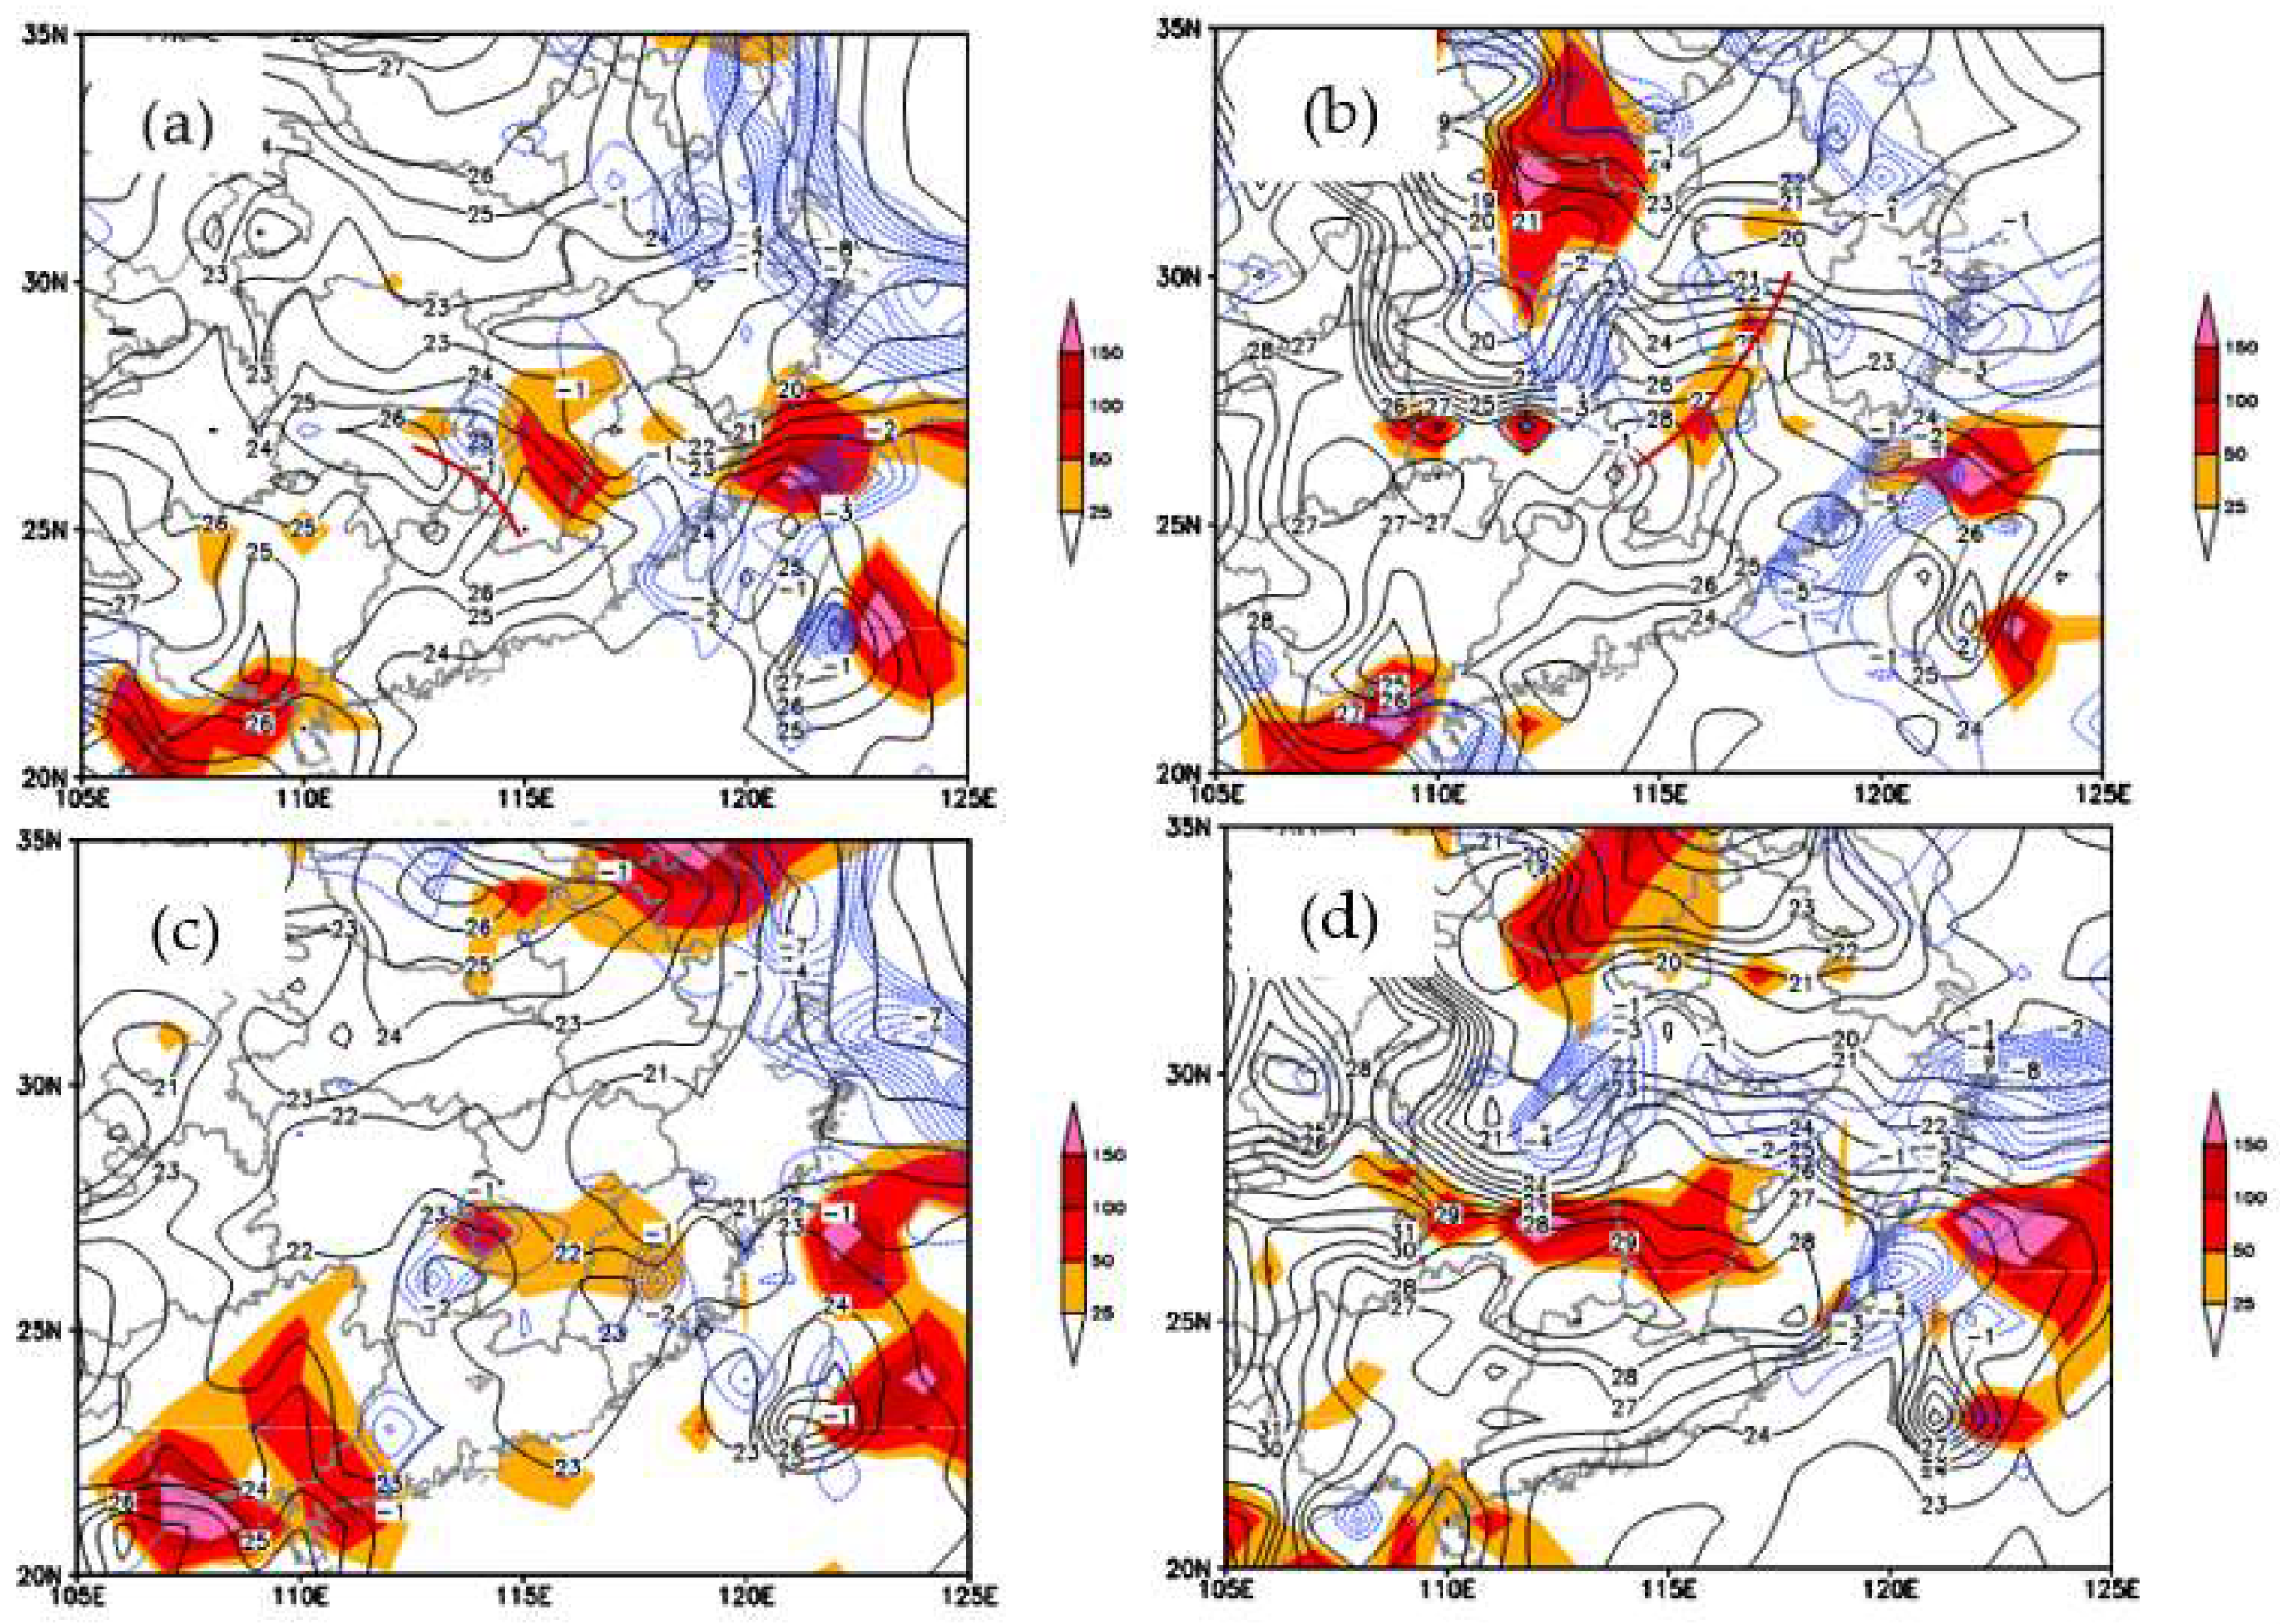
In the “6.9” process, there was weak convergence in the vicinity of the lower and middle-level shear lines, coupled with significant wind speed convergence to the south. Notably, distinct southwesterly winds were observed to the south of the shear lines. At 20:00 BJT on 8 June, the 850 hPa shear line extended along the line connecting Quzhou, Nanchang, and Changsha (Figure 3a). Over south-central Jiangnan to South China, the low-level jet (LLJ) stream on the southern side of the shear reached speeds of 10–14 m·s−1. By 08:00 BJT on 9 June, the shear line had shifted to approximately 29° N (Figure 3b). The axis of the southwestern winds lay along a line from Guilin to Ganzhou (near 25° N), with wind speeds increasing to 14–22 m·s−1. In the boundary layer at 925 hPa, southerly winds to the south of the 925 hPa shear increased from 4–8 to 8–14 m·s−1 from 08:00 BJT on 8 June to 00:00 BJT on 9 June 2019. Notably, a prominent 12 m·s−1 wind speed core was observed at the Ganzhou Station, accompanied by a more pronounced southward wind speed convergence in central and southern Ganzhou, and easterly winds of 2–4 m·s−1 observed to the north of the shear.
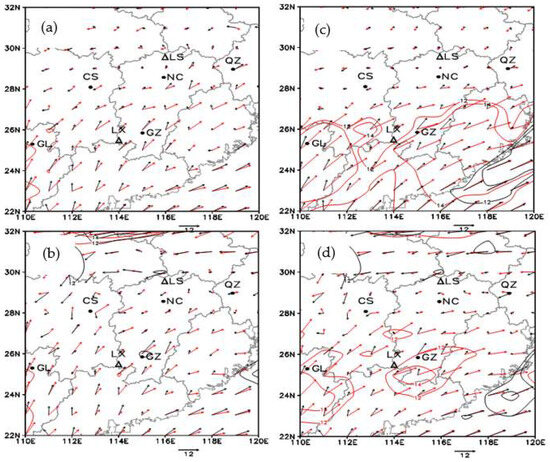
Figure 3.
Wind vectors and isotach lines (unit: m·s−1) at 850 hPa (red) and 925 hPa (black) at (a) 20:00 BJT on 8 June, (b) 08:00 BJT on 9 June, (c) 20:00 BJT on 21 June, and (d) 08:00 BJT on 22 June 2019. “NC”, “GZ”, “CS”, “QZ”, “GL” denote Nanchang, Ganzhou, Changsha, Quzhou, Guilin, respectively. “LS”, and “LX” denote Lushan Mountains and Luoxiao Mountains, respectively.
In the “6.22” process, the low-level shear line shifted southward from the Yangtze River basin to the northern part of Jiangnan. At 20:00 BJT on 21 June, the 850 hPa shear line was located around Quzhou, Nanchang, and Changsha (Figure 3c), similar to its position during the “6.9” process. Southwestern winds from the south were recorded with speeds of 10–12 m·s−1. By 08:00 BJT on 22 June, wind speeds had increased to 12–16 m·s−1, and Ganzhou experienced an increase from 10 to 16 m·s−1 (Figure 3d). In the boundary layer at 925 hPa geopotential height, persisting southwesterly winds of 8–12 m·s−1 were observed from southern Jiangxi to Guangdong. However, the north-northeasterly winds on the northern side of the shear during the “6.22” process were notably stronger than those in the “6.9” process, gradually pushing southward. Wind speeds reached 10–16 m·s−1 at 925–850 hPa (compared to 2–4 m·s−1 during the “6.9” process). Clear convergence of wind direction and speed was observed near the shear line.
Figure 3d illustrates that, in addition to the previously discussed major shear lines, there are multiple lower-level shear lines that sequentially influence the Jiangxi area. At 08:00 BJT on 22 June, at the 850 hPa level, a smaller-scale shear line gradually extended eastward in the region between 29–30° N. Despite some unstable energy being depleted by precipitation on the night of 21 June, it still resulted in heavy rainfall in the mountainous areas of northern Jiangxi, particularly around the Lushan Mountains, due to terrain-induced effects. At the 925 hPa level, there is also a smaller-scale shear line near the Luoxiao Mountains (114° E, 25.5° N), similarly influenced by the terrain, causing localized heavy rainfall in the area. This explains why the “6.22” process generated localized areas of heavy rainfall both to the north and south of the main rain band.
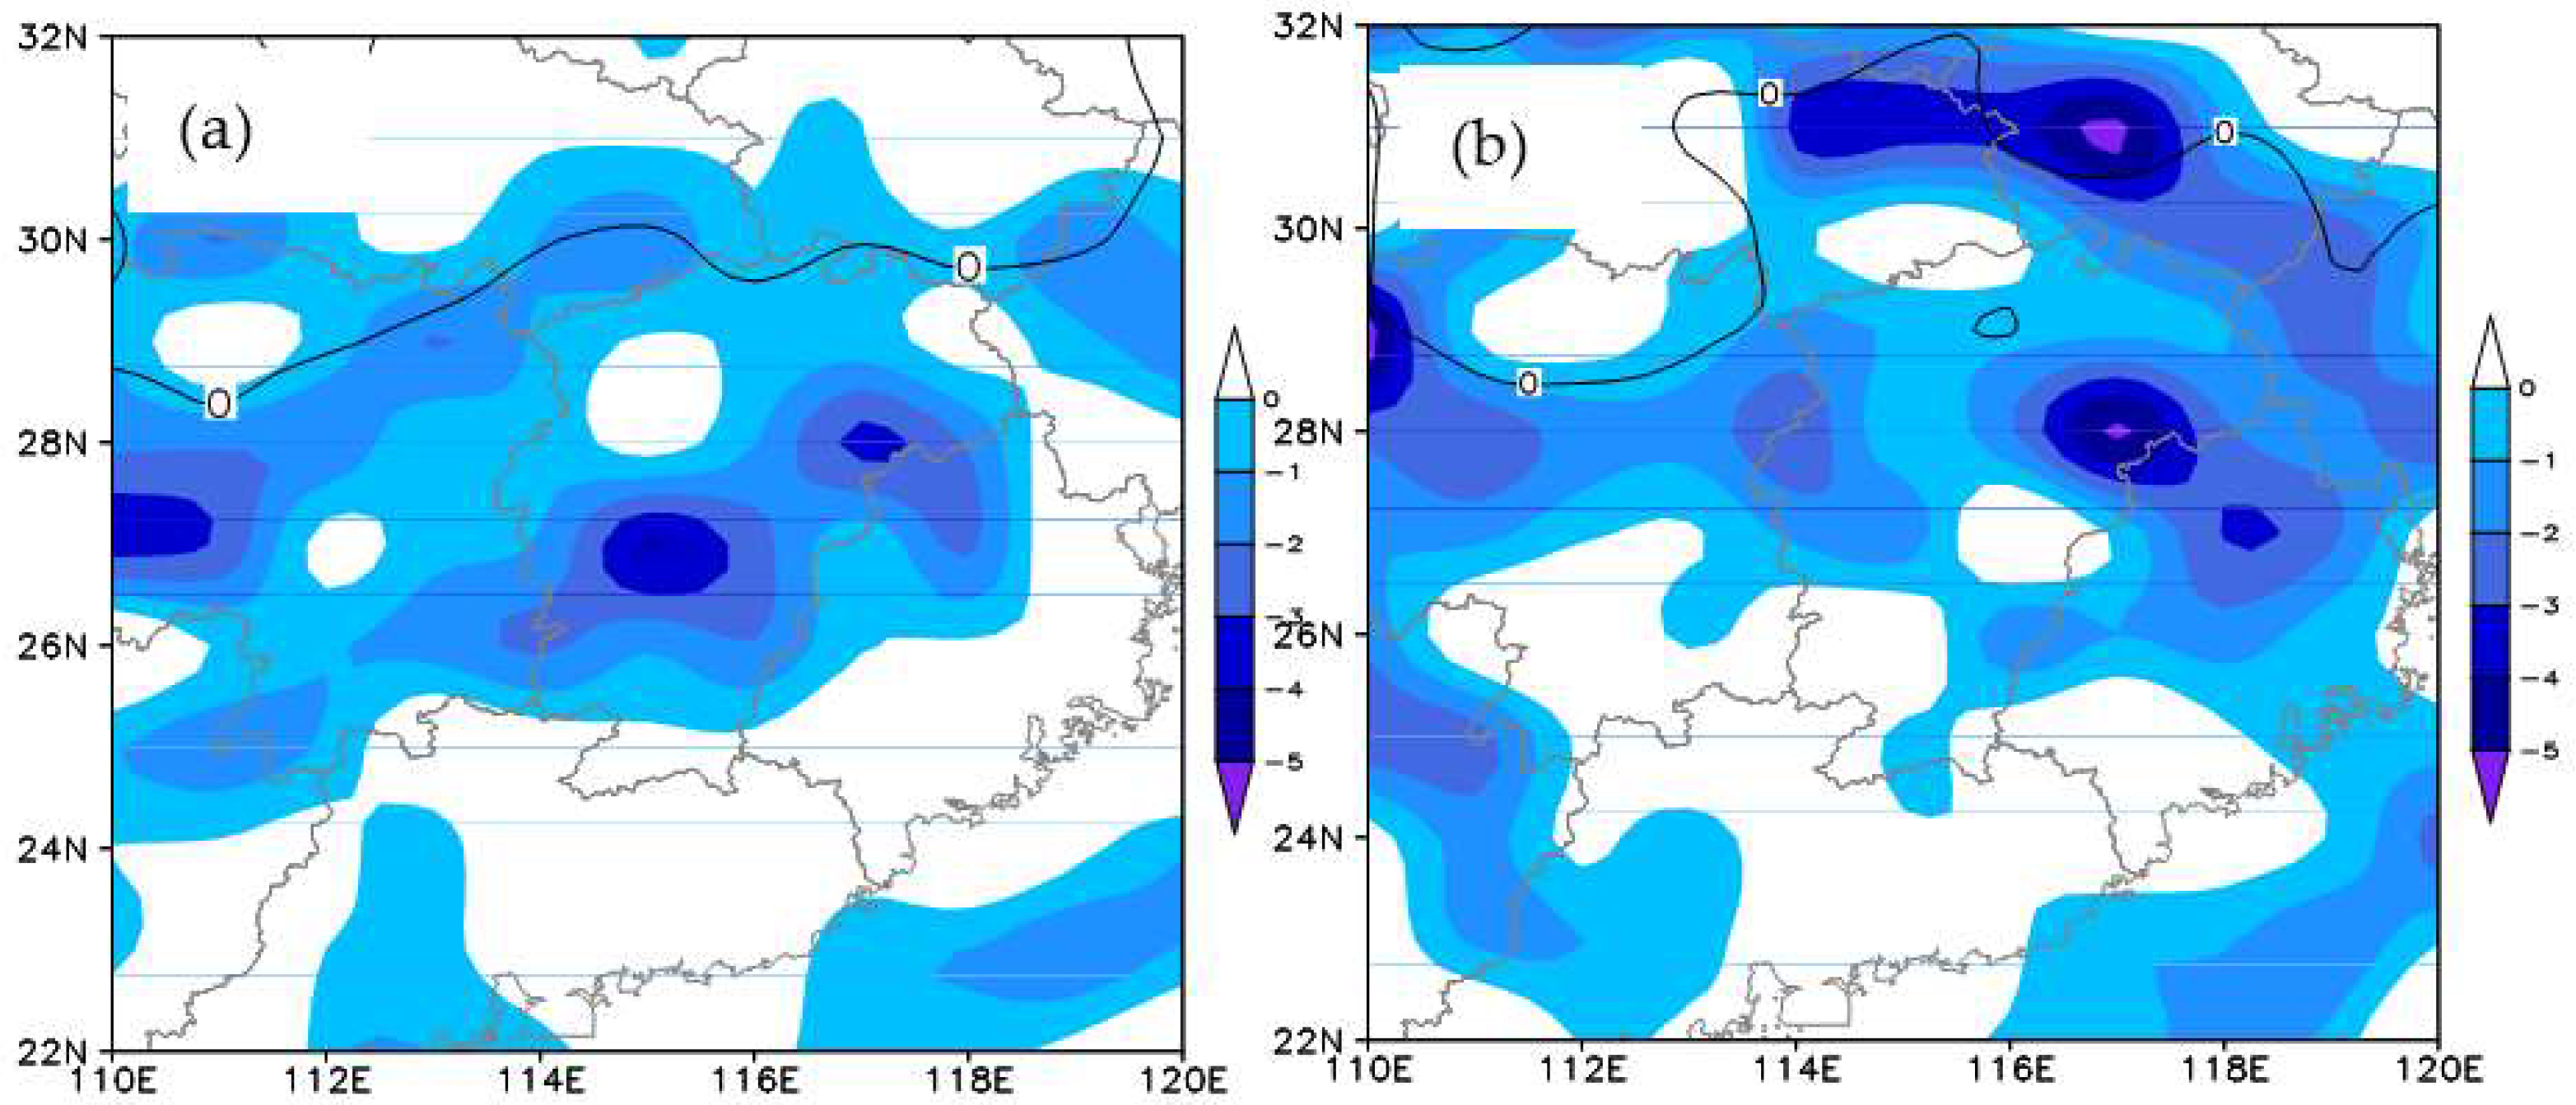
The 925 hPa convergence zone remained consistently maintained in south-central Jiangxi from 14:00 BJT on 8 June to 20:00 BJT on 9 June 2019. Within the heavy rainfall area, the position of the convergence zone showed less variability, with a central intensity ranging from −4 × 10⁻⁵ to −6 × 10⁻⁵ s−1. The convergence near the 850 hPa shear line was weaker, with the strongest convergence occurring in the south-central Jiangxi Province (26–28° N). This convergence center corresponded to the region affected by the rainstorm fallout, displaying a central intensity ranging from −3 × 10⁻⁵ to −5 × 10⁻⁵ s−1 (Figure 4a). The heavy rainfall area was situated within a zone of strong convergence, approximately 150–200 km south of the zero line of the υ-component of wind at 850 hPa and to the left and ahead of the low-level jet (LLJ). Thus, the southern side of the low-level shear line and the convergence of wind speeds ahead of the southwestern LLJ were the primary lifting mechanisms for the occurrence of heavy rainfall in the “6.9” process.
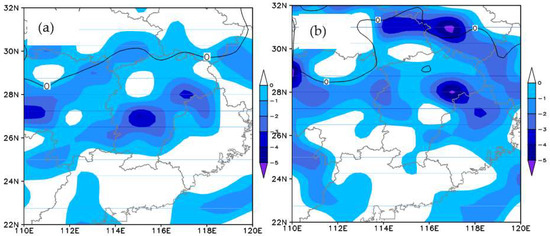
Figure 4.
Dispersion field (850 hPa; unit: 10−5 s−1, represented by a blue shaded area) and wind υ-component zero line (unit: m·s−1, represented by a black solid line) at (a) 20:00 BJT on 8 June, and (b) 20:00 BJT on 21 June 2019.
The low-level convergence in the “6.22” process was located further north, stronger, and more extensive, resulting in increased dynamic forcing on a synoptic scale. A wide range of convergence zones persisted between the zero line of the υ-component and the left side of the low-level jet (LLJ) (26–29° N). At 925 hPa, the central intensity ranged from −4 × 10⁻⁵ to −5 × 10⁻⁵ s−1. Both northern Jiangxi and central Jiangxi exhibited 850 hPa center intensities ranging from −3 × 10⁻⁵ to −6 × 10⁻⁵ s−1. From 20:00 BJT on 21 June to 08:00 BJT on 22 June, a convergence center was consistently maintained at the junction of Jiangxi and Hunan provinces in central Jiangxi (Figure 4b), with a central intensity of −3 × 10⁻⁵ s−1. This characteristic of the low-level convergence field played a crucial role in the generation and development of heavy precipitation in central Jiangxi. At 02:00–08:00 BJT on 22 June 2019, a strong convergence center also emerged in the southern part of northeastern Jiangxi, aligning with the location of medium-scale convective rain in eastern Jiangxi in the early morning of 22 June, with the intensity of the center reaching −6 × 10⁻⁵ s−1. From 08:00 BJT to 14:00 BJT on 22 June, the low-level southwest airflow retreated southward, causing the shear to change from east-west to northeast-southwest, while the strong convergence remained near the shear line. From 14:00 BJT to 20:00 BJT, the shear continued to move southeastward, leading to a significant weakening of the convergence, and the center of the strong convergence disappeared. The primary lifting condition in the “6.22” process was a broad area of strong convergence extending from the low-level convergence line to the front of the LLJ stream.
4.2.2. Differences in Thermal Structure near the Shear Line
Twelve hours prior to the heavy rainfall, the boundary layer and lower atmosphere continued to warm due to the influence of low-level warm advection. Analyzing the 925 hPa temperature field at 20:00 BJT on 8 June (Figure 5a), a warm ridge extended from Chenzhou, Hunan Province, to Ganzhou, Jiangxi Province, with a central temperature of 26 °C (28 °C for the sounding condition). By 20:00 BJT on 21 June, the 925 hPa warm ridge was primarily situated in the north-central region of Jiangxi Province (Figure 5b). Notably, a significant difference in the intensity of the frontal zone north of the warm ridge was observed between the two processes: the temperature gradient for the “6.9” process was approximately 3–4 °C/300 km, whereas, for the “6.22” process, it reached 7 °C/300 km, indicating a more pronounced frontal feature in the “6.22” process. The rainfall-affected area in the “6.9” process predominantly coincided with the region where the temperature front north of the warm ridge at 925 hPa and the warm advection intersected. In contrast, in the “6.22” process, the 925 hPa temperature front area was located in the northern part of Jiangxi. At 20:00 BJT on 21 June, the warm advection exhibited a northeast-southwest distribution with a limited range and weak intensity. By 08:00 BJT on 22 June, the warm advection had shifted southward into the southern region of Jiangxi, and the temperature frontal area diverged from the warm advection. This resulted in heavy rainfall occurring in the southern part of the temperature frontal area and north of the warm advection. As a result, the “6.9” process displayed more characteristics of a “warm zone storm,” while the “6.22” process exhibited more features of a “frontal storm”.
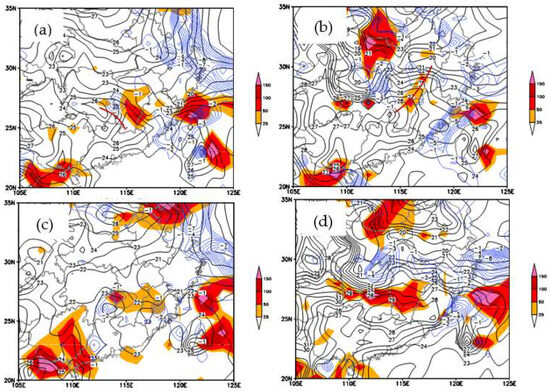
Figure 5.
Temperature field of 925 hPa (unit: °C; the brown solid line represents warm ridge), MPV (blue dashed line, unit: PVU), and warm advection (shaded, unit: 10−5 °C·s−1) at (a) 20:00 BJT on 8 June, (b) 20:00 BJT on 21 June, (c) 08:00 BJT on 9 June, and (d) 08:00 BJT on 22 June 2019.
Based on the MPV analysis of the two rainstorm processes, it is evident that at 20:00 BJT on 8 June, there was a low MPV center of −4.0 PVU in western Jiangxi, indicating the region exhibited strong conditional symmetric instability [36]. At 08:00 BJT on 9 June, a low MPV value center was observed in south-central Jiangxi, facilitating upward tilted movement in the region, resulting in tilted convection and heavier precipitation. By 20:00 BJT on 21 June and 08:00 BJT on 22 June, the MPV negative band was predominantly distributed in the northeast of Jiangxi temperature fronts, without a discernible MPV negative center above the rainstorm area in Jiangxi. This suggests that the “6.22” process was primarily a regional rainstorm in front of the cold front, and the rainstorm area lacked any obvious conditional symmetric instability, marking a notable contrast from the “6.9” process. A clear distinction is evident between the “6.9” process and the “6.22” process.
4.2.3. Vertical Thermal and Dynamic Variability in the Vicinity of the Shear Line
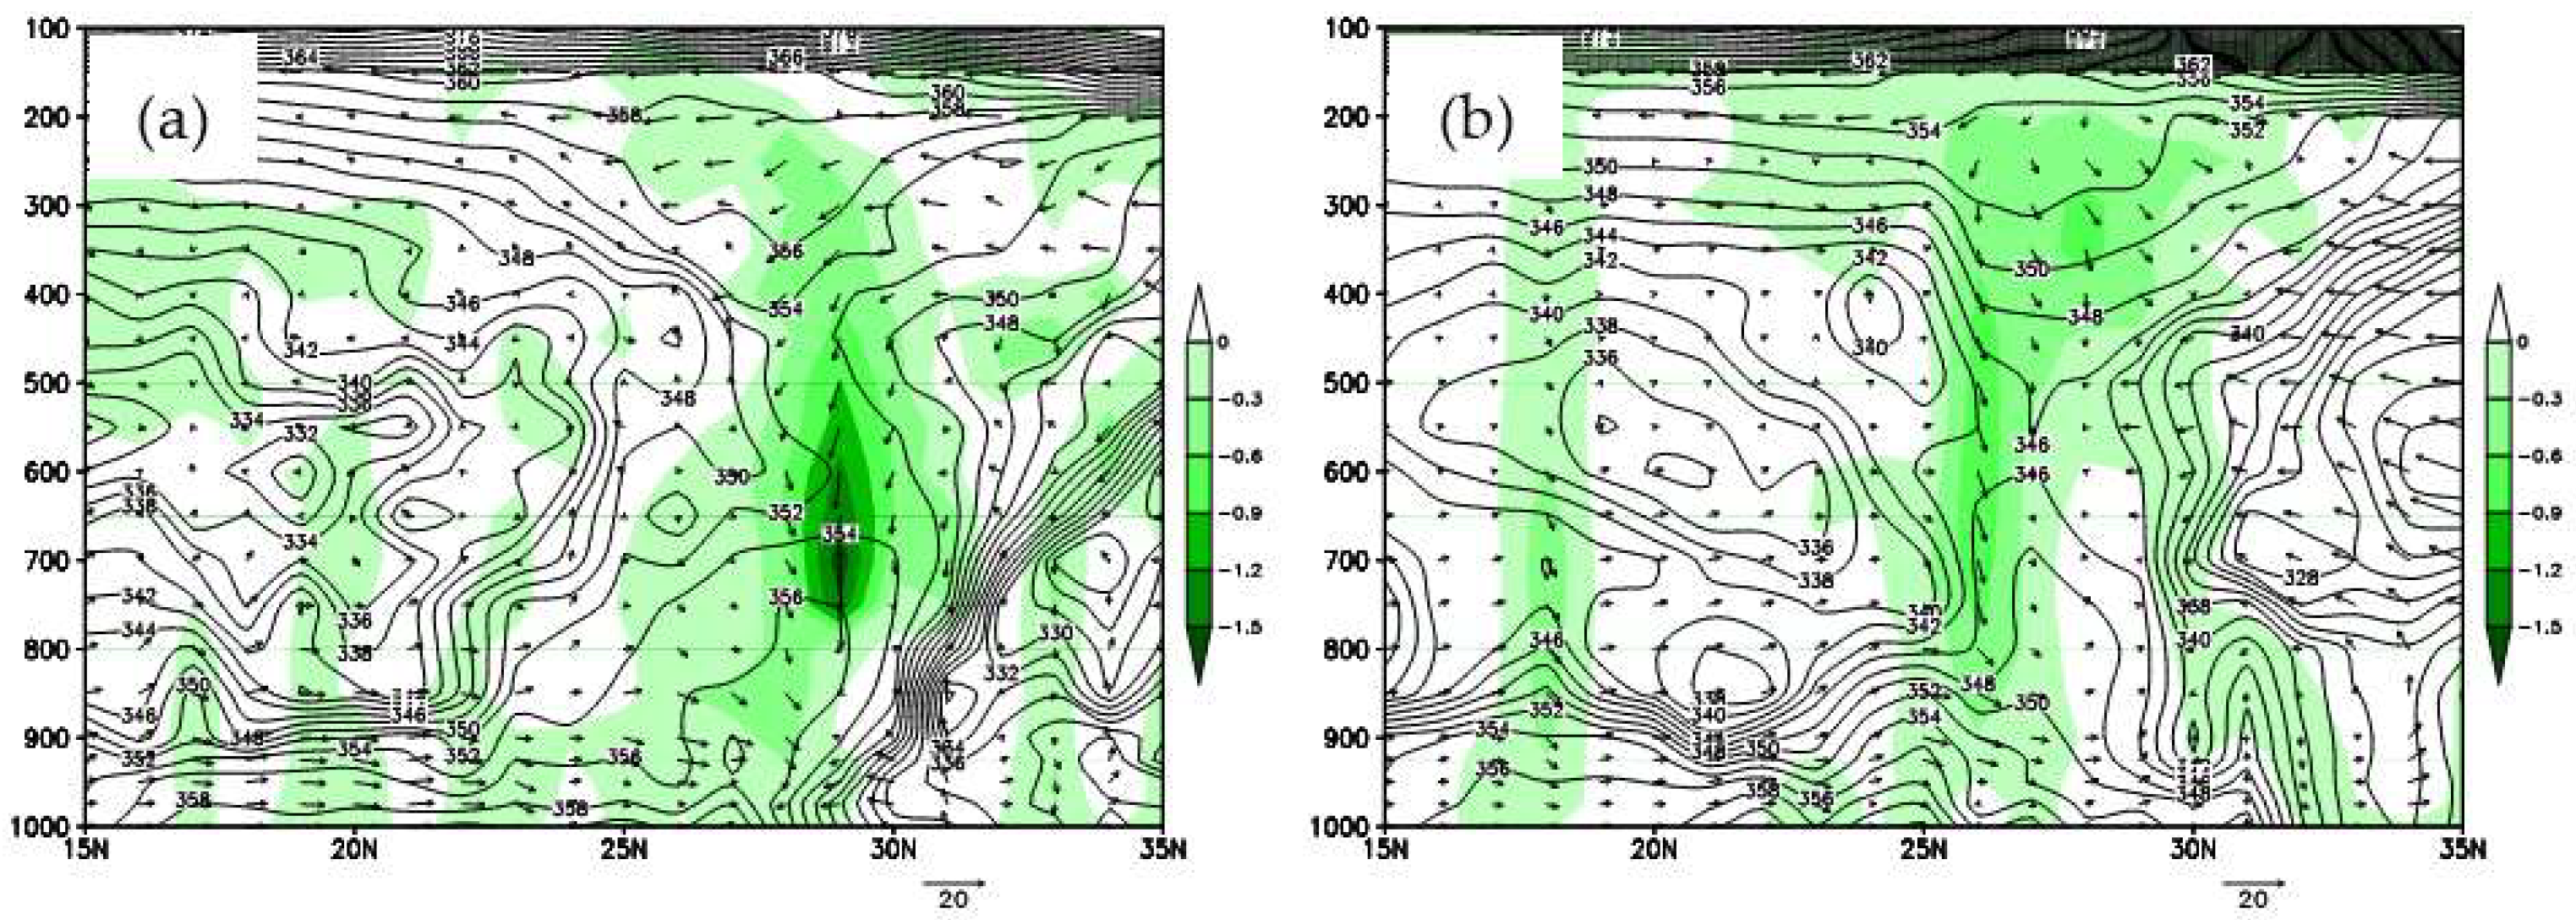
To further analyze the thermal and dynamic variability in the vertical direction near the shear line and storm precipitation zone, we constructed a radial profile of a θse-ω along 116° E. At 20:00 BJT on 8 June, we observed a distinct column of upward motion on a high-energy tongue extending from the lower to the middle layers south of the shear line at 26–28° N (Figure 6a). Similarly, at 20:00 BJT on 21 June, we also observed a high-energy tongue stretching from the low level to the middle level, accompanied by a clear column of upward motion. However, starting from 02:00 BJT on 22 June, the vertical upward motion transitioned to tilting towards the frontal area. We observed a broad upward motion from the front to the upper part of the frontal area (27–30° N; Figure 6b), with a more pronounced center of upward motion and a tendency for vertical convection to transition into oblique upward convection.
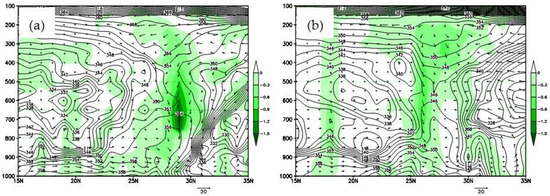
Figure 6.
Vertical velocities along 116° E at 20:00 BJT on 8 June (a) and 02:00 BJT on 22 June (b) (represented by filled colors, unit: Pa·s−1). Pseudo-equivalent potential temperature (contour line, unit: K) V-ω (vectors, respectively, V wind speed, unit: m·s−1; vertical velocity, unit: m·s−1) Longitudinal-height vertical profiles.
When the difference between 850 and 500 hPa pseudo-equivalent temperatures (∆θse850–500) exceeds 8 K, it favors the development of strong convective weather in the “warm zone” [37]. At 20:00 BJT on 8 June, ∆θse850–500 reached 14 K, indicating a substantial amount of convective unstable energy over Ganzhou. It exceeded 6 K from 08:00 BJT to 20:00 BJT on 9 June, signifying a gradual release of unstable energy in the low-altitude boundary layer. In conjunction with the situational analysis, the region between Nanchang Station and Ganzhou Station is precisely located in the left front of the southwest LLJ. The continuous transport of warm and humid air leads to the formation of high temperature, high humidity, and high-energy unstable laminar junctions in the storm area on numerous occasions, fostering the occurrence and sustenance of heavy precipitation in the “warm zone” [38]. The “6.9” process is notably characterized by a higher frequency of “warm zone storm” occurrences.
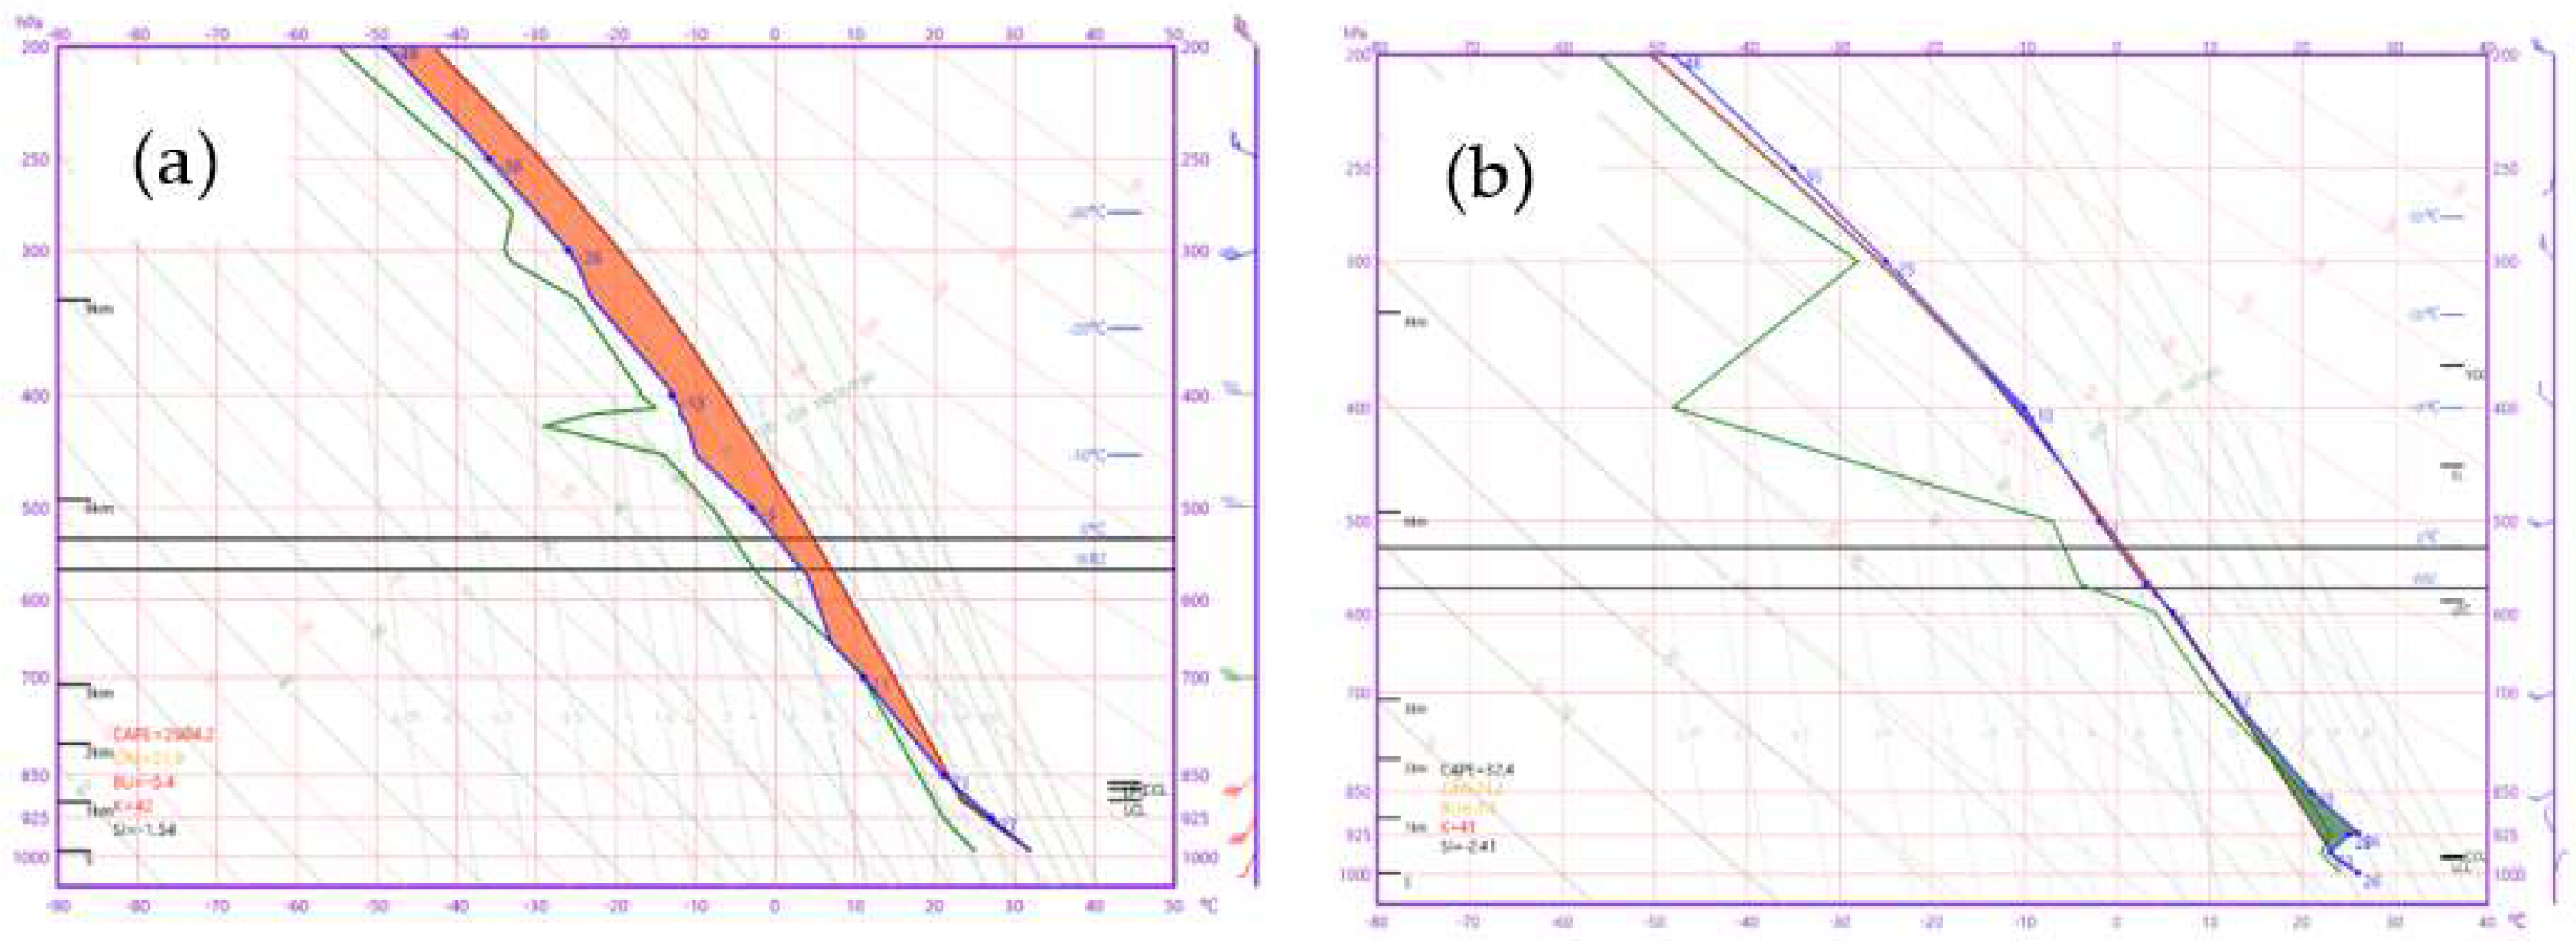
Examining the live-sounding T-logp chart at Ganzhou station (25.85° N, 114.95° E) on 8 June (Figure 7a), we observed that the atmosphere over Ganzhou was dominated by a southwest LLJ. This resulted in the transport of warm and humid air, leading to an unstable stratification characterized by high temperature, high humidity, and high energy. On the T-logp plot, the convective available potential energy (CAPE) reached its peak at 2904 J∙kg−1, and the K-index registered at 42 °C, with the elevated condensation height situated between 925 and 850 hPa. By 08:00 BJT on 9 June, the CAPE in Ganzhou had diminished to 1420 J∙kg−1, although the K-index remained notably high at 40 °C, and the lifting condensation height dropped below 925 hPa. Finally, at 20:00 BJT on 9 June, the Ganzhou CAPE had rebounded to 2050 J·kg−1, but the K-index had declined to 37 °C.
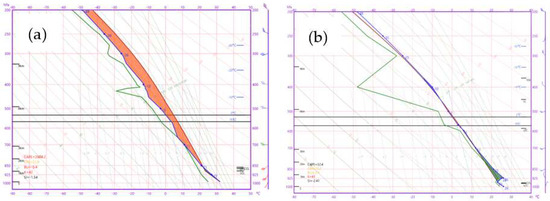
Figure 7.
T−logp soundings at 20:00 BJT on 8 June in Ganzhou (a) and at 20:00 BJT on 21 June in Nanchang (b).
During the “6.22” process, torrential to heavy rainfall primarily occurred along the shear line within a 100 km radius to the south (29−27.5° N). From 14:00 BJT to 20:00 BJT on 21 June, the area experienced light rain. At 20:00 BJT on 21 June, Nanchang observed a shift to northerly winds below 925 hPa, with cold air in the boundary layer moving southward and causing a frontal temperature inversion (Figure 7b). Initially, the convective available potential energy (CAPE) was only 58 J∙kg−1, but after revising for the 925 hPa inversion, it surged to 2207 J∙kg−1. The K-index mirrored that of the “6.9” process, reaching 41.7 °C. This indicates that above 925 hPa, the “6.22” process still operated under high temperature and humidity conditions. At 20:00 BJT on 21 June, the difference between 850 and 500 hPa pseudo-equivalent temperatures (∆θse850–500) also reached 11.9 K, suggesting that convective instability primarily manifested in the atmosphere above 850 hPa at the onset of the rainstorm. This favored the occurrence of short-duration heavy precipitation, which subsequently saw a rapid decline in convective instability. Radar echo analysis from 02:00 BJT to 14:00 BJT on 22 June revealed the ongoing development of a robust mesoscale convective system in the areas of Xinyu (114.88° E, 27.83° N), Pingxiang (113.85° E, 27.63° N), and central Jiangxi, resulting in six h of torrential to heavy rainfall. A comprehensive analysis implies that the “6.22” process may have transitioned from vertical to oblique convection, exhibiting more characteristics of a “frontal rainstorm.”
5. Comparative Analysis of Global-Scale and Mesoscale Numerical Model Forecasting Capabilities
5.1. Comparison of Precipitation
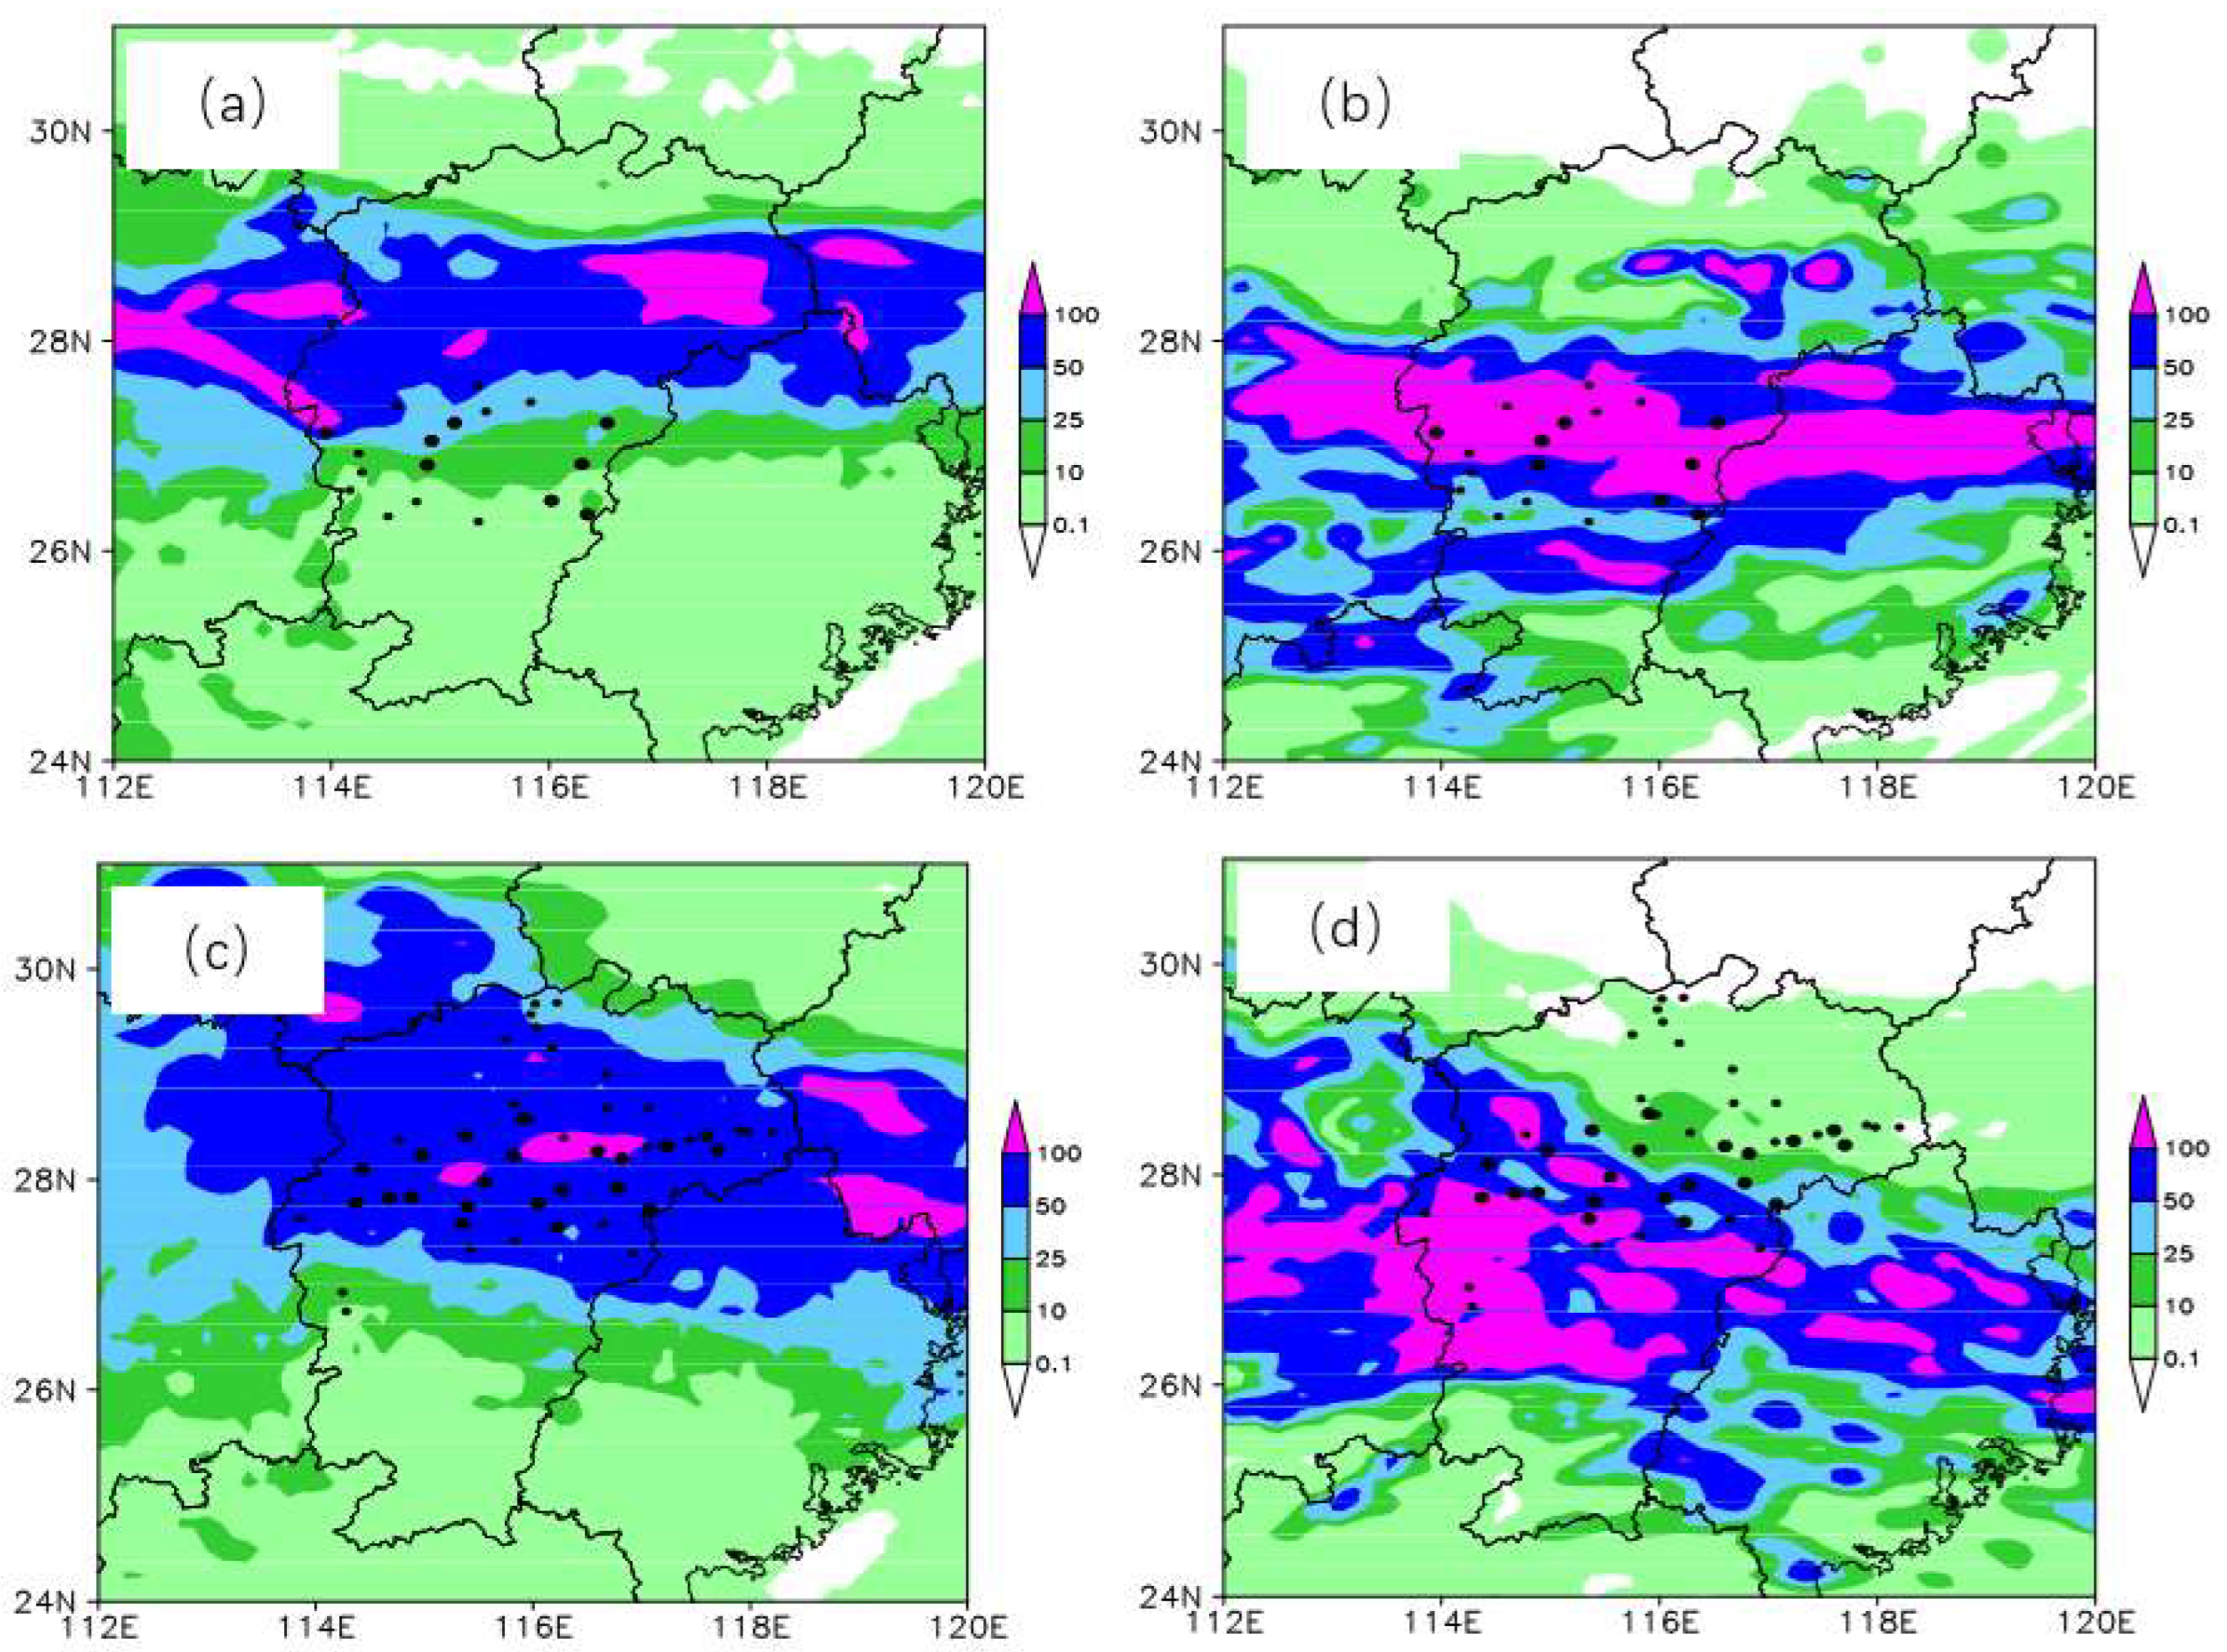
In the numerical model at 08:00 BJT on 8 June, ECMWF’s forecast for the primary rain band of the “6.9” process exhibited an error exceeding 100 km to the north, with a significant deviation in the location of the precipitation center (Figure 8a). The area experiencing heavy rainfall of 100 mm was limited, resulting in a TS of 0.05 for storm forecasting during the period. In contrast, the CMA-SH9 model accurately predicted the rainstorms and areas of heavy rainfall in the “6.9” process, even forecasting exceptionally intense rainfall with a TS of 0.44 during the rainstorm period (Figure 8b). However, for the “6.22” process, the ECMWF model accurately predicted rainfall in northern Gan and central-northern Gan, achieving a TS of 0.72 for rainfall forecasting (Figure 8c). On the other hand, the CMA-SH9 model primarily placed the storm belt further south, failing to provide information regarding heavy rainfall in the east and north of Jiangxi, resulting in a TS of only 0.37 (Figure 8d).
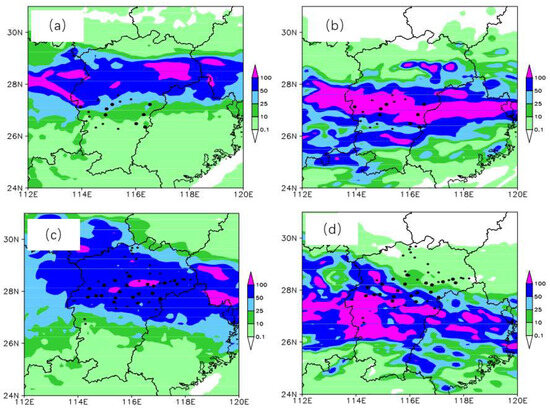
Figure 8.
(a,c) ECMWF and (b,d) CMA-SH9 distributions of 12–36 h precipitation forecasts (represented by color patches, unit: mm) and station realities for precipitation ≥ 50 mm (small black dots represent 50 mm ≤ R24 < 100 mm, large black dots represent R24 ≥ 100 mm) for (a,b) 20:00 BJT on 8 June to 20:00 BJT on 9 June, and (c,d) 20:00 BJT on 21 June to 20:00 BJT on 22 June.
The ECMWF model and the East China model were assessed at 20:00 BJT on 7 June and 20:00 BJT on 20 June, respectively, to evaluate their performance in forecasting heights, winds, temperatures, and barometric pressures over a 48 h period at 12 h intervals. A comparative analysis was conducted between real-time upper air conditions and the model forecasts, considering various factors such as the 500 hPa cold vortex, subtropical high pressure, low trough, 925–700 hPa low-altitude jets, shear lines, and 925 hPa temperature fronts. The study also examined possible causes of precipitation errors, focusing on weather system inaccuracies and identifying significant indicators in the model outputs.
5.2. Comparison of Environmental Conditions
During the “6.9” process, the ECMWF model accurately forecasted the southward movement of the 500 hPa northeast low vortex and the subtropical high pressure (588 dagpm) by 100–200 km between 08:00 BJT on 8 June and 08:00 BJT on 9 June. It also predicted the position of the 925–850 hPa shear line and the axis of the low-level jet stream at 925–850 hPa, along with an intensification trend in the jets during the night of 8 June. The primary inaccuracy stemmed from the presence of strong 925–850 hPa southwestern jets in south-central Jiangxi Province, resulting in a convergence of northward winds. This convergence zone may have significantly contributed to the model’s northward forecast of heavy precipitation. Similarly, the CMA-SH9 model accurately predicted the southward movement of the 500 hPa northeast low and 588 dagpm by 100–200 km. It closely aligned with the actual conditions in terms of the position of the 925–850 hPa shear line, the location of the 925 hPa southward jet, and the 850 hPa southwest jet axes. Adjacent to the south side of the 850 hPa shear line, alternating southwesterly and northwesterly winds (likely influenced by mesoscale weather systems) were observed. Several wind speeds cores above 20 m·s−1 on the jet axis affected south-central Jiangxi, leading to a convergence of strong low-level winds in central Jiangxi, which corresponded well with the area of heavy rainfall. Both the ECMWF and CMA-SH9 models accurately forecasted the location of the 925 hPa warm ridge in south-central Jiangxi at 20:00 BJT on 21 June. The ECMWF model predicted a warm ridge temperature of 24–25 °C, while the CMA-SH9 model forecasted a warm ridge temperature of 25–26 °C, which was much closer to the actual temperature of 27 °C at 20:00 BJT on 21 June in Ganzhou. At 08:00 BJT on 9 June, both models accurately predicted the values of the warm ridge. These crucial signals are essential for effectively adjusting the precipitation zones in the ECMWF model’s warm zone pattern.
During the “6.22” process, the ECMWF model accurately projected the position of the East Asian trough and the subtropical high pressure. It also provided more precise forecasts for the position of the southward-moving shear at 925–850 hPa, the southwesterly jets below the shear, and the easterly jets north of it. However, it predicted that the strong frontal zone of 925 hPa temperature in the boundary layer within Jiangxi would be slightly north of 27° N (with a temperature difference of approximately 7 °C between 27° N and 30° N). This slightly southward deviation from the actual location of the strongest frontal zone. Therefore, the ECMWF model performed well in forecasting the environmental conditions of this “frontal storm.” In contrast, the CMA-SH9 model offered a better overall forecast of the East Asian trough and the subtropical high pressure. At 20:00 BJT on 20 June, the 588 dagpm forecasted for 08:00 BJT on 22 June was 100–200 km to the south. The forecasted position of the low-level shear line also exhibited a southward bias, with a maximum error of 100–200 km. The wind speeds of the southwesterly and easterly jets on both sides of the shear line were slightly higher by 2 to 4 m·s−1. The forecast of a warm ridge at 925 hPa was weak, as was the frontal zone. Nevertheless, the frontal features could still be clearly analyzed. The CMA-SH9 forecasts of the middle and lower atmospheric fields were somewhat inaccurate, with fewer “significant” signals, making it more challenging to adjust.
6. Conclusions and Discussions
6.1. Conclusions
In this study, we compared and analyzed the principal precipitation characteristics and environmental field features of two heavy rainfall processes based on high-altitude ground observation data and NCEP reanalysis data. These processes occurred from 20:00 BJT on 8 June 2019 to 20:00 BJT on 9 June 2019 and from 20:00 BJT on 21 June 2019 to 20:00 BJT on 22 June 2019. Additionally, numerical model analysis was employed to support our findings. The following main conclusions were drawn:
- (1)
- “6.9” process was a ‘warm zone rainstorm’, and “6.22” process was a frontal rainstorm. The main difference in the distribution of two rainfall rain bands was that the “6.9” process exhibited distinct edges with a substantial precipitation gradient, whereas the rain band of the “6.22” process was relatively irregular and had a smaller precipitation gradient;
- (2)
- At 200 hPa geopotential height, the weather condition was a more pronounced radial field over Jiangxi during the “6.9” process than “6.22” process. At 500 hPa geopotential height, the middle and high latitudes of Asia exhibited a “Two Troughs and a Ridge” pattern. In the “6.9” process, a stronger northeast cold vortex was present, and the subtropical high pressure was positioned two latitudes to the south than the “6.22” process;
- (3)
- Different dynamical and thermal (frontal zone) structures were observed on opposing sides of the low-level shear line. The rainstorm precipitation zone appeared within the 925 hPa warm ridge in the “6.9” process. In contrast, the “6.22” process with the storm predominantly occurred along the strong temperature fronts at 925 hPa geopotential height. It experienced convective instability energy release in the early phase and a tendency toward vertical convection, shifting to oblique uplift convection later;
- (4)
- The precipitation location and intensity forecast by CMA-SH9 at the “6.9” process is better than that of ECMWF, while ECMWF’s prediction of the rainfall area and weather situation of the “6.22” process is better. The ECMWF numerical model correctly forecasts the mid-level and upper-level circulation fields, the presence of LLJ, and the boundary layer warm ridges that are favorable for the occurrence of heavy rainfalls, and these valuable signals play an important role in the effective revision of the precipitation fallout area in the warm zone of the ECMWF model.
6.2. Discussions
In recent years, forecasters have gradually recognized and accepted the differences in forecast performance between the CMA-SH9 and ECMWF models for different storm types, such as “warm zone rainstorms” and “frontal rainstorms,” as well as the approach to revising rainfall zones. However, effectively analyzing the valuable signals in the model forecasts remains a complex task in practice. This paper aims to analyze and explore this concept, and the practical application of this analysis has yielded favorable results.
This paper qualitatively discusses the differences in precipitation zones and physical characteristics between the two types of rainstorms, but this analysis is based on the fact that both types of precipitation are continuous and stable. Sometimes, the fronts move faster, and the warm-zone rainstorms will be transformed into frontal rainstorms, which makes the situation more complicated and requires more in-depth and detailed analysis in order to obtain more refined research conclusions.
Author Contributions
Conceptualization, A.X. and Y.L.; methodology, A.X.; software, A.X., Y.L. and F.Z.; formal analysis, A.X. and L.Z.; writing—review and editing, A.X. and Y.L.; data collection and curation, L.L.; supervision, A.X.; visualization, A.X., L.Z. and F.Z.; funding acquisition, Y.L. All authors have read and agreed to the published version of the manuscript.
Funding
This study was jointly supported by the Innovation and Development Program of China Meteorological Administration (Grant No. CXFZ2021Z012), the Key Program (Grant No. JX2023Z05) of the Jiangxi Meteorological Bureau, and the Weather Forecast Recovery Project of the China Meteorological Administration (Grant No. FPZJ2023-070).
Institutional Review Board Statement
Not applicable.
Informed Consent Statement
Not applicable.
Data Availability Statement
The data that support our research findings are available from the. corresponding author on request. The data are not publicly available due privacy.
Conflicts of Interest
The authors declare no conflicts of interest.
References
- Zhao, Y.C.; Cui, C.G. A Study of Rainstorm Process Triggering Zhouqu Extremely Mudslide on 8 August 2010. Torr. Rain Dis. 2010, 29, 91–97. (In Chinese) [Google Scholar]
- Chen, J.; Xie, Y.Y.; Zhang, R.Y.; Li, P.Y.; Zhang, C.C.; Duan, L.Y. Risk assessment of rainstorm waterlogging disaster based on urban rainstorm waterlogging mathematical model in Fuzhou city. Torr. Rain Dis. 2020, 39, 89–95. (In Chinese) [Google Scholar]
- Du, X.L.; Peng, F.; Lan, W.; Zhang, Y.M.; Zhu, Y.L. Analysis of precipitation background of “7. 23” Shuicheng landslide. Torr. Rain Dis. 2020, 39, 344–353. (In Chinese) [Google Scholar]
- Di, J.Y.; Xu, F.W.; Bao, H.J.; Xu, C.P.; Zhang, G.P. Research on precipitation characteristics and dynamic critical thresholds of flash flood disasters. Torr. Rain Dis. 2021, 40, 655–663. (In Chinese) [Google Scholar]
- Xiao, A.; Shan, J.; Chen, H.; Bao, H.; Xia, H.; Li, Z.; Liu, X. Mesoscale Characteristics of Exceptionally Heavy Rainfall during 4–6 May 2023 in Jiangxi, China. Atmosphere 2023, 14, 1735. [Google Scholar] [CrossRef]
- Xiao, A.; Xu, A.H. Cause analysis on false prediction of an extreme heavy rain event in Southern China in 2016. Torr. Rain Dis. 2018, 37, 124–134. (In Chinese) [Google Scholar]
- Tang, C.S.; Gan, R.J.; Cheng, Z.P. Study on climate characteristics of heavy rain and its reappearing period of extreme precipitation in Jiangxi. Meteor. Dis. Reduc. Res. 2021, 44, 164–171. (In Chinese) [Google Scholar]
- Zhang, Y.X.; Hu, Z.H. Variation Characteristics of Rainstorms in Middle-Lower Reaches of the Yangtze River in Recent 60 Years. Climatic Environ. Res. 2019, 24, 55–768. (In Chinese) [Google Scholar]
- Que, Z.P.; Ling, T.; Wu, F.; Chen, Y.H. Analysis of Water Vapor Characteristics During a Continuous Heavy Rainfall Process in Jiangxi Province. Arid. Meteorol. 2021, 39, 76–86. (In Chinese) [Google Scholar]
- Shen, X.Y.; Sha, S.; Li, X.F. The Study of Multi-scale Energy Interactions during a Meiyu Front Rainstorm. Part Ⅰ: Theoretical Analysis. Chin. J. Atmos. Sci. 2018, 42, 1109–1118. (In Chinese) [Google Scholar]
- Zhou, Z.M.; Cui, C.G.; Hu, Y. Sensitivity of Microphysical Parameterization on the Numerical Simulation of a Meiyu Front Heavy Rainfall Process. Chin. J. Atmos. Sci. 2021, 45, 1292–1312. (In Chinese) [Google Scholar]
- Ding, Y.; Liu, Y.; Hu, Z.Z. The Record-breaking Meiyu in 2020 and Associated Atmospheric Circulation and Tropical SST Anomalies. Adv. Atmos. Sci. 2021, 38, 1980–1993. [Google Scholar] [CrossRef] [PubMed]
- Zhao, Y.F.; Li, X.H.; Peng, X.D. The development of the GRAPES_YY model and its performance verification for Meiyu frontal precipitation simulation. Acta Meteorol. Sin. 2020, 78, 623–635. (In Chinese) [Google Scholar]
- Sha, S.; Shen, X.Y.; Li, X.F. The Study of Multi-scale Energy Interactions during a Meiyu Front Rainstorm. Part Ⅱ: Practical Application. Chin. J. Atmos. Sci. 2018, 42, 1119–1132. (In Chinese) [Google Scholar]
- Du, X.L.; Wu, L.; Yang, X.Z.; Lu, L.; Wei, T.; Yu, Q. Analysis of environment conditions of a sustained heavy rain event occurred in western Meiyu front and cause of extreme precipitation in Guiyang. Torr. Rain Dis. 2016, 35, 415–426. (In Chinese) [Google Scholar]
- Yang, S.N.; Lu, Y.X.; Yu, C. Analysis on Mesoscale Convective System and Impact of Low Level Wind in a Meiyu Heavy Rainfall Event. Meteorol. Mon. 2001, 43, 21–33. (In Chinese) [Google Scholar]
- Xu, Y.Q.; Wu, S.T.; Yang, W.W.; Liu, X.H.; Huang, Y. Analysis of Frontogenesis and Circulation Characteristics of the Meiyu Front with Heavy Precipitation in Zhejiang Province. Chin. J. Atmos. Sci. 2019, 43, 1219–1232. (In Chinese) [Google Scholar]
- Xu, Y.; Meng, Y.Y.; Zhang, G.H.; Zhang, L.B. Analysis on the Formation of a Warm sector Torrential Rain Case with Tornado in Heilongjiang. Desert Oasis Meteorol. 2020, 14, 40–48. (In Chinese) [Google Scholar]
- Wang, L.G.; Chen, Y.; Xiao, T.G.; Li, S.Q.; Ge, L. Statistical Analysis of Warm-Sector Rainstorm Characteristics over the Southern of Middle and Lower Reaches of the Yangtze River in Summer. Meteorol. Mon. 2018, 44, 771–780. [Google Scholar]
- Tian, Y.; Ye, C.Z.; Yao, R. Statistical analysis of the characteristics of warm-sector rainstorms in the southern part of the Yangtze River during the period of 2008—2018. Trans Atmos Sci. 2022, 45, 51–64. (In Chinese) [Google Scholar]
- Wang, X.C.; Li, S.J.; Meng, Y.J. Characteristics and difference analysis of main rainstorm processes in Yangtze River Basin from June to July during 2016–2020. Arid Meteorol. 2021, 39, 921–929. (In Chinese) [Google Scholar]
- Qi, L.B.; Xu, J. Rethink on Short Range Forecast of the 9 July Severe Rainstorm in Northern Henan. Meteorol. Mon. 2018, 44, 1–14. [Google Scholar]
- Zhang, C.; Luo, B.L.; Peng, L.L.; Xie, A.; Li, Y.Z. The strong signals and forecast conceptual model for regional persistent torrential rain in Hunan in June. Torr. Rain Dis. 2021, 40, 37–43. (In Chinese) [Google Scholar]
- Li, G.P.; Zhang, W.C. Recent advances in the research of heavy rain associated with vortices and shear lines come from the Tibetan Plateau. Torr. Rain Dis. 2019, 38, 464–471. (In Chinese) [Google Scholar]
- Hu, Y.P.; Shan, T.L.; Gu, J.J. Analysis of forecast error for a short-term extreme precipitation event in the Shaying River Basin. Torr. Rain Dis. 2021, 40, 494–504. (In Chinese) [Google Scholar]
- Gou, A.N.; Wang, Y.J.; Zhang, J.G.; Wu, T.; Han, F.R.; Leng, L. Analysis on Heavy Rainfall Event Caused by”Train Effect”in a Meiyu Front of Hubei Province. Meteorol. Mon. 2019, 45, 1052–1064. [Google Scholar]
- Wang, H.; Li, H.Y.; Zhong, J.Q. The Formation of an Unusual Two-belt Heavy Rainfall around Beijing-Tianjin-Hebei Area. Plateau Meteorol. 2019, 38, 856–871. (In Chinese) [Google Scholar]
- Zhang, G.L.; Hang, Y.H.; Fu, L.J. Causes of a Torrential Rainstorm Induced by “Train Effect” in Hetao Area. Plateau Meteorol. 2020, 39, 788–795. (In Chinese) [Google Scholar]
- Chen, T.; Zhang, F.H.; Yu, C.; Ma, J.; Zhang, X.D.; Shen, X.L.; Zhang, F.; Luo, Q. Synoptic Analysis of Extreme Meiyu Precipitation over Yangtze River Basin During June–July 2020. Meteorol. Mon. 2020, 46, 1415–1426. [Google Scholar]
- Wu, Z.F.; Cai, J.J.; Lin, L.X.; Hu, S. Analysis of Mesoscale Systems and Predictability of the Torrential Rain Process in Guangzhou on 7 May 2017. Meteorol. Mon. 2018, 44, 485–499. [Google Scholar]
- Cao, P.P.; Kang, L.; Wang, J.J.; Fan, J.L.; Zhang, Q. Calibration of ECMWF model forecast of summer heavy rainfalls in Sichuan. Torr. Rain Dis. 2020, 39, 63–70. (In Chinese) [Google Scholar]
- Wu, G.X.; Cai, Y.P.; Tang, X.J. Moist Potential Vorticity and Slantwise Vorticity Development. Acta Meteor. Sinica 1995, 4, 387–405. (In Chinese) [Google Scholar]
- Gao, S.T.; Lei, T.; Zhou, Y.S. Moist Potential Vorticity Anomaly with Heat and Mass Forcings in Torrential Rain Systems. Chin. Phys. Lett. 2002, 19, 878. [Google Scholar]
- Zhu, Q.G.; Lin, J.R.; Shou, S.W.; Tang, D.S. Principles and Methods of Meteorology; Chinese Meteorol Press: Beijing, China, 2007. [Google Scholar]
- Yang, X.L.; Yang, M.; Duan, Y.H.; Zhu, G.; SUN, Y. Analysis on causes of a warm-sector torrential rain event in the Beijing-Tianjin-Hebei region. Torr. Rain Dis. 2021, 40, 455–465. (In Chinese) [Google Scholar]
- Xu, W.H.; Ni, Y.Q.; Wang, X.K.; Gu, C.L.; Wang, H.; Jin, W.Y. Moistpotential vorticity analysis of the evolution mechanism of a strong mesoscale convective system in a landing typhoon. Acta Meteorol. Sin. 2010, 1, 88–101. (In Chinese) [Google Scholar]
- Xu, A.H.; Zhang, Y.; Liu, X.Y. Diagnosis of Thermal and Dynamic Conditions of warm zone Severe Convection in Jiangxi Province. Meteorol. Mon. 2001, 27, 30–34. (In Chinese) [Google Scholar]
- Sun, J.S.; Lei, L.; Yu, B.; Ding, Q.L. The fundamental features of the extreme severe rain processes in the recent 10 years in the Beijing area. Acta Meteorol. Sin. 2015, 4, 609–623. (In Chinese) [Google Scholar]
Disclaimer/Publisher’s Note: The statements, opinions and data contained in all publications are solely those of the individual author(s) and contributor(s) and not of MDPI and/or the editor(s). MDPI and/or the editor(s) disclaim responsibility for any injury to people or property resulting from any ideas, methods, instructions or products referred to in the content. |
© 2024 by the authors. Licensee MDPI, Basel, Switzerland. This article is an open access article distributed under the terms and conditions of the Creative Commons Attribution (CC BY) license (https://creativecommons.org/licenses/by/4.0/).

