1. Introduction
Shandong province is located in the East Asian monsoon region, positioned at the climatic transition zone between southern and northern China. Extreme precipitation events such as heavy rainfall are relatively frequent, impacting both industrial and agricultural development [
1,
2,
3]. Heavy rainfall is the result of the combined effects of multi-scale systems, among which the low-altitude jet stream plays a significant role in promoting the occurrence of heavy rainfall [
4,
5]. This low-altitude jet stream is a key weather system in the genesis of heavy rain, evident in its role in transporting water vapor to regions of intense precipitation. The combined action of low-altitude and high-altitude jet streams provides the necessary dynamic and thermodynamic instability conditions for heavy rainfall [
6,
7,
8,
9]. Cheng et al. [
10] analyzed the continuous and widespread heavy rainfall brought to Guangdong by the strong typhoon ‘Utor’ after its landfall. It is found that the maintenance of the unstable stratification is mainly due to the warm advection to Guangdong transferred by the low-level jet. Further studies reveal a truth that the low-level jet, originally cold over the sea, is warmed and blows to Guangdong when it moves across a warm air mass, which is forced from the land to the upstream region of Guangdong by the outer circulation of ‘Utor’ while it is approaching Guangdong. The result of the temperature diagnosis function confirms it. Due to the heating effect of the lower layer, the lower air warms up rapidly and rises, gradually forming a vertical circulation. The vertical circulation causes the convergence of lower-level air towards the center, resulting in a low-level jet stream. One theory suggests that during heavy rainfall processes, the release of latent heat from convective condensation plays an important role in heating the lower atmosphere and contributes to the formation of low-level jet streams [
11,
12]. The latent heat released by intense precipitation increases available convective potential energy, fostering the development of disturbances. In an unstable atmospheric stratification, the heating from water vapor condensation latent heat leads to mutual promotion between specific wind fields and vertical circulations. This positive feedback process between the two strengthens the horizontal wind field [
13], encouraging the formation and development of the low-altitude jet stream. Under the influence of disturbances, the more unstable the atmospheric stratification, the stronger the effect of water vapor condensation heating, resulting in a stronger low-altitude jet stream [
14,
15].
Previous studies have indicated that condensation latent heat heating plays a significant role in maintaining and evolving low-pressure circulation systems. Diabatic heating in the atmosphere affects the occurrence and development of weather systems and is closely related to weather processes like precipitation [
16]. When widespread rainfall occurs in the southern part of East Asia, the corresponding diabatic heating serves as an effective Rossby wave source in the Northwest Pacific, stimulating a wave train that propagates along a great circle path in this region. This diabatic heating process might have a modulating effect on the atmospheric teleconnections in the Northwest Pacific region, potentially influencing weather patterns in East Asia, as well as the development of systems like the Aleutian Low, thereby affecting the distribution of extreme precipitation [
17,
18,
19]. Scholars have summarized the dynamic and thermodynamic structure of low vortices, noting their significant energy conversion and dispersion characteristics during heavy rainfall processes [
20]. Diabatic heating usually leads to the strengthening of cyclones [
21]. Precipitation and low vortex occur almost simultaneously, and the release of latent heat from precipitation continuously strengthens the updraft near the center of convection. The enhanced release of condensation latent heat increases the local vorticity, increases the positive vorticity near the center of the low vortex, and enhances the cyclonic circulation [
22]. Shen et al. [
23] investigated an extratropical cyclone that produced extreme precipitation, calculated the contribution of condensation latent heat release to the relative vorticity tendency of the cyclone, and found that condensation latent heat release can not only directly induce vorticity tendency but also further cause vorticity tendency by changing the temperature gradient. The vorticity occurrence area is always located directly below the center of latent heat heating. Song et al. [
24] analyzed through sensitivity experiments and found that the intensity of the low vortex is weak when there is a lack of condensation latent heat heating. The condensation latent heating extends the updraft near the center of the cyclone to the upper levels, resulting in strong convection activities. The deep updraft releases more latent heat, forming a positive feedback mechanism. The positive potential vorticity change generated by the vertical gradient term of condensation latent heating in the lower layer is beneficial to the enhancement of the cyclone [
25]. Diabatic heating affects the formation and evolution of clouds in multiple ways. In warm clouds, diabatic heating promotes the formation and growth of water droplets, thereby increasing the intensity and range of precipitation. Precipitation processes dominated by warm clouds are more efficient. In cold clouds, diabatic heating can promote the formation and growth of ice crystals, thereby altering the nature of the clouds and the precipitation process [
26,
27].
The condensation latent heat released during the heavy rainfall process constitutes the main part of atmospheric diabatic heating. This paper will analyze a regional heavy rainfall process formed by the joint participation of a low-pressure system and a low-level jet stream. By calculating the atmospheric heat source, this paper analyzes its temporal and spatial changes during the heavy rainfall process, revealing the role of diabatic heating in heavy rainfall.
2. Data Sources
This study utilizes daily precipitation data from 124 national ground meteorological observation stations in Shandong province recorded by the China Meteorological Administration. The real-time rainfall data correspond to the hourly precipitation data from these 124 observation stations between 25 and 26 June 2018. The European Centre’s ERA5 hourly reanalysis data are used to compute atmospheric heat sources and analyze circulation fields. Satellite cloud images and satellite-observed lightning positioning are sourced from the Fengyun-4 satellite, monitoring data of raindrop spectrum monitors.
The actual formation and dissipation of fronts occur In three-dimensional space. However, in practical analysis and forecasting work, several layers of isobaric charts and surface maps are commonly used to understand the spatial structure of fronts. Therefore, this article will analyze them using the two-dimensional kinematical conditions for frontogenesis. The frontogenesis function is defined as
, where
represents the potential temperature [
28]. In regions governed by saturated moist air, where condensation precipitation occurs, potential temperature is no longer a conservative quantity. Hence, this study uses equivalent potential temperature,
, in lieu of
. The frontogenesis equation can be rewritten as follows:
Computation of Apparent Heat Source: The “backward method” is employed to calculate the atmospheric apparent heat source [
29]. The equation is given as
where
represents the apparent heat source. On the right side of the equation, the terms, respectively, denote local temperature variation, horizontal temperature advection, and vertical temperature variation. Here,
is the temperature,
represents horizontal velocity,
is the vertical velocity,
is the potential temperature, and
is the specific heat at constant pressure.
Apparent Moisture Sink Calculation: The apparent moisture sink is calculated as
where
denotes the apparent moisture sink, and
stands for specific humidity. The term
provides the warming rate induced by the heat released from the condensation of water vapor per unit mass of air over a unit time interval [
22]. By vertically integrating
and
from the top of the troposphere (taken as 100 hPa) to the ground, we can obtain the overall atmospheric apparent heat sources, <
> and <
>.
3. Weather Observations and Meteorological Situation
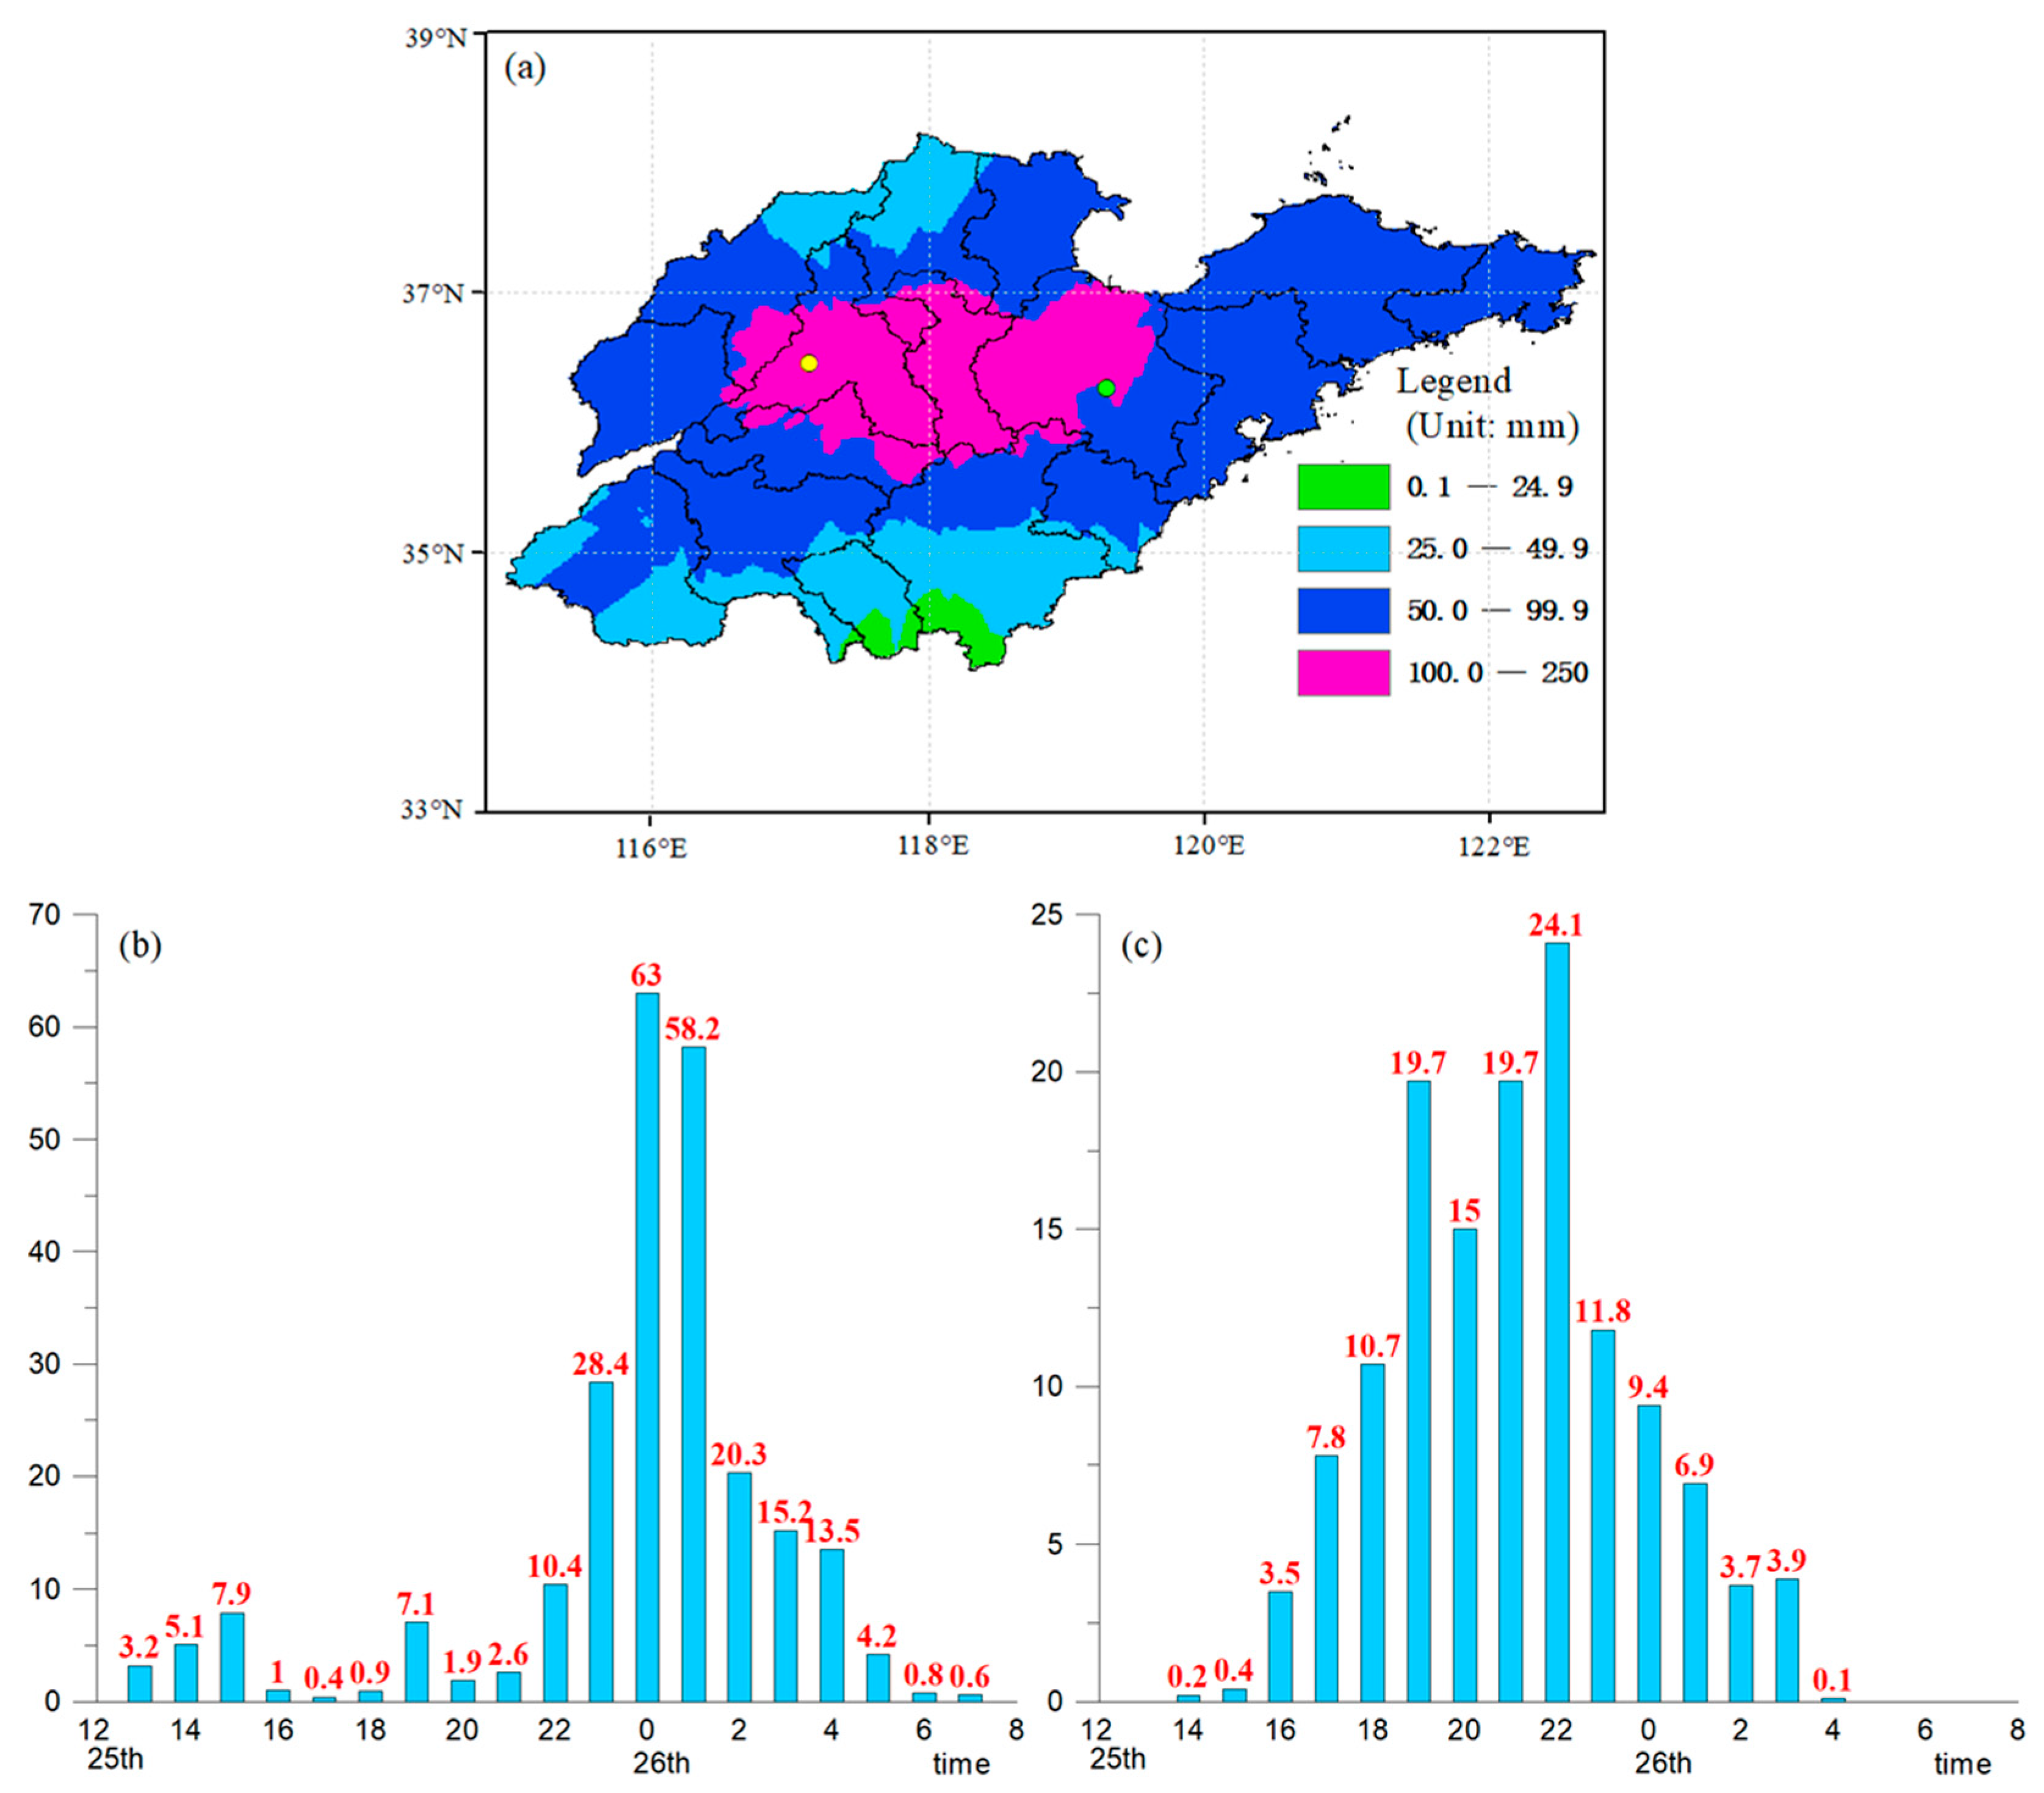
Affected by the upper-level trough and the shear line at the edge of the subtropical high pressure, Shandong province experienced a widespread heavy rainfall to torrential rain process on 25 June 2018 (
Figure 1a). The area of torrential rain was mainly concentrated in the central part of Shandong province, with the maximum rainfall reaching 244.7 mm (in Anqiu, Weifang). This rainstorm event was characterized by its large scale, high magnitude, and intensity. The rainfall in the central part of Shandong province was mainly concentrated from noon to night on the 25th. Among them, Anqiu recorded a maximum 1 h rainfall of 63 mm (
Figure 1b), and the provincial capital Jinan recorded an hourly maximum rainfall of 24.1 mm (
Figure 1c).
Figure 2 shows that during the rainfall process, the subtropical high-pressure system and the westerly high-pressure ridge merged and strengthened, stably maintaining along the eastern coast. This acted as a barrier to the upstream low vortex, causing the low vortex system to remain and intensify. From 08:00 to 20:00 on the 25th, the northern trough moved eastward and combined with the southern branch. The 500 hPa subtropical high-pressure system strengthened and extended westward, forming a significant pressure gradient with the low-value system on the west. This led to an increase in the wind speed at the lower 850 hPa layer, intensifying the jet stream. Furthermore, being obstructed by the subtropical high, the trough moved slowly and had a prolonged impact. The central region of Shandong is located on the southern side of the low-level shear line and the left side of the low-level jet stream exit region. The strong low-level convergence and lifting cause water vapor to condense and release unstable energy, forming intense rainfall. A deep and strong southwesterly jet stream is the key system in the formation of this heavy rainfall event. The strong southwest low-level jet stream transports warm and moist air northward, with obvious low-level warming and humidification, enhancing the thermodynamic instability of the stratification. The positive vorticity advection area ahead of the 500 hPa trough intensifies upper-level divergence; the south side of the 850 hPa shear line overlaps with the left side of the southwest jet stream exit area, strengthening low-level convergence. Under this configuration of divergence and convergence, the updrafts strongly develop and are sustained in the central Shandong region, resulting in long-duration, high-efficiency precipitation.
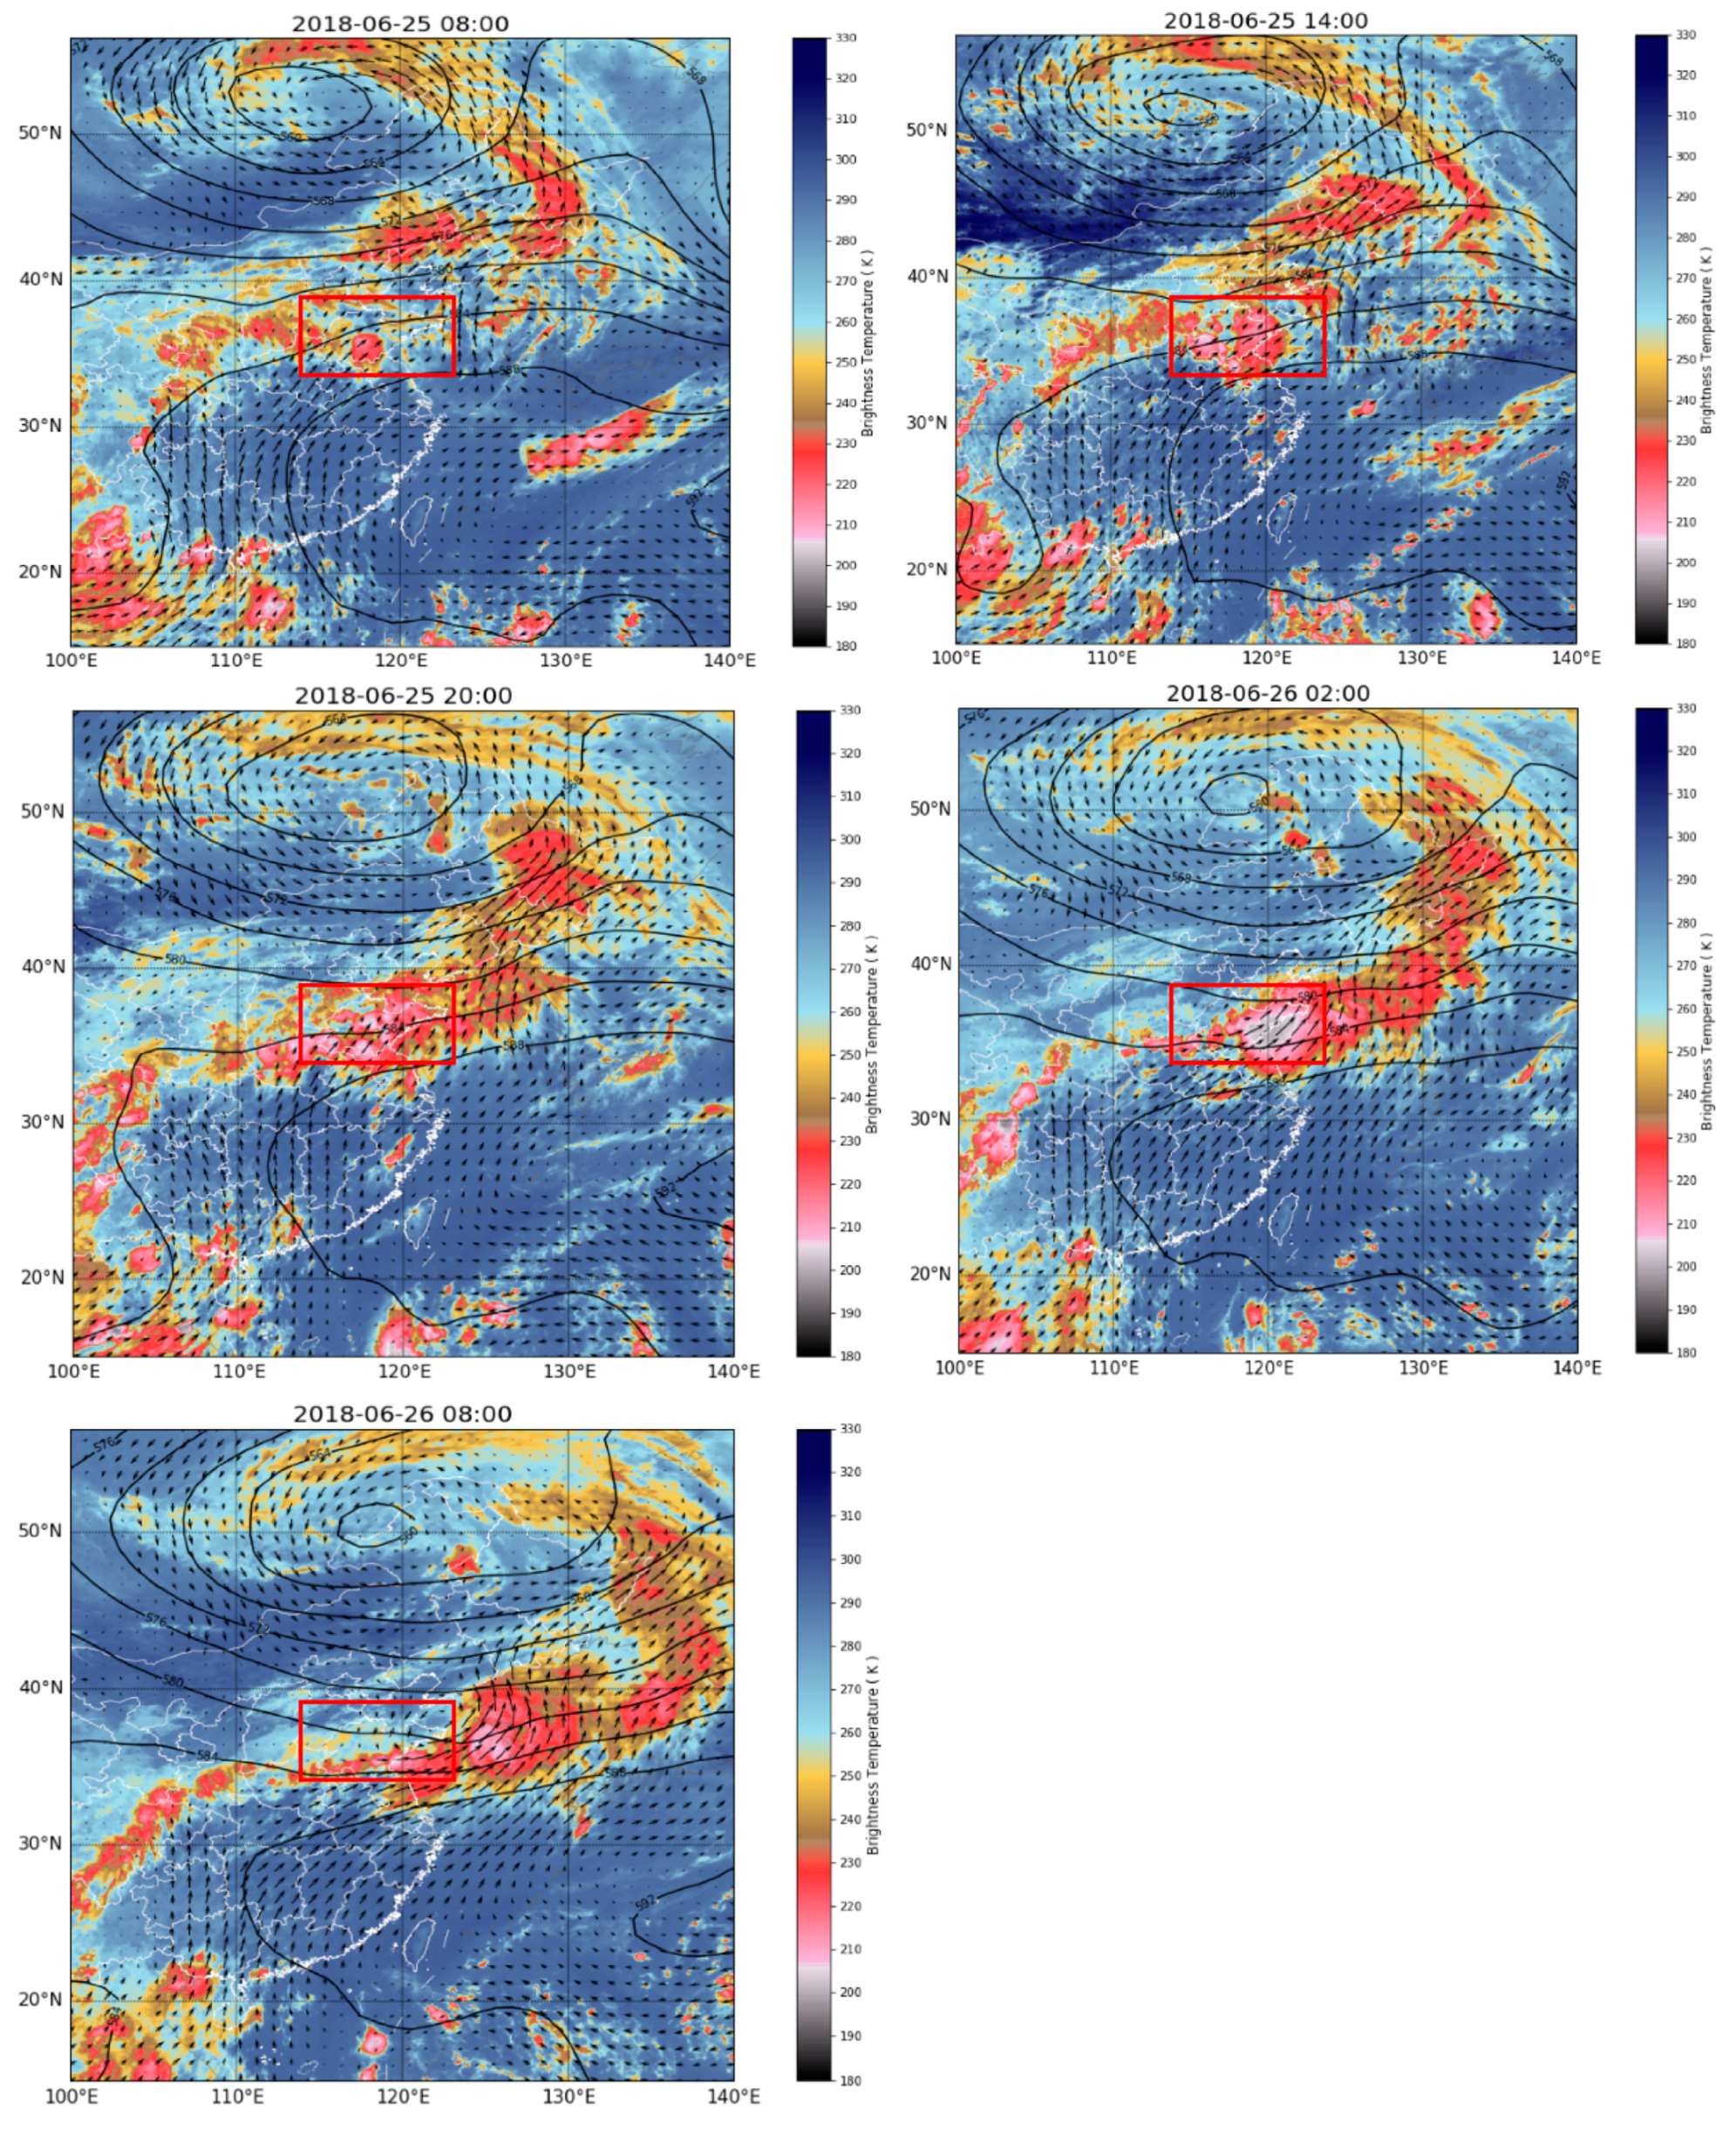
From the infrared cloud images (
Figure 2), at 08:00 on the 25th, convective cloud clusters gradually developed in the southern part of Shandong province, with the cloud top brightness temperature around 210 K in the most developed areas. By 20:00 on the 25th, the rainfall cloud zone was thriving, and most parts of Shandong province were affected by these rain cloud clusters. By 02:00 on the 26th, as influenced by the low-level jet stream, the rainfall cloud zone moved in a northeast direction and gradually strengthened, with the cloud top brightness temperature of the most active areas around 200 K.
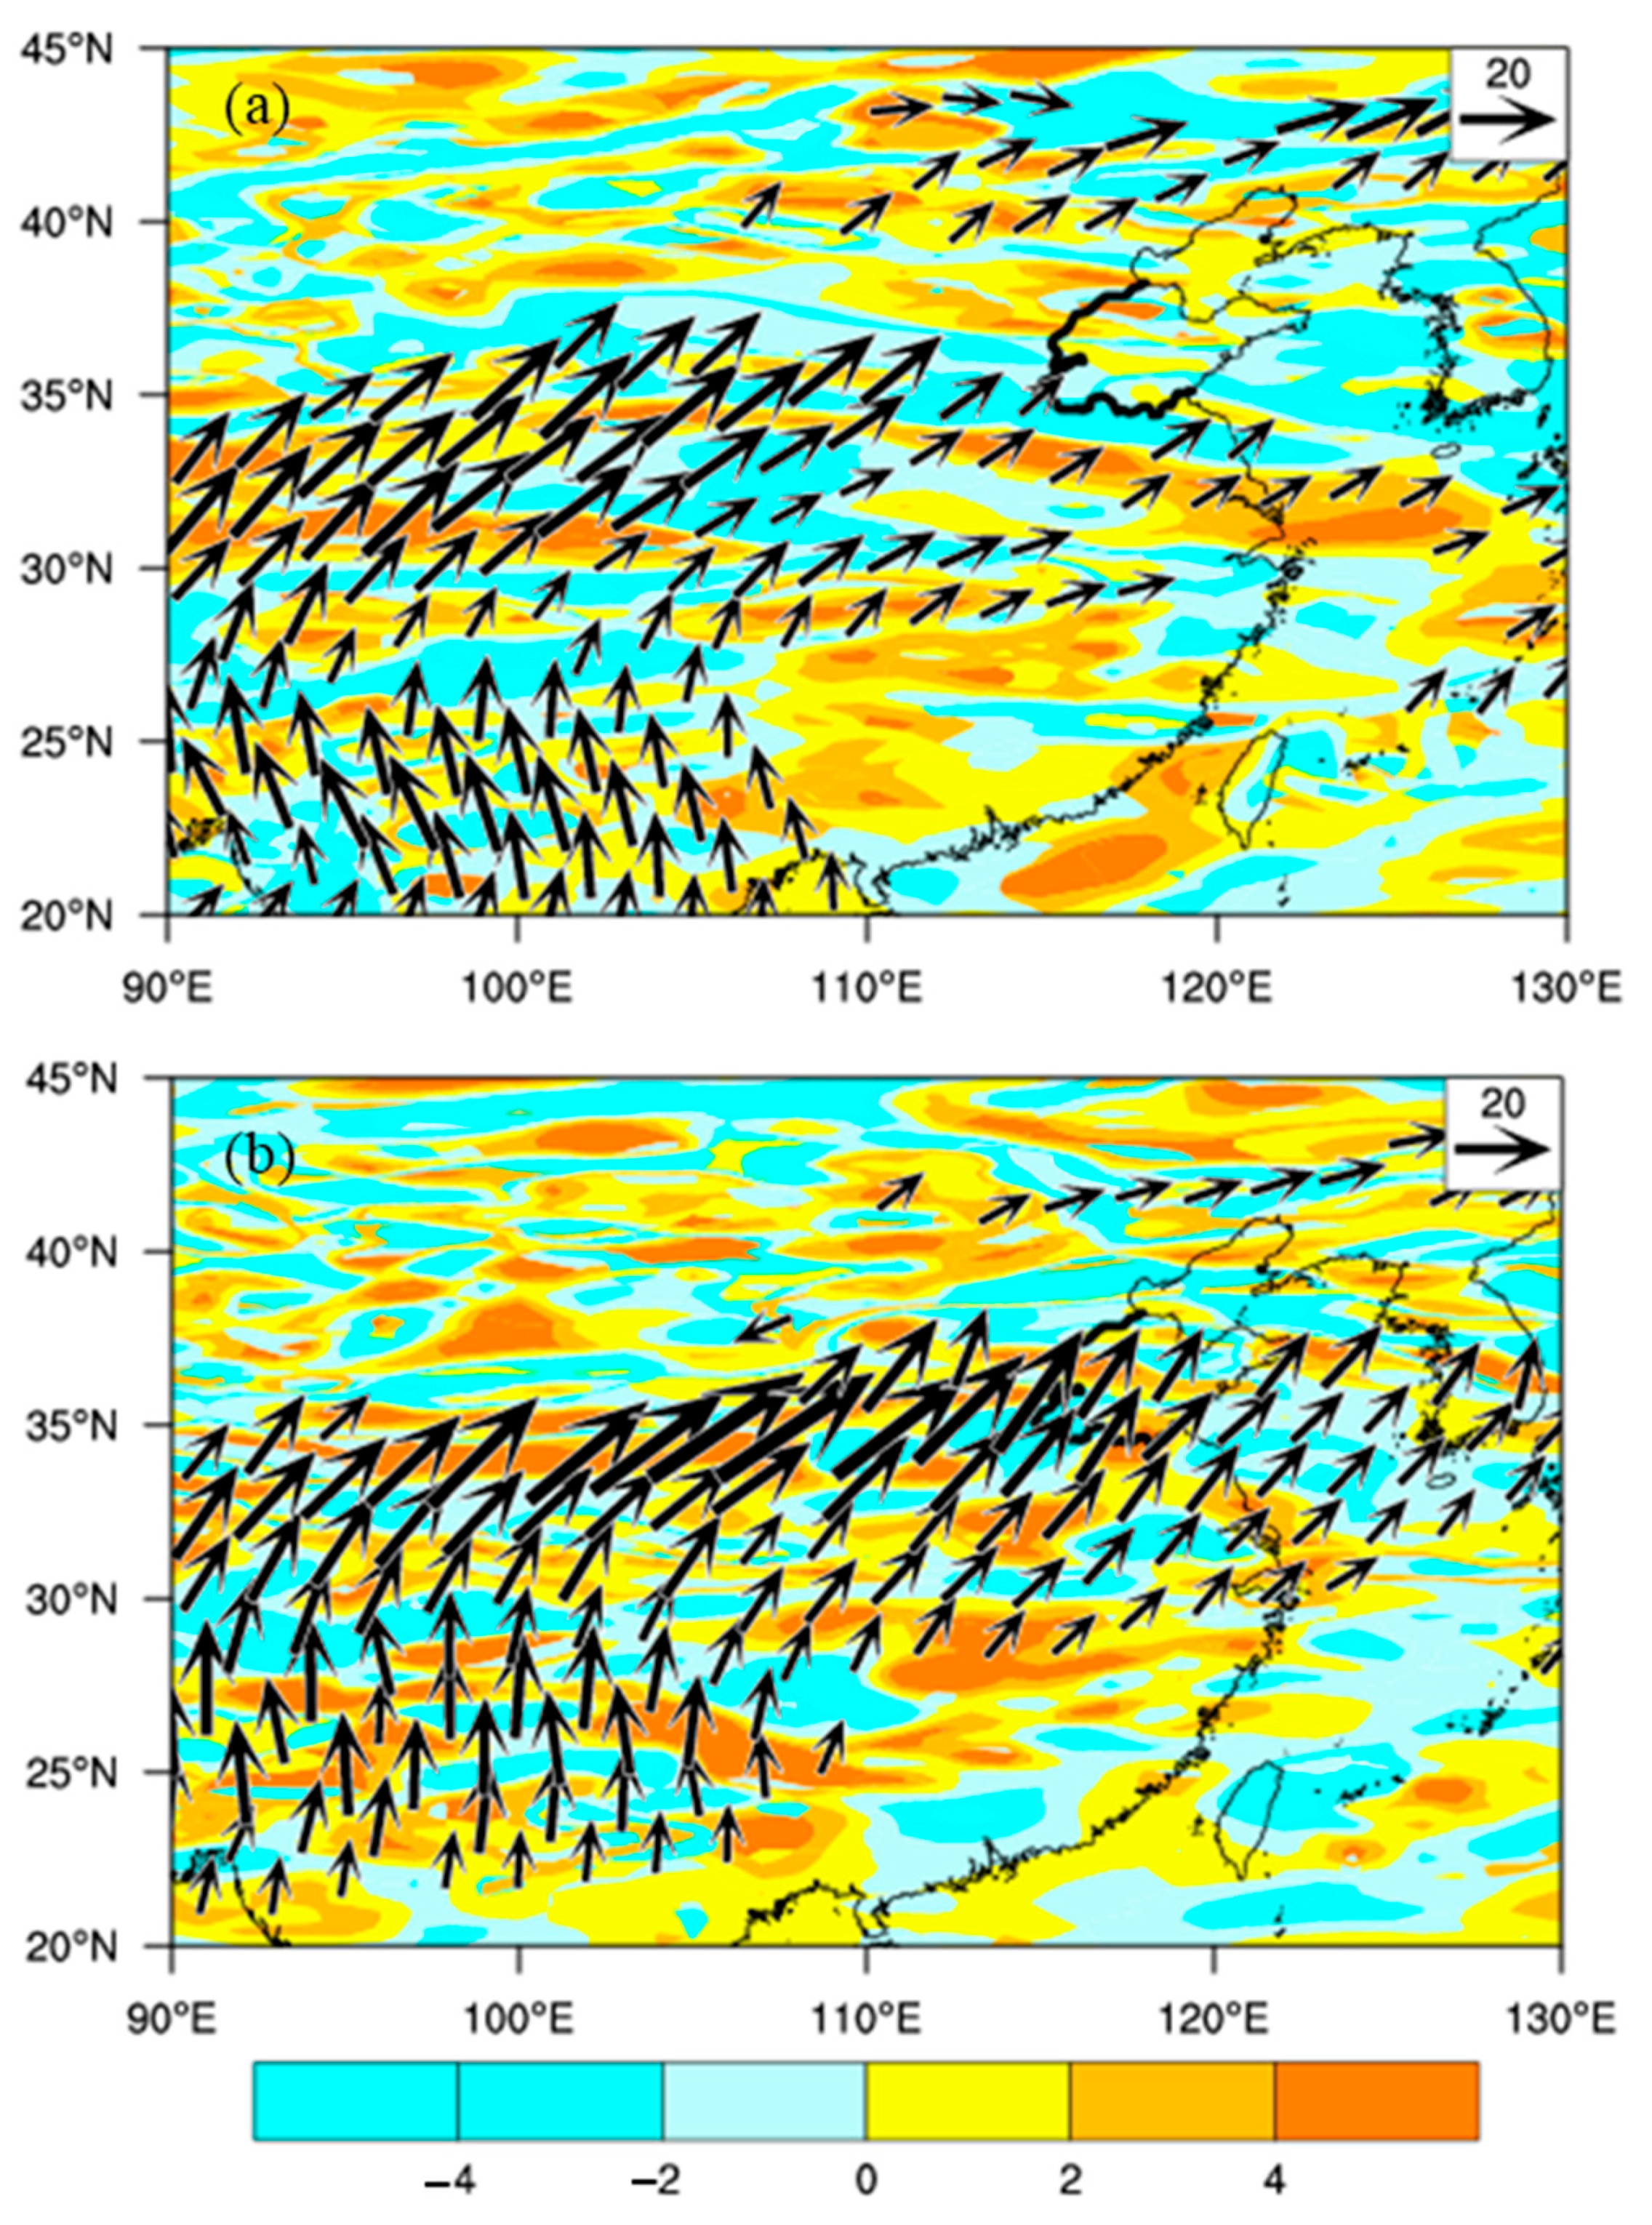
At 08:00 on the 25th (
Figure 3a), a moisture channel originating from the South China Sea had already formed. However, most areas of Shandong province were not yet in the convergence zone of moisture flux divergence. By 20:00 on the 25th (
Figure 3b), the moisture flux intensified towards the north, and most parts of Shandong province, especially the central region, were in the convergence zone of the moisture flux divergence, resulting in favorable conditions for moisture transportation and accumulation.
4. Heat Source Analysis
As shown in
Figure 1b, the concentrated precipitation period in Anqiu was from 23:00 on the 25th to 02:00 on the 26th. The hourly full-layer wind field and temperature advection in Anqiu from 08:00 on the 25th to 08:00 on the 26th (
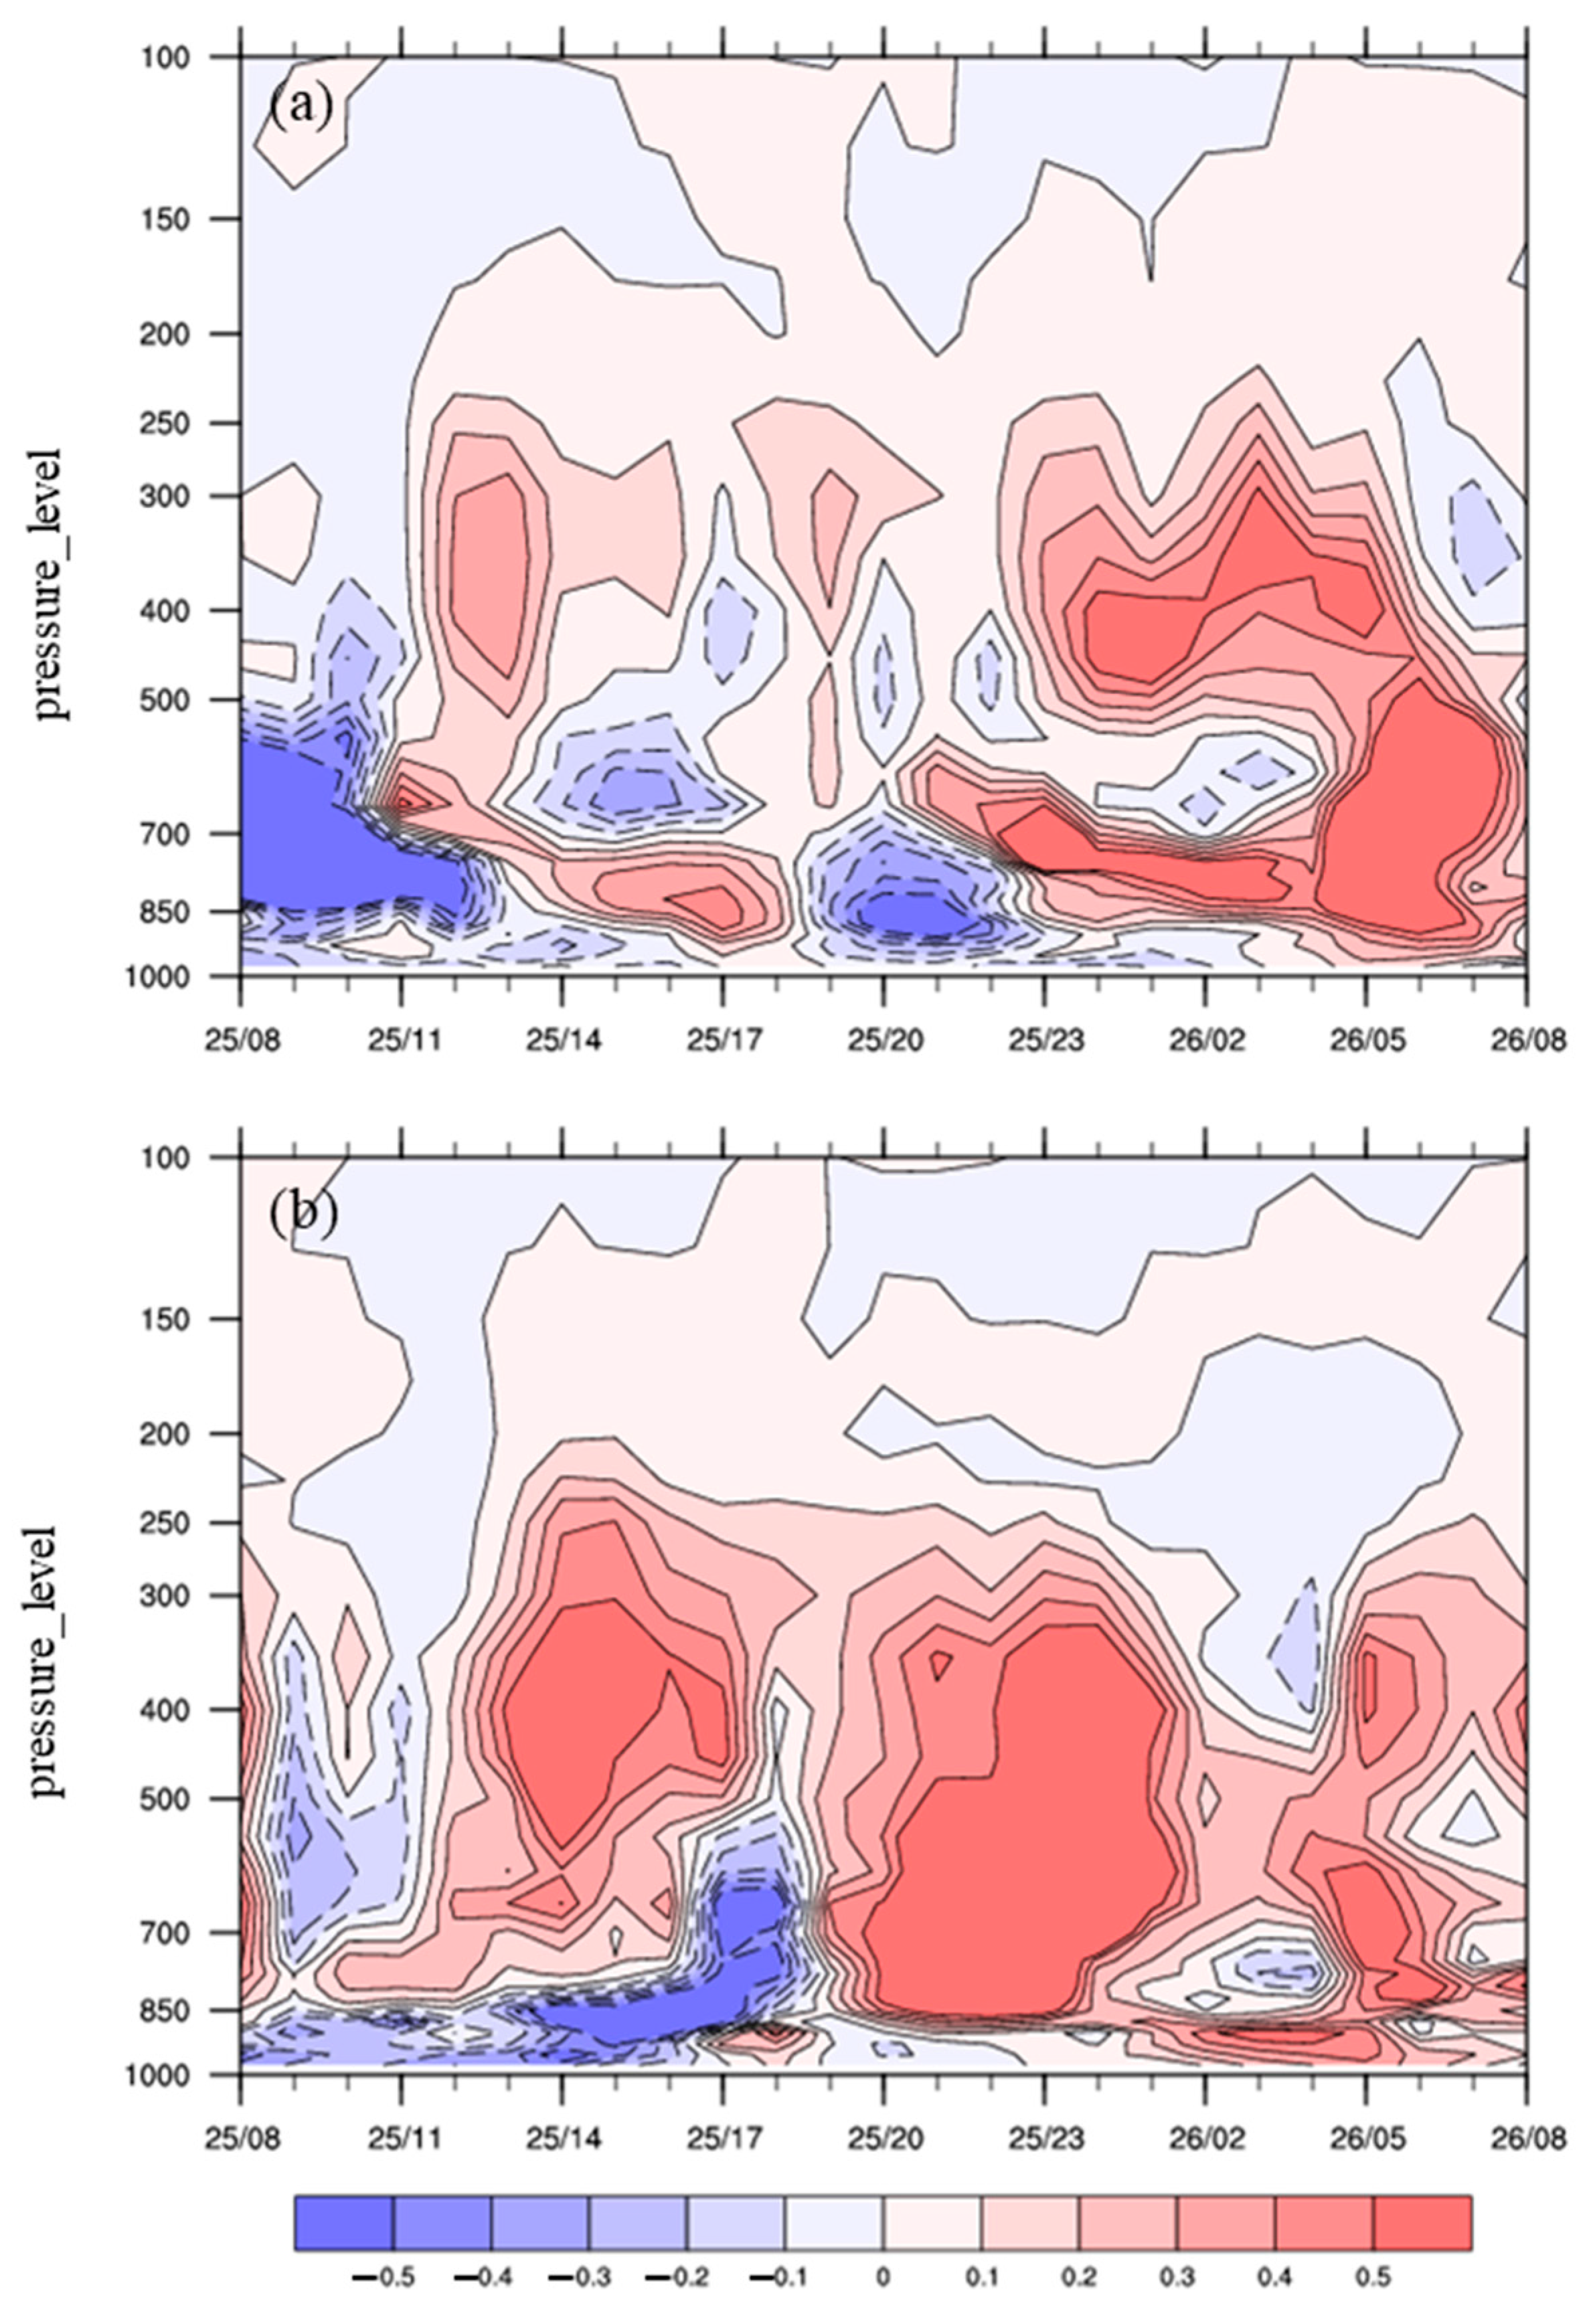
Figure 4a). At 20:00 on the 25th, the low-altitude jet stream intensified. The low-level jet stream can transport moisture and energy for the precipitation system. However, when the low-level jet stream strengthened, the low-level warm advection did not intensify. Instead, there was a slight increase in cold advection. This is mainly because the rainfall began upstream of Anqiu. Affected by rainfall evaporation, the temperature in the upstream region decreased, which would be slightly lower than in the downstream Anqiu region, making the low-level warm advection not prominent.
At the same time, the concentrated precipitation period in Jinan was from 19:00 to 22:00 on the 25th. The low-altitude jet stream began to strengthen gradually at 17:00, and the low level primarily exhibited cold advection (
Figure 4b).
When the low-level jet stream around Anqiu and Jinan intensified, the cold and warm air converged, with both stations located within the front.
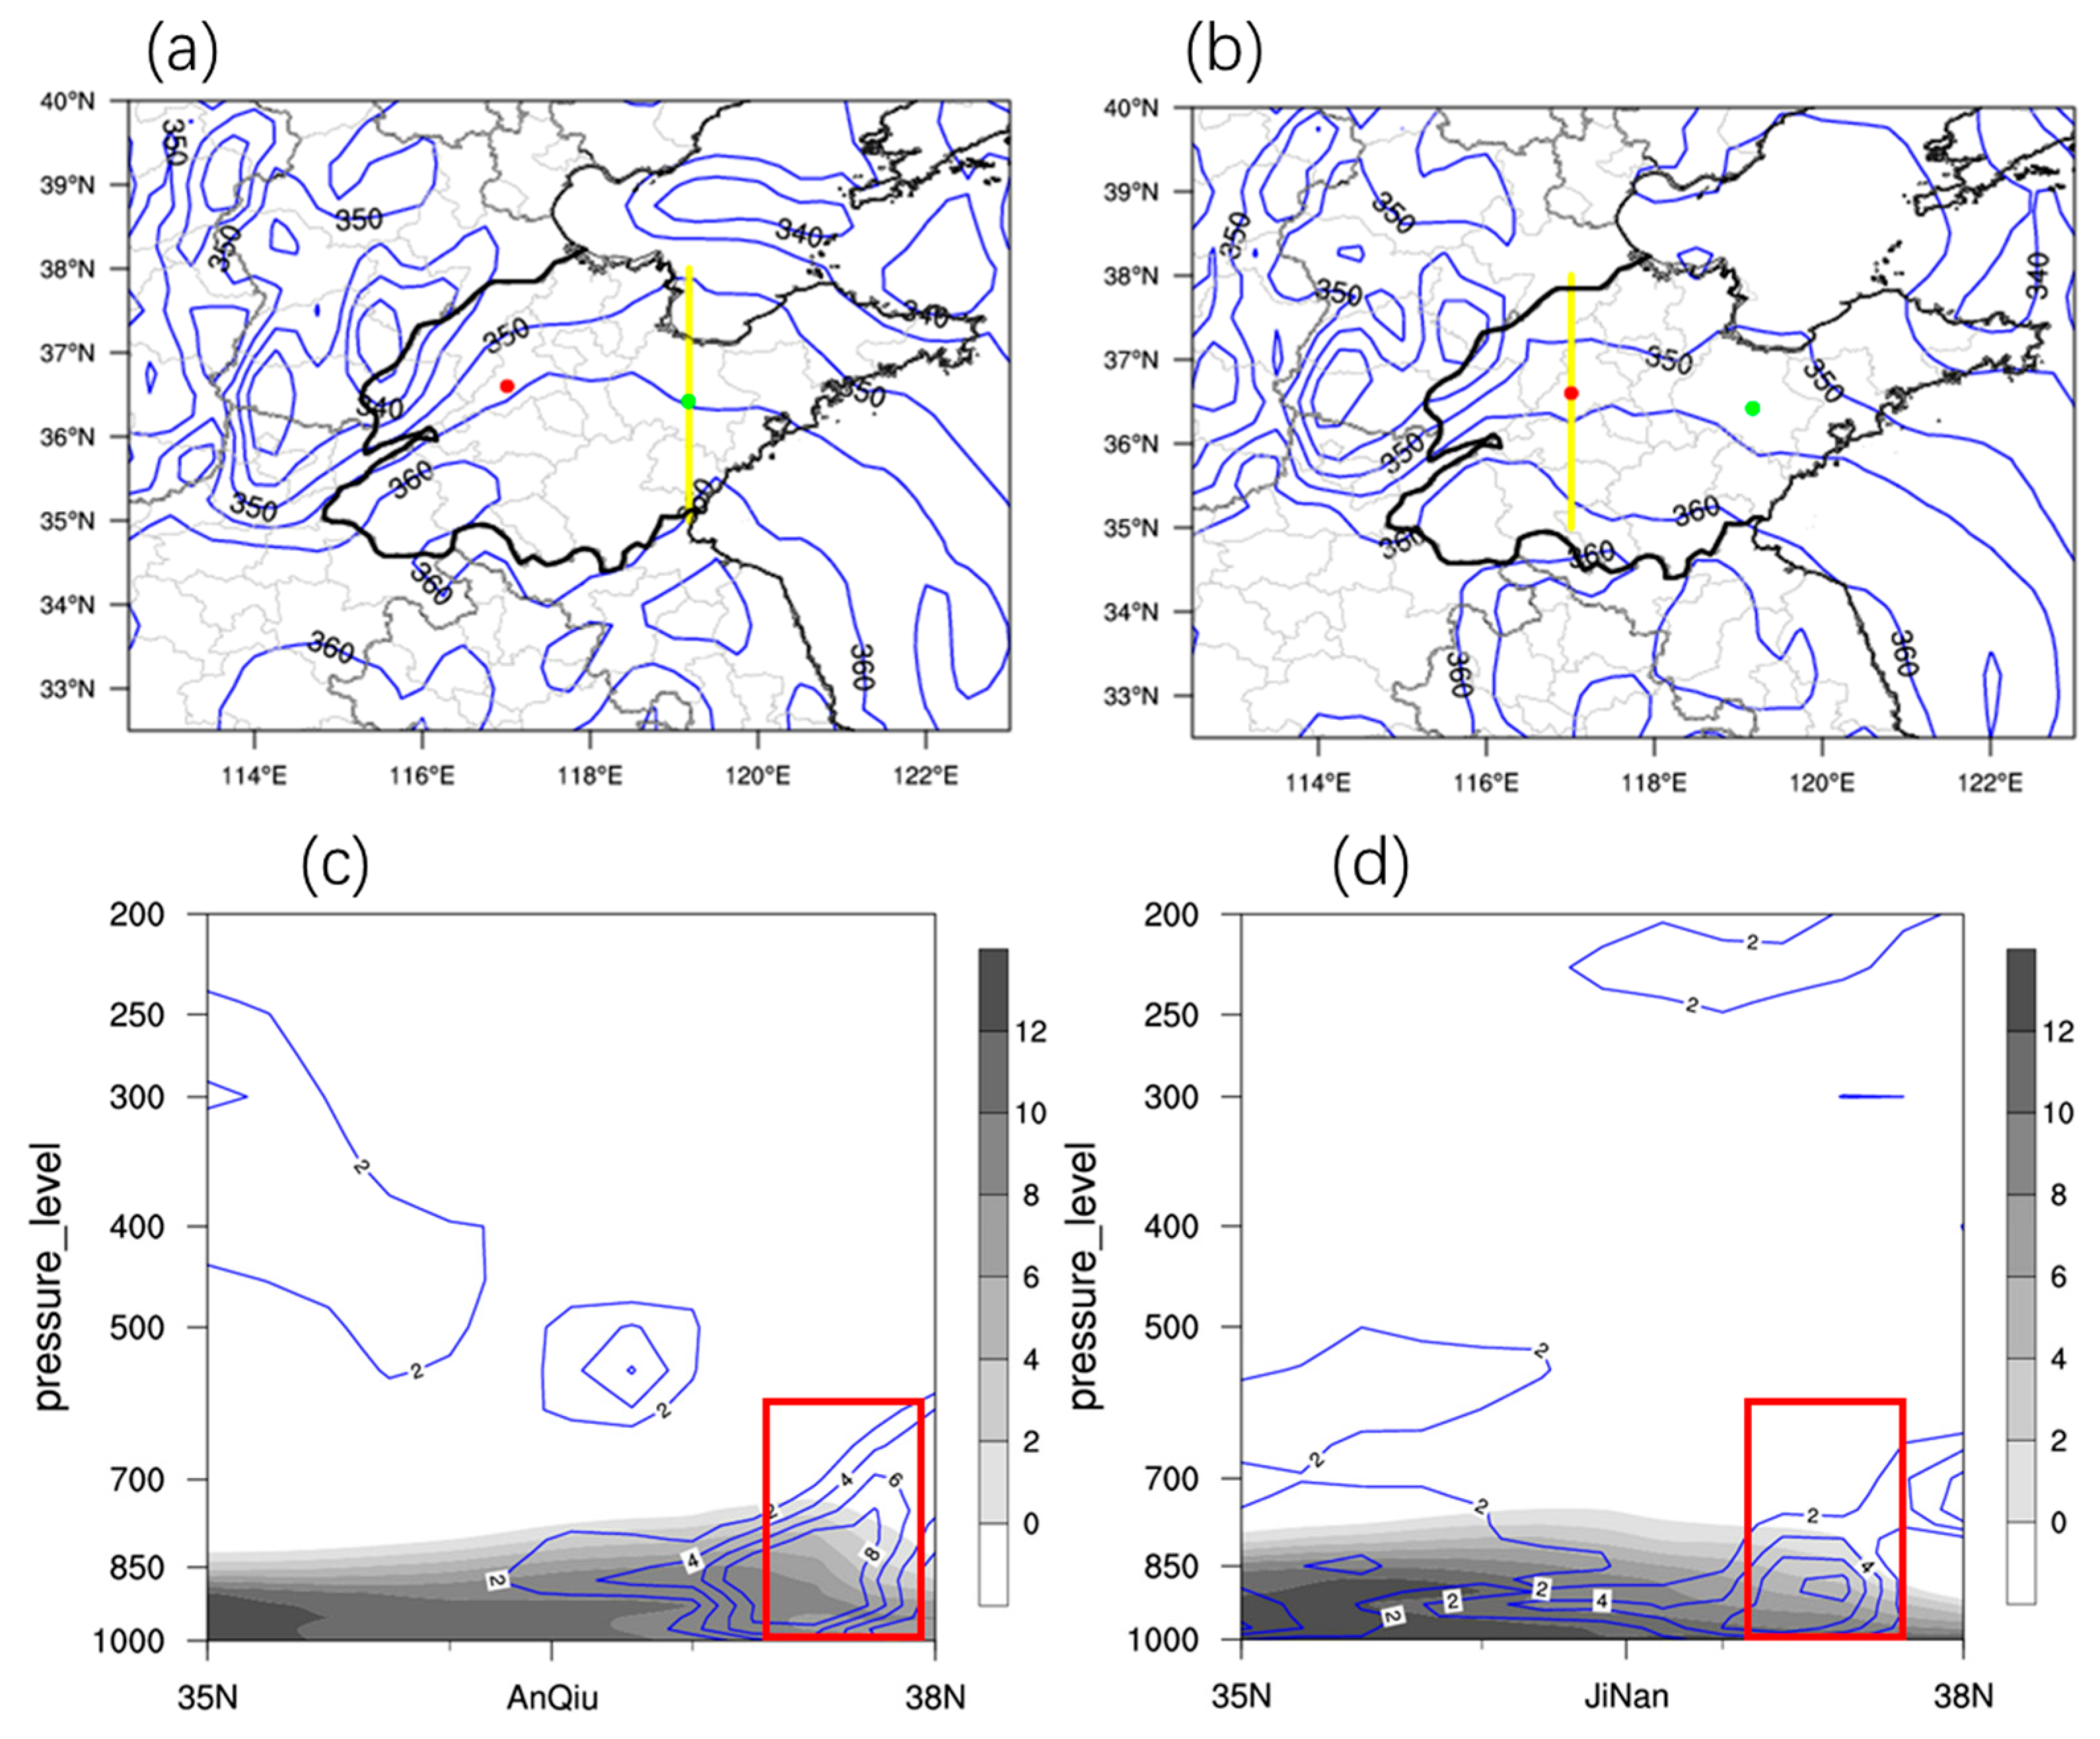
Figure 5a,b display the horizontal distribution of
at 850 hPa at 20:00 on the 25th and 17:00 on the 25th, respectively. There is an east–west oriented dense area of
isopleths from the eastern part of Henan to the northern part of the Shandong province Peninsula. This frontal zone gradually pushed northward. Satellite cloud imagery shows that rain cloud clusters on the southern side of the front, that is, on the side of the warm and moist air, intensified as they moved northward.
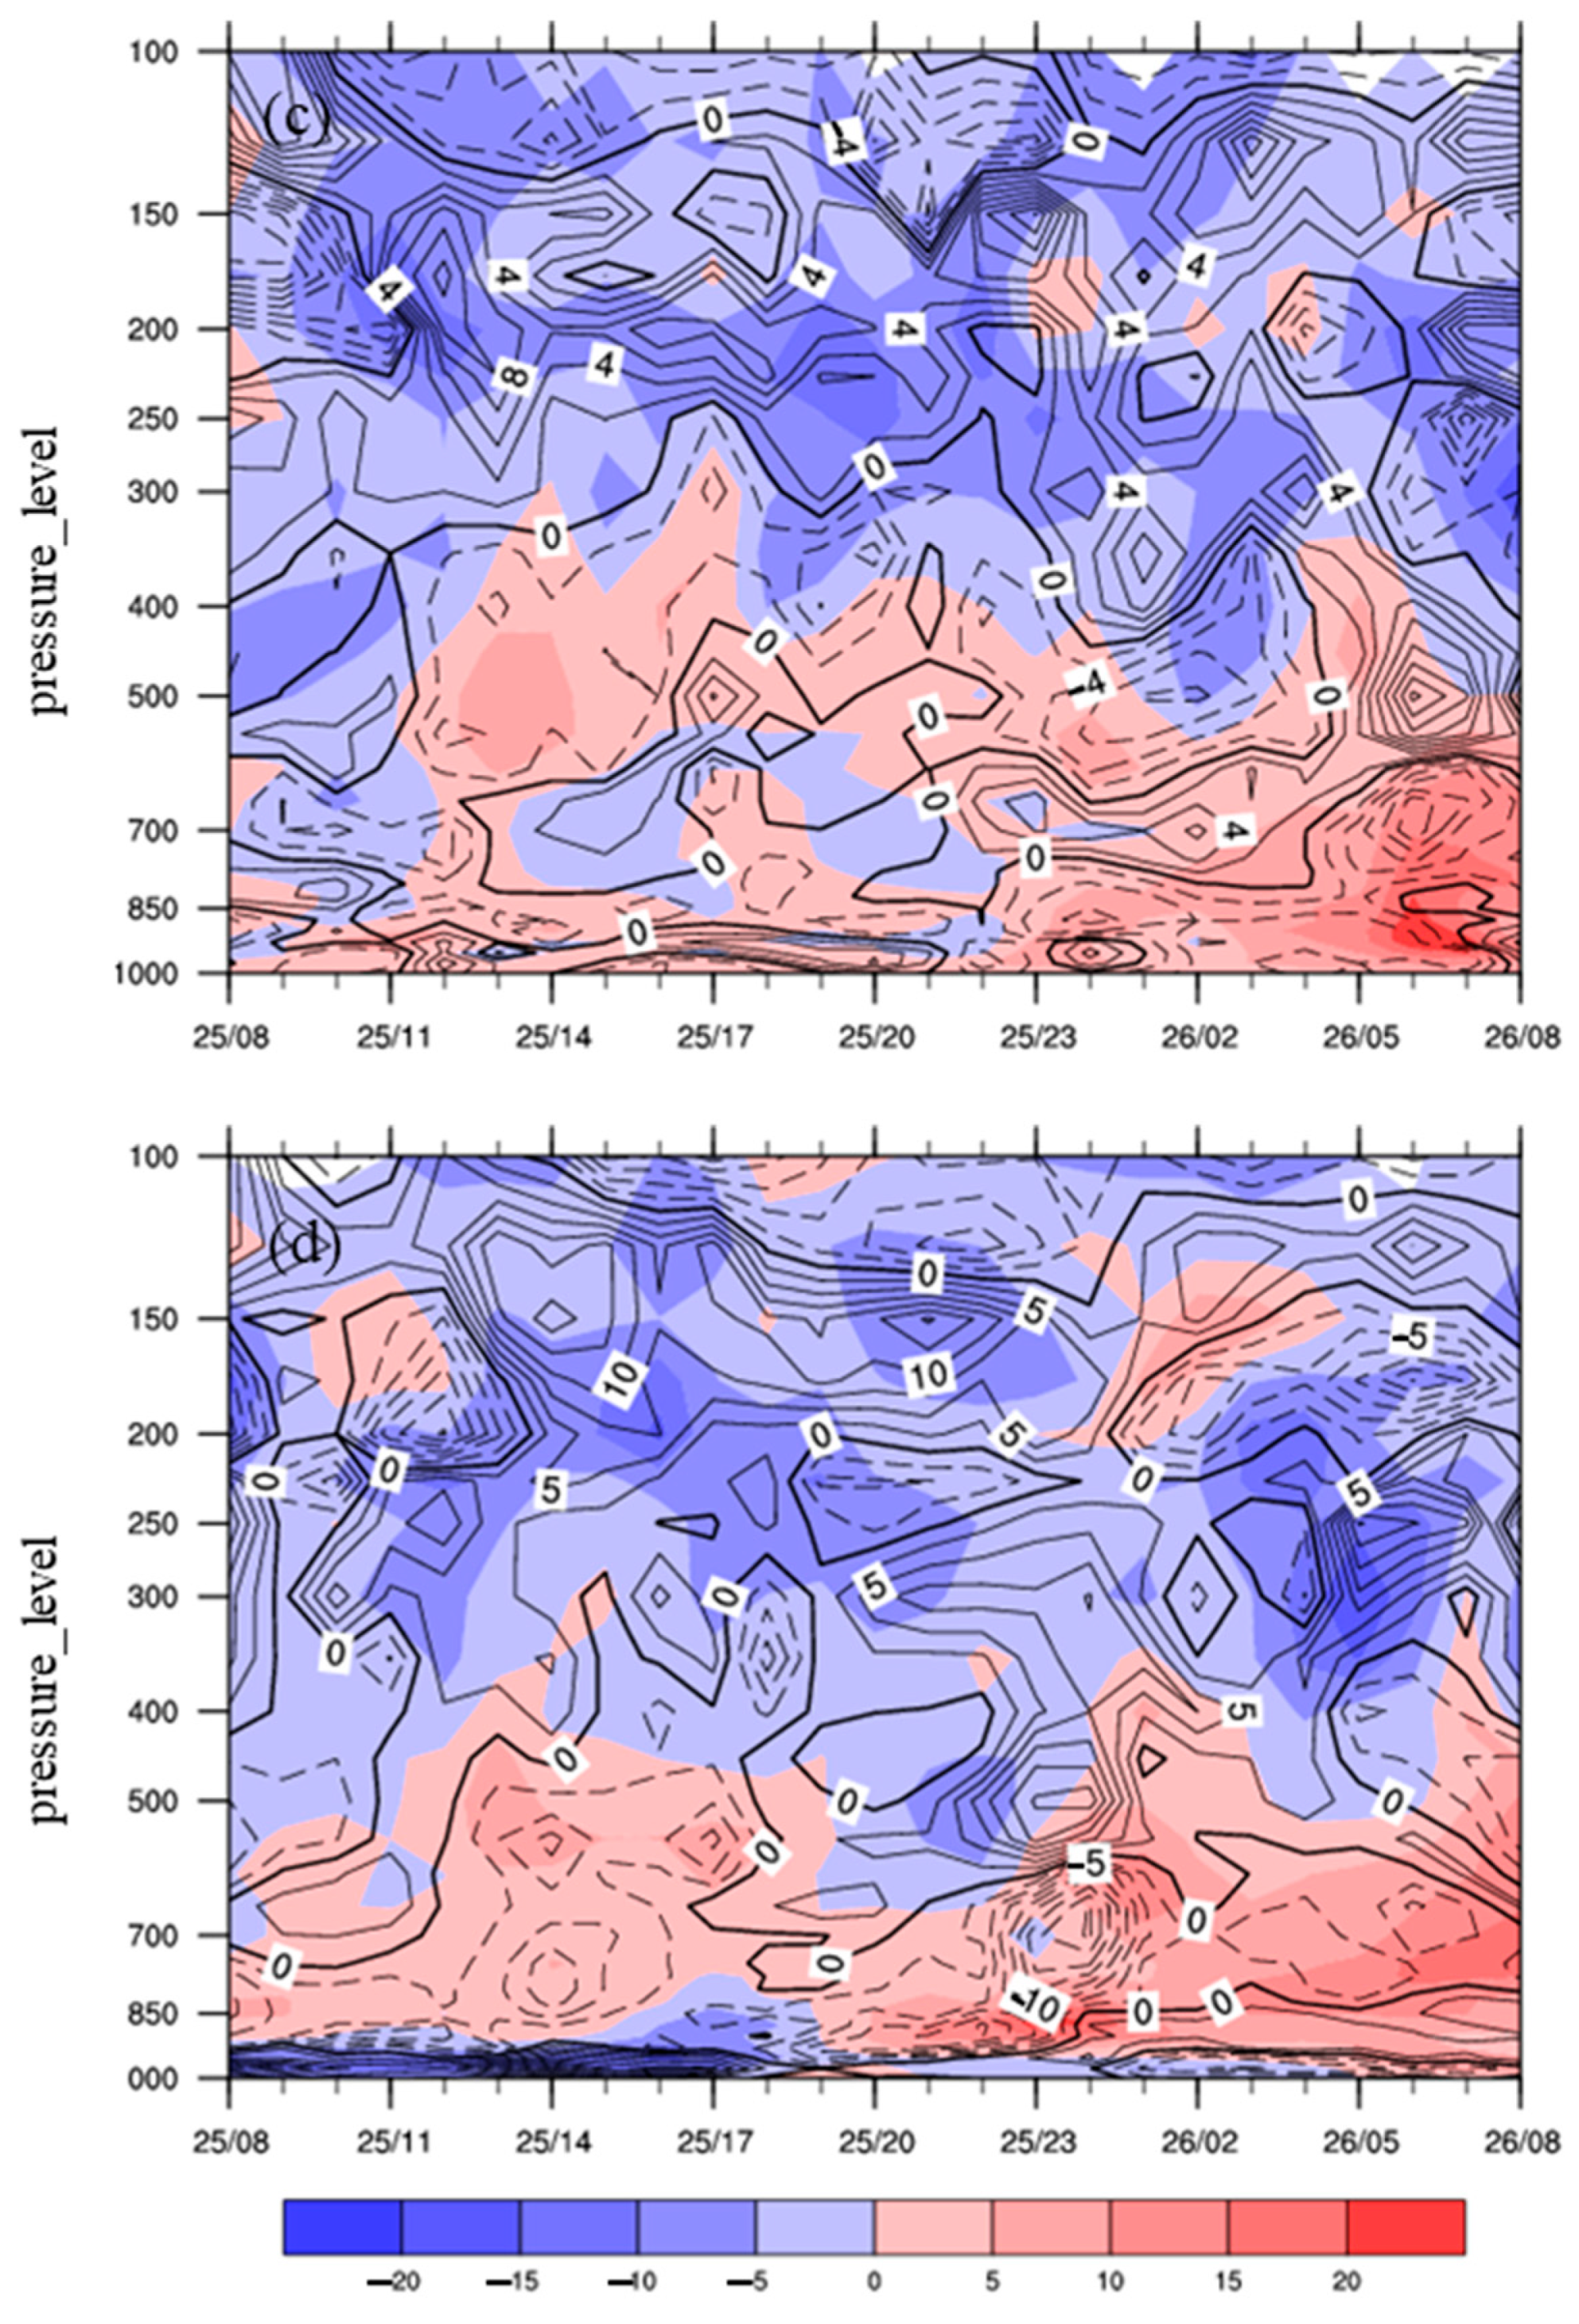
Vertical cross-sections along the front (
Figure 5c,d) indicate that with the strengthening of the low-altitude jet stream, there is kinematic frontogenesis near Anqiu and Jinan below 700 hPa, with the maximum values exceeding 8 × 10
−10 K·m
−1·s
−1. As the low-altitude jet stream intensified, there was a slight increase in cold advection near Anqiu and Jinan. The convergence of cold and warm air at both stations was not pronounced, with a small temperature gradient. The vertical distribution of humidity (
Figure 5c,d) indicates a large humidity gradient within the front. It can be seen that in this process, the low-level jet stream transported moisture, enhancing the humidity gradient and strengthening the kinematic frontogenesis.
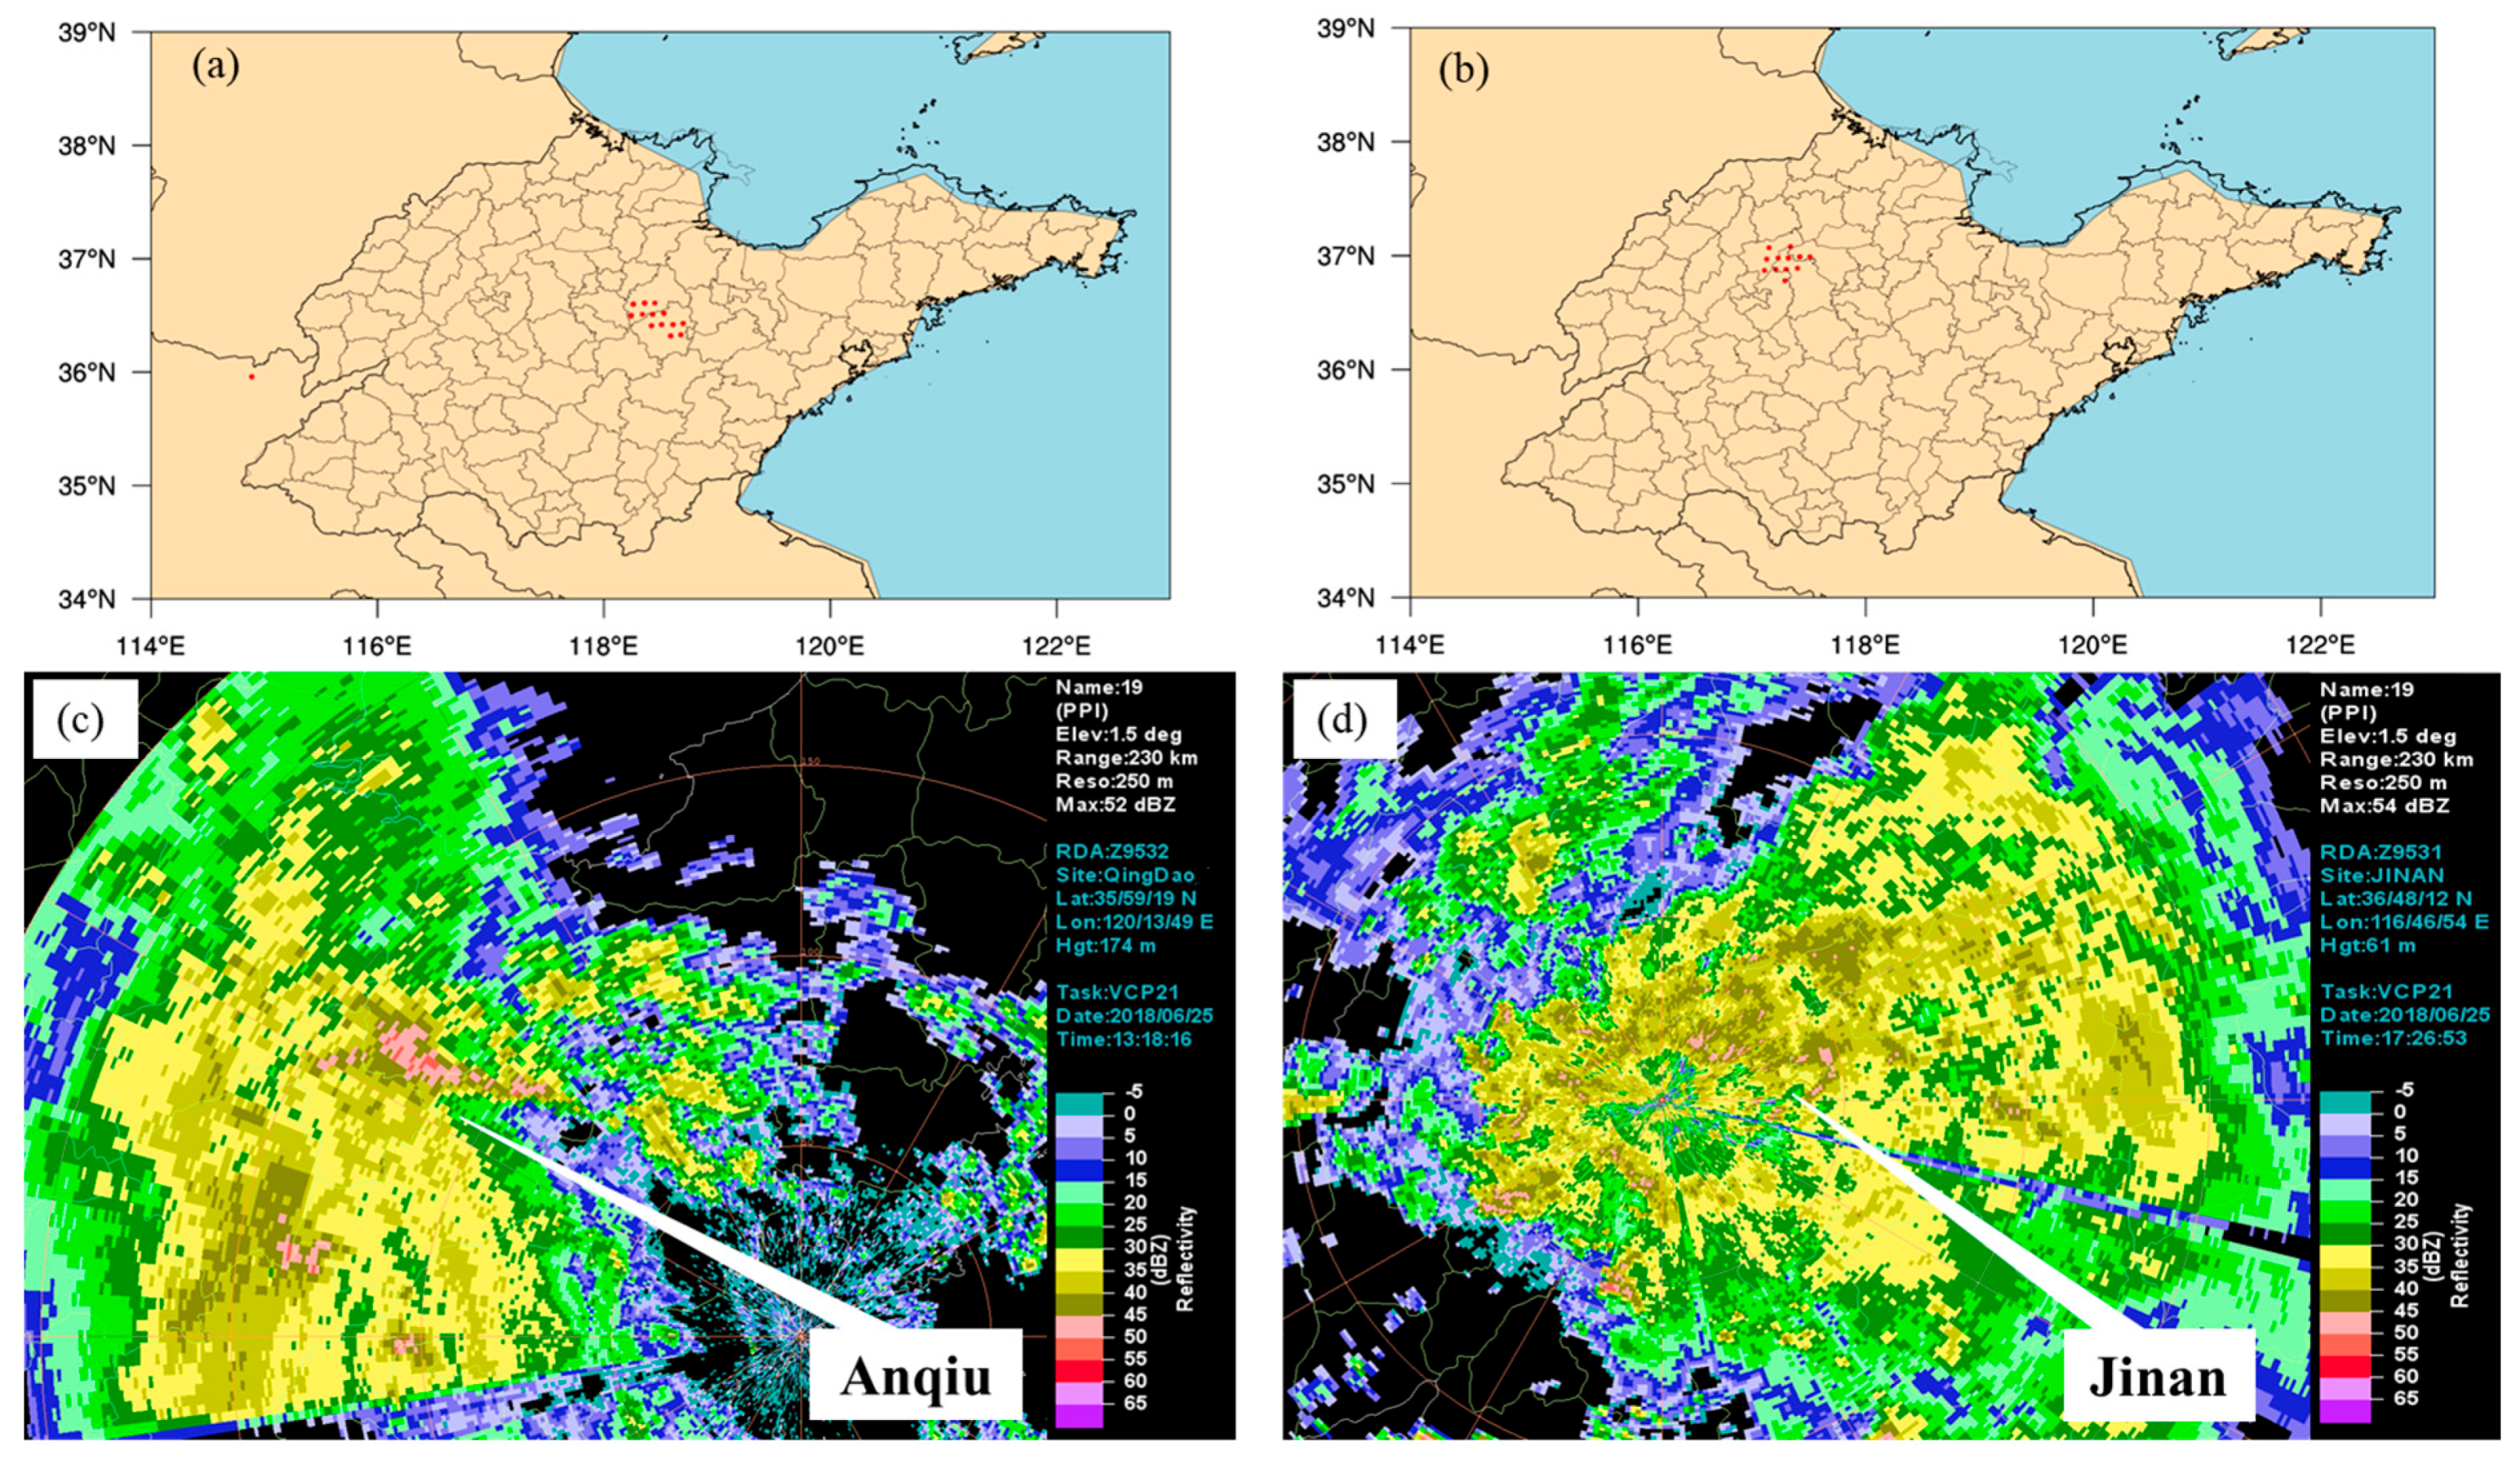
The FY-4 satellite lightning location monitoring detected lightning at 13:15:10 and 17:25:10 on the 25th near Anqiu and Jinan, respectively. Simultaneously, radar echoes showed that both areas generated echoes above 40 dBZ before and after the appearance of lightning (
Figure 6). Prior to the onset of this convection, the mid and lower layers of the atmosphere over Anqiu and Jinan were dominated by cold advection. The energy sources before these two convective events were not primarily from the warm advection delivered by the low-altitude jet stream. Instead, local thermal conditions provided the energy source, allowing the unstable atmospheric stratification to continuously develop.
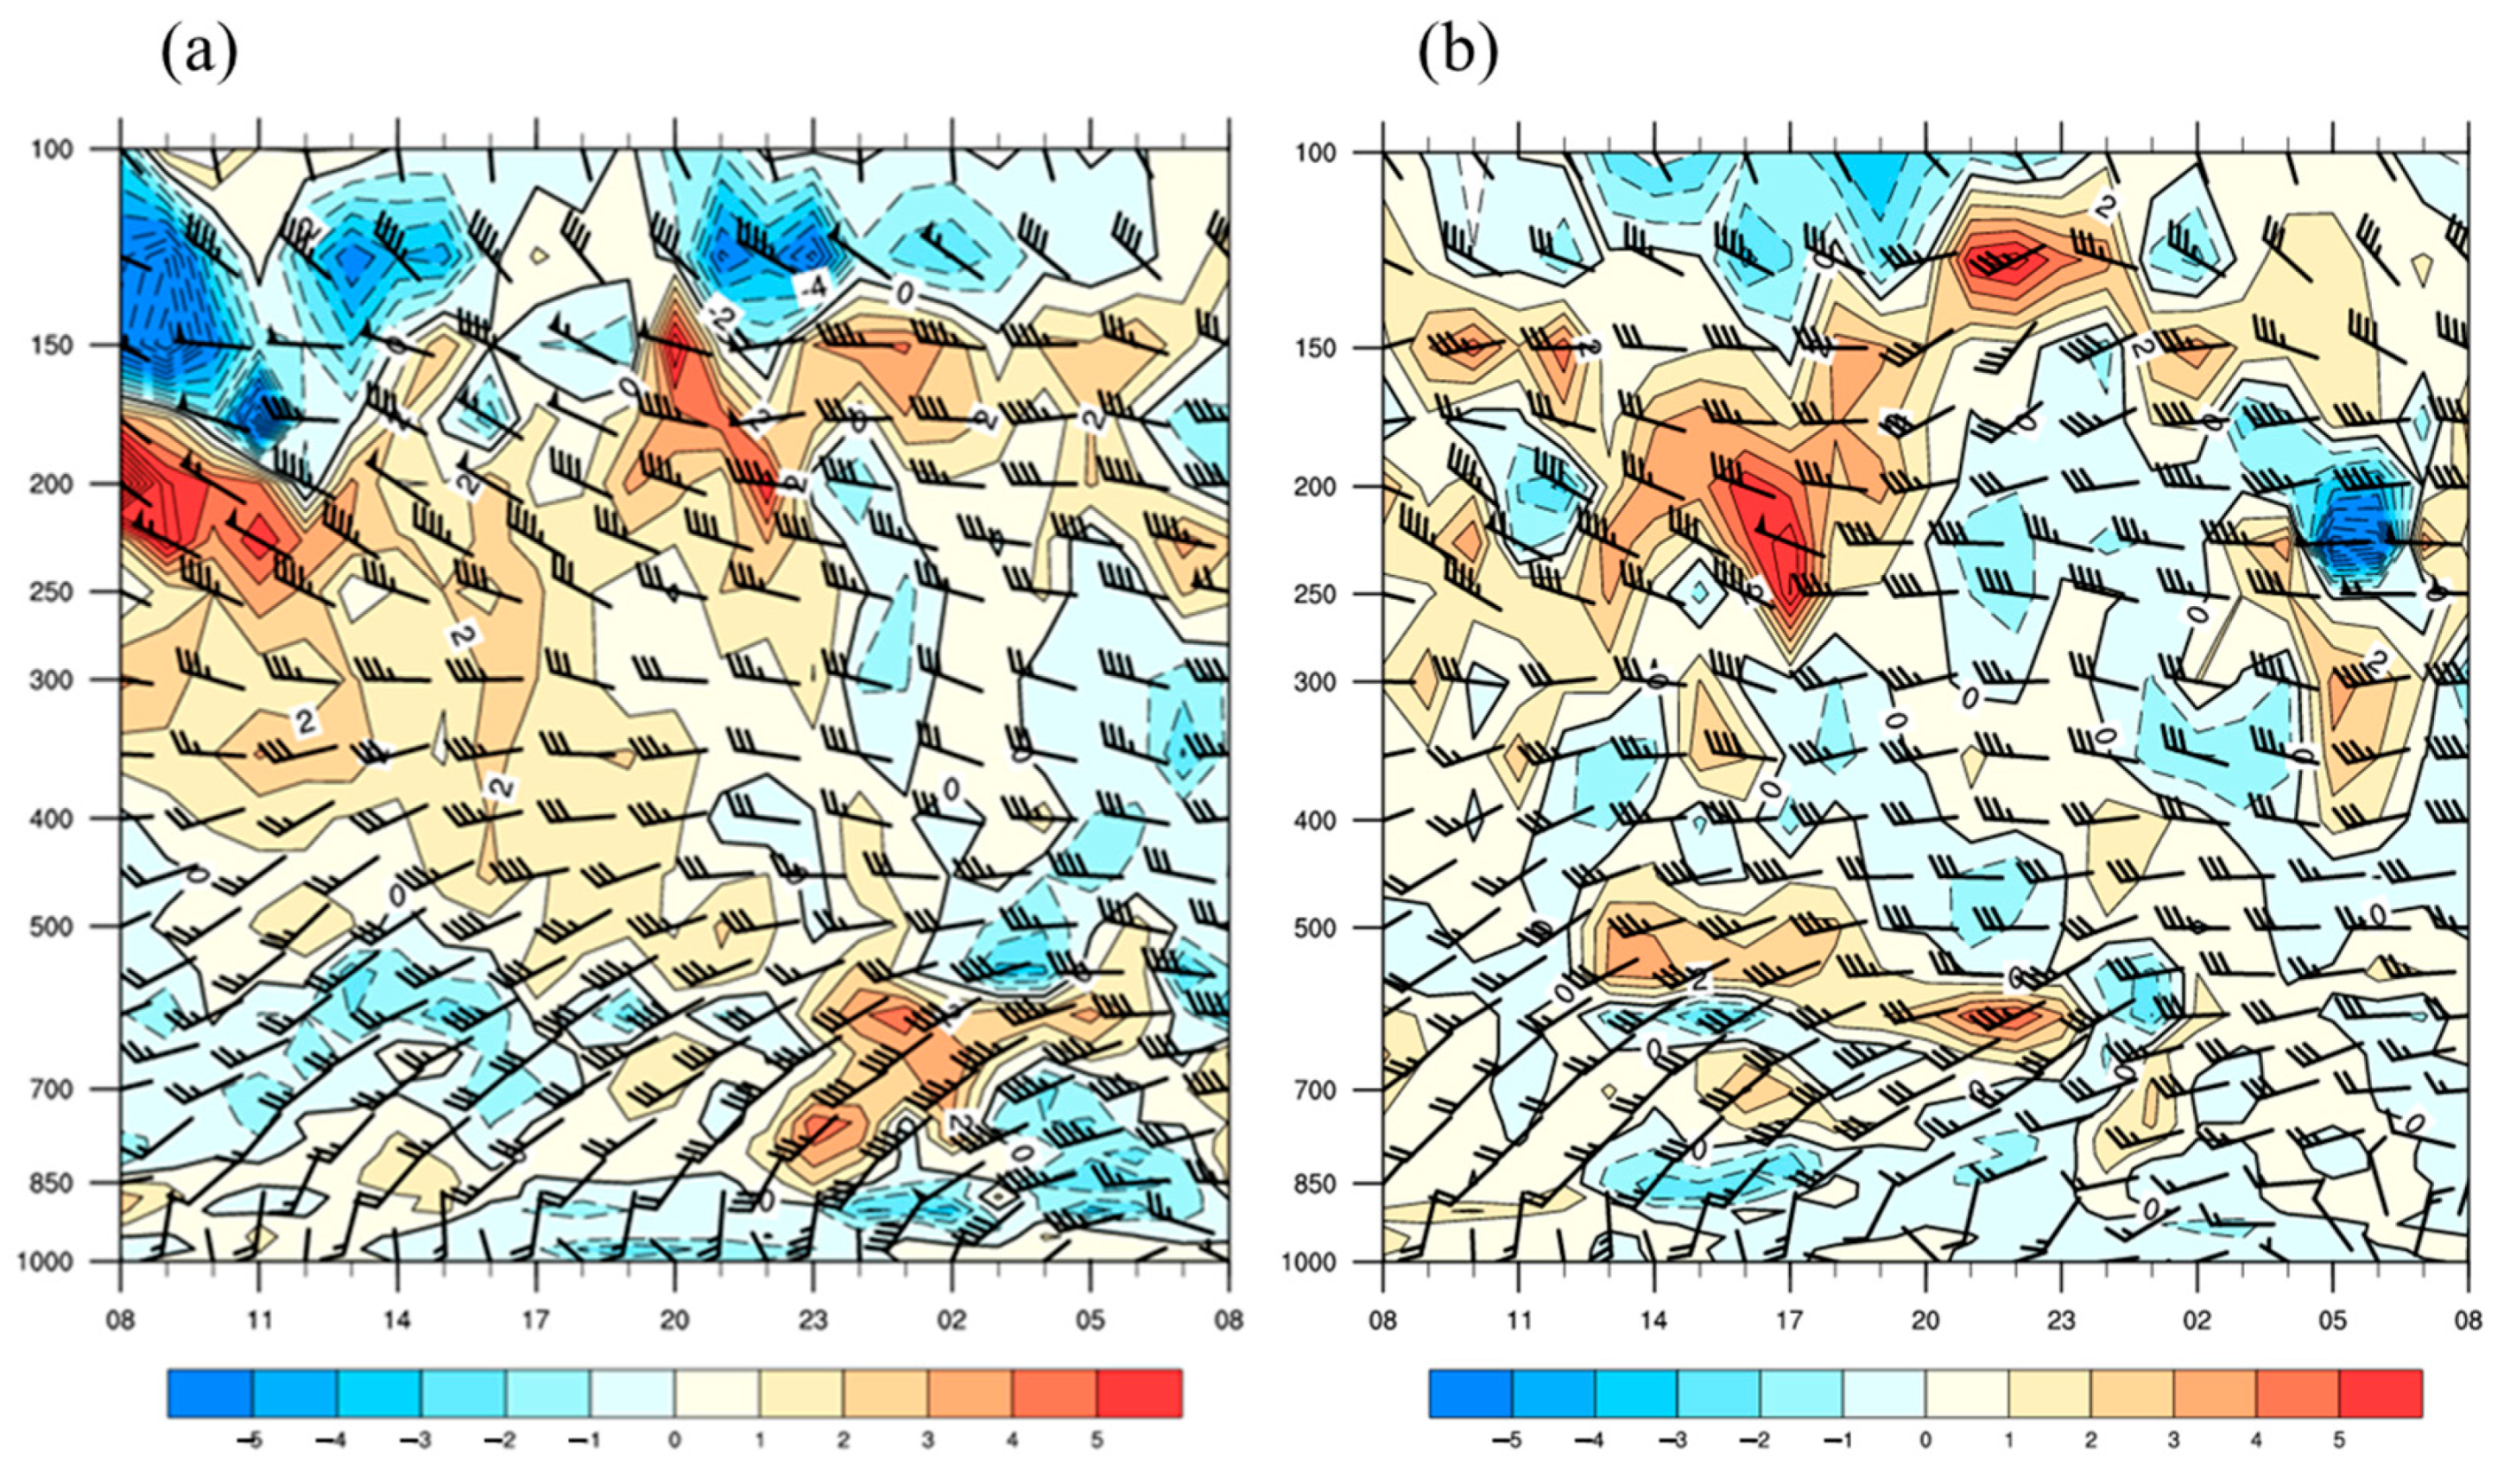
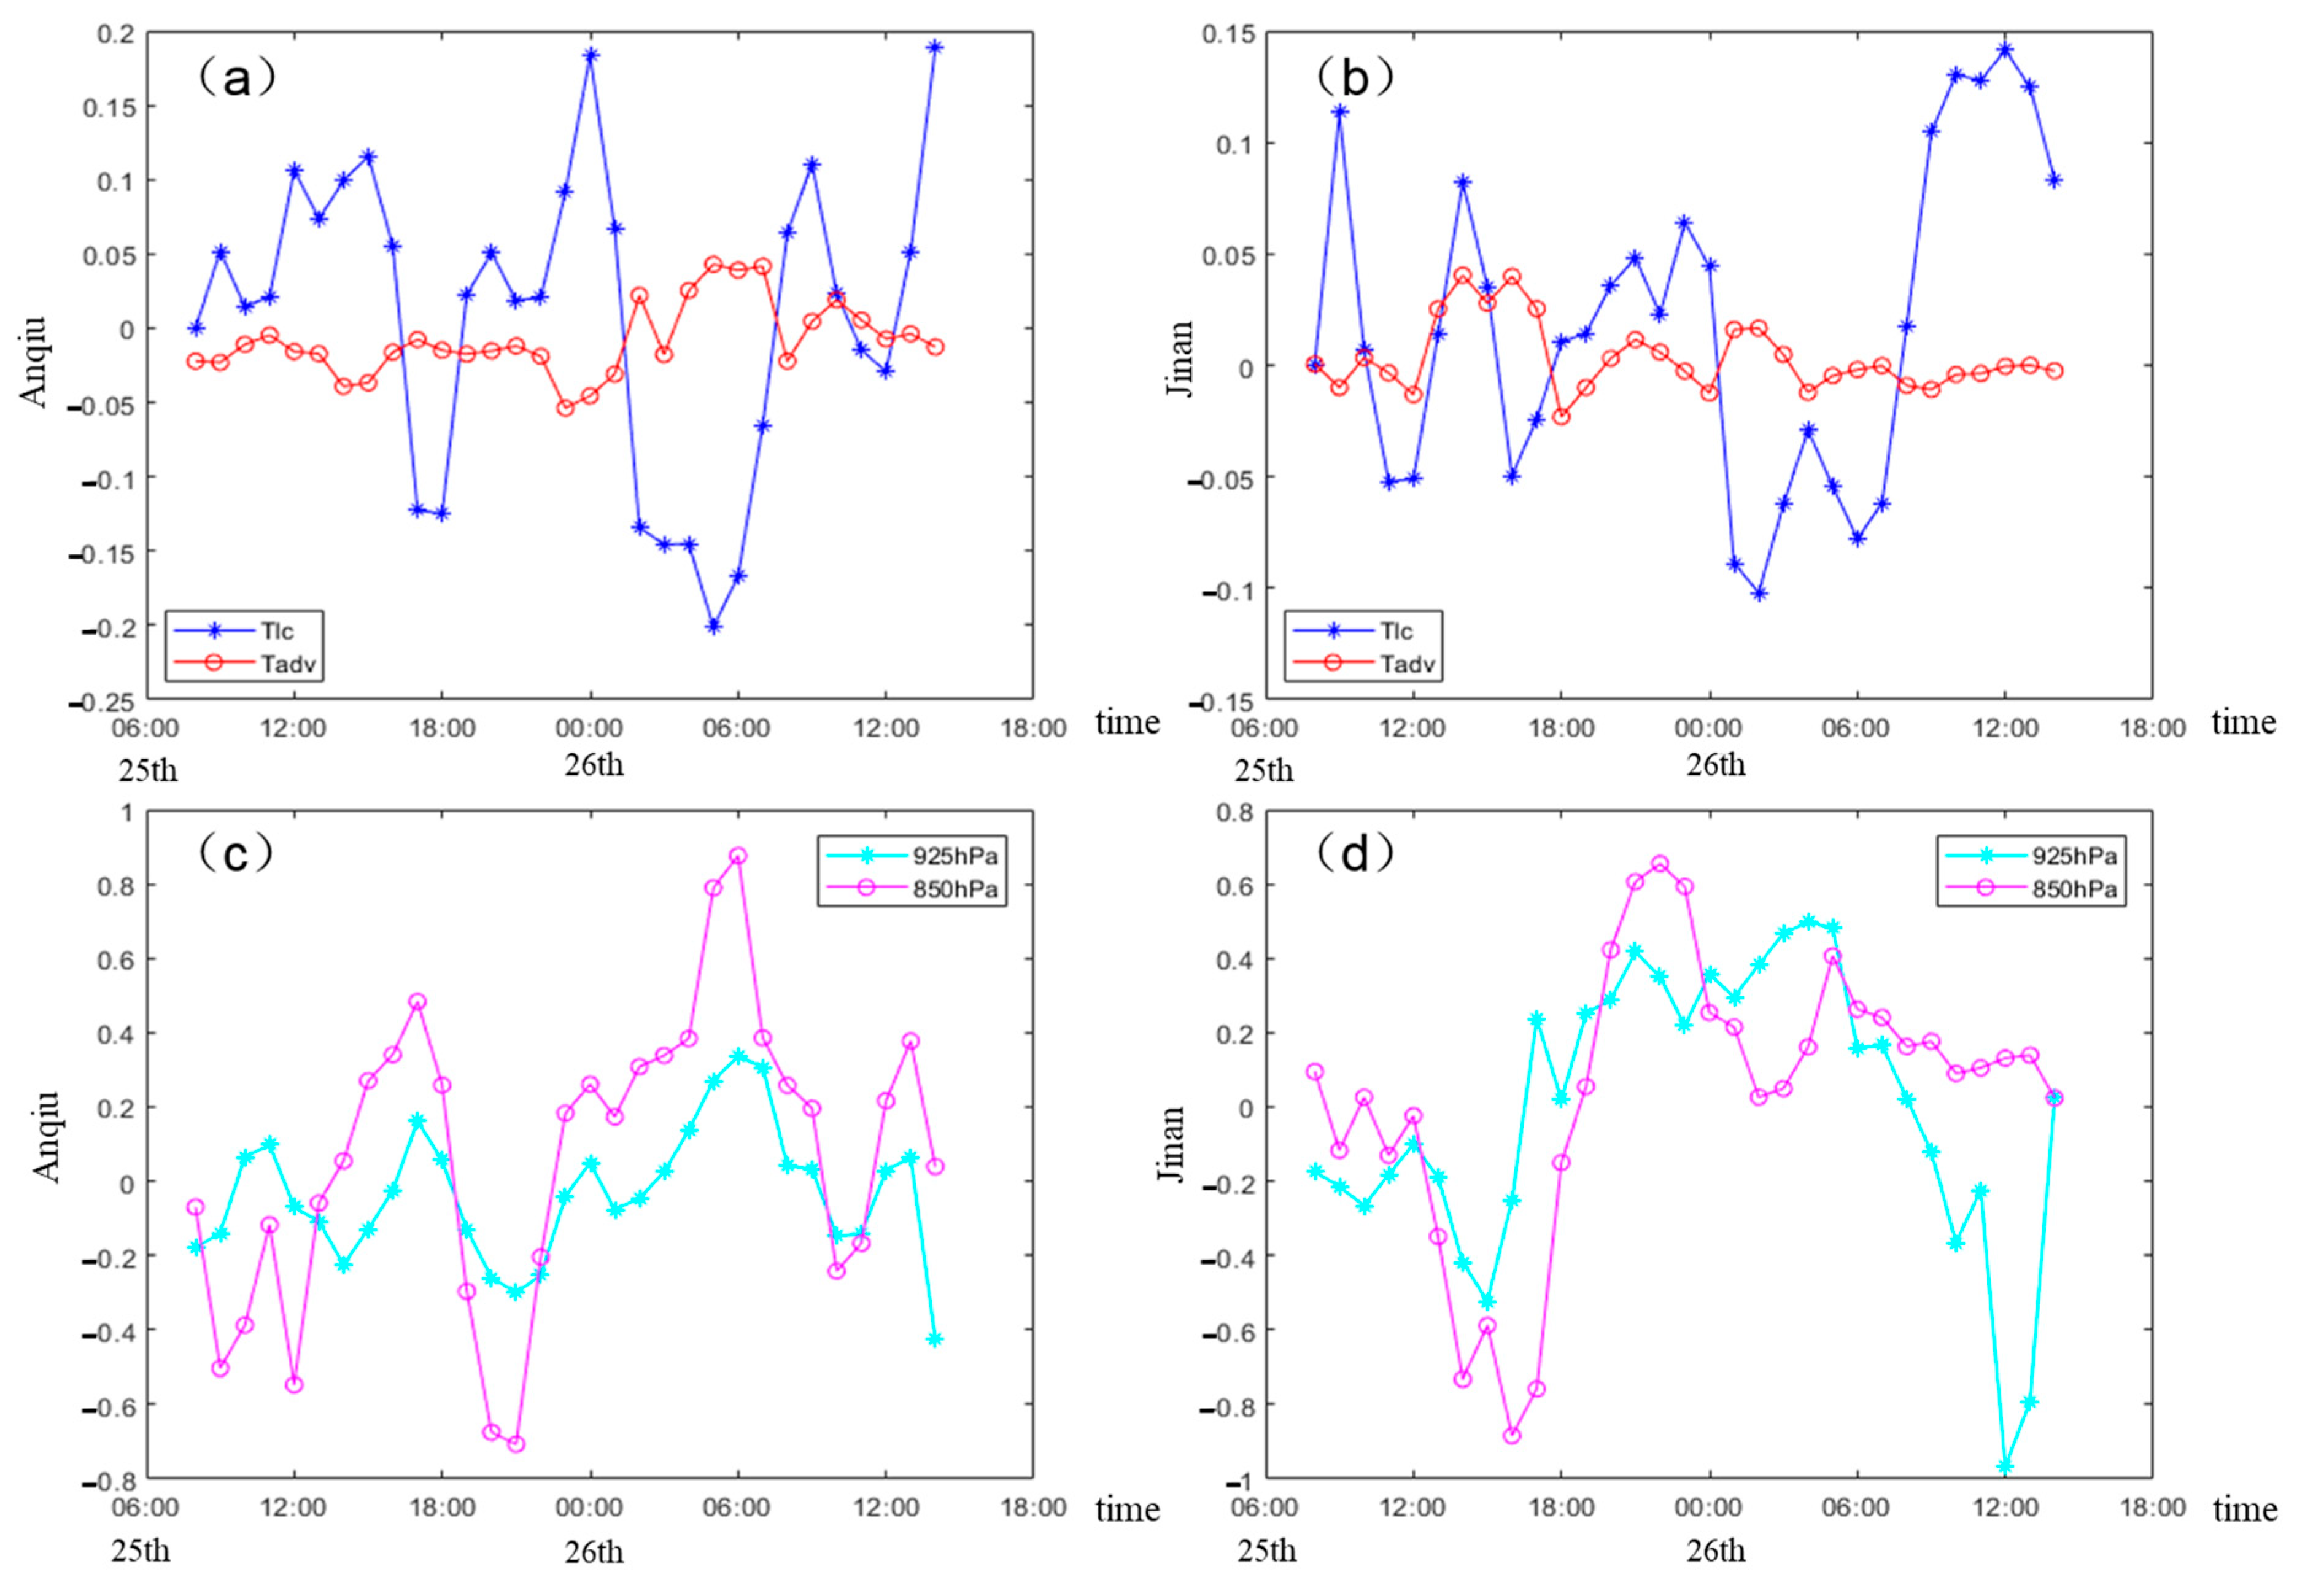
To further verify this point, the impact of three components influencing the atmospheric heat source was calculated through atmospheric heat source analysis. Since the magnitude of the vertical temperature variation is relatively small, only the local temperature variation and horizontal advection of the atmospheric heat source between 08:00 on the 25th and 14:00 on the 26th for both Anqiu and Jinan were analyzed (
Figure 7a,b). The comparison revealed that the horizontal advection of temperature at both stations during and prior to the concentrated rainfall period was less than the local temperature variation. Thus, during the period of concentrated rainfall, the thermal conditions were maintained and developed, with local temperature changes being the primary contributor.
During periods of intense rainfall, the latent heat released from moisture condensation will have a localized heating effect on the atmosphere, which can influence the intensity of the weather system. By calculating the warming rate caused by the latent heat released from moisture condensation per unit time and per unit mass of air for both Anqiu and Jinan from 08:00 on the 25th to 14:00 on the 26th (
Figure 7c,d), it was observed that there was a significant increase in the warming rate for both stations during and prior to the period of concentrated rainfall. The latent heat released during the intense rainfall period resulted in a net heating of the atmosphere.
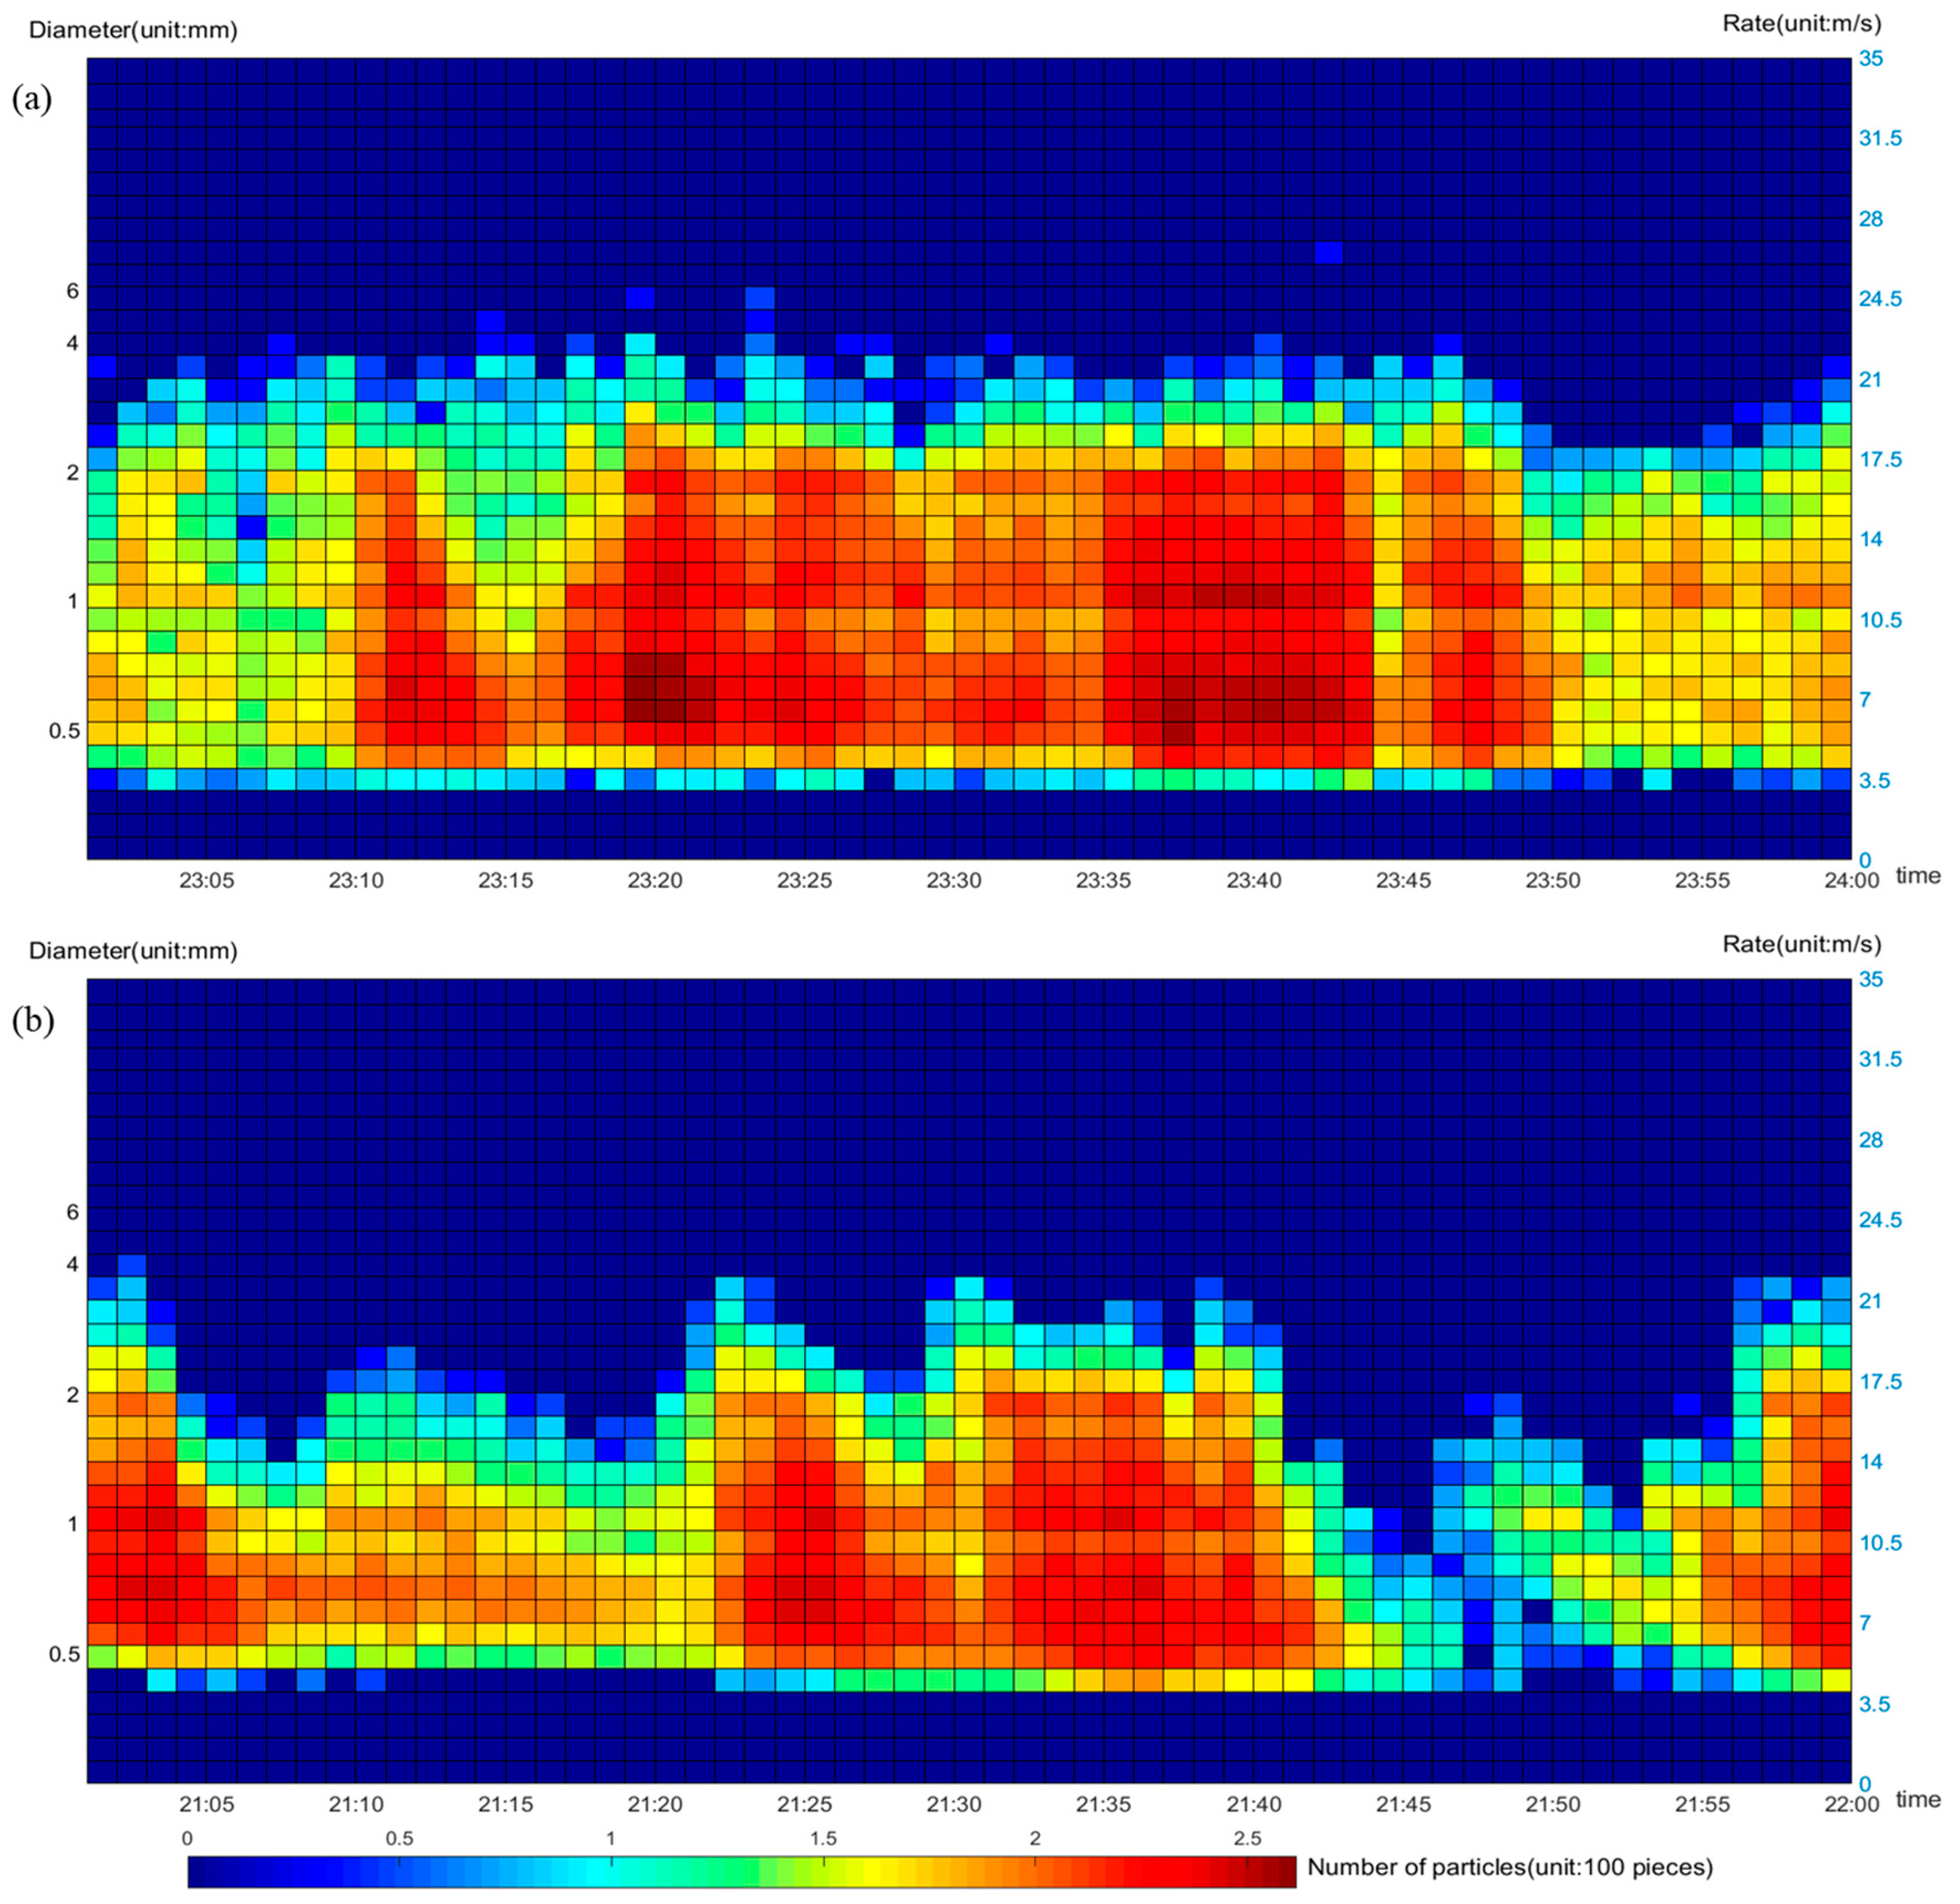
Raindrop spectrum monitors in the Anqiu area from 23:01 to 24:00 on the 25th and in the Jinan area from 21:01 to 22:00 (the time of the maximum one-hour rainfall) showed that raindrop diameters were mainly concentrated below 2 mm. The particle number distribution of the raindrop spectrometer indicated a higher concentration of small droplets in this precipitation process, with particle descent speeds generally below 15 m/s, especially those below 10 m/s (
Figure 8). The convective storm development height of the precipitation was low, and the hourly rainfall was particularly intense, showing typical characteristics of short-duration intense precipitation in warm clouds. During the time of the maximum one-hour rainfall in Anqiu and Jinan, the positive feedback of condensation latent heat was more evident, leading to the formation and growth of small droplets in warm clouds, thus increasing the intensity of the precipitation.
From an overall perspective of the entire atmospheric layer, at the time of Anqiu’s maximum hourly precipitation at 0:00 on the 26th, there was an enhanced warming rate caused by the release of heat from water vapor condensation between 1000 and 250 hPa. Two major value centers were located above 500 hPa and between 850 and 700 hPa (
Figure 9a). During the precipitation process, evaporation causes cloud layers to develop upward. As a result, there is a center of maximum warming rate above 500 hPa during the peak rainfall period. The increase in temperature rate at 850–700 hPa begins earlier. Due to the enhancement of the low-level jet stream (
Figure 2), the water vapor advection is enhanced. According to Formula (3), the temperature rate will increase accordingly. That is, the strengthening of the low-level jet stream and the increase in water vapor advection will heat the mid-lower layers during the period of intense rainfall, which will also lead to the further strengthening of the low-level jet stream. At the same time, the vorticity value increases, the cyclonic circulation strengthens, and the lower layer is a negative divergence center, strengthening the convergence of the lower layer (
Figure 9c). At 22:00 on the 25th, when Jinan experienced its maximum hourly precipitation, there was also an enhanced warming rate caused by the release of heat from water vapor condensation (
Figure 9b). Simultaneously, vorticity values increased, and the upper-level trough and shear systems strengthened. The lower layers exhibited a divergence negative value center, while the mid and upper layers had a divergence positive value center, forming an upper divergence and lower convergence situation (
Figure 9d). This intensified the cyclonic circulation system and upward motion in the lower layers. This indicates that during the period of intense rainfall, the feedback from the release of latent heat from moisture condensation strengthens the atmospheric system, providing powerful thermodynamic and dynamic conditions for intense rainfall.
5. Conclusions and Discussions
This study focused on the widespread heavy to torrential rain process in Shandong province on 25 June 2018. The concentrated rainfall area was in central Shandong province. A deep and robust southwesterly jet stream was identified as the key system behind this rain event. During the period of concentrated rainfall and the intensification of the low-altitude jet stream, the overlying atmosphere at the observation stations was dominated by cold advection. This was primarily because rainfall commenced upstream, and as a result of the rainfall, temperatures in the upstream areas dropped, being slightly cooler than downstream areas. From this, it is evident that in this process, the warm advection in the low-altitude jet stream was not the primary energy supplier for the heavy rainfall. The jet stream transported moisture, increased humidity gradients, and intensified frontogenesis. When comparing local temperature variations with horizontal temperature advection, it was observed that the latter was often less significant than the former during and before the concentrated rainfall. Therefore, during the concentrated rainfall period, the evolution of local temperature and thermal conditions, as well as their configuration with the low-level jet, was crucial. The strengthening of the low-level jet stream leads to an increase in water vapor advection, and the increase in the rate of temperature increase caused by the condensation of water vapor in the lower layers releases heat. The warming in the lower layers increases the effective potential energy, promoting the development of disturbances. Under the influence of the disturbance field, the more unstable the atmospheric stratification, the stronger the heating effect of water vapor condensation, and the stronger the intensity of the low-level jet stream formed. Precipitation processes dominated by warm cloud rainfall are highly efficient. Raindrop spectrometer data showed that during the maximum one-hour rainfall in Anqiu and Jinan, the positive feedback of condensation latent heat was quite evident, leading to the formation and growth of small droplets in warm clouds, thereby increasing the intensity of the precipitation. The latent heat release from water vapor condensation led to the development of the wind field and vertical circulation. During and before the concentrated rainfall period, the heating rate caused by the latent heat release in unit mass air over unit time showed a notable increase. The enhanced heating rate due to latent heat release played a warming role in the middle and lower atmosphere during the concentrated rainfall period. The positive feedback from the latent heat release amplified the weather system, affecting the rainfall and providing robust thermal and dynamical conditions for heavy rainfall.
In the study of diabatic heating, data are a key issue. The continuous and stable operation of the newly launched next-generation geostationary orbit quantitative remote sensing meteorological satellites will provide us with higher-quality satellite remote sensing data. It will aid in further research related to diabatic heating. The occurrence of a precipitation process is mainly influenced by the combined effects of various weather systems at different altitudes. Changes in the location and intensity of these weather systems inevitably affect the location, intensity, and duration of precipitation. Since diabatic heating is an important factor influencing weather systems, the precipitation process caused by these systems is inextricably linked to diabatic heating. Weather systems, as the link between precipitation occurrence and the release of condensation latent heat, require further study regarding how their strength and position are affected by diabatic heating processes. Numerical modeling is the current trend, as it includes various diabatic parameterization schemes. Improving and comprehensively detailing these diabatic processes will undoubtedly aid in understanding diabatic processes and their effects. However, how to better integrate diabatic heating into meso- and small-scale numerical weather prediction models is a topic worthy of further exploration. Additionally, how the impact of diabatic heating processes on weather systems and rainfall can be applied in numerical model corrections requires more case studies and numerical experiments for realization and is worth further research and discussion.
Regarding the feedback effects of diabatic heating on weather systems and precipitation, current research achievements have only reached preliminary qualitative conclusions, and more practically significant quantitative relationships have yet to be clarified. Most studies have used composite analysis methods and only summarized the general impact of diabatic heating on the location and intensity of precipitation without providing a quantitative impact on rainfall intensity. Additionally, how diabatic heating near weather-scale systems specifically affects the detailed process of a precipitation event is also worth further study. The precipitation process analyzed in this paper occurred on the edge of the Western Pacific Subtropical High, a major planetary-scale weather system affecting the distribution of rainbands in East Asia. The classical theory once believed that the subtropical high is caused by lower-level divergence under meridional circulation sinking in the subtropical region. However, extensive research by meteorologists has shown that the formation and changes in the subtropical high are the comprehensive results of atmospheric motion subject to internal and external forcing [
30]. Scholars have theoretically and through simulations proved that Earth’s rotation and diabatic heating are the main reasons for the formation of the summer subtropical high and found that the release of condensation latent heat is a key factor determining the position and strength of the summer subtropical high in the Eastern Hemisphere [
31,
32]. Therefore, further analysis is needed on the short-term variations in the position of the subtropical high and its connection to the field of diabatic heating.
In this heavy rainfall weather process, forecasters failed to predict the torrential rain in the central and northern regions of Shandong province, as they often did not consider the strengthening of the weather system over time due to the impact of high and low altitude jet stream coupling and condensation latent heat heating, and the potential conditional symmetric instability, leading to cognitive biases and the missed forecast of the heavy rain. For such warm-region heavy rainfall processes, forecasters should consider the trajectory of the Western Pacific Subtropical High, the coupling of high and low altitude jet streams, the impact of condensation latent heat release on the low-level jet stream and southerly winds, and the potential mechanism of conditional symmetric instability. By integrating numerical models and appropriately adjusting the predicted rainfall amount in the models, the possibility of heavy rainfall can be comprehensively considered.


