Article

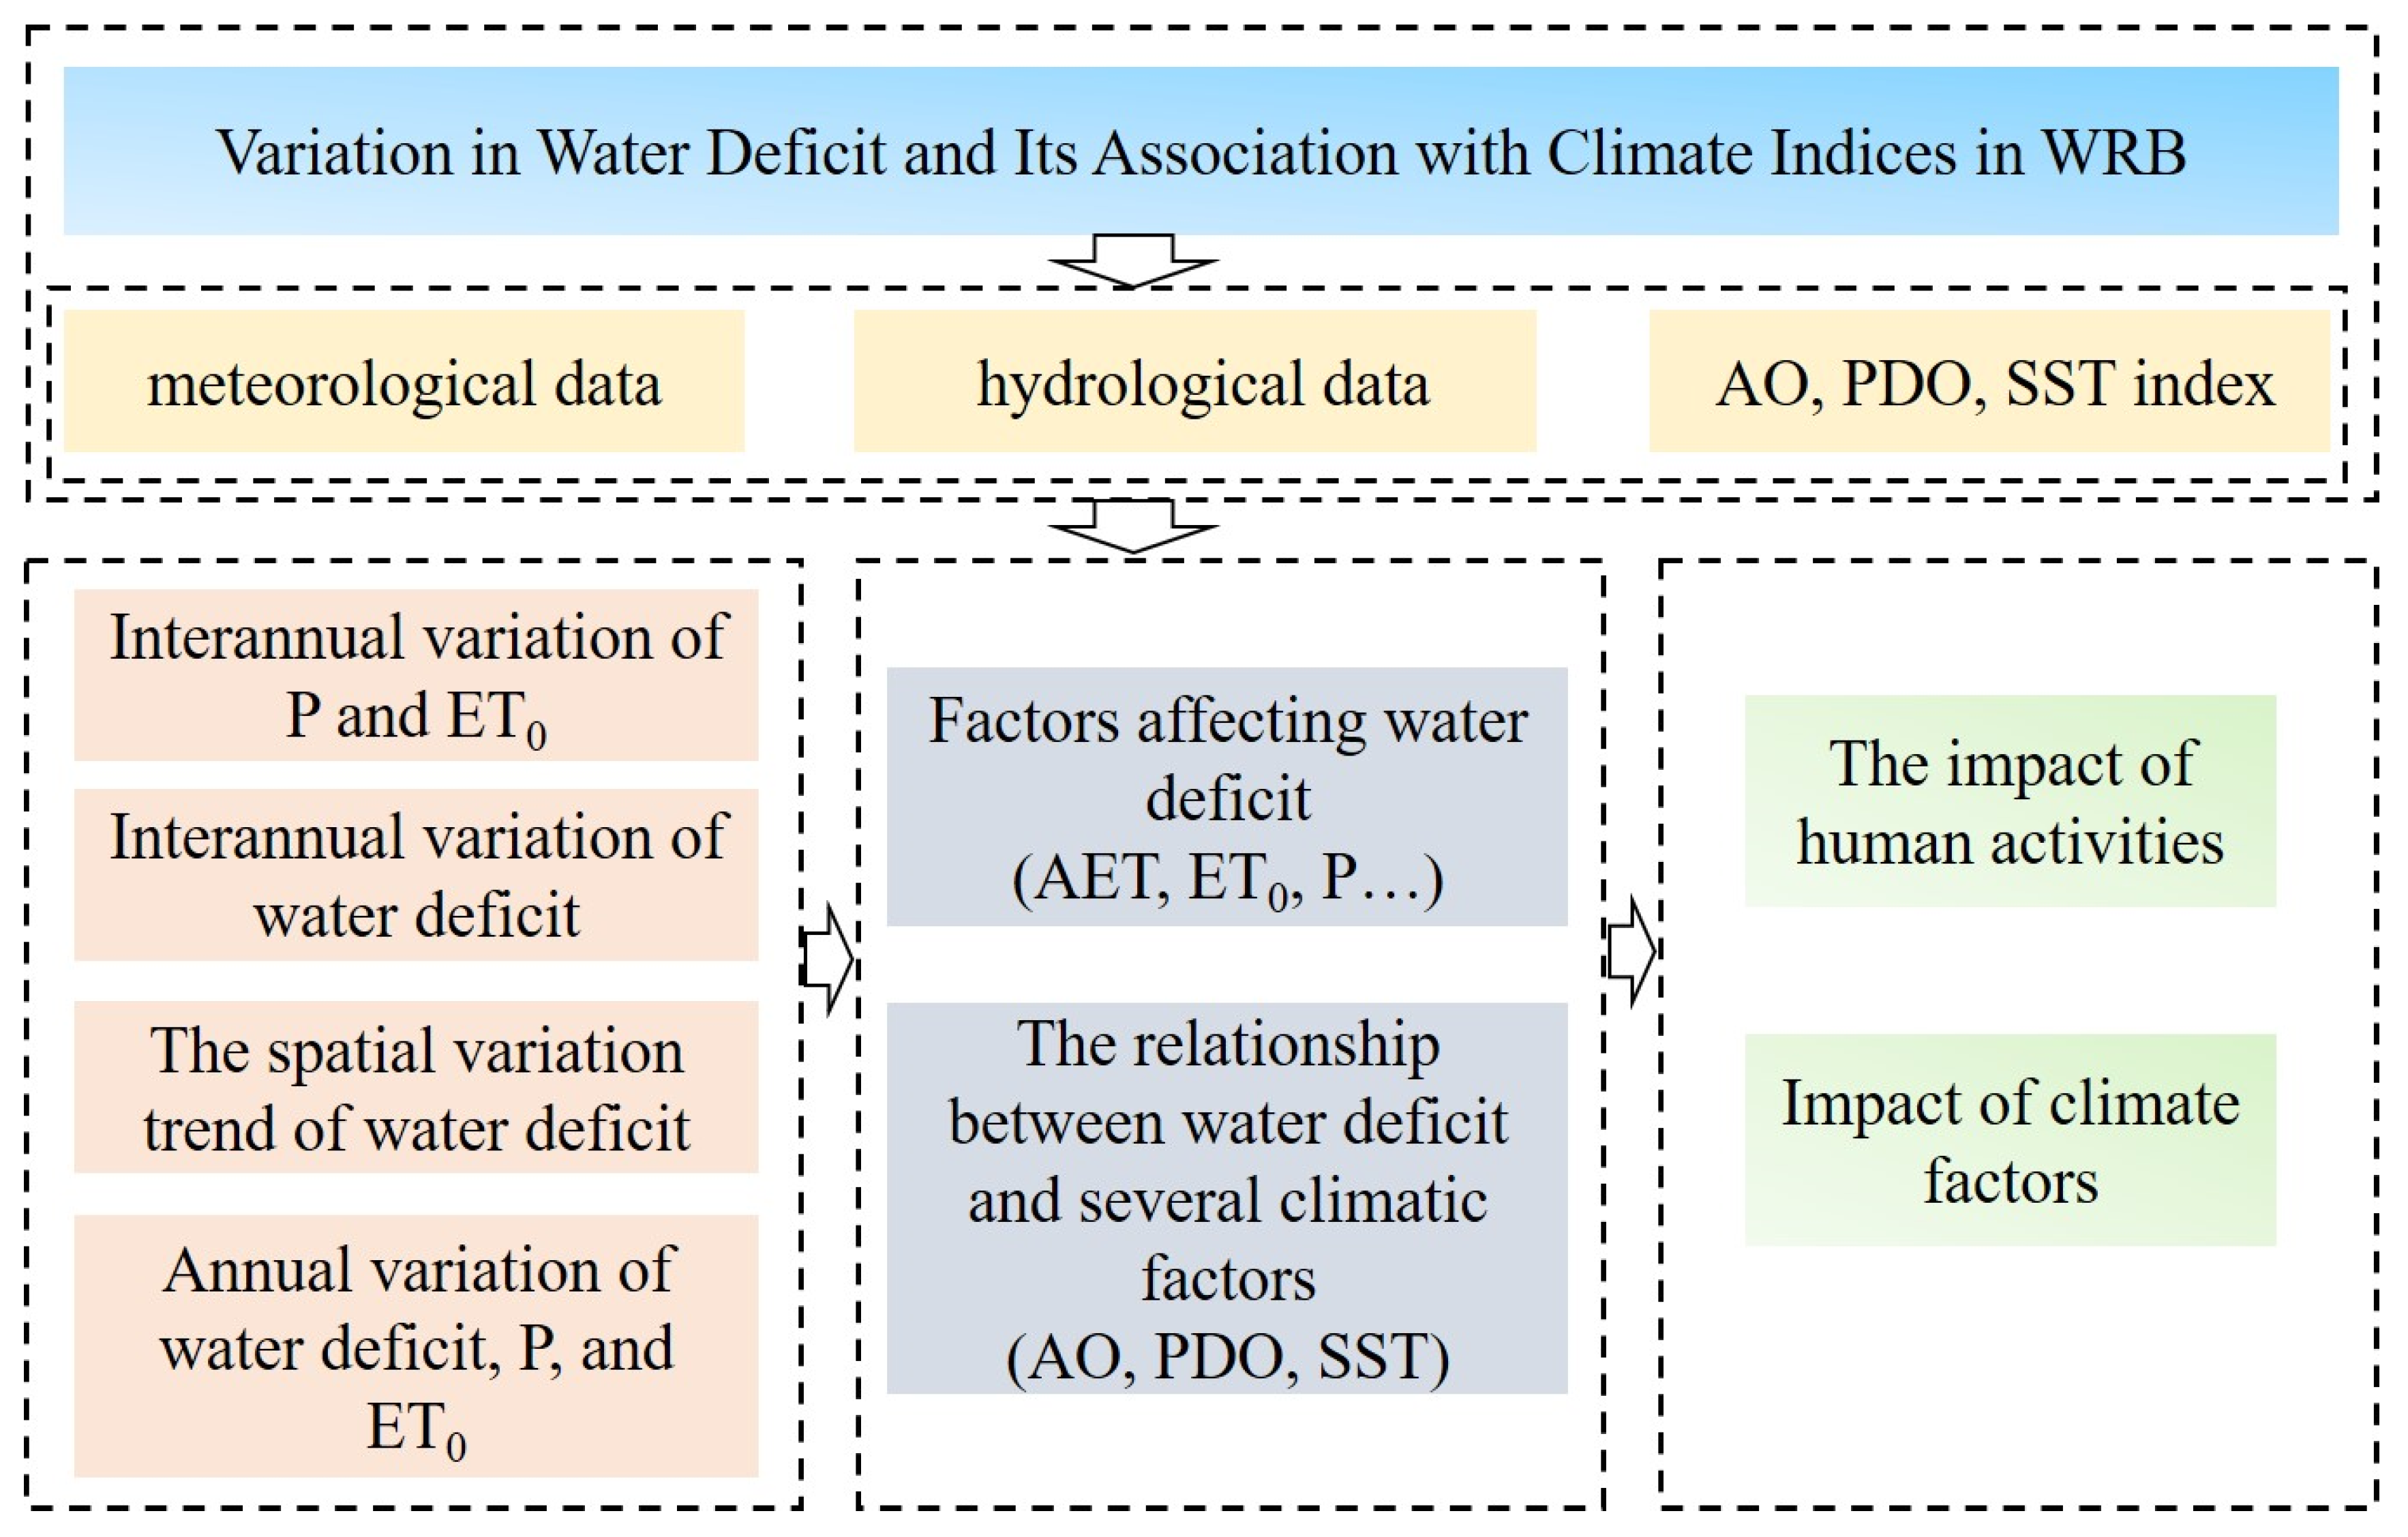
Variation in Water Deficit and Its Association with Climate Indices in Weihe River Basin, China

1
College of Urban and Environmental Sciences, Northwest University, Xi’an 710127, China
2
Shaanxi Key Laboratory of Earth Surface System and Environmental Carrying Capacity, College of Urban and Environmental Sciences, Northwest University, Xi’an 710127, China
Atmosphere 2024, 15(3), 339; https://doi.org/10.3390/atmos15030339
Submission received: 13 January 2024 / Revised: 22 February 2024 / Accepted: 29 February 2024 / Published: 9 March 2024
(This article belongs to the Special Issue The Water Cycle and Climate Change (2nd Edition))

Abstract

:
Based on the 24 meteorological stations in the Weihe River Basin (WRB) from 1951 to 2013, as well as the runoff data from the mainstream of the Weihe River, the temporal and spatial variations in water balance in the WRB and its relationships with runoff, the drought index, and the climate index were analyzed. The results indicate that the water balance in the WRB has been in a deficit state over the past 63 years, showing a weak declining trend with a decreasing rate of −20.04 mm/decade. Water balance is closely related to potential evapotranspiration (ET0) and precipitation (P). At the annual time scale, P plays a dominant role in water balance for 6–8 months in the WRB. The distribution of the water deficit (WD) in the WRB is uneven throughout the year, with the largest deficit occurring in June and the smallest values generally occurring in September. Furthermore, there are significant multi-scale correlations between water deficit and climate indices such as Arctic Oscillation (AO), Pacific Decadal Oscillation (PDO), and Sea Surface Temperature (SST) in the WRB. In addition, water deficit is also influenced by human activities, such as irrigation, as well as climate factors and socio-economic factors. Studying the temporal and spatial variation characteristics of water deficit and its influencing factors in the WRB is helpful toward deeply understanding the supply and demand dynamics of water resources in the basin and providing a theoretical basis and scientific guidance for the rational utilization of water resources and the high-quality development of the basin.

1. Introduction

Climate change alters global and regional water cycles and has significant impacts on the dry–wet conditions [1]. Drought depletes water resources [2,3], reduces ecosystem CO2 uptake and growth rates [4,5], and can also cause widespread plant mortality [6,7]. Predicting the impacts of drought on water resources and ecosystems is challenging primarily because the response of the potential evapotranspiration (ET0) to drought is highly uncertain [8,9]. Understanding the driving factors controlling the variability in water deficit is key to its correct simulation and early warning.
While many studies have focused on the sensitivity of vegetation to soil moisture deficit [10,11,12] or on the agricultural crop water deficit [13,14], many scholars have tried to detect the reason of water deficit in the WRB; most existing research has focused on reduced runoff, drought, and water security [15,16,17,18,19,20]. There is no comprehensive consideration of the impact of human activities, such as irrigation and urban development, and there is also a lack of research on the impact of climate change on water deficit. The variations in water deficit in river basins require further research. Drought is usually associated with inadequate rainfall, and the contribution of evapotranspiration to drought propagation is still not clear [21]. Evapotranspiration, which is the water vapor emitted from plant surfaces, is influenced by various factors including temperature, humidity, wind speed, vegetation type, and soil conditions. Therefore, the response of evapotranspiration to drought may vary under different climate and environmental conditions. Generally, during the occurrence of drought, the water supply in the soil is insufficient, leading to a reduction in the rate of evapotranspiration of plants. This is because plants close their stomata to reduce water loss. This response helps plants maintain water balance under drought conditions but also inhibits their growth. Studies have shown that during the 2009–2010 drought in Southwest China, soil moisture deficit had a greater impact on vegetation growth than meteorological drought. It took two months after the end of the drought for respiration and photosynthesis to return to normal [22]. Evaporation and transpiration can also exacerbate summer droughts in Europe [21]; however, the response of evapotranspiration to drought is not a simple linear relationship. Research has shown that within most available soil moisture ranges, evapotranspiration is mainly influenced by atmospheric conditions rather than soil moisture [23]. In humid climate regions, atmospheric conditions during drought periods are usually more conducive to evapotranspiration. Changes in evapotranspiration affect water availability and ecosystem health. A higher evaporative demand during droughts increases evapotranspiration, but drought also reduces the water supply needed for evapotranspiration, even limiting the prediction of abnormal evapotranspiration patterns. The increase in evapotranspiration caused by drought is particularly concerning as it rapidly depletes water resources, leading to severe stress on ecosystems and flash drought events [24]. Some studies have shown that among all non-biotic stresses, drought has the strongest impact on soil microbial communities and plants, and it also has the most complex environmental influence on other ecosystems [25]. Under drought conditions, some plants may increase evapotranspiration to maintain normal growth and metabolism by regulating stomatal size and number. This response is influenced by various factors such as plant species characteristics, soil texture, and water supply, resulting in certain uncertainty in the response of evapotranspiration under drought conditions. While some studies have shown that temperature is the main driving factor for ecological drought [26], in regions dependent on irrigation, there is a weak correlation between crop water surplus/deficiency and rice yield [27]. Therefore, it is essential to identify the main factors of water deficit in advance for the early warning and mitigation of droughts in traditional agricultural irrigation areas.
Previous studies have shown that climate indicators can be used to measure wetness and dryness, including the rainfall, aridity index and water balance. Water balance refers to the difference between regional precipitation (P) and potential evapotranspiration (ET0) during a certain period, taking into account the impact of various meteorological factors [28,29]. It reflects the amount of the water supply and demand in a specific location, providing information about the climate’s wetness or dryness. It is primarily determined using the quantity and spatial–temporal distribution of P, as well as meteorological variables such as solar radiation, temperature, humidity, and wind speed.
The WRB is the cradle of Chinese civilization in the Yellow River Basin and holds a long history of agricultural civilization. Differences in water availability are of significant importance for regional food production and crop layout. Therefore, it is necessary to study the water deficit in traditional agricultural areas and its influencing factors to scientifically guide agricultural structural adjustments and formulate irrigation and drainage measures in farmland [30]. This study aimed to (1) reveal the spatiotemporal pattern of water profit and loss in the WRB; (2) analyze the characteristics of changes in water deficit, P, and ET0 in the WRB and derive their extreme value variation patterns and annual curve distribution patterns; and (3) identify the driving factors of water deficit and reveal their spatial patterns of influence on multiple time scales. A flow chart of the research is provided in Figure 1.
The study on the temporal and spatial variation characteristics of water deficit and its relationship with climatic factors in the WRB is helpful toward deeply understanding the variation law of climate drought and flood in the basin and then grasping the dynamics of the water supply and demand, so as to provide a theoretical basis and scientific guidance for the rational utilization and sustainable development of water resources in the basin, as well as ecological protection and high-quality development.

2. Study Area and Data
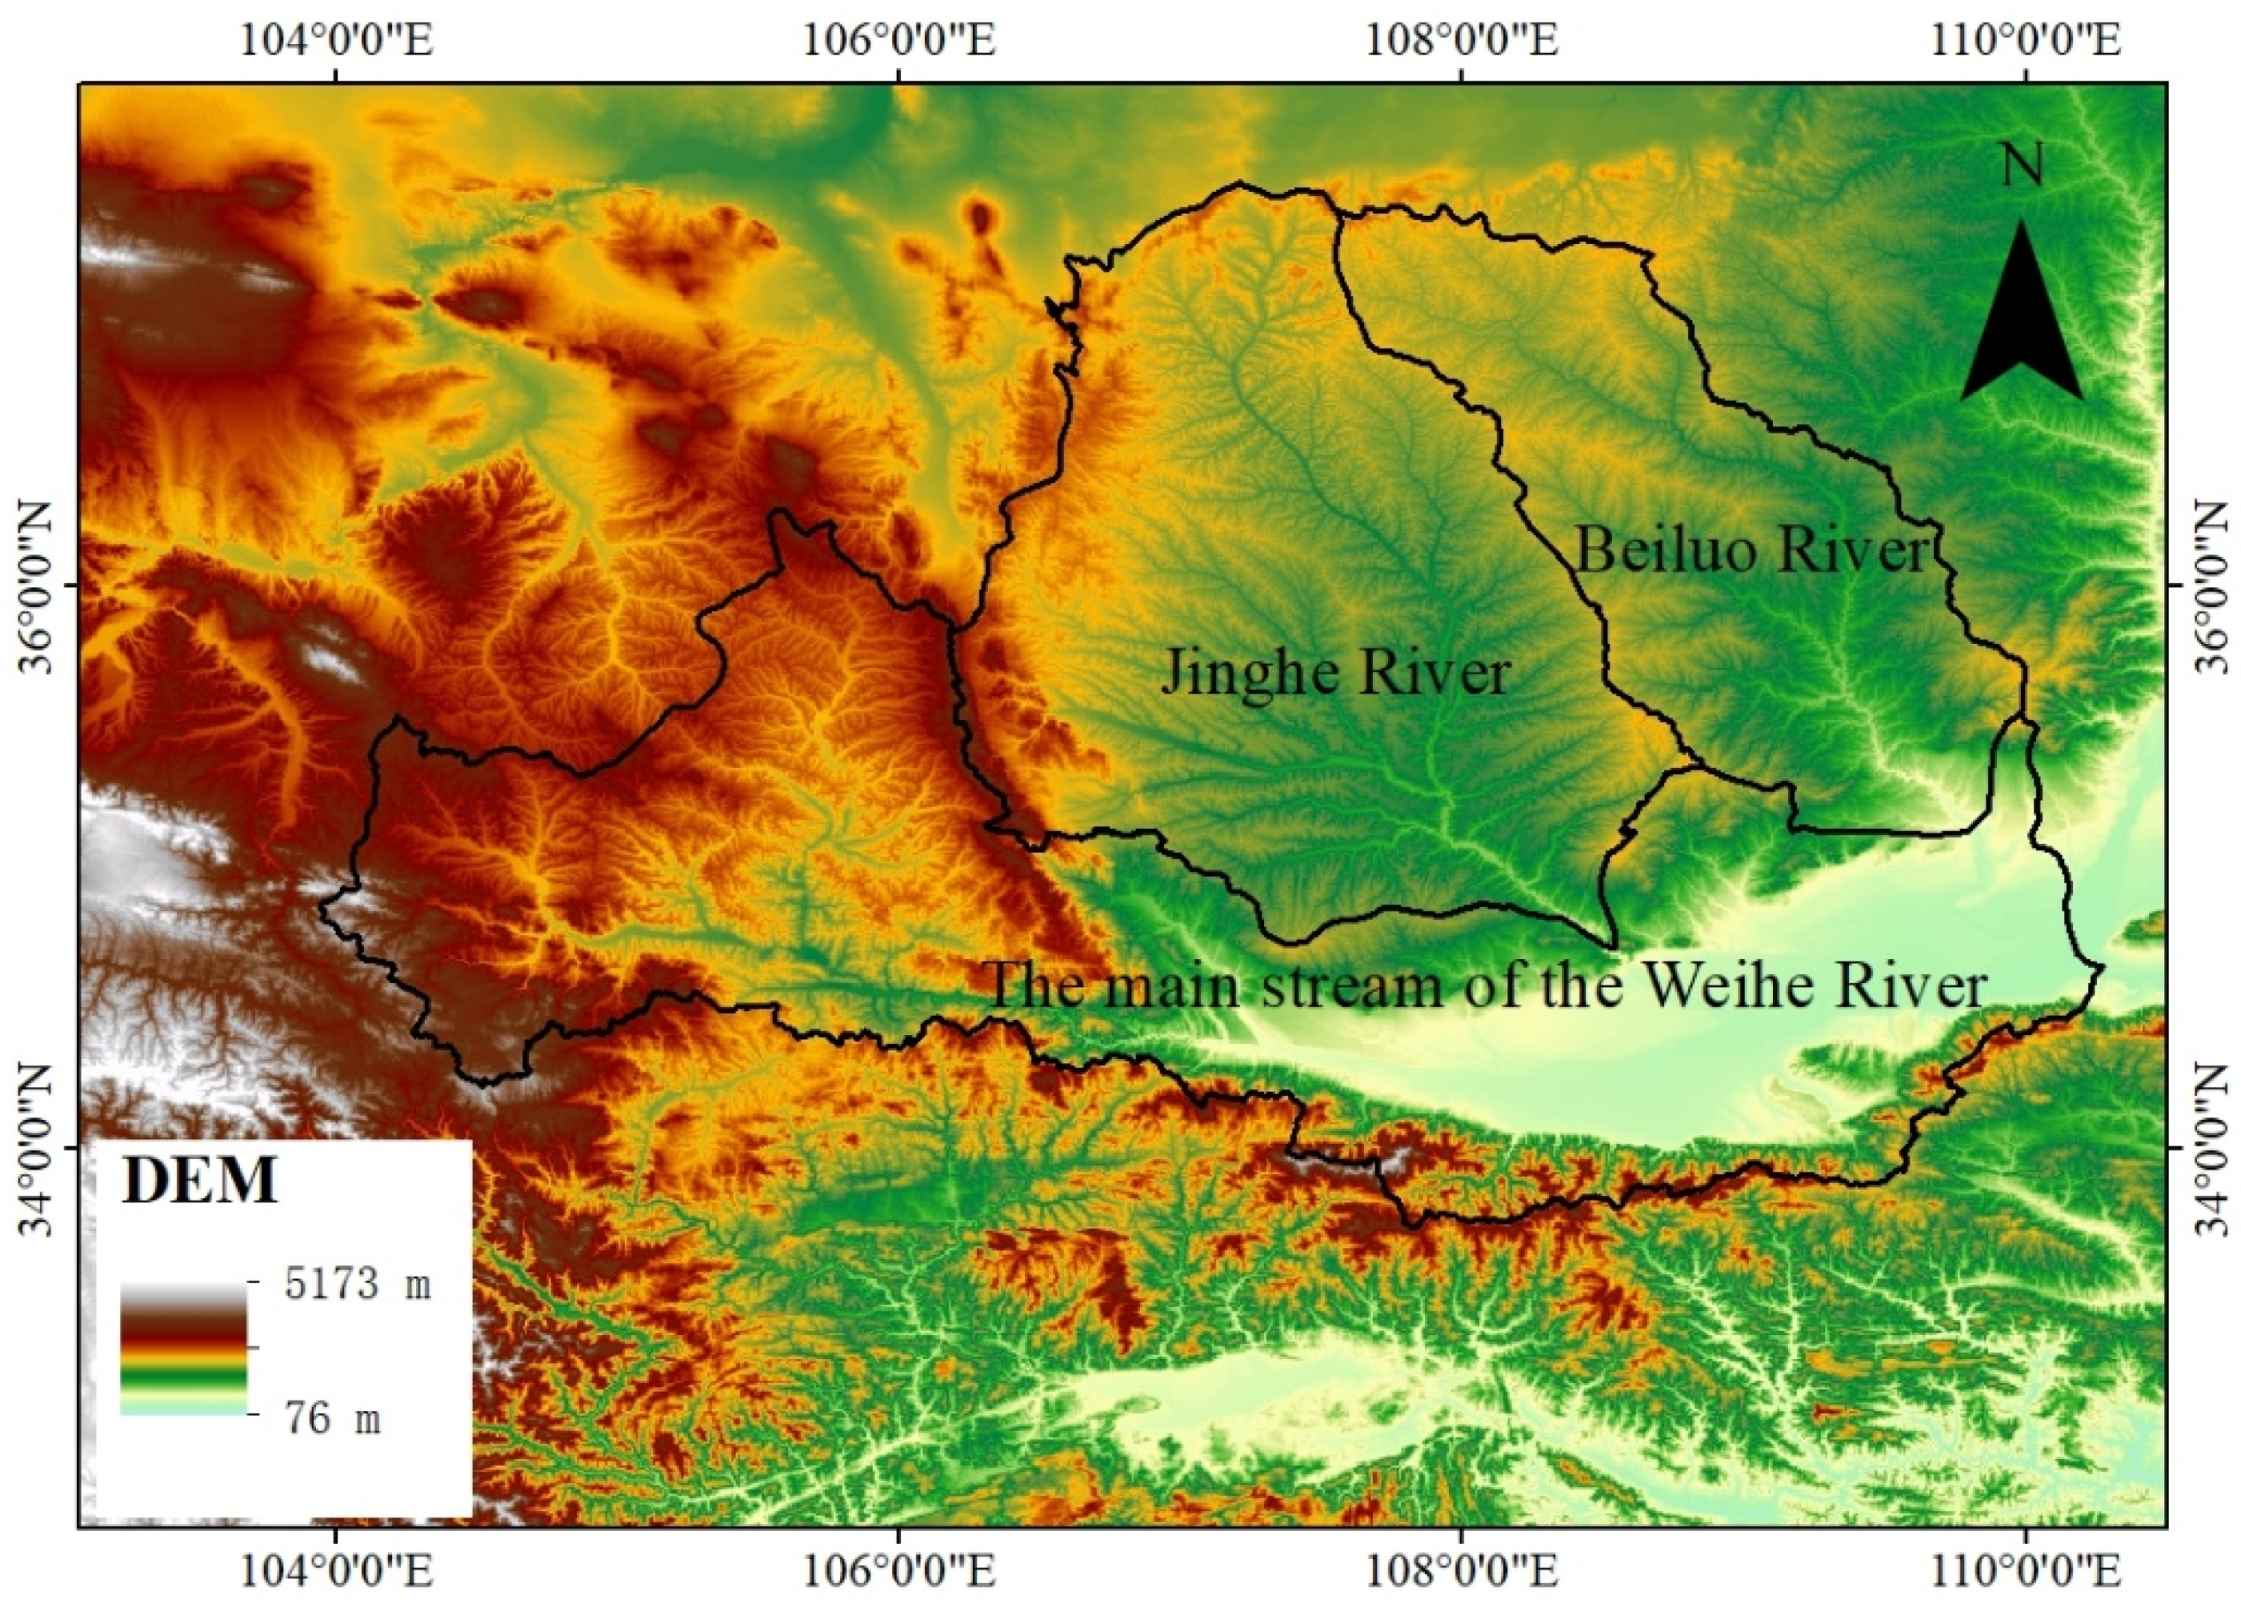
2.1. Study Area

The Weihe River is the largest tributary of the Yellow River, originating from Mountain Bird and Mouse in Weiyuan County, Gansu Province, and flowing into the Yellow River in Tongguan County, Shaanxi Province [31]. The WRB is divided into three regions: the Beiluo River Basin, the Jing River Basin, and the mainstream of the Weihe River (Figure 2). The total area of the watershed is approximately 1.35 × 10⁵ km2, located between 103.5° E–110.5° E and 33.5° N–37.5° N [32]. The WRB belongs to the arid and humid transitional zone, with an annual P of about 600 mm and an average ET0 of 800–1200 mm. The annual mean temperature range is about 7.8 to 13.5 °C [33], and the annual average natural runoff is 10.4 billion m3, accounting for 17.3% of the total flow of the Yellow River [34].

2.2. Data Sources

Monthly meteorological data from January 1961 to December 2013 of the WRB were obtained from the China Meteorological Data Sharing Service System (http://data.cma.cn/, accessed on 30 January 2014). The monthly meteorological data included the maximum, minimum, and mean air temperature, T, wind speed, relative humidity, sunshine hours, and vapor pressure. The runoff data were obtained from the Hydrological Yearbook of the People’s Republic of China. The meteorological data and hydrological data were derived from the measured data of the site. Before use, missing data were interpolated via Kriging, and outliers and error data were corrected. The quality control of the data was carried out by using the geostatistical analysis tool in Arc GIS, which considers the randomness of the spatial distribution of the site and was widely used in the original data inspection [35,36].
The AO (Arctic Oscillation) index came from NOAA (the Climate Prediction Center of the National Oceanic and Atmospheric Administration, related website: http://www.cpc.noaa.gov, accessed on 30 January 2014). The monthly data of PDO (Pacific Interdecadal Oscillation) came from http://jisao.washington.edu/pdo/PDO.latest. (accessed on 30 January 2014) The time series of the Nino 3.4 SST (Sea Surface Temperature) data were acquired from NOAA (http://www.ncdc.noaa.gov/teleconnections/enso, accessed on 30 January 2014).

3. Methodology

3.1. Estimation of Water Deficit and Reference Evapotranspiration

In this paper, we use the difference between P and ET0 during the same period to represent water deficit. The water deficit was calculated as follows:
W D = P E T 0
This article uses the Penman–Monteith model, recommended and revised by FAO in 1998, to calculate ET0:
E T o = 0.408 Δ R n G Δ + γ 1 + 0 . 34 U 2 + γ 900 T + 273 U 2 e s e a Δ + γ 1 + 0 . 34 U 2
where Rn is the net radiation at the surface; G is the soil heat flux; γ is the psychrometric constant; U2 is the wind speed at a 2 m height; es is the saturated vapor pressure; ea is actual vapor pressure; Δ is the derivative of saturated water vapor pressure with respect to temperature, expressed in kPa/°C; and T is the average temperature. The parameters can be found in reference [37].
The Budyko water–energy balance equation is suggested to be an efficient approach for simulating the AET (actual evapotranspiration) [38], and it is widely used to study water and energy balances [39,40,41] and is expressed as follows:
A E T i = [ P i × ( 1 e x p ( E T 0 i P i ) ) × E T 0 i × t a n h ( P i E T 0 i ) ] 0.5
where AET, P, and ET0 are the annual actual areal evapotranspiration, precipitation, and potential evapotranspiration of the WRB, respectively; i ranged from 1961 to 2013 in this study.

3.2. Statistical Tests for Trend Analysis

A linear trend analysis of the P, ET0, and water deficit data of the WRB was conducted through site observation-based linear regression analysis. The formula is as follows:
S l o p e = n × i = 1 n ( i × y i ) i = 1 n i i = 1 n y i n × i = 1 n i 2 ( i = 1 n i ) 2
where n is the number of years, and yi denotes the data of each station in the study area in the i-th year. The slope of the linear regression equation of the interannual variation in the data, that is, the rate of change of the trend, reflects the overall direction of P, ET0 or water deficit during the study period. Slope > 0 indicated that the overall evolution of the P, ET0, or water deficit showed an increasing trend, and slope < 0 suggested that the overall change in the P, ET0, or water deficit showed a decreasing trend.

3.3. Formula for Calculating Correlation Coefficient

Based on the meteorological station data, this study investigated the correlation coefficient between water deficit and key factors of the hydrological cycle in the WRB. The formula is as follows:
R xy = i = 1 n [ ( x i x - ) ( y i y - ) ] i = 1 n ( x i x - ) 2 i = 1 n ( y i y - ) 2
where n is the number of years; Rxy is the linear correlation coefficient of the two influencing factors x and y; xi, and yi are the values of the two influencing factors x and y in the i-th year (i = 1961, 1952 …, 2013); and x and y are the average values of the two influencing factors.

3.4. Mann–Kendall Test

On the basis of the Mann–Kendall (MK) trend test, the Modified Mann–Kendall (MMK) trend test method can be used for detecting trend features in time series, while better eliminating autocorrelation components in the time series. The Z statistic of the MMK test can be used to identify whether the trend of the time series is decreasing or increasing. A positive Z statistic indicates an upward trend in the time series, while a negative Z statistic indicates a downward trend in the entire time series. The MMK test Z statistic is generally used to identify whether the trend of a time series is consistently decreasing or increasing. In this study, trend significance was tested at the α = 0.05 (1.96 ≤ |Z| < 2.58) and α = 0.01 (|Z| ≥ 2.58) significance levels. Positive values of the Z statistic indicate upward trends over the whole time series, whereas negative values of the Z statistic indicate downward trends over the entire time series.

3.5. Cross-Wavelet Transform and Wavelet Coherence

Wavelet analysis is often applied in geophysical and hydrometeorological time series analysis, and it is a new signal analysis technique that combines wavelet transform and cross-spectral analysis [42].
The advantage of XWT (Cross-Wavelet Transform) is that it can be applied to determine the wavelet power spectrum of the water deficit and the climate index time series, which reveal their characteristic periods of oscillation. The merit of WTC (Wavelet Coherence) is that it can be used to identify phase shifts between the water deficit and the climate index time series. The Matlab2021a software package of WTC and XWT analysis was obtained from the website http://atoc.colorado.edu/research/wavelets. The purpose of XWT and WTC is to analyze the remote correlation between water balance and climate factors such as the AO, PDO, and SST.
The XWT of two time series X and Y is defined as
W X Y = W X W Y
where the asterisk indicates a complex conjugate. W X and W Y are the wavelet transforms of time series X and Y . We further define the cross-wavelet power as W X Y . The phase angle of W X Y can be interpreted as the local relative phase between X and Y in time–frequency space. Statistical significance was estimated against a red noise model [33].
The WTC of two time series were defined as
R 2 ( s ) = S ( s 1 W X Y ( S ) ) 2 S ( s 1 W X ( s ) 2 ) · S ( s 1 W Y ( s ) 2 )
where S is a smoothing operator, and W X Y is the cross-wavelet power spectrum while W X and W Y are the wavelet transforms of time series X and Y . W X and W Y   are the cross-wavelet powers. The 0.05 statistical significance level of wavelet coherence was estimated using the Monte Carlo method with a red noise approach.

4. Results and Discussions

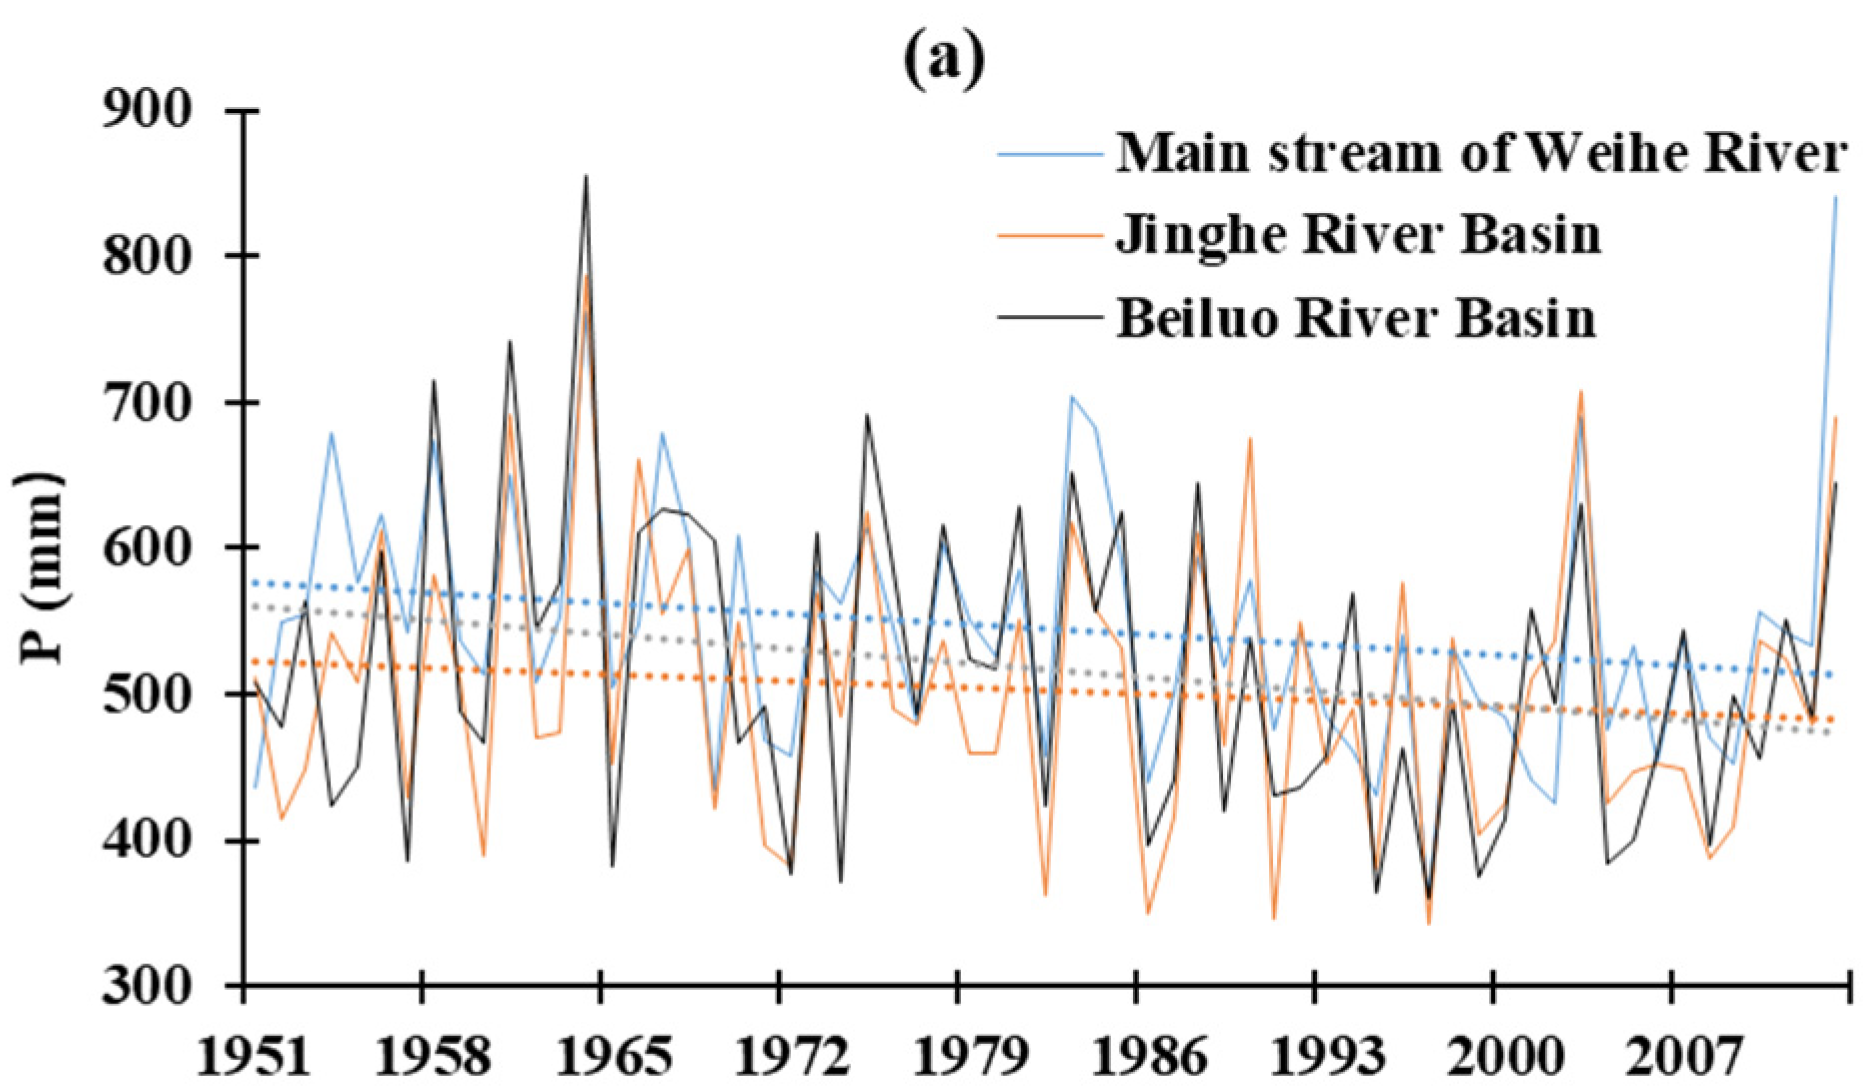
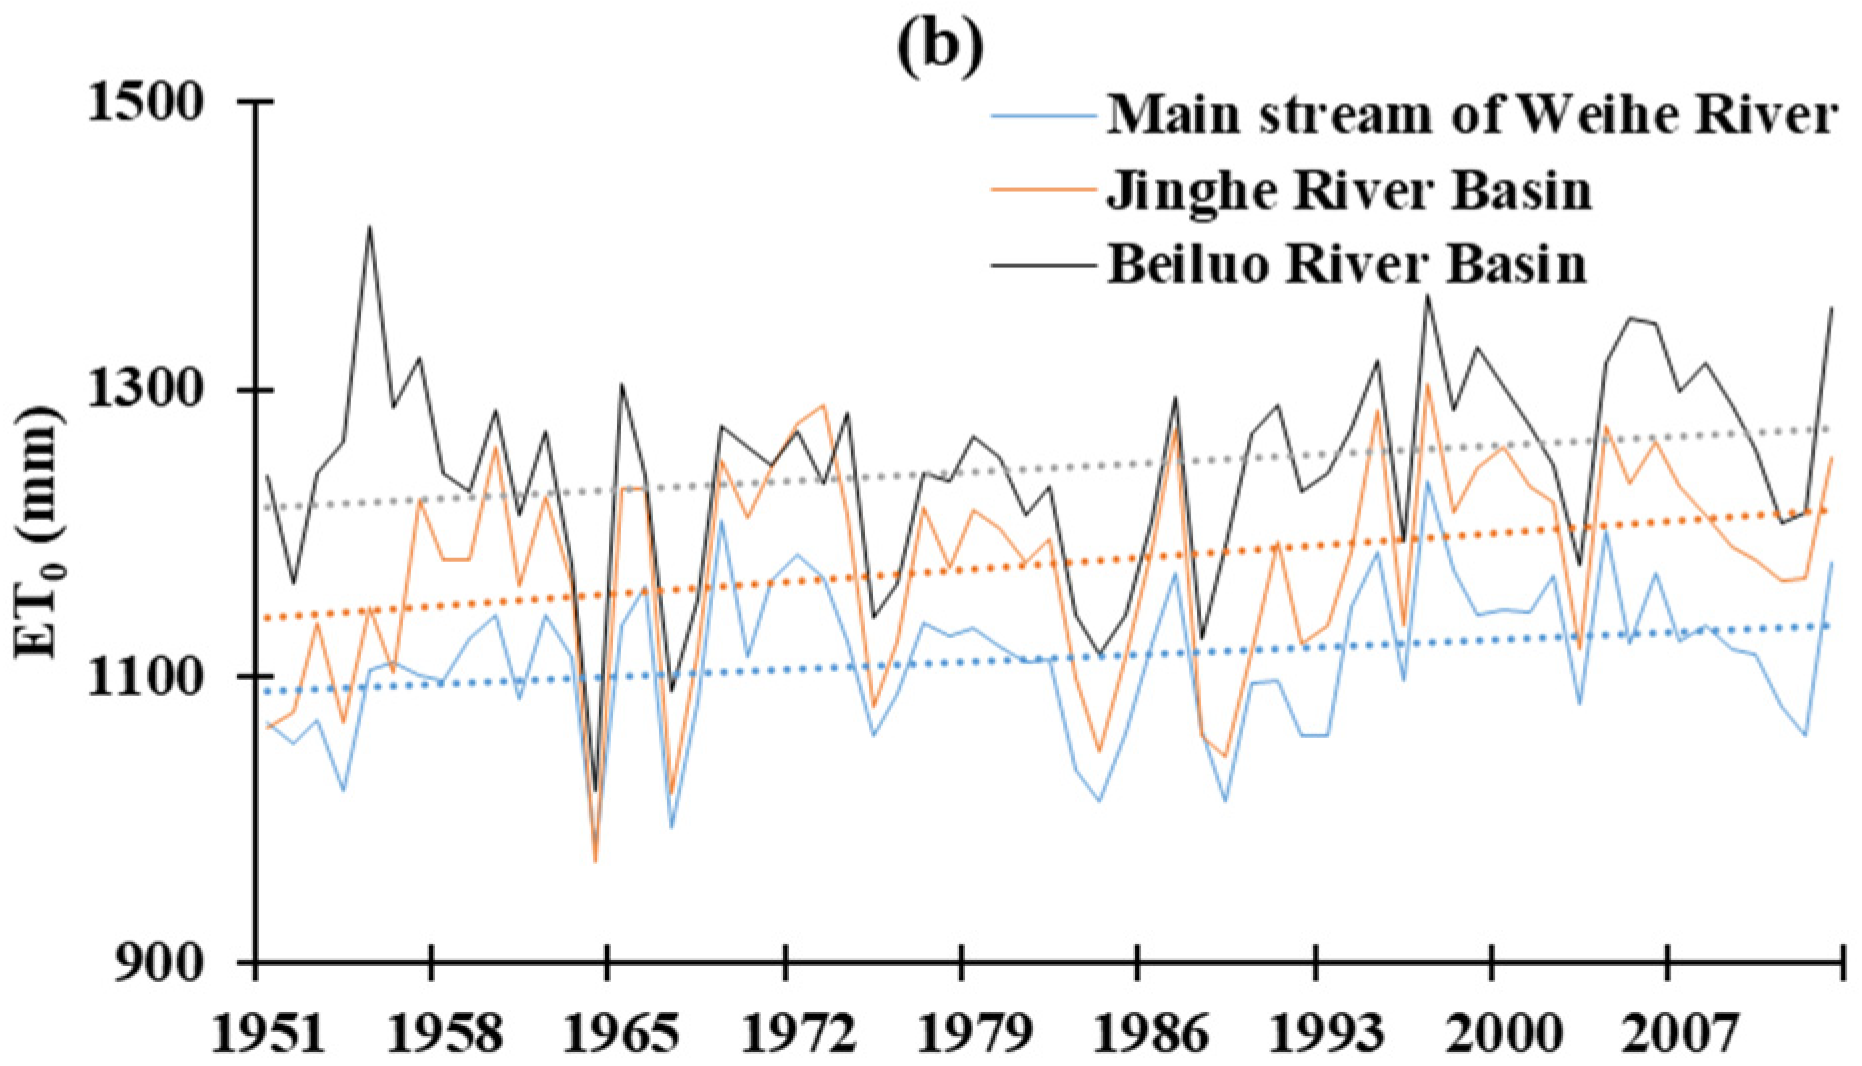
4.1. Interannual Variations in P and ET0

The overall trend of P in the WRB is decreasing at a rate of −10.15 mm/decade, with decreasing rates of −10.22 mm/decade, −6.26 mm/decade, and −13.96 mm/decade in the mainstream of the Weihe River, Jing River Basin, and Beiluo River Basin, respectively (Figure 3a). The overall trend of ET0 in the WRB is increasing at a rate of 9.50 mm/decade. The ET0 showed an upward trend with rapidly increasing rates of 7.39 mm/decade, 12.13 mm/decade, and 8.96 mm/decade in the mainstream of the Weihe River, Jing River Basin, and Beiluo River Basin, respectively (Figure 3b).
Overall, the downward trend of P is greater than the upward trend of ET0, which will lead to a further increase in water deficit.

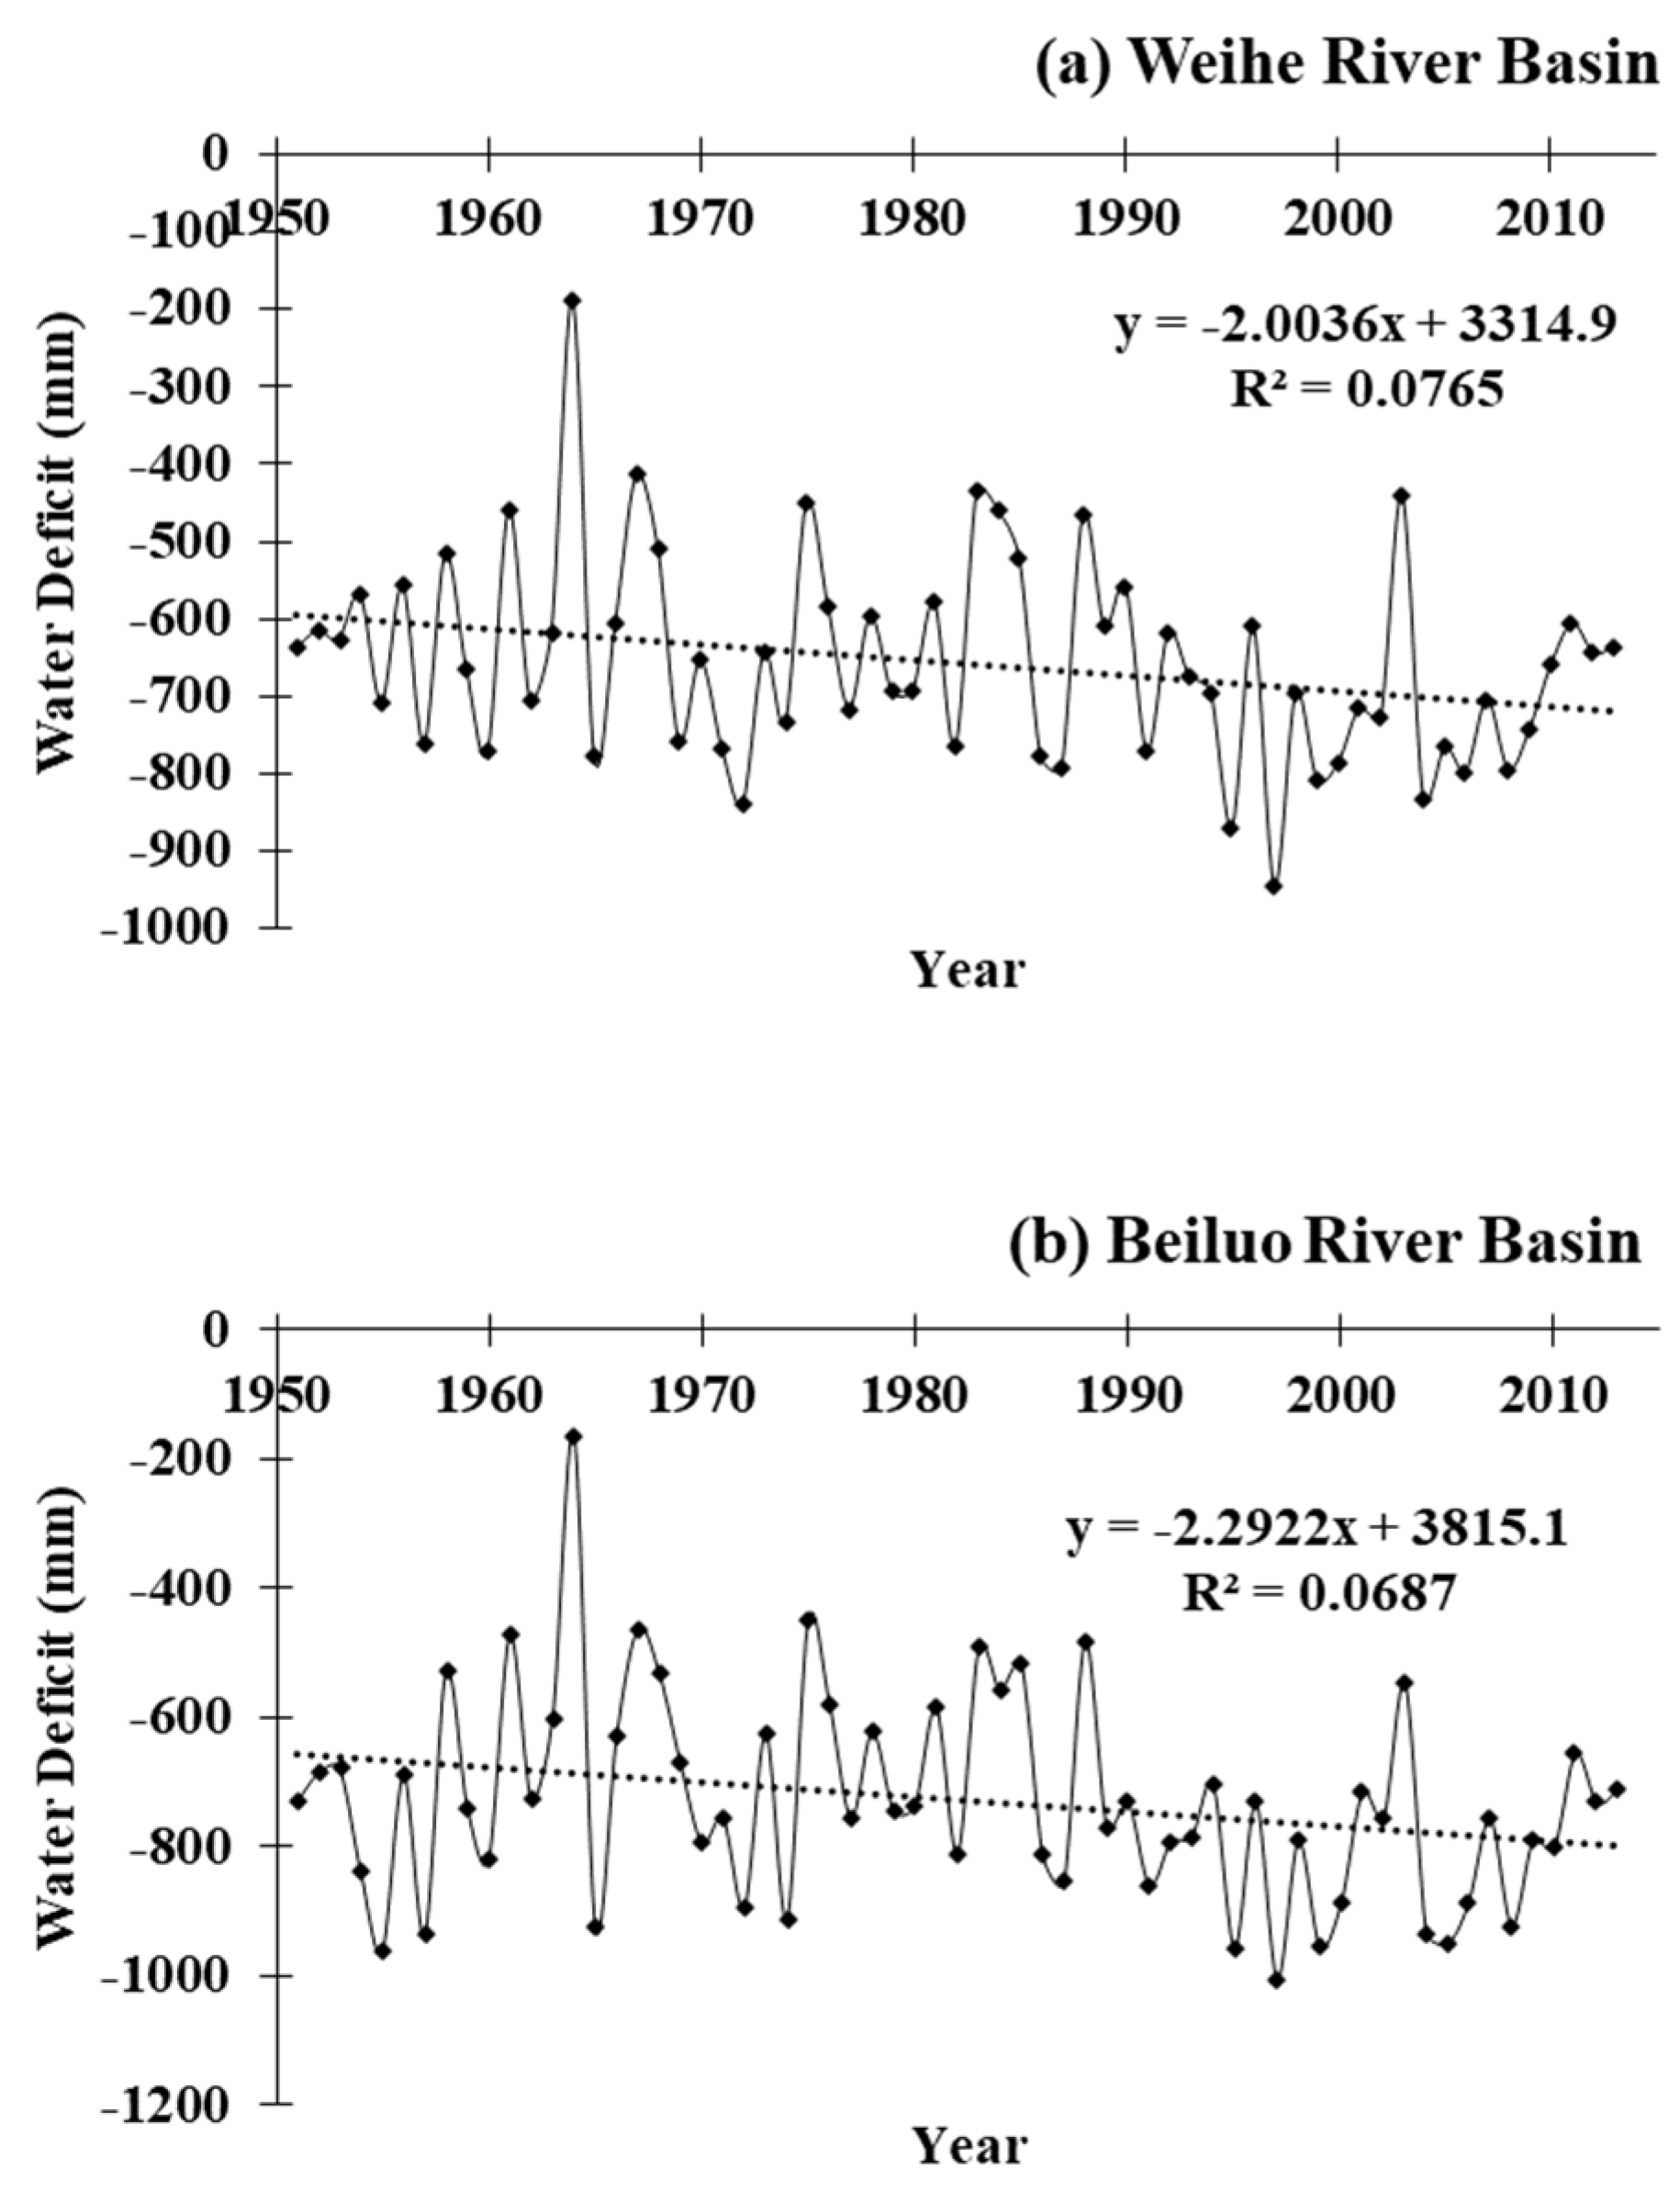
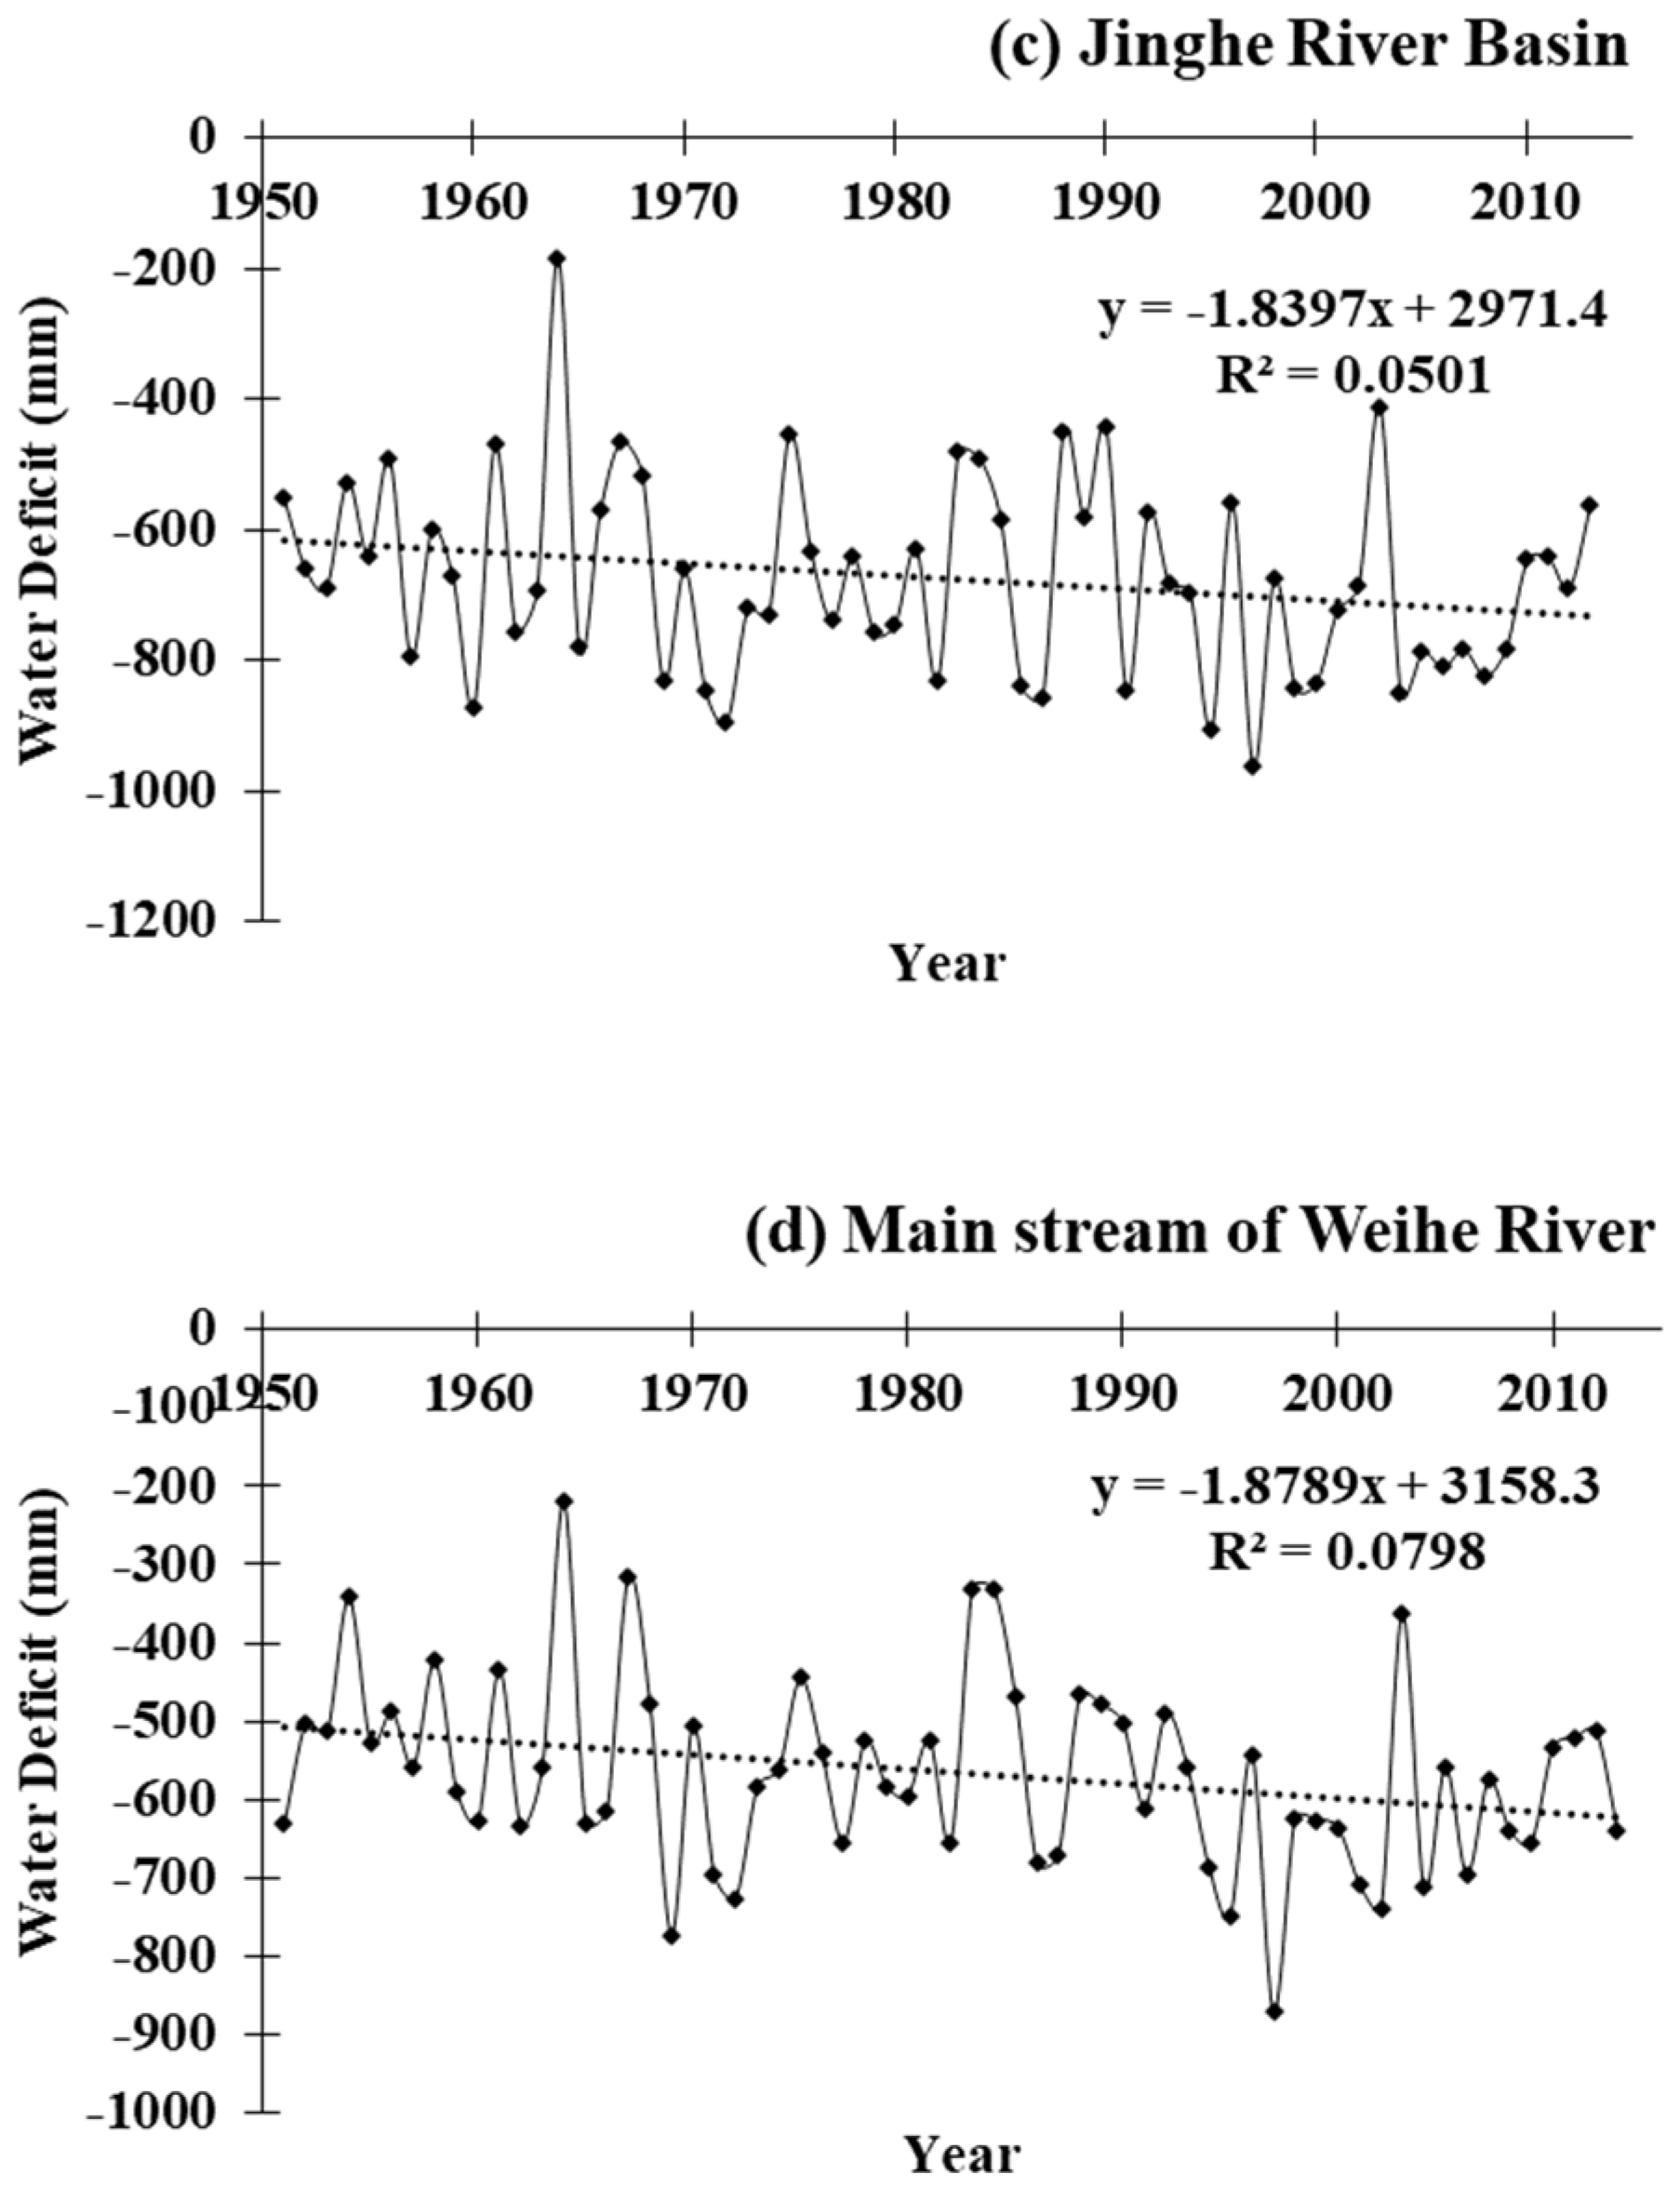
4.2. Interannual Variation in Water Deficit

From 1951 to 2013, the water balance in the WRB generally showed a decreasing trend, with an increase in water deficit. The average long-term water balances in the Beiluo River Basin, Jing River Basin, the mainstream of the Weihe River, and the WRB were −728.06 mm, −674.77 mm, −565.73 mm, and −656.19 mm, respectively. The trend rates of water deficit were −22.92 mm/decade, −18.40 mm/decade, −18.79 mm/decade, and −20.04 mm/decade, respectively (Figure 4). Among them, the Beiluo River Basin had the largest water deficit and the highest decreasing trend rate. The range of water deficit in the Beiluo River Basin was between −1004.98 and −163.5 mm, while in the mainstream of the Weihe River, it ranged from −219.72 to −871.88 mm, and in the Jing River, it ranged from −182.58 to −961.5 mm. The maximum water deficit in each basin occurred in 1964, while the minimum occurred in 1997.

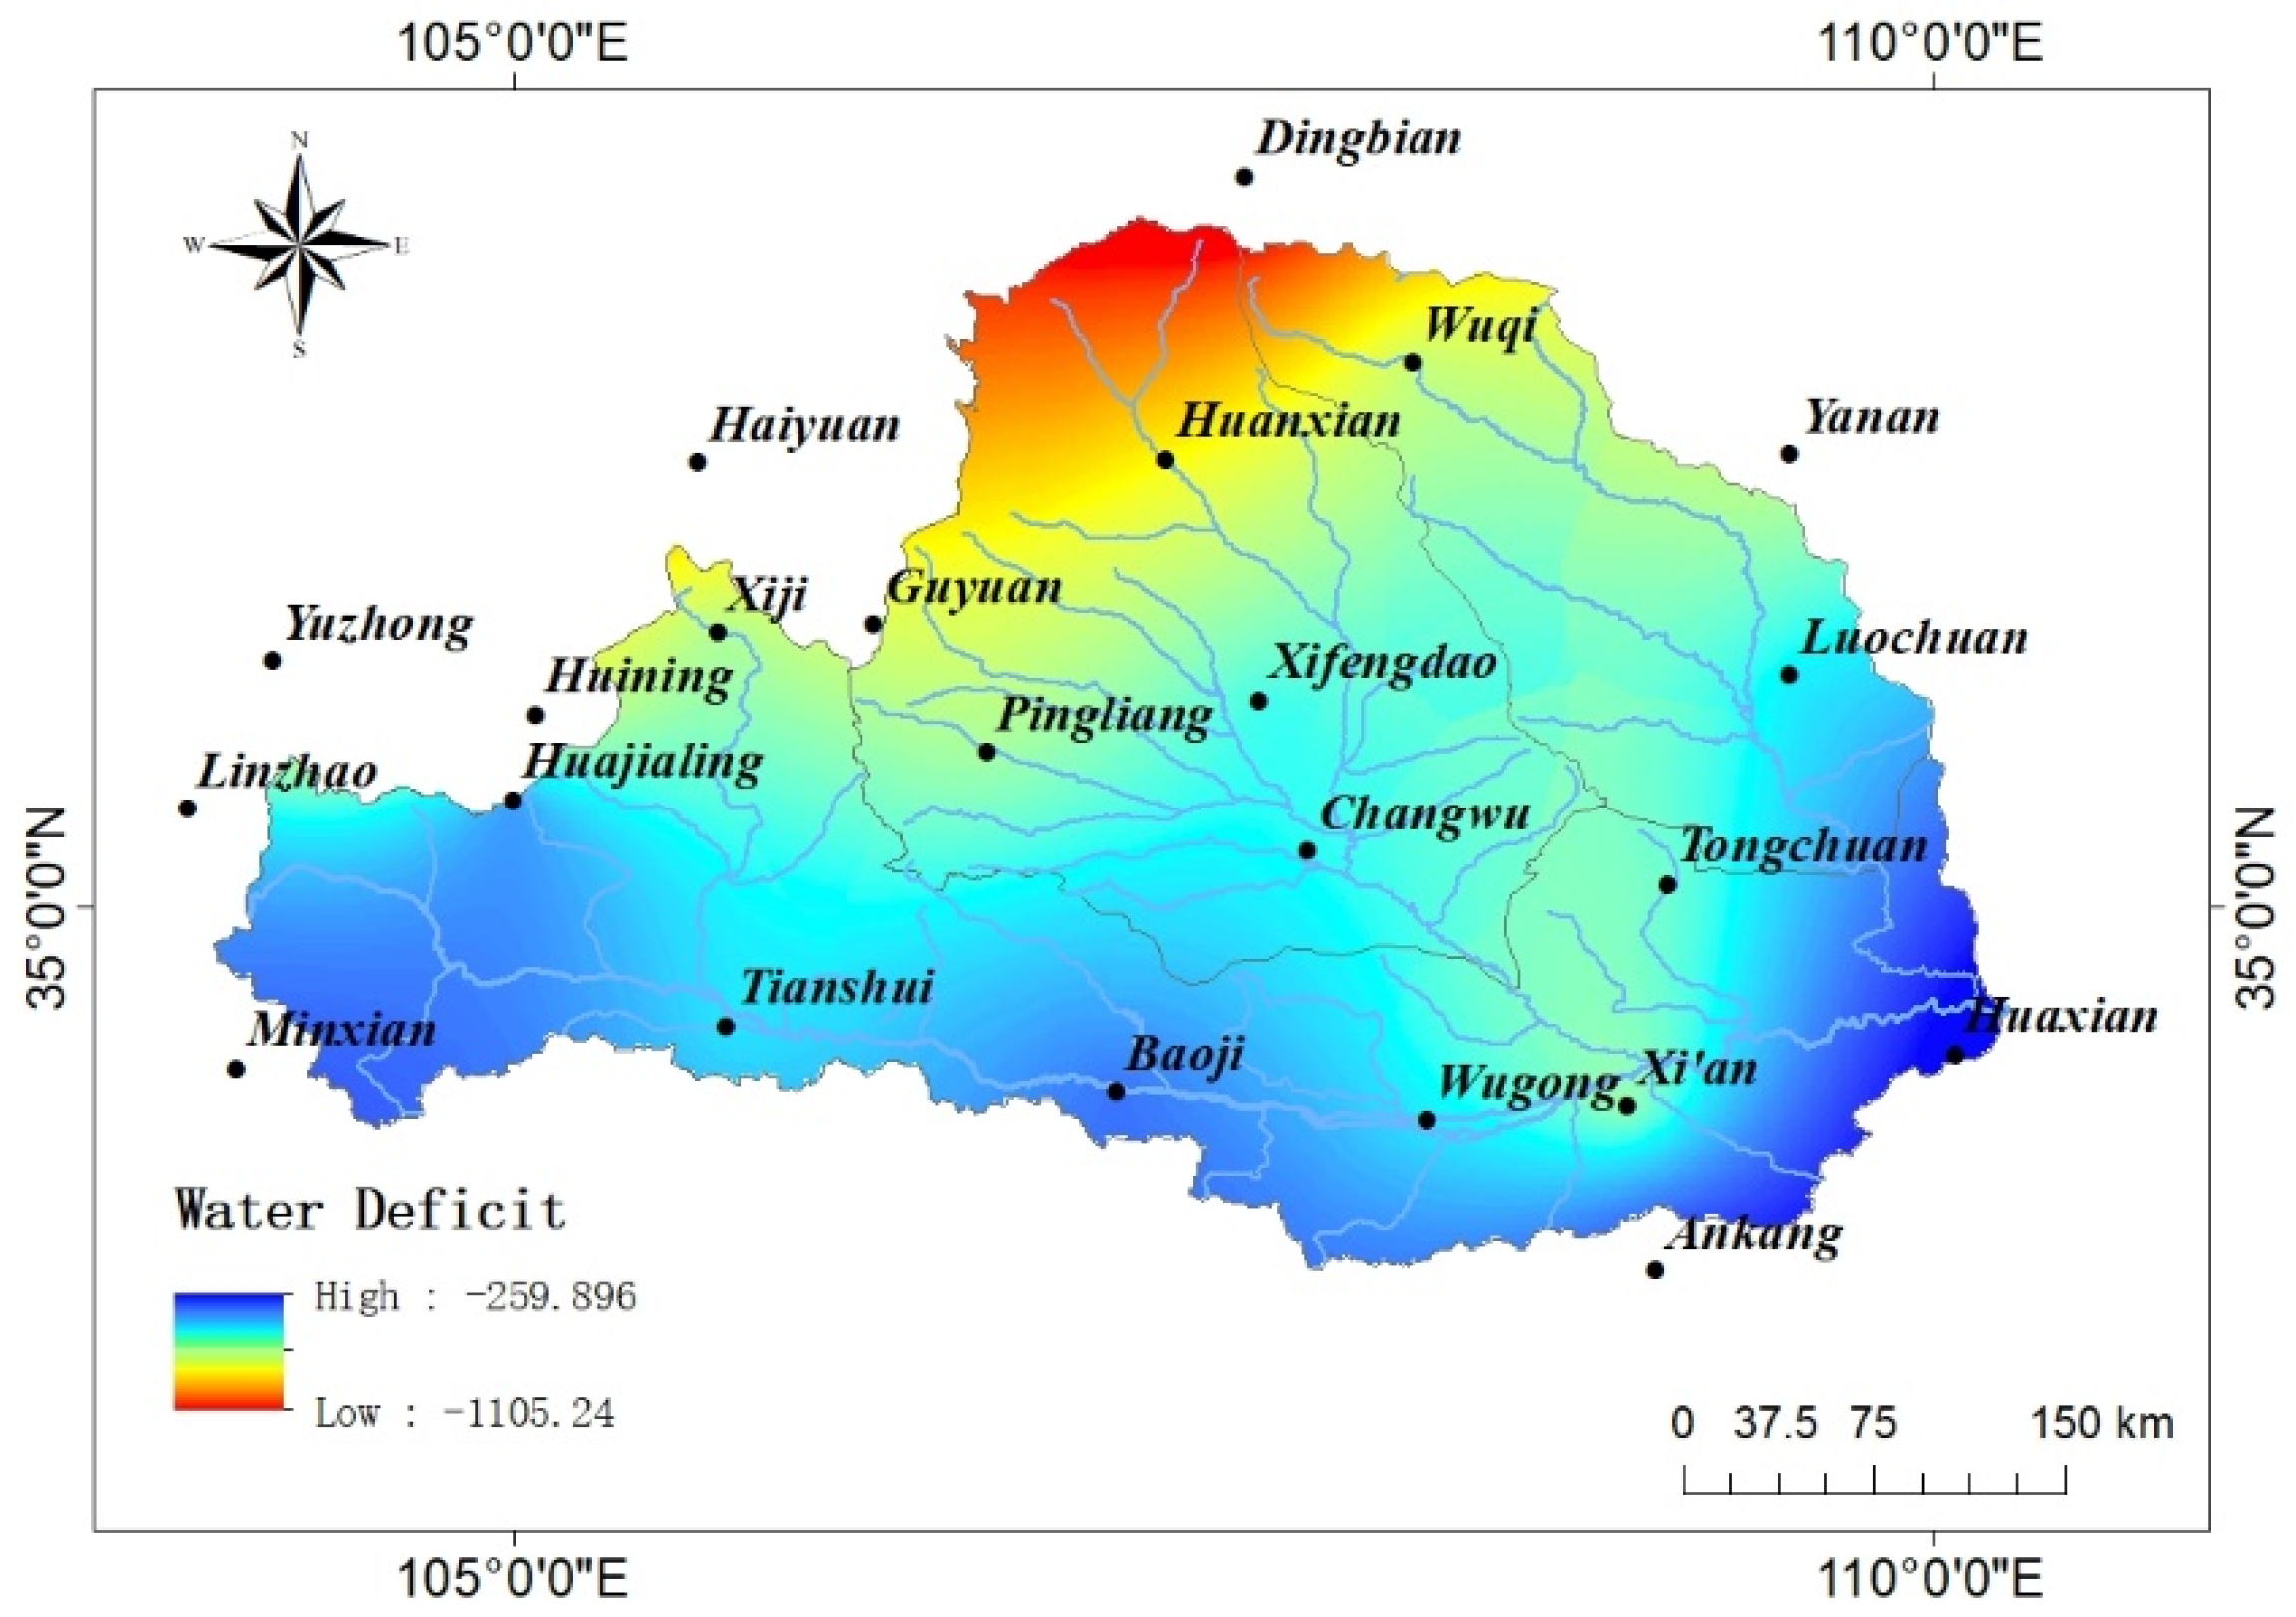
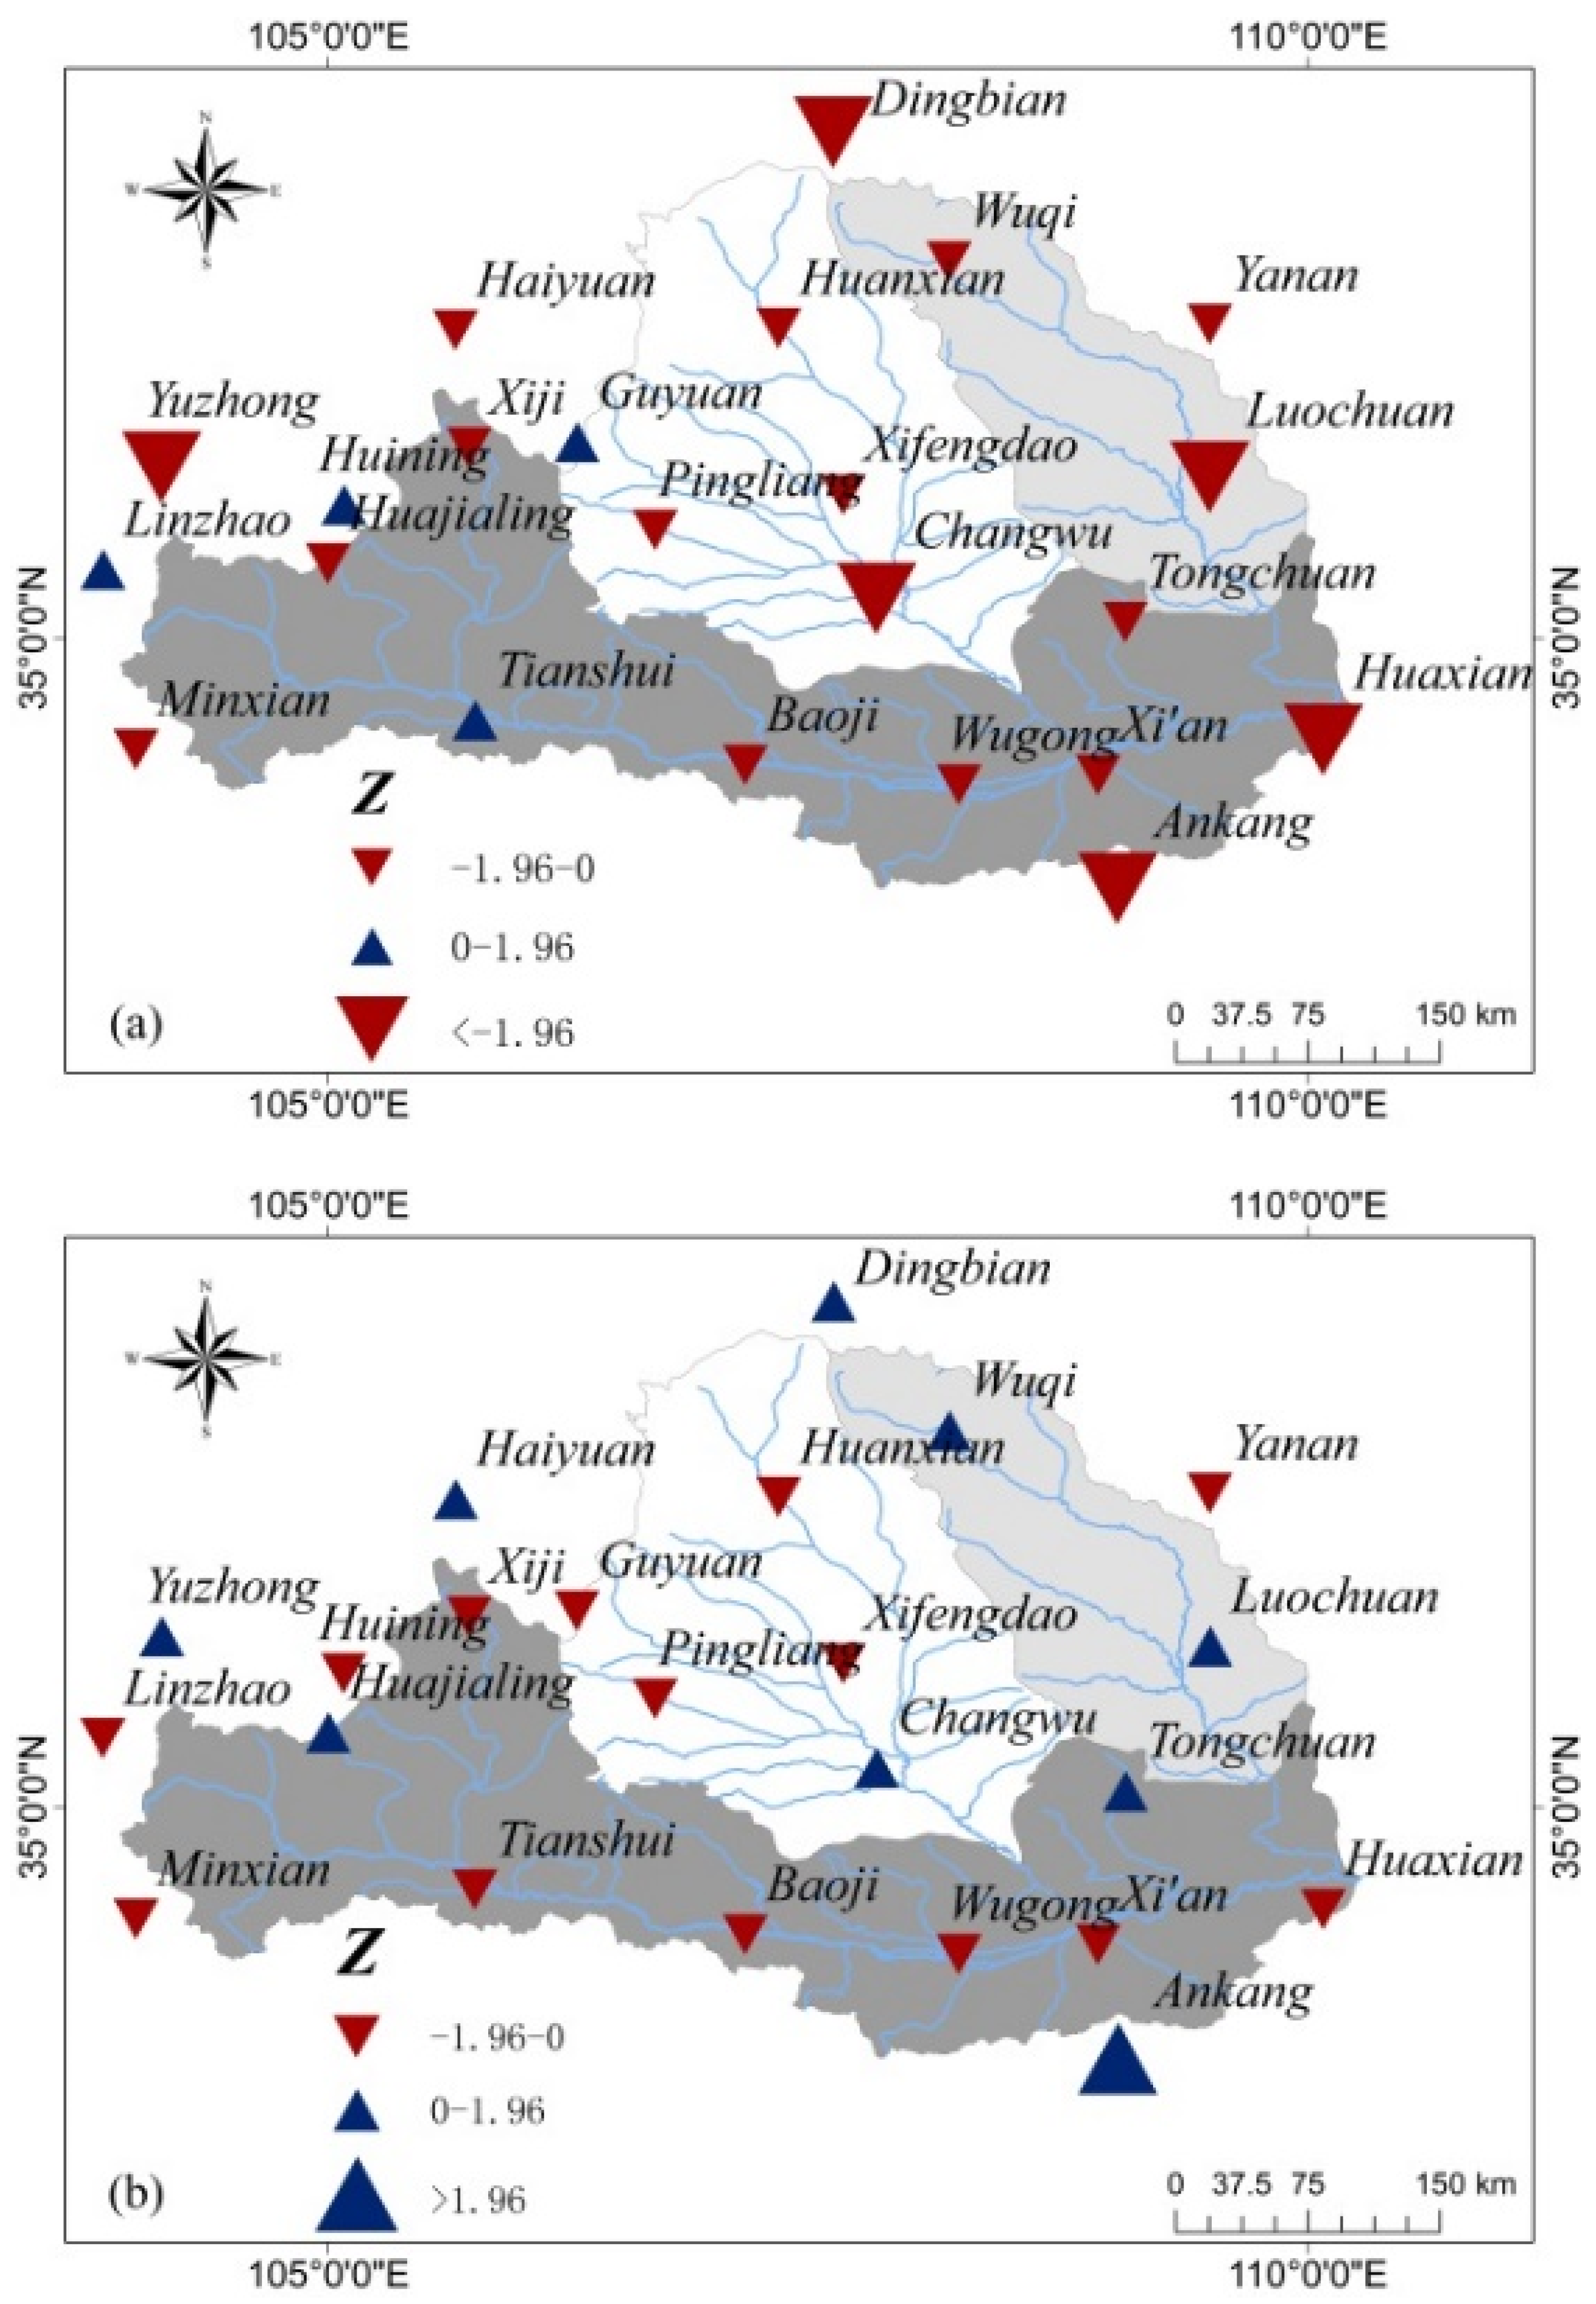
4.3. The Spatial Variation Trend of the Water Deficit

The water balance in the WRB is in a deficit state, with significant variations in water deficit within the basin ranging from −188.6 to −946.117 mm. There is a significant spatial difference within the basin, with the water deficit gradually decreasing from south to north, showing clear zonal characteristics. The water deficit in the mainstream of the Weihe River is relatively low, while the northern parts of the Jing River and Beiluo River Basin exhibited the most significant water deficits (Figure 5).
The trend of water balance in the WRB was analyzed using the Mann–Kendall trend analysis. It was found that the water deficit showed a decreasing trend in the spring. The significant decrease in water deficit may be related to the significant increase in the near-surface wind speed and temperature, as well as the occurrence of spring drought. The trend in water deficit during the summer was not significant, possibly due to the relatively stable long-term P and ET0. In the Beiluo River and downstream of the Jing River, there was a non-significant increase, while the mainstream of the Weihe River and the upper-middle reaches of the Jing River showed a non-significant decrease. The trend in water deficit during autumn was inconsistent. The upstream and downstream of the mainstream of the Weihe River showed a significant increase, while the Beiluo River, Jing River, and middle reaches of the mainstream of the Weihe River showed a non-significant decrease. Overall, the water deficit in autumn showed a decreasing trend, with a significant increase observed in the upstream and downstream of the mainstream of the Weihe River (Figure 6).

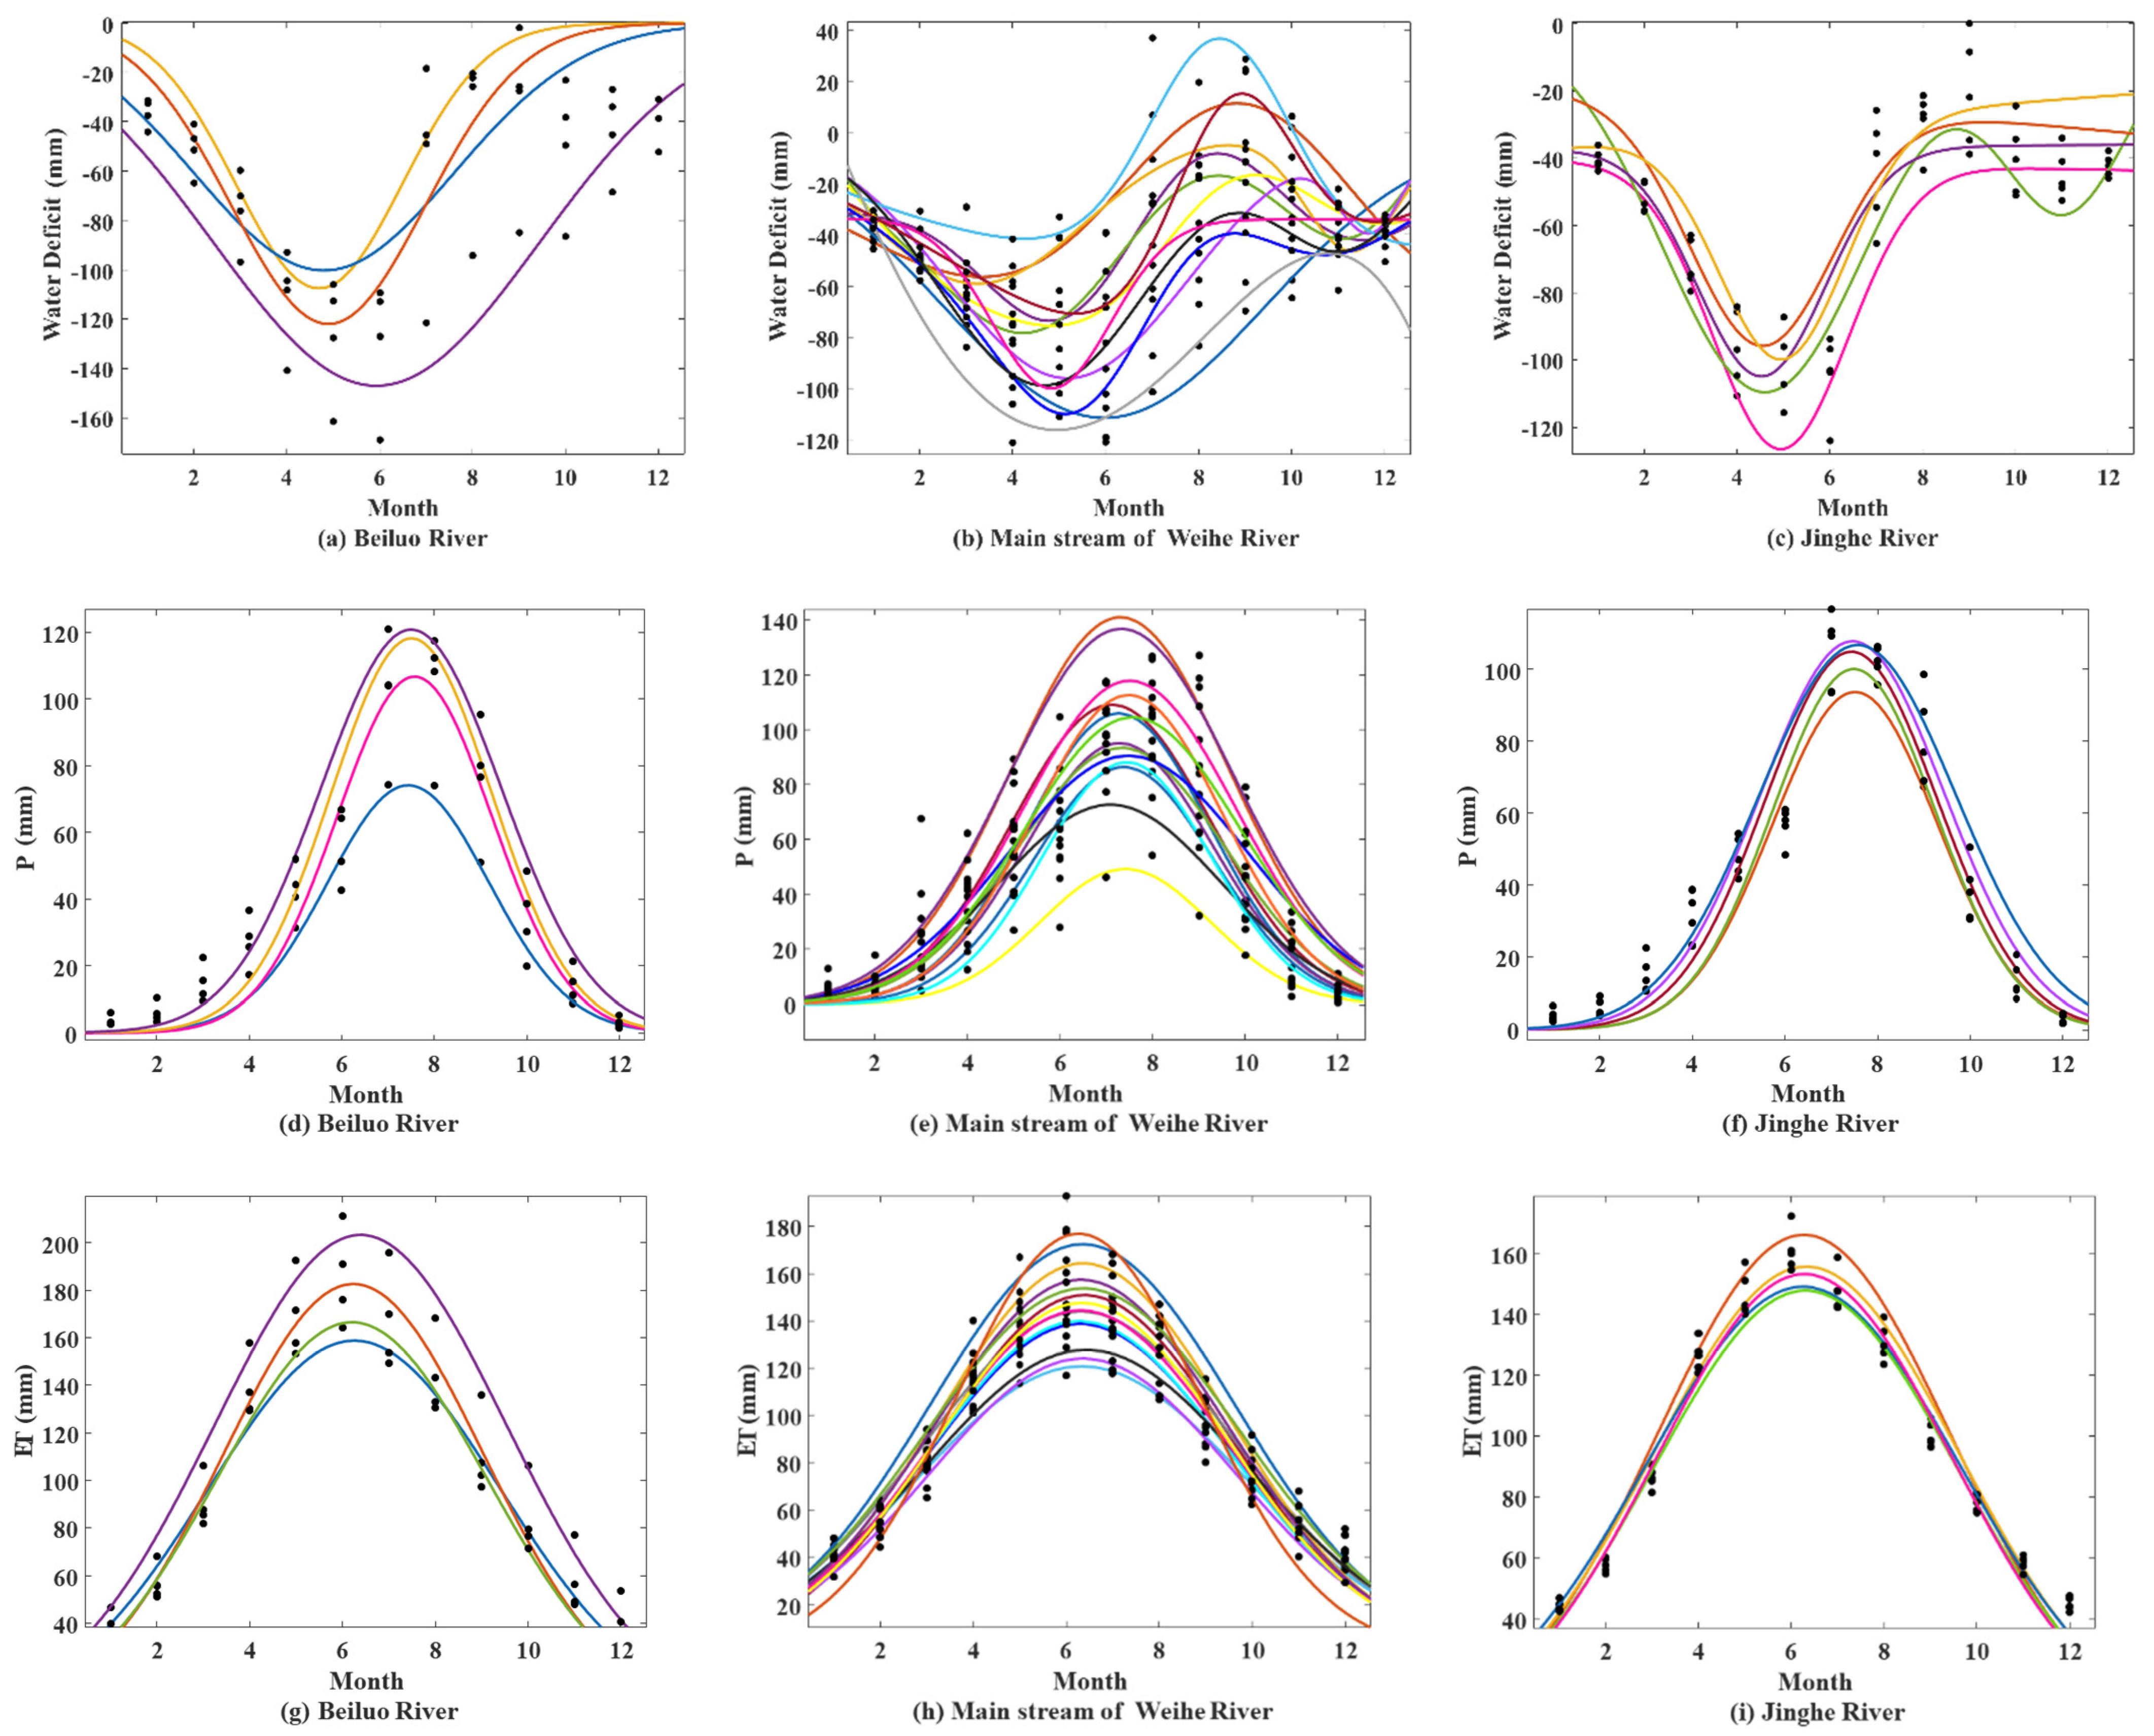
4.4. Annual Variations in Water Deficit, P, and ET0

4.4.1. Extreme Distribution

The distribution of the water deficit in the WRB is uneven throughout the year. The Beiluo River, the mainstream of the Weihe River, and Jing River all reached their maximum water deficit values in June, which are −129.40 mm, −87.24 mm, and −104.20 mm, respectively. The water deficit in each basin is concentrated from March to June, accounting for 55.73%, 53.19%, and 54.34% of the annual water deficit during that period. The distribution of the minimum values throughout the year is inconsistent, with the minimum values generally occurring in July, August, September, or January and December, with probabilities of 86.9% and 13.1%, respectively. The consistency in the distribution of the maximum values and the inconsistency in the distribution of the minimum values result in inconsistency in the shape of the water deficit distribution curve throughout the year (Figure 7a–c). The distribution shapes of the water deficit curves for the Beiluo River and Jing River Basins are relatively consistent, while the variation in the water deficit of the mainstream Wei River is more obvious, resulting in significant differences in the distribution shapes of the curves from upstream to mid- and downstream.
In comparing the annual distribution curves of P and ET0 within the basin, the maximum values of the annual P in the Beiluo River, the mainstream of the Weihe River, and the Jing River all occur in July, with values of 108.71 mm, 100.32 mm, and 104.73 mm, respectively. The minimum values of P in all three basins occur in December, with values of 2.98 mm, 3.83 mm, and 2.90 mm (Figure 7d–f). The maximum values of ET0 also occur in July, with values of 185.71 mm, 151.89 mm, and 161.04 mm for the Beiluo River, the mainstream of the Weihe River, and the Jing River, respectively. The minimum value of ET0 in the Beiluo River occurs in December, with a value of 39.91 mm, while the minimum values in the mainstream of the Weihe River and Jing River occur in January, with values of 40.79 mm and 44.28 mm, respectively (Figure 7g–i). The probability of the minimum value of water deficit occurring in the summer is higher. However, the minimum values of P and ET0 both occur in the winter. This indicates that the increase in ET0 in the summer is greater than the increase in P. The changes in P and ET0 are not significant in the winter, resulting in the minimum values of water deficit generally occurring in the summer.

4.4.2. Distribution Curve Morphology

The annual distribution curve of the water deficit exhibits irregular patterns, with one minimum value and two maximum values or one maximum value and one minimum value. The Beiluo River and Jing River Basins exhibit distribution patterns that resemble a cosine curve, while the mainstream of the Weihe River exhibits a distribution pattern that resembles a negatively skewed sine curve. The overall annual distribution of P and ET0 follows a normal distribution. The skewness coefficient (SC) of the annual P distribution is greater than 0, indicating a positive or symmetrical distribution. The skewness coefficient (SC) of the annual ET0 distribution varies among stations. The skewness coefficients of the Yuzhong, Ankang, Minxian, Linzhao, and Tianshui stations are less than 0, indicating a negative skewness in the annual distribution of ET0. The skewness coefficients of the other stations are greater than 0, indicating a positive skewness. The skewness coefficients of the annual P distribution at each station are greater than the skewness coefficients of the ET0 distribution, indicating that the distribution of the maximum P occurs earlier than the maximum ET0. The kurtosis coefficients of both P and ET0 are less than 0, indicating a distribution below normal (Table 1)

4.5. Factors Affecting Water Deficit

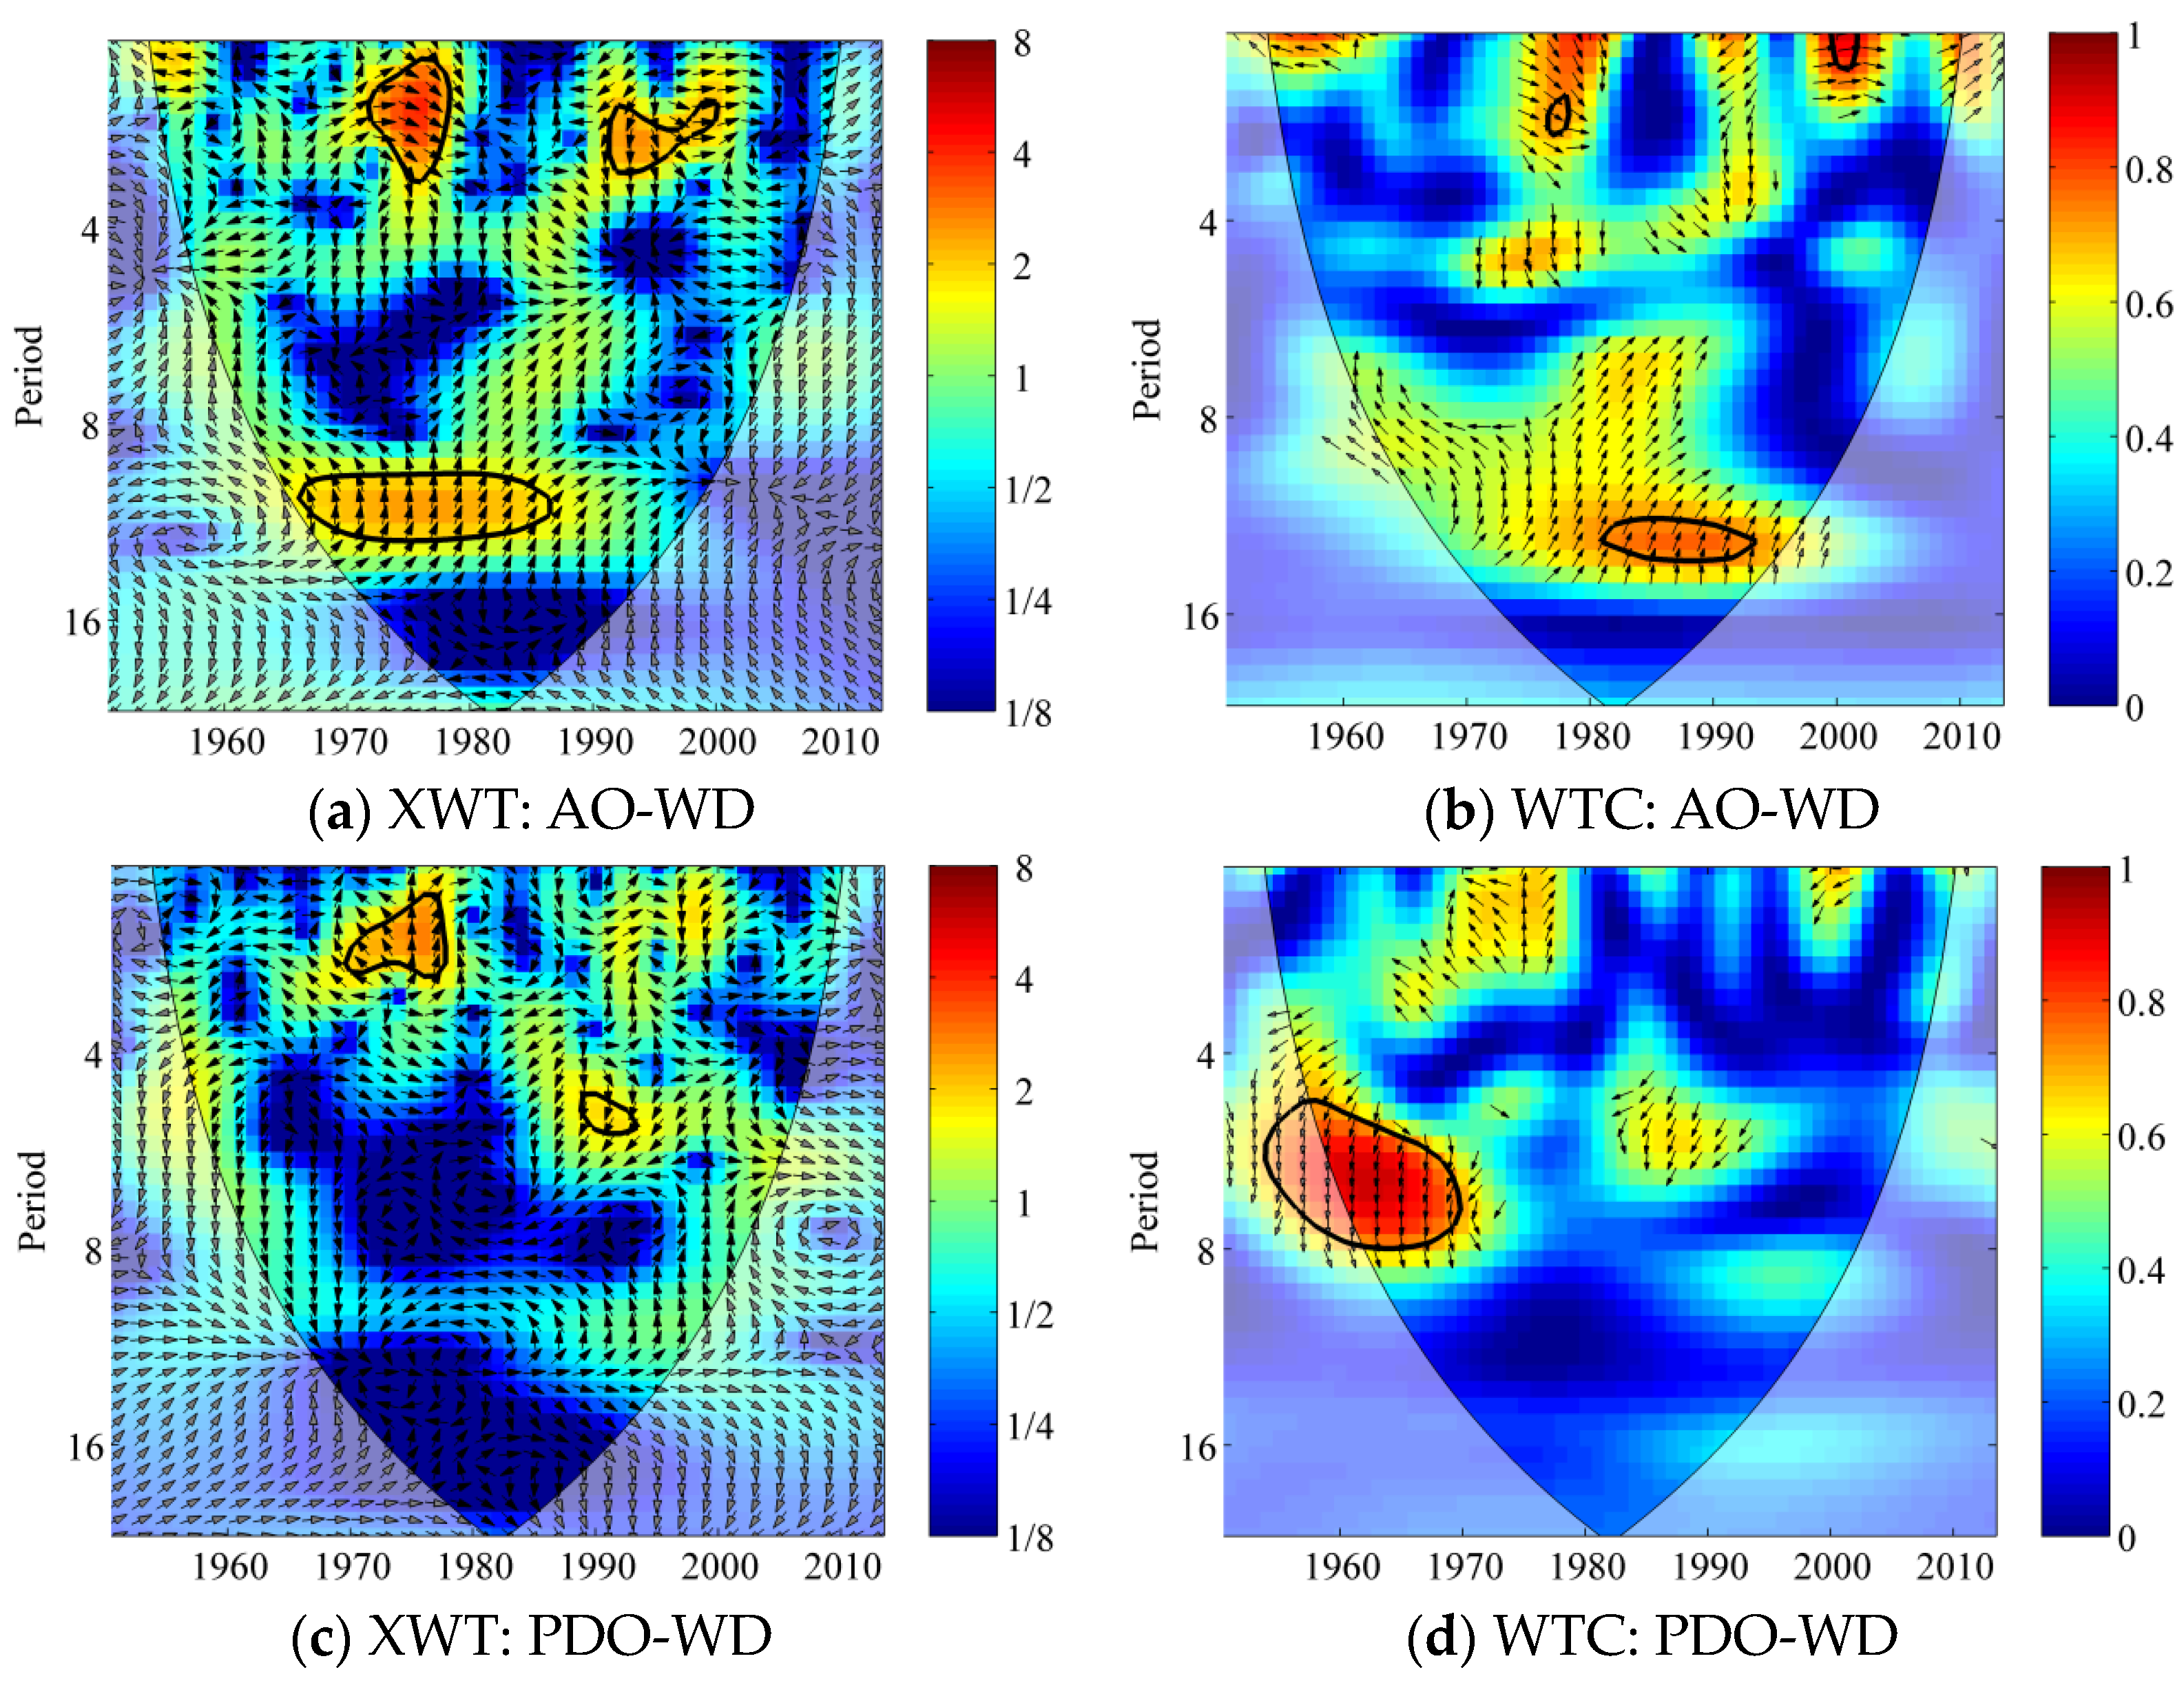
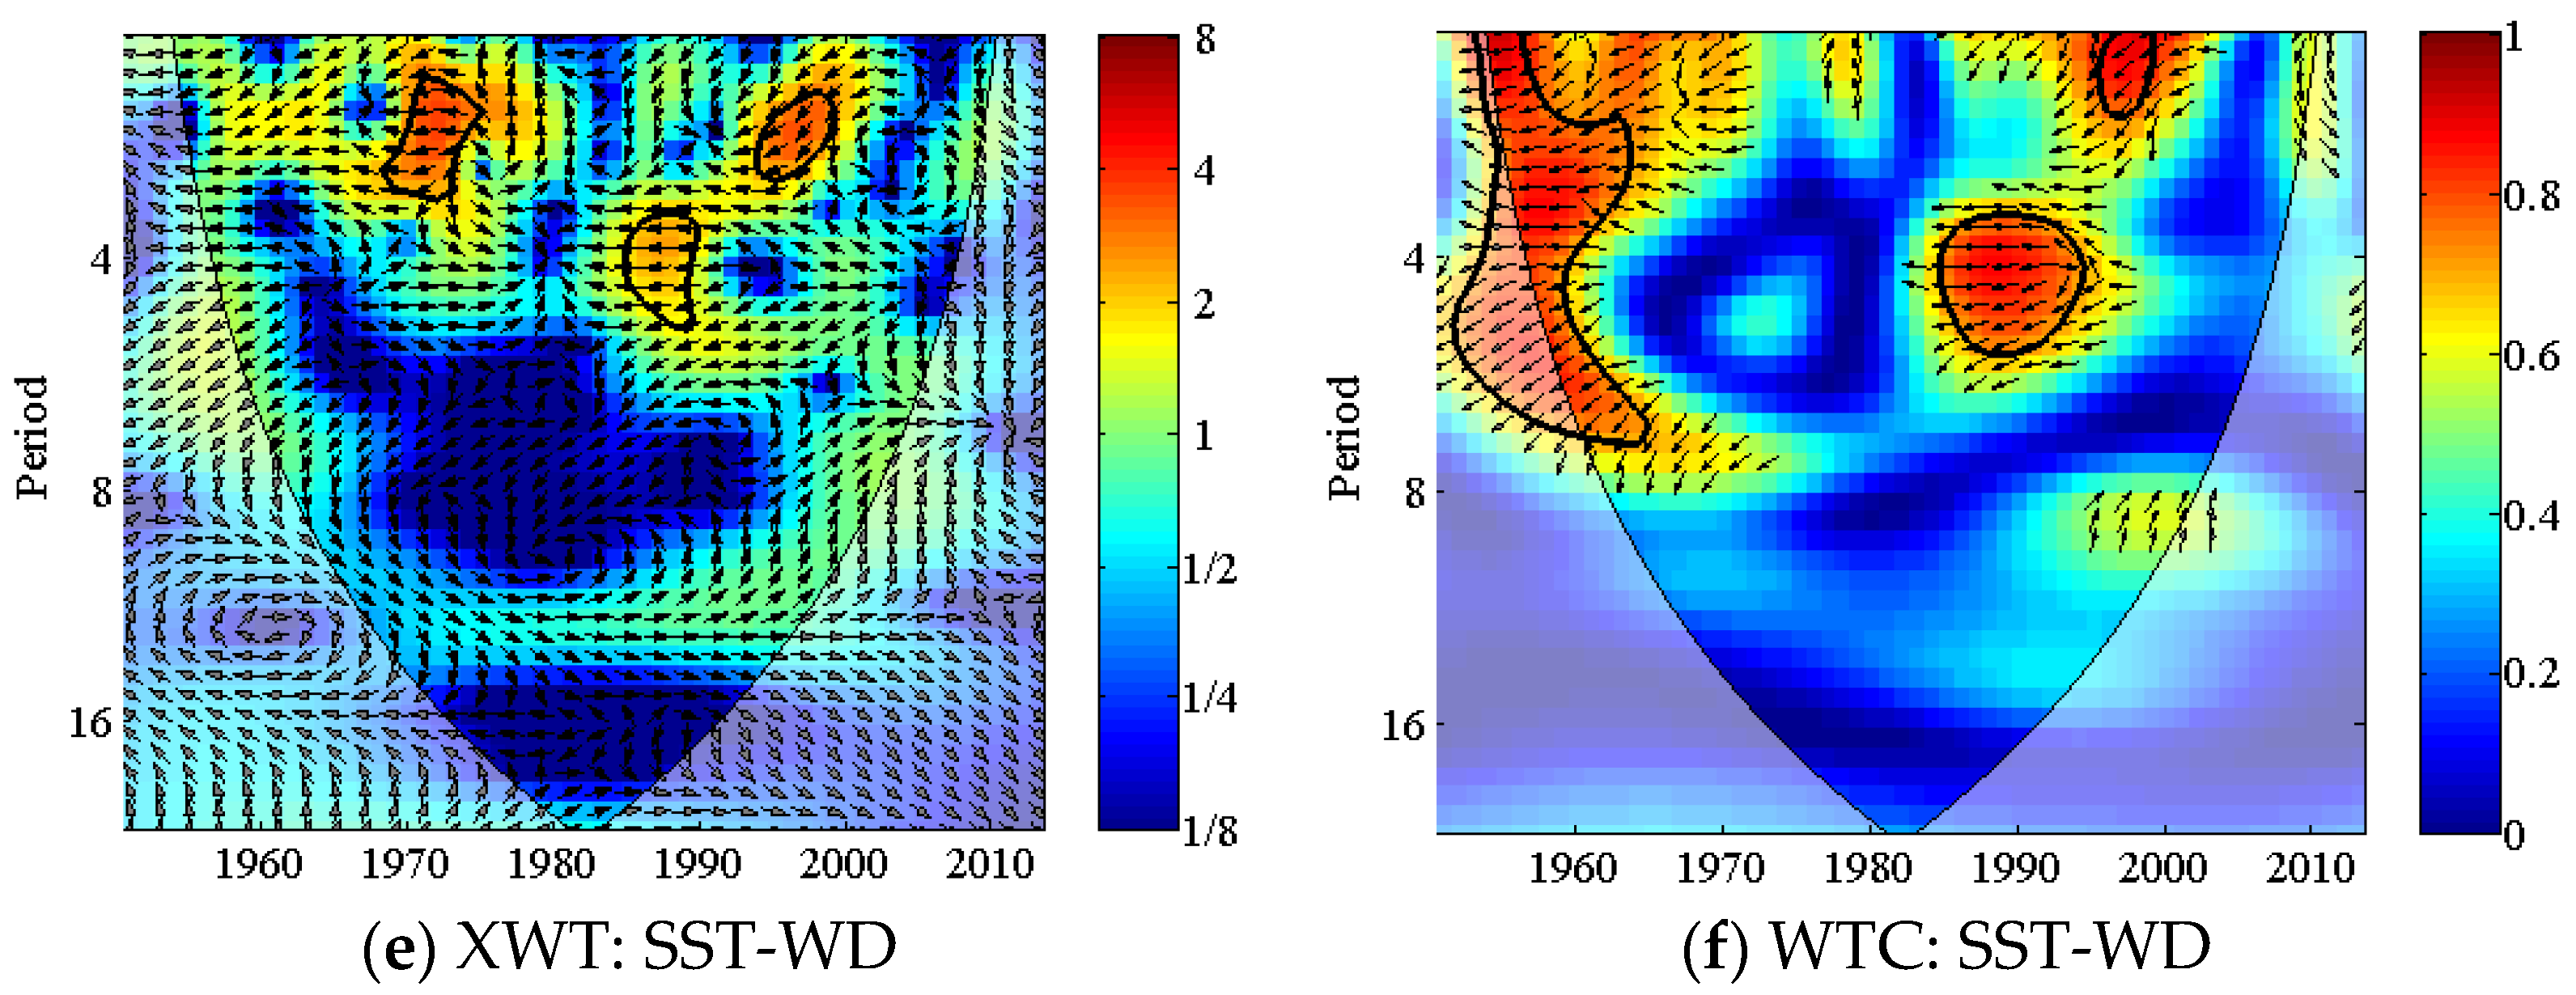
4.5.1. Time Scale of Factors Affecting Water Deficit

The partial correlation analysis at the monthly scale shows that the correlation coefficient (R) between water deficit and P is greater than 0, indicating a positive correlation. The correlation coefficient (R) between water deficit and ET0 is less than 0, indicating a negative correlation. The R2 curve between water deficit and P shows a concave shape, while the R2 curve between water deficit and ET0 shows a convex shape. The overall correlation coefficient curve of P is higher than that of ET0, indicating that P has a greater influence on the water deficit in the WRB (Figure 8). In the headwaters of the WRB, the Beiluo River Basin, and the Jing River Basin, P dominates the water deficit for about 6–8 months of the year, roughly distributed between April and November. At the same time, P dominates the water deficit for 10–12 months in the southern bank of the mainstream of the Weihe River.

4.5.2. Spatial Scale Analysis of Factors Affecting Water Deficit

A spatial correlation analysis was conducted on the water deficit and meteorological factors, revealing a strong correlation between water deficit (WD) and the actual evapotranspiration (AET), ET0, and P, while the correlations with the saturated water vapor pressure (Vap), relative humidity (Wet), and cloud cover (Cld) were weaker (Figure 9). There is a positive correlation between water deficit and AET, with the correlation coefficient gradually decreasing from northwest to southeast. The strongly correlated region accounts for 35% of the total basin area, the moderately correlated region accounts for 63%, and the weakly correlated region accounts only for 2%, mainly located in highly urbanized areas around Xi’an, showing a weak correlation between water deficit and AET. There is a negative correlation between water deficit and ET0, with strong correlation areas accounting for 89%, and the moderately correlation areas accounting for 11%, mainly distributed in the upstream of the Weihe River. There is a positive correlation between water deficit and P, with the strongly correlated region accounting for 73.78%, and the moderately correlated region accounting for 26.22%, mainly distributed in the upstream and highly urbanized areas of the basin. There is a positive correlation between water deficit and saturated water vapor pressure, with the correlation strength gradually strengthening from the upstream to the downstream of the Weihe River. The moderately correlated region accounts for 45.73%, and the weakly correlated region accounts for 54.27%. There is a weak correlation between water deficit and relative humidity in 25.24% of the regions, mainly distributed in the downstream and some upstream areas, while there is no correlation in the remaining regions. There is a negative correlation between water deficit and cloud cover, with 3.10% of the basin showing a moderately correlated relationship and 83.72% of the basin showing a weakly correlated relationship.

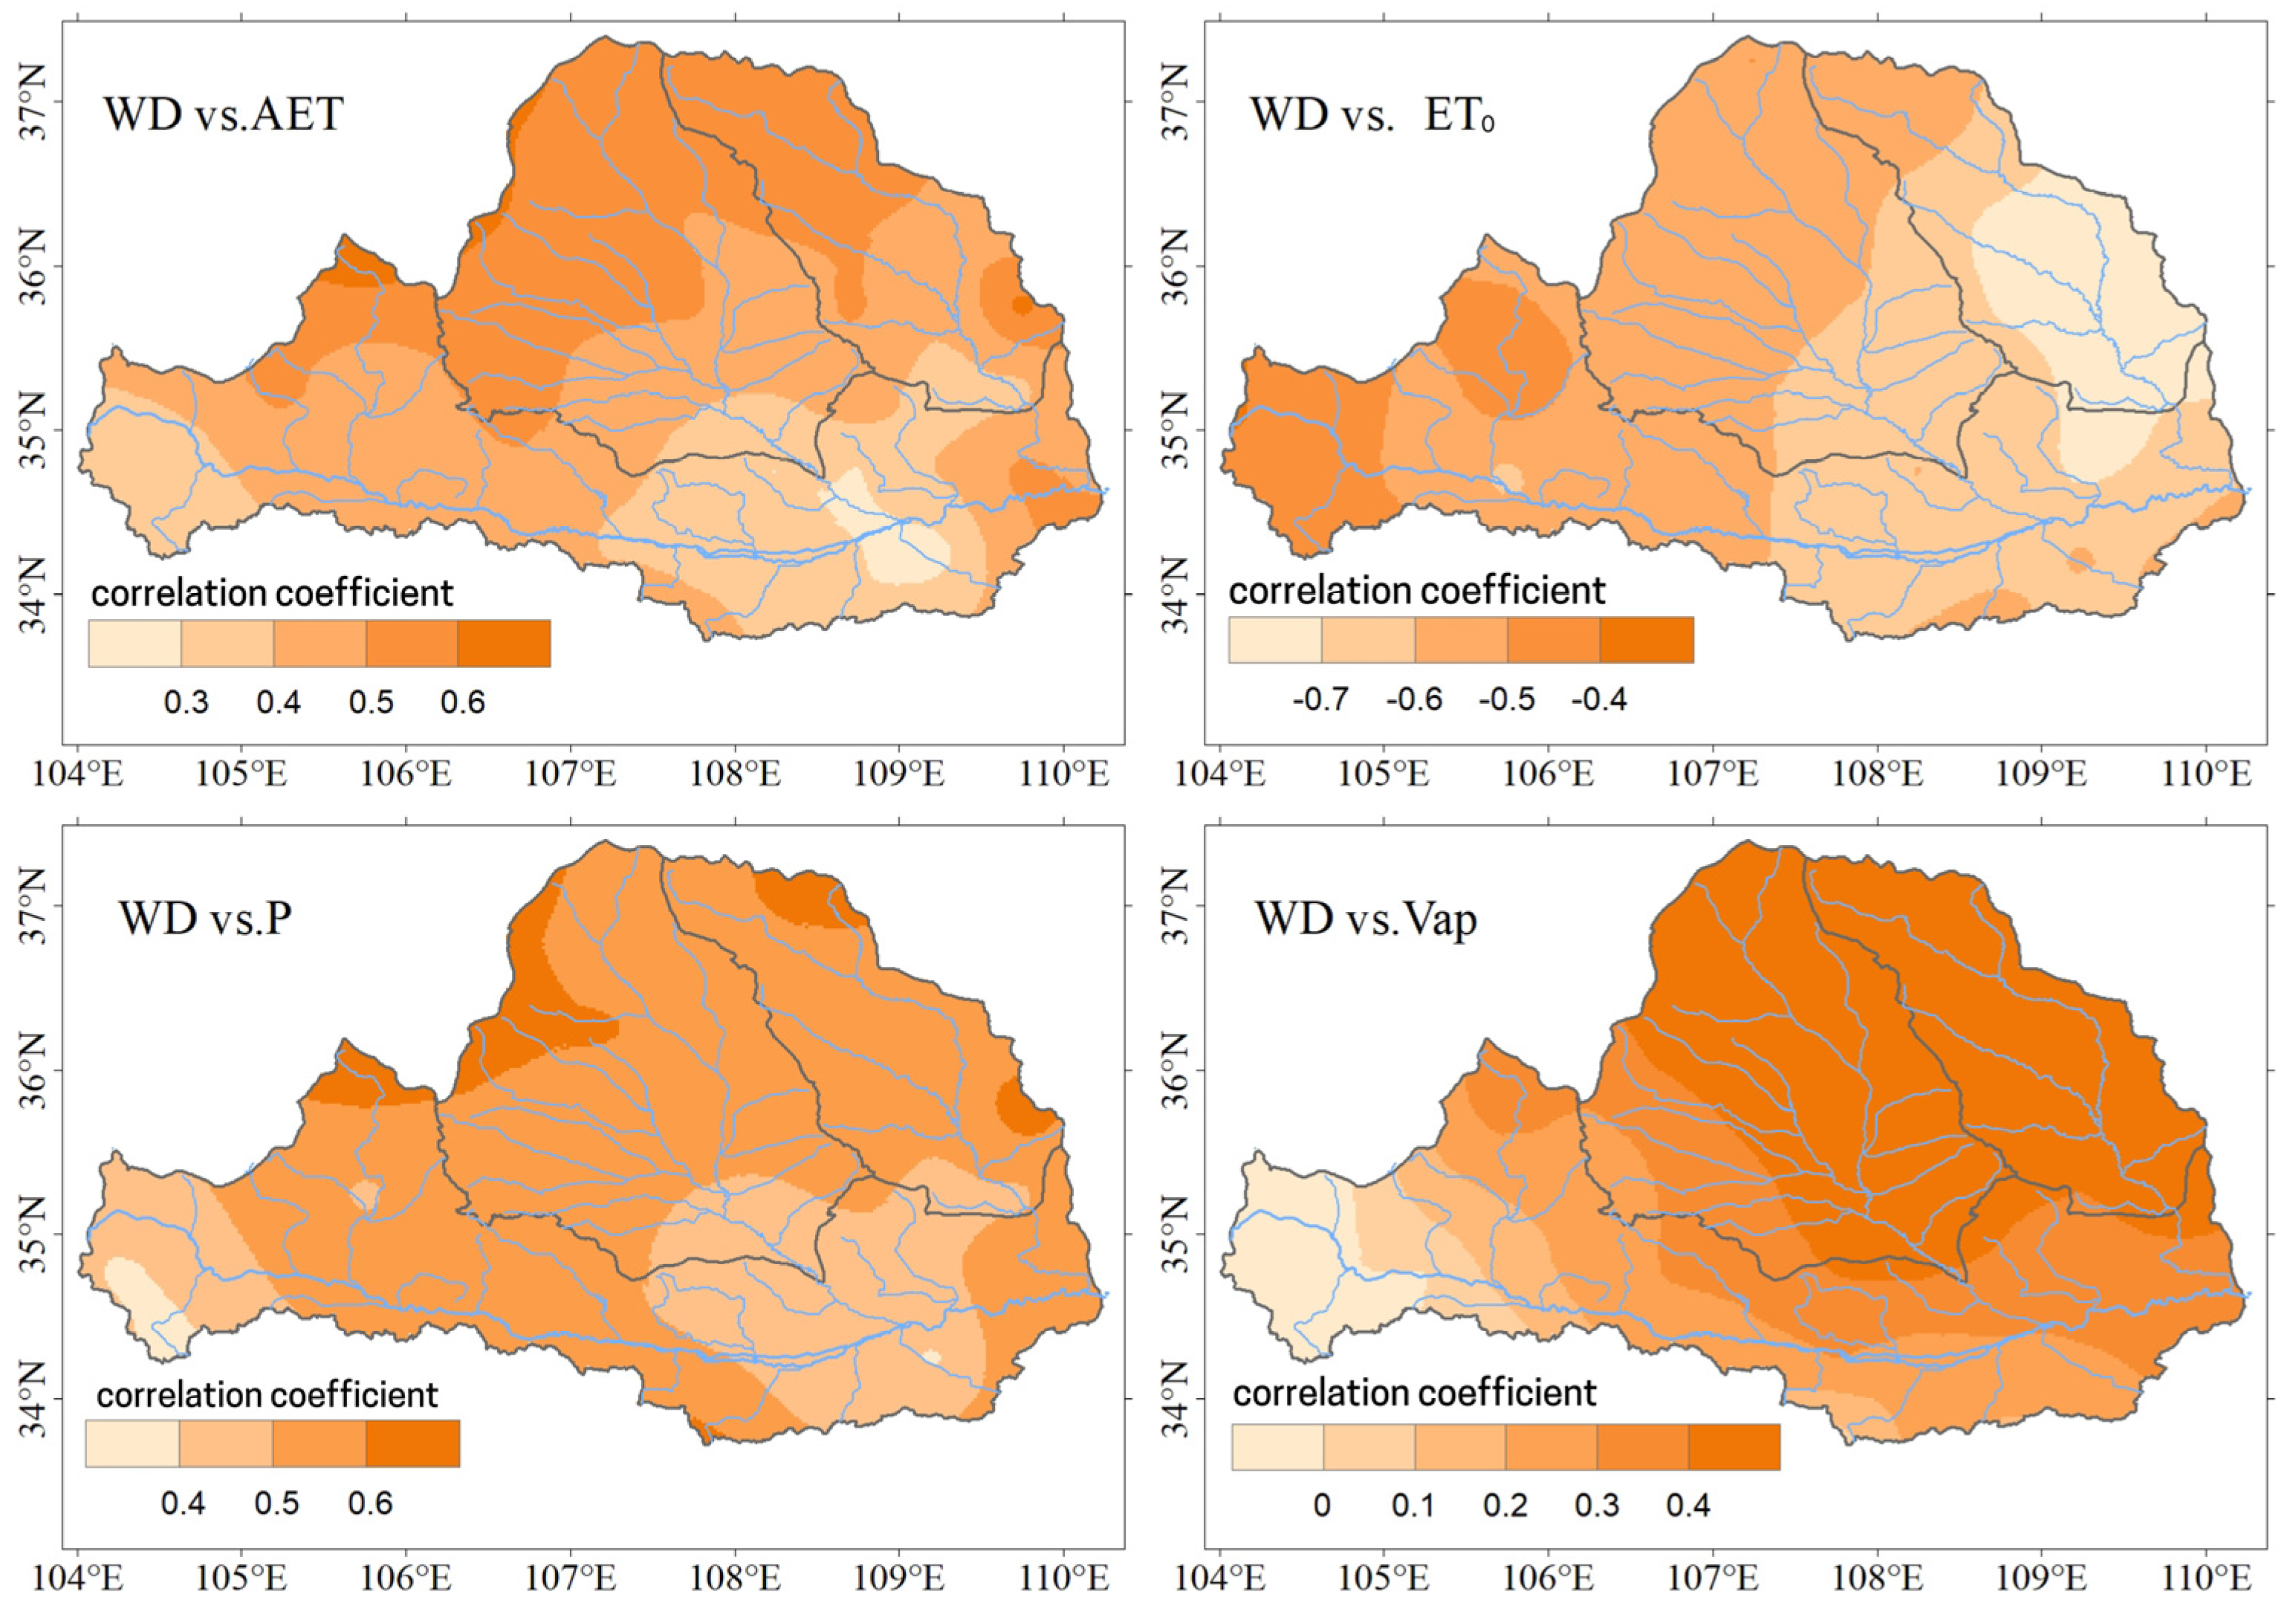
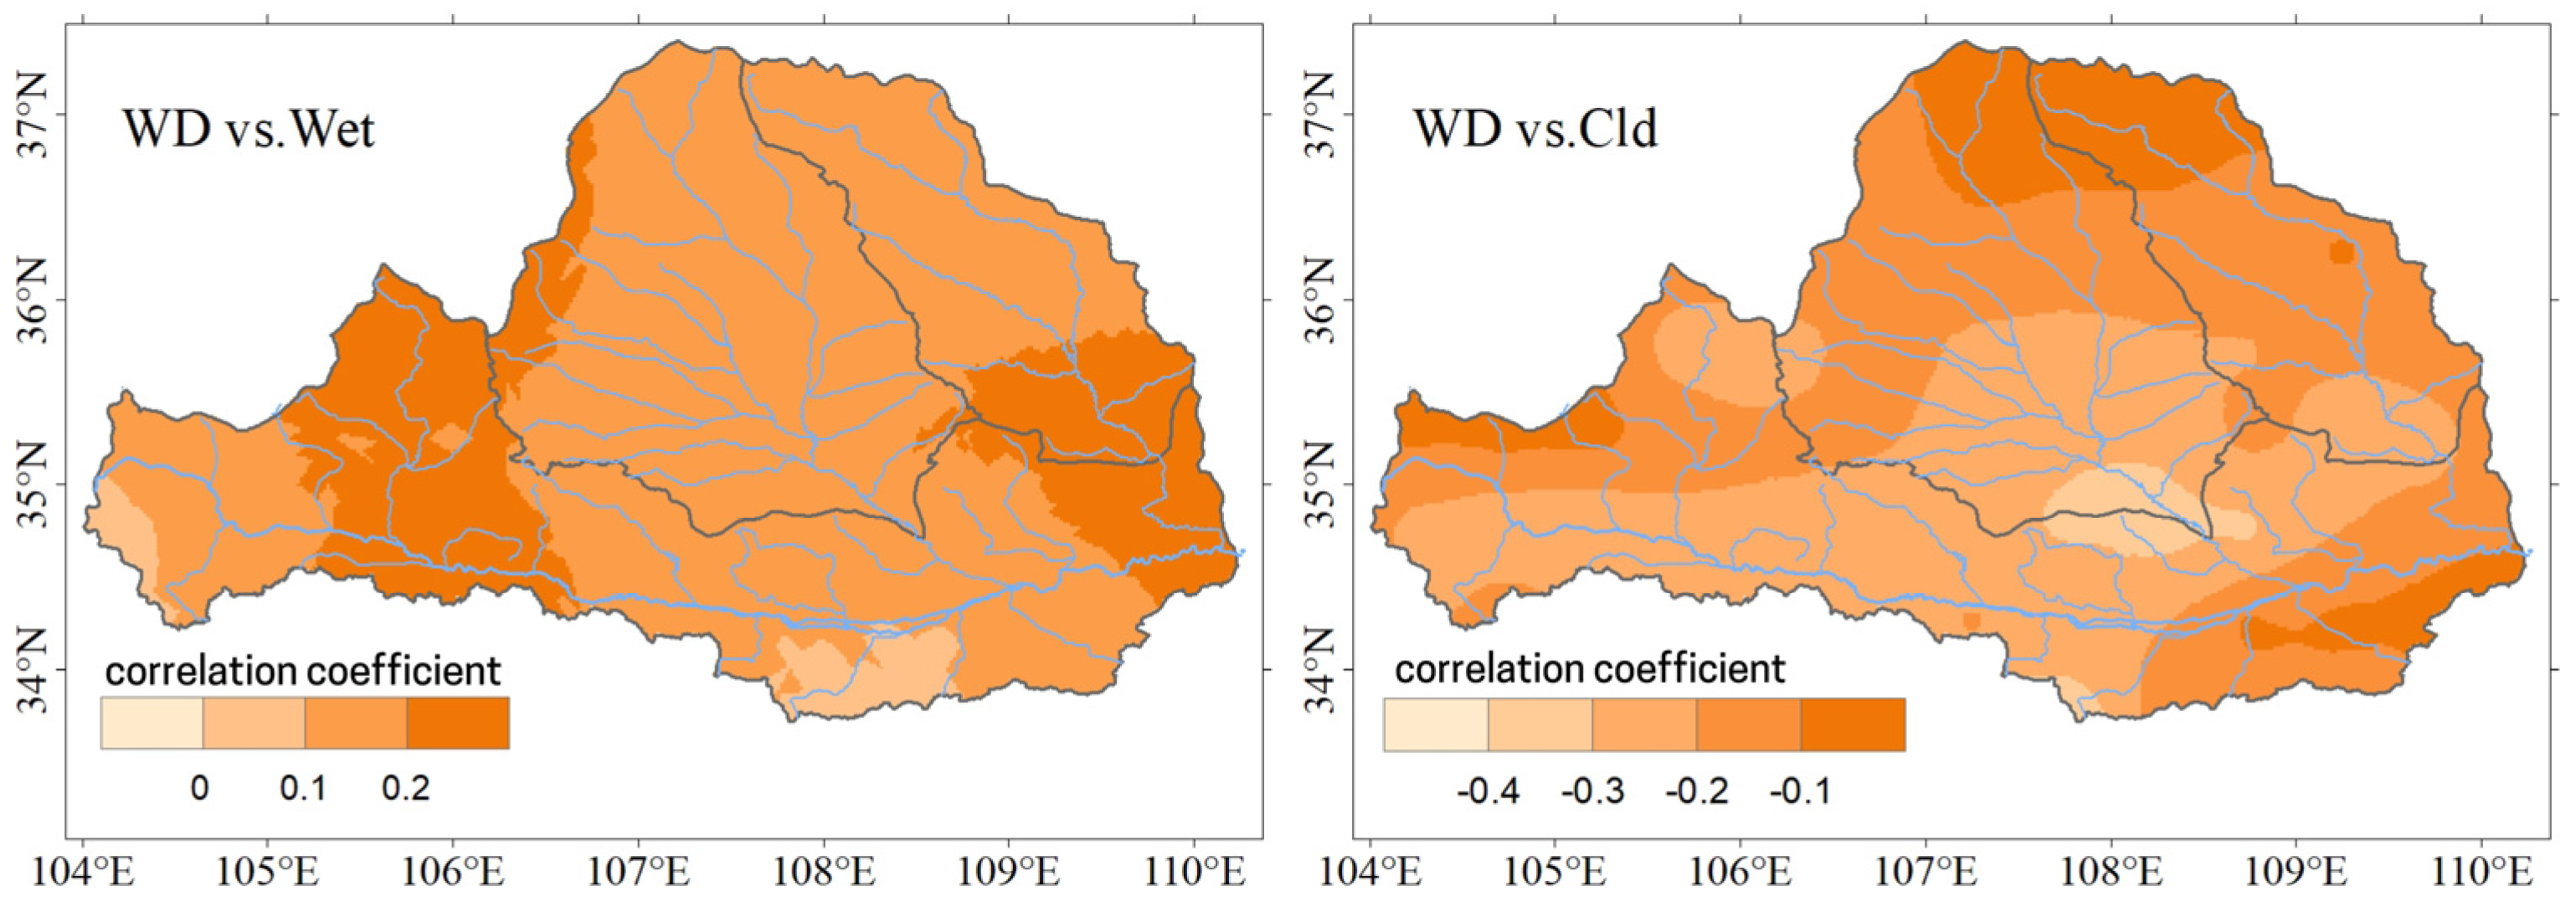
4.6. The Relationship between Water Deficit and Several Climatic Factors

The climate of the Weihe River belongs to a monsoon climate of medium latitudes characterized by high temperatures and rain in the summer while cold and dry in the winter. Continuous wavelet power spectra for the time series of the water deficit during the rainy season (June–September) are shown in Figure 10, which show the relationship between the water deficit and climate indices in the high-energy area of the time–frequency domain.
From Figure 10a,b, it can be observed that the monsoon period water deficit in the WRB exhibits 1–3 year resonance cycles with the AO index during 1972–1978 and 1990–1998. It also shows a 10–12 year resonance cycle from 1967 to 1987. The water deficit is significantly correlated with the AO index, passing the significance tests in 1975–1976 and 1981–1991. In Figure 10c,d, the monsoon period water deficit in the WRB exhibits 1–3 year resonance cycles with the PDO index during 1970–1978 and a 5–6 year resonance cycle during 1989–1992. The water deficit is significantly correlated with the PDO index but does not pass the significance tests. In Figure 10e,f, the monsoon period water deficit in the WRB exhibits 1–3 year resonance cycles with the SST index during 1970–1976 and 1996–2002, as well as a 3–6 year resonance cycle during 1986–1992. The water deficit is significantly correlated with the SST index and passes the significance tests.

5. Discussion

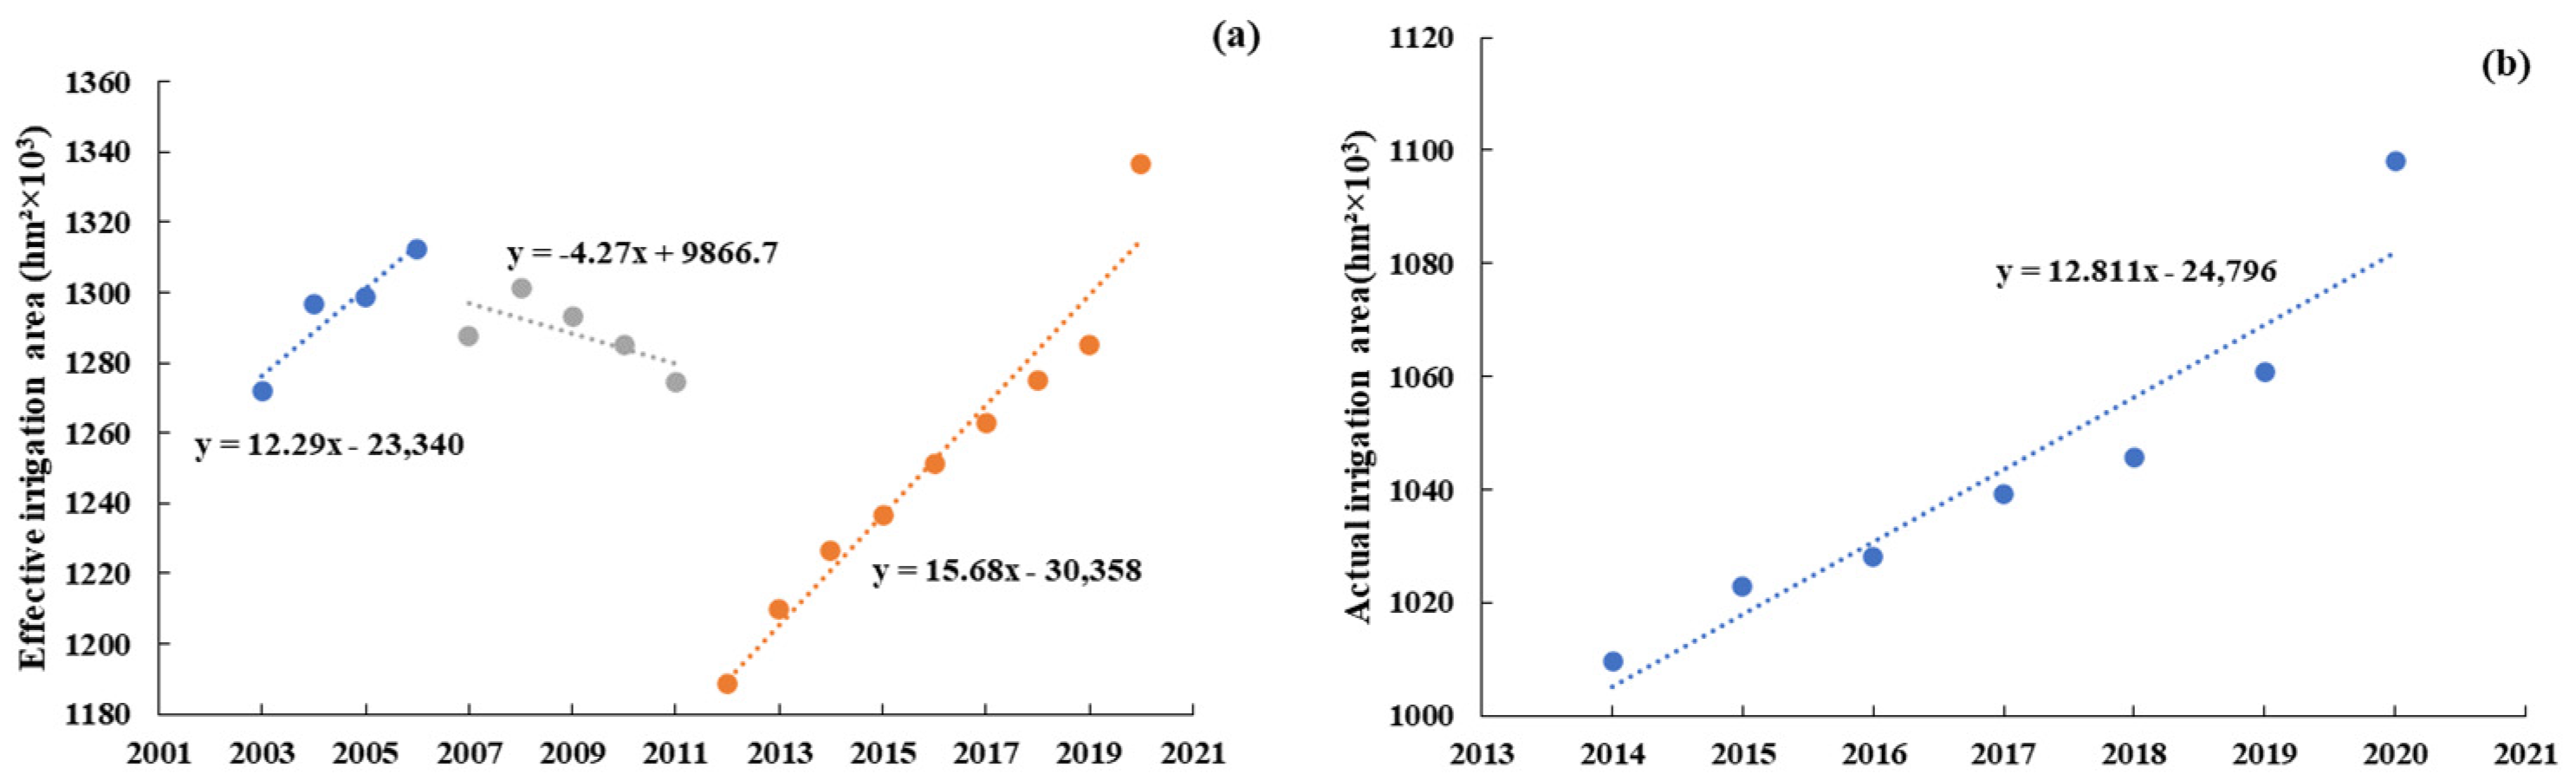
5.1. The Impact of Human Activities

Irrigation is an important human activity that may affect the local and regional climate through the hydrological cycle and surface energy balance [43]. The WRB has a long history of irrigation, and the underlying surface is greatly affected by human activities. Apart from climate-related factors, a significant portion of the factors affecting the water balance in the WRB may come from human activities. The total area of the watershed is 13.5 × 10⁴ km2, with Shaanxi accounting for 49.8%, Gansu accounting for 44.1%, and Ningxia accounting for 6.1%. In the past 20 years, the effective irrigation areas of the three provinces have shown a continuous growth trend, with low precipitation and high requirements for farmland irrigation. On the one hand, the effective irrigation area in Shaanxi Province experienced a significant decline in 2012, but increased again quickly, with a growth rate of 15.68 × 10² km2/decade from 2012 to 2020 (Figure 11a). The effective irrigation area in Gansu Province increased significantly in 2008, with a growth rate of 6.97 × 10² km2/decade from 2008 to 2020 (Figure 12a). The effective irrigation area of Ningxia has been increasing, with a growth rate of 8.36 × 10² km2/decade from 2003 to 2020 (Figure 13a). On the other hand, the actual cultivated land area in the basin is also growing. Among them, the actual cultivated land area in Shaanxi has increased from 10.10 × 10³ km2 to 10.98 × 10³ km2 from 2014 to 2020, and the actual cultivated land areas in Gansu and Ningxia have also increased by 4% and 10% from 2014 to 2020, respectively. The expansion of cultivated land area also shows that the impact of human activities on water resources in the basin has increased.
The effective irrigation area in agriculture refers to the area where water can normally penetrate into the interior of the farmland and be absorbed and utilized by crops, while the irrigation area refers to the area of farmland irrigated by various means of water diversion. Related studies have shown that in the past 10 years, the effective irrigated area in the agricultural fields of the WRB has grown at an annual average rate of 4.29 × 10³ km2, with a growth rate of 0.1% per year. The total basin and individual provinces have also experienced an upward trend in the effective irrigated area of farmland, reaching 5.14 × 10³ km2 [44]. As a common land management practice, irrigation may have an important effect on local and regional climates [45,46,47,48]. The expansion of irrigated areas has significantly altered the water and thermal conditions of the land surface, resulting in a significant increase in water loss due to evaporation and transpiration. On one hand, the increase in irrigated areas leads to a significant decrease in sensible heat flux, causing local cooling and generating a cooling effect [49]. On the other hand, the increase in irrigated areas triggers an increase in latent heat flux, further increasing evapotranspiration and consequently increasing the concentration of atmospheric water vapor. As hypothesized in the theory by Bouchet, irrigation reduces the ET0 while increasing actual evaporation. The reason is that the increase in irrigation area will change the evaporation mode of the region from water limitation to energy limitation, thus affecting the amount of water resources. The dramatic increase in actual evaporation caused by irrigation may cause an increase in soil moisture, which has a significant impact on the water deficit. Irrigation water comes from surface runoff, which means that water needs to be transferred from other places to meet the needs of irrigation water. Therefore, evapotranspiration is further strengthened. In our study, the water surplus occurs only in the rainy season (July–September) in the middle reaches of the Weihe River. The precipitation minus evapotranspiration in the upper and lower reaches of the Weihe River is negative, showing a water deficit. A large amount of irrigation water and other human activities have increased the water deficit in the Weihe River Basin.
The increase in water consumption in the national economy is also one of the reasons for the long-term water deficit. In the WRB, industrial and domestic water consumption have experienced very large increases, and groundwater extraction has grown rapidly. The growth in water consumption is mainly reflected in the significant increase in groundwater extraction, which has impacted surface runoff and become one of the main causes of reduced surface runoff. Additionally, soil and water conservation projects such as afforestation initiatives in the WRB since the 1990s have also contributed to the decrease in runoff.

5.2. Impact of Climate Factors

Numerous studies have consistently shown that irrigation can change the surface energy distribution by reducing the sensible heat flux and land surface temperature, and increasing the latent heat flux, thus reducing the surface temperature and day–night temperature range [49,50,51,52,53,54].
In the WRB, the runoff volume decreased by 53.83% during these two periods. The linear trend rates for the years 1959–1990 and 1990–2006 were −18.87 m3/s·10a and −26.59 m3/s·10a, respectively (Figure 14). The average P above Linjia Village was 67.93 m3/s from 1959 to 1990 and 31.36 m3/s from 1990 to 2006 (Figure 15). The change in P led to a reduction of 822 million m3 in actual water supply at Linjia Village, accounting for 52% of the total reduction in the 1990s, which amounted to 1.573 billion m3. In the WRB, the average P from 1951 to 1990 and from 1990 to 2013 was 541 mm and 493 mm, respectively. P decreased by 8.32% during these two periods. This change in P resulted in a decrease in water inflow into the Yellow River by 2.037 billion m3, which accounted for 49% of the total reduction in the 1990s, amounting to 4.178 billion m3. The average ET0 in the WRB from 1951 to 1990 and from 1990 to 2013 was 1241.61 mm and 1388.16 mm, respectively (Figure 16). The ET0 increased by 11.8% during these two periods. With a 53.83% decrease in runoff, 8.32% decrease in P, and 11.8% increase in ET0, it can be concluded that one of the important reasons for the continuous development of water deficit is that the decrease in P is slower than the increase in ET0. This is consistent with the conclusions of many studies on the water balance in irrigation areas [52,55].
Some simulation and observational studies also show that irrigation will reduce runoff, increase ET0, and reduce sensible heat flux, thus cooling the surface [56]. The change in the surface state and flux caused by irrigation may have a profound impact on the regional climate by changing the evolution of the planetary boundary layer and cloud formation in the irrigation area, and may change the regional atmospheric circulation [57,58].
Through the above analysis, we have found that in addition to precipitation and evapotranspiration, the influencing factors of water balance should also include some direct meteorological factors, such as temperature, wind speed, humidity, etc., as well as some macroclimate factors, such as SST, AO, PDO, etc., as well as indirect influencing factors, such as human activities, which can be reflected in underlying surface cover, irrigation, urbanization rate, etc.

6. Conclusions

This study explored the spatial and temporal changes in the water deficit of the WRB. The potential evapotranspiration is far greater than the precipitation, which leads to almost all of the WRB to be water deficient. This paper focuses on the analysis of meteorological factors and climatic factors that led to the water deficit in the WRB and further discusses the impact of human activities, such as the continuous expansion of irrigation areas, on the water deficit in the WRB. The main results are given below:
(1) The overall trend of the water deficit in the WRB is increasing. The average annual water deficit in the entire WRB is −656.19 mm, with a decreasing trend rate of −20.04 mm/decade. The amount of water deficit is influenced concurrently by P and ET0. The decreasing trend rate of P in the WRB is −10.15 mm/decade, while the increasing trend rate of ET0 is 16.97 mm/decade.
(2) The water deficit in the WRB ranges from −188.6 to −946.117 mm, showing significant spatial variations within the basin. The water deficit gradually decreases from south to north, exhibiting distinct zonal characteristics. The maximum water deficit occurred in 1964, while the minimum occurred in 1997. The intra-annual distribution curve of the water deficit follows a reverse normal distribution or shows both a peak and a trough. The water deficit reaches its peak in June, and the minimum value may occur in the summer or winter.
(3) The water deficit exhibits strong correlations with the actual evapotranspiration, ET0, and P, while its correlations with saturated vapor pressure, relative humidity, and cloud cover are weak. The correlation coefficient curve for P is generally higher than that for ET0, indicating that P has a greater impact on the water deficit in the WRB.
(4) During the monsoon period, the water deficit in the WRB showed resonance cycles of 1 to 3 years with the AO index in 1975–1976 and 1981–1991, passing the significance test. There is no significant correlation between the water deficit and the PDO index. Regarding the SST index, the water deficit exhibited resonance cycles of 1 to 3 years in 1970–1976 and 1996–2002, as well as a resonance cycle of 3 to 6 years in 1986–1992, all passing the significance test. In this study, we found that the huge difference between P and ET0 in the WRB leads to an obvious water deficit, which is not only related to climatic factors, but also closely related to human activities. On the one hand, P is the main influencing factor of the water deficit in the WRB. It is suggested to improve the ecological environment of the basin, protect the river wetland, create a sponge city, and ensure the normal water cycle process of the basin. On the other hand, the increasing irrigation area has a significant impact on water shortage. The WRB is the largest tributary of the Yellow River. It is recommended to gradually change irrigation methods to achieve the protection and efficient use of water resources, so as to achieve the high-quality development of the WRB and the Yellow River Basin. However, the urbanization rate in the WRB, especially in the Guanzhong Plain area, is constantly increasing, the demand for domestic and production water is increasing, and the expansion of hardened road surfaces is also having a significant impact on the water deficit in the basin. These are the influencing factors that need to be further considered in subsequent research.

Funding

This research was funded by the National Natural Science Foundation of China (Grant No.41901110).

Institutional Review Board Statement

Not applicable.

Informed Consent Statement

Not applicable.

Data Availability Statement

The data acquisition method has been explained in the article.

Conflicts of Interest

The authors declare no conflict of interest.

References

  1. Dai, A. Increasing drought under global warming in observations and models. Nat. Clim. Chang. 2012, 3, 52–58. [Google Scholar] [CrossRef]
  2. Wood, E.F.; Sheffield, J. Global Trends and Variability in Soil Moisture and Drought Characteristics, 1950–2000, from Observation-Driven Simulations of the Terrestrial Hydrologic Cycle. J. Clim. 2008, 21, 432–458. [Google Scholar]
  3. Dai, A. Drought under global warming: A review. WIREs Clim. Chang. 2010, 2, 45–65. [Google Scholar] [CrossRef]
  4. Anderegg, W.R.L.; Kane, J.M.; Anderegg, L.D.L. Consequences of widespread tree mortality triggered by drought and temperature stress. Nat. Clim. Chang. 2012, 3, 30–36. [Google Scholar] [CrossRef]
  5. Reichstein, M.; Bahn, M.; Ciais, P.; Frank, D.; Mahecha, M.D.; Seneviratne, S.I.; Zscheischler, J.; Beer, C.; Buchmann, N.; Frank, D.C.; et al. Climate extremes and the carbon cycle. Nature 2013, 500, 287–295. [Google Scholar] [CrossRef] [PubMed]
  6. Anderegg, W.R.L.; Flint, A.; Huang, C.-y.; Flint, L.; Berry, J.A.; Davis, F.W.; Sperry, J.S.; Field, C.B. Tree mortality predicted from drought-induced vascular damage. Nat. Geosci. 2015, 8, 367–371. [Google Scholar] [CrossRef]
  7. Choat, B.; Jansen, S.; Brodribb, T.J.; Cochard, H.; Delzon, S.; Bhaskar, R.; Bucci, S.J.; Feild, T.S.; Gleason, S.M.; Hacke, U.G.; et al. Global convergence in the vulnerability of forests to drought. Nature 2012, 491, 752–755. [Google Scholar] [CrossRef]
  8. Seneviratne, S.I.; Corti, T.; Davin, E.L.; Hirschi, M.; Jaeger, E.B.; Lehner, I.; Orlowsky, B.; Teuling, A.J. Investigating soil moisture–climate interactions in a changing climate: A review. Earth-Sci. Rev. 2010, 99, 125–161. [Google Scholar] [CrossRef]
  9. Short Gianotti, D.J.; Rigden, A.J.; Salvucci, G.D.; Entekhabi, D. Satellite and Station Observations Demonstrate Water Availability’s Effect on Continental-Scale Evaporative and Photosynthetic Land Surface Dynamics. Water Resour. Res. 2019, 55, 540–554. [Google Scholar] [CrossRef]
  10. McCarthy, M.G. Developmental variation in sensitivity of Vitis vinifera L. (Shiraz) berries to soil water deficit. Aust. J. Grape Wine Res. 2000, 6, 136–140. [Google Scholar] [CrossRef]
  11. Lauerwald, R.; Guilpart, N.; Ciais, P.; Makowski, D. Impact of a large-scale replacement of maize by soybean on water deficit in Europe. Agric. For. Meteorol. 2023, 343, 109781. [Google Scholar] [CrossRef]
  12. Shirinpour, M.; Atazadeh, E.; Bybordi, A.; Monirifar, H.; Amini, A.; Hossain, M.A.; Aharizad, S.; Asghari, A. Gene action and inheritance of grain yield and root morphological traits in hybrid maize grown under water deficit conditions. S. Afr. J. Bot. 2023, 161, 180–191. [Google Scholar] [CrossRef]
  13. Jin, N.; Shi, Y.; Niu, W.; He, L. Spatial and temporal patterns of agricultural drought in China during 1960–2020 characterized by use of the crop water deficit Abnormal Index. J. Hydrol. 2023, 627, 130454. [Google Scholar] [CrossRef]
  14. Pei, W.; Fu, Q.; Ren, Y.; Li, T. Study on the agricultural crop drought index based on weights of growth stages. Hydrol. Process. 2022, 36, e14590. [Google Scholar] [CrossRef]
  15. Wu, M.; Liu, P.; Lei, X.; Liao, W.; Cai, S.; Xia, Q.; Zou, K.; Wang, H. Impact of surface and underground water uses on streamflow in the upper-middle of the Weihe River basin using a modified WetSpa model. J. Hydrol. 2023, 616, 128840. [Google Scholar] [CrossRef]
  16. Wei, S.; Zhao, J.; Tong, X. Impacts of socio-economic status and environmental attitudes of locals on E-flow allocation in Weihe River Basin, China. HydroResearch 2020, 3, 158–165. [Google Scholar] [CrossRef]
  17. Zhang, T.; Su, X.; Zhang, G.; Wu, H.; Wang, G.; Chu, J. Evaluation of the impacts of human activities on propagation from meteorological drought to hydrological drought in the Weihe River Basin, China. Sci. Total Environ. 2022, 819, 153030. [Google Scholar] [CrossRef]
  18. Ding, B.; Zhang, J.; Zheng, P.; Yu, X.; Li, Z.; Wang, Y.; Jia, G. Water security assessment for effective water resource management based on multi-temporal blue and green water footprints. J. Hydrol. 2024, 632, 130761. [Google Scholar] [CrossRef]
  19. Li, Y.; Huang, Y.; Fan, J.; Zhang, H.; Li, Y.; Wang, X.; Deng, Q. Meteorological and Hydrological Drought Risks under Future Climate and Land-Use-Change Scenarios in the Yellow River Basin. Atmosphere 2023, 14, 1599. [Google Scholar] [CrossRef]
  20. Fan, J.; Wei, S.; Liu, G.; Zhou, X.; Li, Y.; Wu, C.; Xu, F. Response Time of Vegetation to Drought in Weihe River Basin, China. Atmosphere 2023, 14, 938. [Google Scholar] [CrossRef]
  21. Teuling, A.J.; Van Loon, A.F.; Seneviratne, S.I.; Lehner, I.; Aubinet, M.; Heinesch, B.; Bernhofer, C.; Grünwald, T.; Prasse, H.; Spank, U. Evapotranspiration amplifies European summer drought. Geophys. Res. Lett. 2013, 40, 2071–2075. [Google Scholar] [CrossRef]
  22. Huang, F.; Liu, L.; Gao, J.; Yin, Z.; Zhang, Y.; Jiang, Y.; Zuo, L.; Fang, W. Effects of extreme drought events on vegetation activity from the perspectives of meteorological and soil droughts in southwestern China. Sci. Total Environ. 2023, 903, 166562. [Google Scholar] [CrossRef]
  23. De Boeck, H.J.; Verbeeck, H. Drought-associated changes in climate and their relevance for ecosystem experiments and models. Biogeosciences 2011, 8, 1121–1130. [Google Scholar] [CrossRef]
  24. Zhao, M.; Geruo, A.; Liu, Y.; Konings, A.G. Evapotranspiration frequently increases during droughts. Nat. Clim. Chang. 2022, 12, 1024–1030. [Google Scholar] [CrossRef]
  25. Zia, R.; Nawaz, M.S.; Siddique, M.J.; Hakim, S.; Imran, A. Plant survival under drought stress: Implications, adaptive responses, and integrated rhizosphere management strategy for stress mitigation. Microbiol. Res. 2021, 242, 126626. [Google Scholar] [CrossRef] [PubMed]
  26. Wang, F.; Lai, H.; Li, Y.; Feng, K.; Tian, Q.; Guo, W.; Zhang, W.; Di, D.; Yang, H. Dynamic variations of terrestrial ecological drought and propagation analysis with meteorological drought across the mainland China. Sci. Total Environ. 2023, 896, 165314. [Google Scholar] [CrossRef]
  27. Mondol, M.A.H.; Zhu, X.; Dunkerley, D.; Henley, B.J. Changing occurrence of crop water surplus or deficit and the impact of irrigation: An analysis highlighting consequences for rice production in Bangladesh. Agric. Water Manag. 2022, 269, 107695. [Google Scholar] [CrossRef]
  28. Piticar, A.; Mihăilă, D.; Lazurca, L.G.; Bistricean, P.-I.; Puţuntică, A.; Briciu, A.-E. Spatiotemporal distribution of reference evapotranspiration in the Republic of Moldova. Theor. Appl. Climatol. 2015, 124, 1133–1144. [Google Scholar] [CrossRef]
  29. Katerji, N.; Rana, G.; Ferrara, R.M. Actual evapotranspiration for a reference crop within measured and future changing climate periods in the Mediterranean region. Theor. Appl. Climatol. 2016, 129, 923–938. [Google Scholar] [CrossRef]
  30. Zhou, H.; Jin, P.; Xia, W.; Lei, G. Spatial-temporal characteristics of water surplus and deficit for the main crops in Naoli River Basin of Sanjiang Plain, China. Trans. Chin. Soc. Agric. Eng. 2020, 36, 159–166. [Google Scholar]
  31. Ji, L.; Duan, K. What is the main driving force of hydrological cycle variations in the semiarid and semi-humid Weihe River Basin, China? Sci. Total Environ. 2019, 684, 254–264. [Google Scholar] [CrossRef]
  32. Zhang, Y.; Zhang, B.; Ma, B.; Yao, R.; Wang, L. Evaluation of the water conservation capacity of the Weihe River Basin based on the Integrated Valuation of Ecosystem Services and Tradeoffs model. Ecohydrology 2022, 15. [Google Scholar] [CrossRef]
  33. Zhao, A.; Zhu, X.; Liu, X.; Pan, Y.; Zuo, D. Impacts of land use change and climate variability on green and blue water resources in the Weihe River Basin of northwest China. Catena 2016, 137, 318–327. [Google Scholar] [CrossRef]
  34. Chang, J.; Wang, Y.; Istanbulluoglu, E.; Bai, T.; Huang, Q.; Yang, D.; Huang, S. Impact of climate change and human activities on runoff in the Weihe River Basin, China. Quat. Int. 2015, 380–381, 169–179. [Google Scholar] [CrossRef]
  35. Mohajane, M.; Costache, R.; Karimi, F.; Bao Pham, Q.; Essahlaoui, A.; Nguyen, H.; Laneve, G.; Oudija, F. Application of remote sensing and machine learning algorithms for forest fire mapping in a Mediterranean area. Ecol. Indic. 2021, 129, 107869. [Google Scholar] [CrossRef]
  36. Kutlug Sahin, E. Ismail Colkesen Performance analysis of advanced decision treebased ensemble learning algorithms for landslide susceptibility mapping. Geocarto Int. 2021, 36, 1253–1275. [Google Scholar] [CrossRef]
  37. Allen, R.G.; Pereira, L.S.; Raes, D.; Smith, M. Crop Evapotranspiration–Guidelines for Computing Crop Water Requirements; FAO Irrigation and Drainage Paper 56 1998; FAO: Rome, Italy, 1998. [Google Scholar]
  38. Budyko, M.I. Climate and Life; Academic Press: New York, NY, USA, 1974. [Google Scholar]
  39. Yang, D.; Sun, F.; Liu, Z.; Cong, Z.; Ni, G.; Lei, Z. Analyzing spatial and temporal variability of annual water-energy balance in nonhumid regions of China using the Budyko hypothesis. Water Resour. Res. 2007, 43, W04426. [Google Scholar] [CrossRef]
  40. Gao, X.; Sun, M.; Zhao, Q.; Wu, P.; Zhao, X.; Pan, W.; Wang, Y. Actual ET modelling based on the Budyko framework and the sustainability of vegetation water use in the loess plateau. Sci. Total Environ. 2016, 579, 1550–1559. [Google Scholar] [CrossRef] [PubMed]
  41. Liu, W.; Zhang, Y. Spatiotemporal Changes of sc-PDSI and Its Dynamic Drivers in Yellow River Basin. Atmosphere 2022, 13, 399. [Google Scholar] [CrossRef]
  42. Compo, C.T.G.P. A practical guide to wavelet analysis. Bull. Am. Meteorol. Soc. 1998, 79, 61–78. [Google Scholar]
  43. Pielke, R.A.; Pitman, A.; Niyogi, D.; Mahmood, R.; McAlpine, C.; Hossain, F.; Goldewijk, K.K.; Nair, U.; Betts, R.; Fall, S.; et al. Land use/land cover changes and climate: Modeling analysis and observational evidence. WIREs Clim. Chang. 2011, 2, 828–850. [Google Scholar] [CrossRef]
  44. Guiyu Yang, H.W. Analysis of the Interaction between Grain Production and Irrigation Agriculture Development in the Wei River Basin. China Water Resour. 2015, 4, 56–59. [Google Scholar]
  45. Jin, J.; Miller, N.L. Regional simulations to quantify land use change and irrigation impacts on hydroclimate in the California Central Valley. Theor. Appl. Climatol. 2010, 104, 429–442. [Google Scholar] [CrossRef]
  46. Kueppers, L.M.; Snyder, M.A.; Sloan, L.C. Irrigation cooling effect: Regional climate forcing by land-use change. Geophys. Res. Lett. 2007, 34, L03703. [Google Scholar] [CrossRef]
  47. Lobell, D.; Bala, G.; Mirin, A.; Phillips, T.; Maxwell, R.; Rotman, D. Regional Differences in the Influence of Irrigation on Climate. J. Clim. 2009, 22, 2248–2255. [Google Scholar] [CrossRef]
  48. Sen, O.L.; Bozkurt, D.; Vogler, J.B.; Fox, J.; Giambelluca, T.W.; Ziegler, A.D. Hydro-climatic effects of future land-cover/land-use change in montane mainland southeast Asia. Clim. Chang. 2012, 118, 213–226. [Google Scholar] [CrossRef]
  49. Adegoke, J.O.; Pielke, R.A.; Eastman, J.; Mahmood, R.; Hubbard, K.G. Impact of irrigation on midsummer surface fluxes and temperature under dry synoptic conditions A regional atmospheric model study of the U.S. high plains. Mon. Weather Rev. 2003, 131, 556–564. [Google Scholar] [CrossRef]
  50. Haddeland, I.; Lettenmaier, D.P.; Skaugen, T. Effects of irrigation on the water and energy balances of the Colorado and Mekong river basins. J. Hydrol. 2006, 324, 210–223. [Google Scholar] [CrossRef]
  51. Lobell, D.B.; Bonfils, C. The Effect of Irrigation on Regional Temperatures: A Spatial and Temporal Analysis of Trends in California, 1934–2002. J. Clim. 2008, 21, 2063–2071. [Google Scholar] [CrossRef]
  52. Ozdogan, M.; Rodell, M.; Beaudoing, H.K.; Toll, D.L. Simulating the Effects of Irrigation over the United States in a Land Surface Model Based on Satellite-Derived Agricultural Data. J. Hydrometeorol. 2010, 11, 171–184. [Google Scholar] [CrossRef]
  53. Sorooshian, S.; Li, J.; Hsu, K.-l.; Gao, X. How significant is the impact of irrigation on the local hydroclimate in California’s Central Valley? Comparison of model results with ground and remote-sensing data. J. Geophys. Res. 2011, 116, D06102. [Google Scholar] [CrossRef]
  54. Shah, H.L.; Zhou, T.; Huang, M.; Mishra, V. Strong Influence of Irrigation on Water Budget and Land Surface Temperature in Indian Subcontinental River Basins. J. Geophys. Res. Atmos. 2019, 124, 1449–1462. [Google Scholar] [CrossRef]
  55. Leng, G.; Huang, M.; Tang, Q.; Sacks, W.J.; Lei, H.; Leung, L.R. Modeling the effects of irrigation on land surface fluxes and states over the conterminous United States: Sensitivity to input data and model parameters. J. Geophys. Res. Atmos. 2013, 118, 9789–9803. [Google Scholar] [CrossRef]
  56. Bohn, T.J.; Vivoni, E.R. Process-based characterization of evapotranspiration sources over the North American monsoon region. Water Resour. Res. 2016, 52, 358–384. [Google Scholar] [CrossRef]
  57. Kumar, R.; Mishra, V.; Buzan, J.; Kumar, R.; Shindell, D.; Huber, M. Dominant control of agriculture and irrigation on urban heat island in India. Sci. Rep. 2017, 7, 14054. [Google Scholar] [CrossRef]
  58. Pei, L.; Moore, N.; Zhong, S.; Kendall, A.D.; Gao, Z.; Hyndman, D.W. Effects of Irrigation on Summer Precipitation over the United States. J. Clim. 2016, 29, 3541–3558. [Google Scholar] [CrossRef]
Figure 1. Flowchart of the study.
Atmosphere 15 00339 g001
Figure 2. Location of the study area.
Atmosphere 15 00339 g002
Figure 3. Interannual variations in (a) P and (b) ET0 (The dashed line represents a linear trend line).
Atmosphere 15 00339 g003aAtmosphere 15 00339 g003b
Figure 4. Variation in average annual water deficit in the Weihe river from 1961 to 2013. The equations in the figure are scattered linear fitting equations. (The dashed line represents a linear trend line).
Atmosphere 15 00339 g004aAtmosphere 15 00339 g004b
Figure 5. Spatial variation in water deficit in the WRB.
Atmosphere 15 00339 g005
Figure 6. The spatial variation trend of the water deficit in different seasons in the WRB. (Figures (ad) represent spring, summer, autumn, and winter, respectively).
Atmosphere 15 00339 g006aAtmosphere 15 00339 g006b
Figure 7. Plots of the distributions of the average annual water deficit, P, and ET0 in Beiluo River (a,d,g), mainstream of Weihe River (b,e,h), and Jinghe River (c,f,i) during 1954–2013. Each line represents a station (different colors represent different meteorological stations).
Atmosphere 15 00339 g007
Figure 8. Partial correlation analysis between water deficit, ET0, and P (the vertical axis is the square of the correlation coefficient, and the horizontal axis is the month).
Atmosphere 15 00339 g008
Figure 9. Analysis of spatial correlation between water deficit and meteorological factors.
Atmosphere 15 00339 g009aAtmosphere 15 00339 g009b
Figure 10. Cross-wavelet transform (left) and wavelet coherence (right) between the annual water deficit and climate indices (The thick black contour designates the 90% confidence level and the black thin line in figure said wavelet cone of influence where edge effects, ←denote change of antiphase, → denote change of antiphase, ↑ denote phase advance 90°, ↓ denote phase lag behind 90°. Color code denote cross wavelet transform period).
Atmosphere 15 00339 g010aAtmosphere 15 00339 g010b
Figure 11. Effective irrigation (a) and actual irrigation (b) area in Shaanxi Province from 2001 to 2020.
Atmosphere 15 00339 g011
Figure 12. Effective irrigation (a) and actual irrigation (b) area in Gansu Province from 2001 to 2020.
Atmosphere 15 00339 g012
Figure 13. Effective irrigation (a) and actual irrigation (b) area in Ningxia Province from 2001 to 2020.
Atmosphere 15 00339 g013
Figure 14. Changes in runoff at Linjia Village Station during the periods of 1959–1990 and 1990–2006.
Atmosphere 15 00339 g014
Figure 15. Changes in P in the Wei River Basin during the periods of 1959–1990 and 1990–2013.
Atmosphere 15 00339 g015
Figure 16. ET0 changes in the Wei River Basin during the periods of 1959–1990 and 1990–2013.
Atmosphere 15 00339 g016
Table 1. Kurtosis coefficients and skewness coefficients of meteorological stations.
BasinStationP
Skewness
Coefficient
P
Kurtosis
Coefficient
ET0
Skewness
Coefficient
ET0
Kurtosis
Coefficient
Beiluo River
basin
Dingbian0.83−0.670.05−1.53
Wuqi0.91−0.490.05−1.62
Yan’an0.89−0.440.19−1.56
Luochuan0.82−0.440.21−1.58
MainstreamYuzhong0.74−0.43−0.04−1.25
Ankang0.15−1.51−0.06−0.82
Minxian0.20−1.66−0.16−0.58
Linzhao0.50−1.10−0.16−1.14
Huajialing0.51−1.100.19−0.84
Tianshui0.20−1.61−0.04−1.08
Xi’an0.21−1.210.19−0.89
Huaxian0.46−0.720.27−0.33
Huining0.62−0.810.06−1.11
Haiyuan0.39−1.170.06−0.92
Xiji0.68−0.760.04−1.08
Tongchuan0.65−0.650.13−0.64
Baoji0.33−1.300.17−0.95
Wugong0.35−1.220.37−1.11
Jinghe River
basin
Huanxian0.81−0.440.09−1.05
Guyuan0.81−0.410.07−0.90
Pingliang0.71−0.630.07−0.74
Xifengdao0.68−0.690.14−0.85
Changwu0.56−0.980.12−0.98
Disclaimer/Publisher’s Note: The statements, opinions and data contained in all publications are solely those of the individual author(s) and contributor(s) and not of MDPI and/or the editor(s). MDPI and/or the editor(s) disclaim responsibility for any injury to people or property resulting from any ideas, methods, instructions or products referred to in the content.

